Economic Indicators - Israel Trade Commission, Sydney, Australia
Economic Indicators - Israel Trade Commission, Sydney, Australia
Economic Indicators - Israel Trade Commission, Sydney, Australia

Create successful ePaper yourself
Turn your PDF publications into a flip-book with our unique Google optimized e-Paper software.
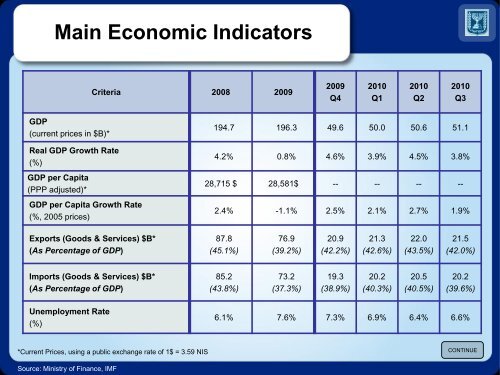
Main <strong>Economic</strong> <strong>Indicators</strong><br />
Criteria<br />
2008<br />
2009<br />
2009<br />
Q4<br />
2010<br />
Q1<br />
2010<br />
Q2<br />
2010<br />
Q3<br />
GDP<br />
(current prices in $B)*<br />
194.7<br />
196.3<br />
49.6<br />
50.0<br />
50.6<br />
51.1<br />
Real GDP Growth Rate<br />
(%)<br />
4.2%<br />
0.8%<br />
4.6%<br />
3.9%<br />
4.5%<br />
3.8%<br />
GDP per Capita<br />
(PPP adjusted)*<br />
28,715 $<br />
28,581$<br />
--<br />
--<br />
--<br />
--<br />
GDP per Capita Growth Rate<br />
(%, 2005 prices)<br />
2.4%<br />
-1.1%<br />
2.5%<br />
2.1%<br />
2.7%<br />
1.9%<br />
Exports (Goods & Services) $B*<br />
(As Percentage of GDP)<br />
87.8<br />
(45.1%)<br />
76.9<br />
(39.2%)<br />
20.9<br />
(42.2%)<br />
21.3<br />
(42.6%)<br />
22.0<br />
(43.5%)<br />
21.5<br />
(42.0%)<br />
Imports (Goods & Services) $B*<br />
(As Percentage of GDP)<br />
85.2<br />
(43.8%)<br />
73.2<br />
(37.3%)<br />
19.3<br />
(38.9%)<br />
20.2<br />
(40.3%)<br />
20.5<br />
(40.5%)<br />
20.2<br />
(39.6%)<br />
Unemployment Rate<br />
(%)<br />
6.1%<br />
7.6%<br />
7.3%<br />
6.9%<br />
6.4%<br />
6.6%<br />
*Current Prices, using a public exchange rate of 1$ = 3.59 NIS<br />
CONTINUE<br />
Source: Ministry of Finance, IMF