PDF file - Israel Trade Commission
PDF file - Israel Trade Commission
PDF file - Israel Trade Commission

Create successful ePaper yourself
Turn your PDF publications into a flip-book with our unique Google optimized e-Paper software.
Agriculture 2011<br />
In order to test the possibility of using satellite imagery<br />
for day-to-day irrigation decision making, the suggested<br />
GIS module combines data from satellite imagery<br />
and local weather stations. The Moderate Resolution<br />
Imaging Spectroradiometer (MODIS) is used with its Red<br />
and Near-Infrared 250-m pixel and surface temperature<br />
1000-m products. The latter is scaled-down to 250-m<br />
(Hassen et al 2007). Weather stations are used for<br />
calibration while the other weather station is utilized<br />
for verification. The spatial variability of the GIS product<br />
is tested on cotton and tomatoe crops and in natural<br />
forests.<br />
The research goals were (2009 season):<br />
1. To test the variability among temperature calculated<br />
from weather stations and mapped by temperature<br />
integrating surface temperature imagery, Red and<br />
Near-Infrared images and weather station data.<br />
2. To test the variability among GDD calculated by<br />
weather stations and GDD mapped by surface<br />
temperature imagery.<br />
3. To build a GIS module for agriculture monitoring by<br />
satellite imagery and weather stations.<br />
The research results were:<br />
Remote sensing temperature (Surface), was well<br />
correlated to temperatures calculated from weather<br />
stations (Air at 2m).<br />
We found variability of GDD between growing fields based<br />
on GDD mapped by surface temperature imagery.<br />
We have built remote sensing and GIS models for<br />
agriculture monitoring by satellite imagery and weather<br />
stations.<br />
Summary:<br />
We have built a low cost remote sensing model enabling<br />
precise field-scale irrigation amount and timing<br />
calculation.<br />
This model can be used to improve and make other<br />
agricultural models more precise, such as<br />
insect growth models (IPM), harvest<br />
timing etc…anywhere around the<br />
globe.<br />
In 2010, we improved our<br />
model with the integration<br />
of other satellite data (higher<br />
spatial resolution), and checked<br />
it with more crops and needs.<br />
For more details please contact<br />
as at info@agam-ag.com<br />
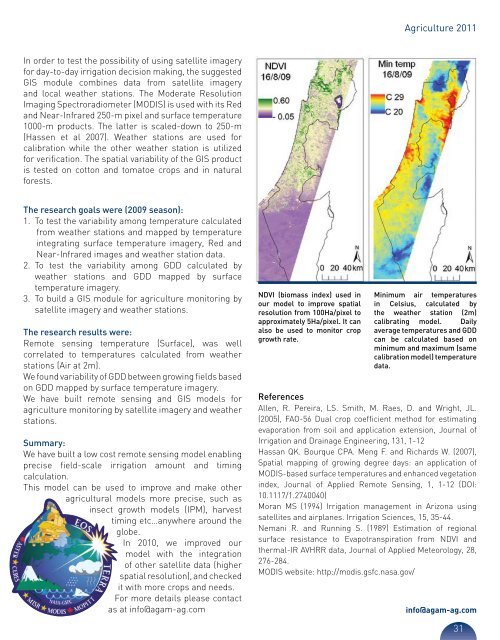
NDVI (biomass index) used in<br />
our model to improve spatial<br />
resolution from 100Ha/pixel to<br />
approximately 5Ha/pixel. It can<br />
also be used to monitor crop<br />
growth rate.<br />
Minimum air temperatures<br />
in Celsius, calculated by<br />
the weather station (2m)<br />
calibrating model. Daily<br />
average temperatures and GDD<br />
can be calculated based on<br />
minimum and maximum (same<br />
calibration model) temperature<br />
data.<br />
References<br />
Allen, R. Pereira, LS. Smith, M. Raes, D. and Wright, JL.<br />
(2005), FAO-56 Dual crop coefficient method for estimating<br />
evaporation from soil and application extension, Journal of<br />
Irrigation and Drainage Engineering, 131, 1-12<br />
Hassan QK. Bourque CPA. Meng F. and Richards W. (2007),<br />
Spatial mapping of growing degree days: an application of<br />
MODIS-based surface temperatures and enhanced vegetation<br />
index, Journal of Applied Remote Sensing, 1, 1-12 (DOI:<br />
10.1117/1.2740040)<br />
Moran MS (1994) Irrigation management in Arizona using<br />
satellites and airplanes. Irrigation Sciences, 15, 35-44.<br />
Nemani R. and Running S. (1989) Estimation of regional<br />
surface resistance to Evapotranspiration from NDVI and<br />
thermal-IR AVHRR data, Journal of Applied Meteorology, 28,<br />
276-284.<br />
MODIS website: http://modis.gsfc.nasa.gov/<br />
info@agam-ag.com<br />
31