Caledonian Ward Profile - Islington Council
Caledonian Ward Profile - Islington Council
Caledonian Ward Profile - Islington Council

You also want an ePaper? Increase the reach of your titles
YUMPU automatically turns print PDFs into web optimized ePapers that Google loves.
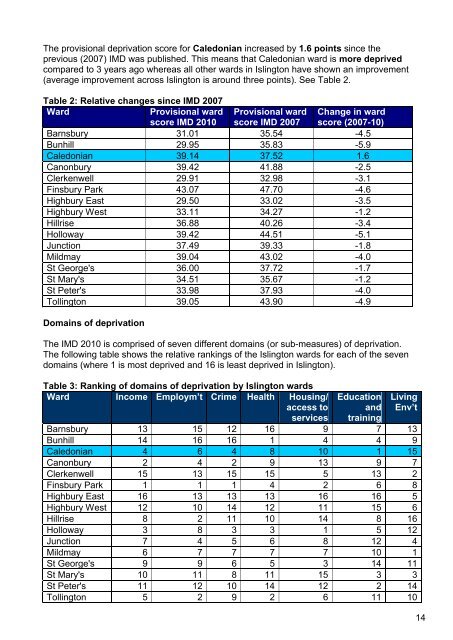
The provisional deprivation score for <strong>Caledonian</strong> increased by 1.6 points since the<br />
previous (2007) IMD was published. This means that <strong>Caledonian</strong> ward is more deprived<br />
compared to 3 years ago whereas all other wards in <strong>Islington</strong> have shown an improvement<br />
(average improvement across <strong>Islington</strong> is around three points). See Table 2.<br />
Table 2: Relative changes since IMD 2007<br />
<strong>Ward</strong><br />
Provisional ward<br />
score IMD 2010<br />
Provisional ward<br />
score IMD 2007<br />
Change in ward<br />
score (2007-10)<br />
Barnsbury 31.01 35.54 -4.5<br />
Bunhill 29.95 35.83 -5.9<br />
<strong>Caledonian</strong> 39.14 37.52 1.6<br />
Canonbury 39.42 41.88 -2.5<br />
Clerkenwell 29.91 32.98 -3.1<br />
Finsbury Park 43.07 47.70 -4.6<br />
Highbury East 29.50 33.02 -3.5<br />
Highbury West 33.11 34.27 -1.2<br />
Hillrise 36.88 40.26 -3.4<br />
Holloway 39.42 44.51 -5.1<br />
Junction 37.49 39.33 -1.8<br />
Mildmay 39.04 43.02 -4.0<br />
St George's 36.00 37.72 -1.7<br />
St Mary's 34.51 35.67 -1.2<br />
St Peter's 33.98 37.93 -4.0<br />
Tollington 39.05 43.90 -4.9<br />
Domains of deprivation<br />
The IMD 2010 is comprised of seven different domains (or sub-measures) of deprivation.<br />
The following table shows the relative rankings of the <strong>Islington</strong> wards for each of the seven<br />
domains (where 1 is most deprived and 16 is least deprived in <strong>Islington</strong>).<br />
Table 3: Ranking of domains of deprivation by <strong>Islington</strong> wards<br />
<strong>Ward</strong> Income Employm’t Crime Health Housing/<br />
access to<br />
services<br />
Education<br />
and<br />
training<br />
Living<br />
Env’t<br />
Barnsbury 13 15 12 16 9 7 13<br />
Bunhill 14 16 16 1 4 4 9<br />
<strong>Caledonian</strong> 4 6 4 8 10 1 15<br />
Canonbury 2 4 2 9 13 9 7<br />
Clerkenwell 15 13 15 15 5 13 2<br />
Finsbury Park 1 1 1 4 2 6 8<br />
Highbury East 16 13 13 13 16 16 5<br />
Highbury West 12 10 14 12 11 15 6<br />
Hillrise 8 2 11 10 14 8 16<br />
Holloway 3 8 3 3 1 5 12<br />
Junction 7 4 5 6 8 12 4<br />
Mildmay 6 7 7 7 7 10 1<br />
St George's 9 9 6 5 3 14 11<br />
St Mary's 10 11 8 11 15 3 3<br />
St Peter's 11 12 10 14 12 2 14<br />
Tollington 5 2 9 2 6 11 10<br />
14