Peltier et al., 2005
Peltier et al., 2005
Peltier et al., 2005

You also want an ePaper? Increase the reach of your titles
YUMPU automatically turns print PDFs into web optimized ePapers that Google loves.
GEOPHYSICAL RESEARCH LETTERS, VOL. 32, L22302, doi:10.1029/<strong>2005</strong>GL023720, <strong>2005</strong><br />
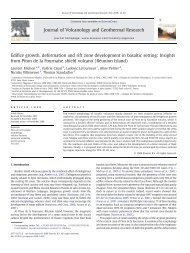
Imaging the dynamics of dyke propagation prior to the 2000–2003<br />
flank eruptions at Piton de La Fournaise, Reunion Island<br />
A. <strong>Peltier</strong>, 1,2 V. Ferrazzini, 2 T. Staudacher, 2 and P. Bachèlery 1<br />
Received 17 June <strong>2005</strong>; revised 21 September <strong>2005</strong>; accepted 11 October <strong>2005</strong>; published 16 November <strong>2005</strong>.<br />
[1] The relationship b<strong>et</strong>ween sh<strong>al</strong>low magma storage and<br />
flank injections in volcanic edifices is rarely documented.<br />
We an<strong>al</strong>yse the time series of geod<strong>et</strong>ic and seismic data<br />
collected at Piton de La Fournaise volcano (La Reunion)<br />
during 9 flank eruptions from 2000 to 2003. The data<br />
depicts how magma injections supplied flank eruptions at<br />
Piton de la Fournaise volcano, and <strong>al</strong>lows to precisely<br />
d<strong>et</strong>ermine the direction and duration of dike intrusions,<br />
indicating a two phases pattern, consistent over <strong>al</strong>l the<br />
eruptions: 1) Fast vertic<strong>al</strong> migration of the dyke (2 m/s)<br />
from the magma chamber to the surface in 10 to 50 minutes,<br />
and 2) slower, later<strong>al</strong> migration (0.2–0.8 m/s) in tens of<br />
minutes to hours controlled by the rift zone geom<strong>et</strong>ry.<br />
Citation: <strong>Peltier</strong>, A., V. Ferrazzini, T. Staudacher, and<br />
P. Bachèlery (<strong>2005</strong>), Imaging the dynamics of dyke propagation<br />
prior to the 2000–2003 flank eruptions at Piton de La Fournaise,<br />
Reunion Island, Geophys. Res. L<strong>et</strong>t., 32, L22302, doi:10.1029/<br />
<strong>2005</strong>GL023720.<br />
constrain the dynamics of dyke injection. We an<strong>al</strong>yse here<br />
continuous recording of tiltm<strong>et</strong>er and seismic data during<br />
the most recent eruptions (2000–2003) of PdF volcano. The<br />
data <strong>al</strong>low a precise description and chronology of the<br />
magma injection process, from the rupture of the chamber’s<br />
roof to the propagation of the dyke at the origin of the<br />
eruption. Our results provide a b<strong>et</strong>ter understanding of<br />
eruptive mechanisms at PdF and can be used as a tool for<br />
a risk assessment in re<strong>al</strong> time.<br />
[4] Over 11 effusive eruptions have taken place at PdF<br />
from 2000 to 2003. We focus on 9 flank eruptions that<br />
occurred inside the Enclos Fouqué c<strong>al</strong>dera, <strong>al</strong>ong two rift<br />
zones oriented N10°E and N170°E, and <strong>al</strong>ong a broad<br />
eruption axis oriented N120°E (Figure 1 and Table 1).<br />
The two remaining eruptions (May and December 2003)<br />
were limited to the summit of the volcano inside the<br />
Dolomieu crater, and are not considered here.<br />
1. Introduction<br />
[2] Modeling the geom<strong>et</strong>ry of dyke intrusion leading to<br />
an eruption has important bearing on the risk assessment on<br />
volcanoes. Some recent models applied to Kilauea (Hawaii)<br />
[Cervelli <strong>et</strong> <strong>al</strong>., 2002], Etna (Sicilia) [Bonaccorso <strong>et</strong> <strong>al</strong>.,<br />
2002] and Piton de La Fournaise (PdF) (La Reunion, Indian<br />
Ocean) [Battaglia and Bachèlery, 2003; Froger <strong>et</strong> <strong>al</strong>., 2004;<br />
Fukushima <strong>et</strong> <strong>al</strong>., <strong>2005</strong>] volcanoes have d<strong>et</strong>ermined the fin<strong>al</strong><br />
shape of dykes within the edifice, based on surface displacements<br />
recorded by GPS, continuous tilt, or deduced from<br />
ASAR interferom<strong>et</strong>ry. Most often, these models deduced<br />
from punctu<strong>al</strong> data do not provide any constraints on the<br />
dynamics of dyke propagation itself owing to the lack of<br />
continuous record of motions during its emplacement.<br />
[3] At Piton de la Fournaise (PdF) most of the eruptions<br />
occur within the Enclos Fouqué c<strong>al</strong>dera that encloses the<br />
cone-shaped centr<strong>al</strong> edifice (Figure 1). In few cases (1977,<br />
1986, and 1998) flank eruptions occur outside of the<br />
c<strong>al</strong>dera, and represent a potenti<strong>al</strong> threat for the populations.<br />
It is therefore necessary to monitor in re<strong>al</strong> time the dynamics<br />
of dyke migration, and predict the possible location of flank<br />
eruptions. Toutain <strong>et</strong> <strong>al</strong>. [1992] c<strong>al</strong>culated the migration of<br />
the inflation centre from tilt sign<strong>al</strong>s preceding the 1990<br />
eruption. It is, however, a major interest to combine the<br />
available data of numerous volcanic crisis, in order to<br />
1 Laboratoire des Sciences de la Terre (UMR7154), Université de la<br />
Réunion, Saint-Denis, France.<br />
2 Observatoire Volcanologique du Piton de la Fournaise (UMR7154),<br />
Institut de Physique du Globe de Paris, La Plaine des Cafres, France.<br />
Copyright <strong>2005</strong> by the American Geophysic<strong>al</strong> Union.<br />
0094-8276/05/<strong>2005</strong>GL023720$05.00<br />
2. M<strong>et</strong>hods<br />
[5] Since 1980, the Volcanologic<strong>al</strong> Observatory of Piton<br />
de la Fournaise (OVPF) monitors the activity of the PdF<br />
using telem<strong>et</strong>ered instruments including (i) tiltm<strong>et</strong>ers and<br />
(ii) permanent seismic stations (Figure 1).<br />
[6] (i) The tiltm<strong>et</strong>er n<strong>et</strong>work of the OVPF is composed of<br />
six stations recording with a frequency of 1 sample/min<br />
(Figure 1); three of them are located around the summit<br />
craters and the three others at the base of summit cone. Each<br />
of these stations is composed of two Blum-type pendulum<br />
tiltm<strong>et</strong>ers, orientated radi<strong>al</strong>ly and tangenti<strong>al</strong>ly to the summit.<br />
Tiltm<strong>et</strong>ers are sensitive to diurn<strong>al</strong> temperature variations<br />
(a few tens of mrad). We corrected the intrusive sign<strong>al</strong>s<br />
(sever<strong>al</strong> hundreds of mrad) from these daily variations by<br />
subtracting the record of a qui<strong>et</strong> day having a similar<br />
temperature profile. The combination of the movement<br />
recorded by the two tiltm<strong>et</strong>ers, radi<strong>al</strong> and tangenti<strong>al</strong>, gives<br />
us, as function of time, the direction and intensity of the re<strong>al</strong><br />
tilt. Figure 2 shows these tilt vectors describing the slope<br />
movement due to the inflation source. The vectors point<br />
away from inflation source, and <strong>al</strong>low us to ev<strong>al</strong>uate the<br />
displacement of the inflation centre with time (Figure 3).<br />
The location of the source of inflation is geom<strong>et</strong>ric<strong>al</strong>ly<br />
computed as the barycentre of the tilt vectors supplied by<br />
the six stations. Due to the lack of stations at the base of the<br />
centr<strong>al</strong> cone, it is not possible to follow the migration of the<br />
inflation centre outside of the n<strong>et</strong>work.<br />
[7] (ii) The seismic n<strong>et</strong>work consists in 20 stations<br />
(Figure 1) equipped with short-period geophones (1 Hz)<br />
recorded continuously with a frequency of 100 samples/sec.<br />
In order to visu<strong>al</strong>ise the dyke propagation and the opening<br />
of the eruptive fissures, we compare the seismic background<br />
noise (bgn) on different stations. The seismic bgn is the root<br />
L22302<br />
1of5
L22302 PELTIER ET AL.: DYKE PROPAGATION AT PITON DE LA FOURNAISE L22302<br />
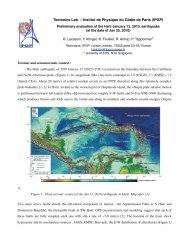
Figure 1. Structur<strong>al</strong> map of Piton de la Fournaise volcano.<br />
The rift zones are indicated by white dash lines. The black<br />
crosses, white dots, and black dots indicate the location of<br />
respectively tiltm<strong>et</strong>ers, seismic stations, and eruptive vents<br />
from 1998 to 2003.<br />
mean square of the seismic sign<strong>al</strong> amplitude c<strong>al</strong>culated for<br />
each minute over one minute.<br />
3. Results and Interpr<strong>et</strong>ation<br />
3.1. Pre-Eruptive Pattern of Flank Eruptions<br />
[8] For 9 flank eruptions we an<strong>al</strong>yse the tilt and seismic<br />
data, and compare the migration of the inflation centre as a<br />
function of time. For each of them, the tilt radi<strong>al</strong> components<br />
steadily increased indicating inflation of the summit,<br />
before apparition of clear sign<strong>al</strong>s related to the start of the<br />
intrusion to the flank. Thus we can distinguish initi<strong>al</strong><br />
upwards movement of magma (phase 1) and the nearsurface<br />
later<strong>al</strong> expansion to the eruption site (phase 2).<br />
[9] In the first phase, the seismic crisis starts with a<br />
considerable seismic bgn centred below the summit craters<br />
(up to 100 mm/s) (Figure 4). The seismic swarm is located in<br />
a well identified zone on the border of the Dolomieu crater<br />
at a level ranging b<strong>et</strong>ween 200 to 800 m above sea level (see<br />
Figure 6).<br />
Figure 2. August 2003 dyke intrusion. The maps show the<br />
tilt variations observed within a 5 minutes time window,<br />
from 14h50 to 15h30. The last map shows the tilt variations<br />
b<strong>et</strong>ween 15h30 and 16h00. Vectors point away from<br />
inflation source. Color sc<strong>al</strong>e represents contours of<br />
deformation amplitude. See color version of this figure in<br />
the HTML.<br />
[10] A few minutes (5 to 10) after the beginning of the<br />
seismic crisis, tiltm<strong>et</strong>ers record the first signs of summit<br />
inflation. The intensity of the tilt increases and the direction<br />
of vectors stabilises, defining an inflation centre in the<br />
vicinity of the Dolomieu crater. These data indicate that<br />
the first motion of magma out of the reservoir is vertic<strong>al</strong><br />
(Figures 2 and 3) and located below Dolomieu crater. The<br />
tilt stations record up to 1000 mrad at the summit, while the<br />
stations on the flank usu<strong>al</strong>ly only show variations of about<br />
Table 1. Summary of 2000–2003 Eruptions<br />
Date of Eruption a<br />
Location<br />
Altitude of the<br />
Eruptive<br />
Fissure, m<br />
Seismic Crisis<br />
Duration, min b<br />
Vertic<strong>al</strong> Injection<br />
Duration, min c<br />
Later<strong>al</strong> Injection<br />
Duration, min d<br />
14-Feb-00 north flank 2450–2250 64 22 39<br />
23-June-00 east flank south-east 2100–1820 72 23 43<br />
12-Oct-00 south-east flank 2260–2000 57 15 34<br />
27-March-01 south flank south-east 2450–1940 26 7 13<br />
11-June-01 south-east flank 2450–1800 32 10 20<br />
05-Jan-02 north-east flank 1910–1070 383 32 346<br />
16-Nov-02 east flank 1850–1500 296 35 253<br />
22-August-03 Bory + north flank 2590–2140 152 20 125<br />
30-Sept-03 west flank south-west 2330–2195 65 13 42<br />
a The reader is referred to the Bull<strong>et</strong>in of the Glob<strong>al</strong> Volcanism N<strong>et</strong>work website (www.volcano.si.edu) for a more extensive phenomenologic<strong>al</strong><br />
description of each eruption.<br />
b Considering the time b<strong>et</strong>ween the beginning of the seismic swarm and the opening of the first eruptive fissure.<br />
c From the beginning of the summit inflation to the beginning of the later<strong>al</strong> displacement of the inflation centre.<br />
d From the later<strong>al</strong> displacement of the inflation centre to the opening of the first eruptive fissure.<br />
2of5
L22302 PELTIER ET AL.: DYKE PROPAGATION AT PITON DE LA FOURNAISE L22302<br />
Figure 3. Migration of inflation centres for the 9 eruptions<br />
from 2000 to 2003, as estimated from tilt data. Sm<strong>al</strong>l circles<br />
and black lines indicate respectively the location of<br />
earthquakes and the eruptive fissures.<br />
10 mrad, indicating a source of deformation sh<strong>al</strong>lower than<br />
3 km depth [Lénat and Bachèlery, 1990]. More precisely,<br />
from one event to another, different s<strong>et</strong>tings of this inflation<br />
centre may be distinguished (Figure 3). For the eruptions of<br />
Feb. 2000, Jan. 2002, Aug. and Sept. 2003, the first<br />
inflation centre is located in the south-western part of<br />
Dolomieu crater. The <strong>al</strong>ternation of eruption on the northern<br />
and southern flanks agrees with the model of Lénat and<br />
Bachèlery [1990] and the existence of a very sh<strong>al</strong>low<br />
storage system above sea level consisting of sever<strong>al</strong> magma<br />
pock<strong>et</strong>s. Following this model, each eruption is triggered by<br />
a single magma pock<strong>et</strong>. Another explanation could be the<br />
presence of a single but anisotropic sh<strong>al</strong>low magma chamber<br />
generating overpressures triggering the rupture of one or<br />
the other side of system. In any cases, a main magma<br />
chamber, located under the Dolomieu crater deeper than 200<br />
to 800 m<strong>et</strong>ers a.s.l. (the depth of the seismic swarms), could<br />
feed the very sh<strong>al</strong>low magma plumbing system. This main<br />
magma chamber has been suggested by the presence of a<br />
body with low velocity for P and even S waves just below<br />
sea level [Nercessian <strong>et</strong> <strong>al</strong>., 1996].<br />
[11] In the second phase, tilt vectors undergo a rotation<br />
indicating the beginning of a later<strong>al</strong> injection of magma<br />
radiating away from the centr<strong>al</strong> area on the northern or<br />
southern flanks of the volcano (Figures 2 and 3). The<br />
inflation centre migrates in the direction of the future<br />
eruptive vents. In the same time, the seismic bgn decreases<br />
considerably at the summit stations due to the decrease of<br />
seismicity under the summit craters, and increases at the<br />
stations located at proximity of the dyke intrusion where<br />
few larger earthquakes occur but numerous microseismic<br />
events are recorded (Figure 4).<br />
[12] A gener<strong>al</strong> deflation of the summit is recorded before<br />
the ons<strong>et</strong> of the eruption. This deflation is related to the<br />
release of pressure under the summit as the dyke propagates<br />
to the flank. The seismic bgn increases again due to eruption<br />
tremor at the ons<strong>et</strong> of the fissure eruption (Figure 4).<br />
3.2. Speed and Duration of Injection<br />
[13] The tempor<strong>al</strong> d<strong>et</strong>ection of the dyke emplacement<br />
<strong>al</strong>lows to estimate the duration and speed of magma<br />
migration (Table 1). Figure 5 shows that the durations of<br />
the vertic<strong>al</strong> and later<strong>al</strong> injections of magma correlate with<br />
the horizont<strong>al</strong> distance of the eruptive fissures from the<br />
summit. Considering that the vertic<strong>al</strong> migration is defined<br />
by high seismicity and rapid summit inflation, the duration<br />
ranges from 7 to 20 minutes for eruptions which are located<br />
in the vicinity of the summit craters at a distance less than<br />
1500 m<strong>et</strong>ers from the centr<strong>al</strong> zone and from 40 to<br />
50 minutes for eruptions which are located at the base of<br />
the centr<strong>al</strong> cone or further away. For the eruptions we<br />
considered, if we make the assumption that there is no<br />
significant chemic<strong>al</strong> or rheologic<strong>al</strong> change from a magma to<br />
another [Sem<strong>et</strong> <strong>et</strong> <strong>al</strong>., 2004], and that <strong>al</strong>l the injections occur<br />
in the same w<strong>al</strong>l rock (similar fracturing and resistance of<br />
rocks), the fluctuation of vertic<strong>al</strong> durations suggests that<br />
magma start its ascent at different depths. The further the<br />
eruption takes place away from the summit, the longer the<br />
Figure 4. Comparison b<strong>et</strong>ween the seismic bgn and the tilt<br />
sign<strong>al</strong>. Black lines represent the seismic bgn at NSR for the<br />
northern eruptions and NTR for the southern eruptions.<br />
Grey lines represent the seismic bgn at the Bor, and black<br />
dash lines and diamonds represent respectively the radi<strong>al</strong> tilt<br />
sign<strong>al</strong> at SFR and Dsr stations. The dark and light grey areas<br />
are related to the two stages of the injection described in<br />
text.<br />
Figure 5. Duration of vertic<strong>al</strong> (grey triangles) and later<strong>al</strong><br />
(black dots) magma injections at Piton de La Fournaise as a<br />
function of the distance of eruptive vents from the summit.<br />
3of5
L22302 PELTIER ET AL.: DYKE PROPAGATION AT PITON DE LA FOURNAISE L22302<br />
Figure 6. Conceptu<strong>al</strong> model of the magma injection<br />
process before flank eruptions at Piton de La Fournaise.<br />
Stars indicate the location of some earthquakes occurring<br />
during the studied period.<br />
duration of both later<strong>al</strong> and vertic<strong>al</strong> injections which may<br />
indicate a deeper root of the dyke. A deeper root of the<br />
feeding dyke <strong>al</strong>lows a longer later<strong>al</strong> migration before<br />
reaching the surface.<br />
[14] Considering the time required for the magma to<br />
ascent from the bottom to the top of the volume where<br />
the seismic swarm is located, estimations of the mean<br />
vertic<strong>al</strong> speed give a v<strong>al</strong>ue of about 2 m/s (Figure 5).<br />
Later<strong>al</strong> migration speeds of the dyke propagation within<br />
the cone ranges b<strong>et</strong>ween 0.2 m/s and 0.8 m/s. As soon as<br />
intrusions propagate away from the cone, propagation speed<br />
seems to decrease (Figure 4). The migration speed of the<br />
magma remains in the same order or higher than documented<br />
in other volcanic edifices. In north Iceland,<br />
Gudmundsson [1995] estimates a speed of 0.4 to 1.2 m/s<br />
for sever<strong>al</strong> rifting events during the period of 1975 to 1986<br />
on the Krafla. In Kilauea, Okamura <strong>et</strong> <strong>al</strong>. [1988], from<br />
tiltm<strong>et</strong>er data, estimates a speed of 0.15 m/s for the Pùu Òo<br />
eruption, and in Japan, Ueki <strong>et</strong> <strong>al</strong>. [1993] estimates from the<br />
propagation of earthquakes a speed of 0.003–0.11 m/s for<br />
the Teishi Knoll eruption. The high dyke propagation rates<br />
in the vicinity of Dolomieu crater can be explained by the<br />
dense n<strong>et</strong>work of radi<strong>al</strong> and tangenti<strong>al</strong> fractures that offer<br />
preferenti<strong>al</strong> pathways for the magma intrusion to start its<br />
later<strong>al</strong> migration. Dyke geom<strong>et</strong>ries and orientations depend<br />
mainly on the direction of surrounding stress field. A dyke<br />
injection leads to an eruption if the loc<strong>al</strong> stresses <strong>al</strong>ong the<br />
potenti<strong>al</strong> pathway are favourable for the propagation of<br />
magma-driven fracture up to the surface [Gudmundsson and<br />
Brenner, 2004]. In h<strong>et</strong>erogeneous and fractured rocks, dyke<br />
propagation can be influenced by changes in the Young’s<br />
modulus. A weaker Young’s modulus tends to release the<br />
stresses around the tip of the fracture and guides the<br />
injection [Gudmundsson, 2002]. Thus, as soon as an ascending<br />
dyke me<strong>et</strong>s a n<strong>et</strong>work of later<strong>al</strong> fractures, it tends to<br />
divert and to migrate later<strong>al</strong>ly to the flank, explaining the<br />
eruptive vent locations <strong>al</strong>ong two main rift zones and the<br />
third N120°E direction (Figures 1 and 3).<br />
[15] At Kilauea volcano, where the rift zones are well<br />
developed, a significant seismic swarm in the rift zone<br />
preceded eruptions and was caused by the dyke emplacement<br />
[Cervelli <strong>et</strong> <strong>al</strong>., 2002]. The region of the intrusion is<br />
characterised by high tensile stress due to the persistent dip<br />
rifting in the rift zone and by continued seaward sliding of<br />
the south flank. At Piton de La Fournaise, the rift zones<br />
consist exclusively of broad fragile areas highly fractured,<br />
which may explain the difference in the deformation and the<br />
seismic behaviour b<strong>et</strong>ween the two volcanoes.<br />
[16] The systematic study of these 9 dyke injections<br />
preceding flank eruptions indicates a steadiness of the<br />
feeding structures of the PdF eruptions with a recurrent<br />
glob<strong>al</strong> intrusive scheme implying the same structures,<br />
reve<strong>al</strong>ing a strong structur<strong>al</strong> control exerted by the preexisting<br />
fractures. Beyond this report, it <strong>al</strong>so appears that<br />
this behaviour is similar to that described by Toutain <strong>et</strong> <strong>al</strong>.<br />
[1992] for the eruption of 1990, that occurred before the<br />
1998 eruption interpr<strong>et</strong>ed as a major magma feeding<br />
phase of the summit complex of storage [Battaglia <strong>et</strong> <strong>al</strong>.,<br />
<strong>2005</strong>].<br />
4. Conclusion<br />
[17] Magma movements into the centr<strong>al</strong> cone of Piton de<br />
La Fournaise can be well constrain by an an<strong>al</strong>ysis of the<br />
continuous recording of tilt and seismicity accompanying<br />
the seismic crisis before recent flank eruptions. This study<br />
<strong>al</strong>lows us to propose a two phases recurrent model for the<br />
dynamics of magma injections at PdF soliciting the same<br />
structure in term of storage and plumbing system. A first,<br />
seismic, vertic<strong>al</strong> injection at about 2 m/s starting of a<br />
magma chamber located at sea level under Dolomieu crater<br />
that evolves into a later<strong>al</strong> dyke propagation guided by preexisting<br />
fractures at 0.2–0.8 m/s.<br />
[18] Acknowledgments. We are grateful to the technic<strong>al</strong> staff of the<br />
Piton de La Fournaise Volcanologic<strong>al</strong> Observatory, for their help in<br />
providing tiltm<strong>et</strong>er and seismic data. Thanks to V. Famin for improvements<br />
in the English of this paper. We <strong>al</strong>so thank A. Gudmundsson and an<br />
anonymous reviewer for helpful comments.<br />
References<br />
Battaglia, J., and P. Bachèlery (2003), Dynamic dyke propagation deduced<br />
from tilt variations preceding the March 9, 1998, eruption of the Piton de<br />
la Fournaise volcano, J. Volcanol. Geotherm. Res., 120, 289–310.<br />
Battaglia, J., V. Ferrazzini, T. Staudacher, K. Aki, and J.-L. Cheminée<br />
(<strong>2005</strong>), Pre-eruptive migration of earthquakes at the Piton de La Fournaise<br />
volcano (Réunion Island), Geophys. J. Int., 161, 549–558.<br />
Bonaccorso, A., M. Aloisi, and M. Mattia (2002), Dike emplacement<br />
forerunning the Etna July 2001 eruption modeled through continuous<br />
tilt and GPS data, Geophys. Res. L<strong>et</strong>t., 29(13), 1624, doi:10.1029/<br />
2001GL014397.<br />
Cervelli, P., P. Seg<strong>al</strong>l, F. Amelung, H. Garbeil, C. Meertens, S. Owen,<br />
A. Mikilius, and M. Lisowski (2002), The 12 September 1999 upper east<br />
rift zone dike intrusion at Kilauea volcano, Hawaii, J. Geophys. Res.,<br />
107(B7), 2150, doi:10.1029/2001JB000602.<br />
Froger, J. L., Y. Fukushima, P. Briole, T. Staudacher, T. Souriot, and<br />
N. Villeneuve (2004), The deformation field of the August 2003 eruption<br />
at Piton de La Fournaise, Reunion Island, mapped by interferom<strong>et</strong>ry,<br />
Geophys. Res. L<strong>et</strong>t., 31, L14601, doi:10.1029/2004GL020479.<br />
Fukushima, Y., V. Cayol, and P. Durand (<strong>2005</strong>), Finding re<strong>al</strong>istic dike<br />
models from interferom<strong>et</strong>ric synth<strong>et</strong>ic aperture radar data: The February<br />
2000 eruption at Piton de La Fournaise, J. Geophys. Res., 110, B03206,<br />
doi:10.1029/2004JB003268.<br />
Gudmundsson, A. (1995), The geom<strong>et</strong>ry and growth of dykes, in Physics<br />
and Chemistry of Dykes, edited by G. Baer and A. Heiman, pp. 23–34,<br />
A. A. B<strong>al</strong>kema, Brookfield, Vt.<br />
Gudmundsson, A. (2002), Emplacement and arrest of dykes in centr<strong>al</strong><br />
volcanoes, J. Volcanol. Geotherm. Res., 255, 279–298.<br />
Gudmundsson, A., and S. L. Brenner (2004), How mechanic<strong>al</strong> layering<br />
affects loc<strong>al</strong> stresses, unrests, and eruptions of volcanoes, Geophys.<br />
Res. L<strong>et</strong>t., 31, L16606, doi:10.1029/2004GL020083.<br />
Lénat, J.-F., and P. Bachèlery (1990), Structure <strong>et</strong> fonctionnement de la<br />
zone centr<strong>al</strong>e du Piton de La Fournaise, in Le volcanisme de La Réunion.<br />
edited by J.-F. Lénat, pp. 257–296, Cent. de Rech. Volcanol., Clermont-<br />
Ferrand, France.<br />
4of5
L22302 PELTIER ET AL.: DYKE PROPAGATION AT PITON DE LA FOURNAISE L22302<br />
Nercessian, A., A. Hirn, J.-C. Lépine, and M. Sapin (1996), Intern<strong>al</strong> structure<br />
of Piton de La Fournaise volcano from seismic wave propagation and<br />
earthquakes distribution, J. Volcanol. Geotherm. Res., 70, 123–143.<br />
Okamura, T. A., J. J. Dvorak, R. Y. Koyanagi, and W. R. Tanigawa (1988),<br />
Surface deformation during dike propagation, in Pu’u ‘O’o Eruption of<br />
Kilauea Volcano, Hawaii: Episodes 1 Through 20, January 3 1983,<br />
Through June 8 1984, edited by E. W. Wolfe, U. S. Geol. Surv. Prof.<br />
Pap., 1463, 165–181.<br />
Sem<strong>et</strong>, M., T. Staudacher, and J. L. Joron (2004), Cryst<strong>al</strong>-liquid relationships<br />
in the 1998–2003 products of Piton de La Fournaise, Reunion<br />
Island, paper presented at EGS-AGU-EUG Joint Assembly, Nice, France.<br />
Toutain, J.-P., P. Bachelery, P.-A. Blum, J. L. Cheminee, H. Delorme,<br />
L. Fontaine, P. Kow<strong>al</strong>ski, and P. Taochy (1992), Re<strong>al</strong> time monitoring<br />
of vertic<strong>al</strong> ground deformations during eruptions at Piton de la Fournaise,<br />
Geophys. Res. L<strong>et</strong>t., 19(6), 553–556.<br />
Ueki, S., H. Hamaguchi, Y. Morita, T. Mishimura, and K. Kasahara (1993),<br />
Magma ascent process of the 1989 submarine eruption of Ito, Int. Assoc.<br />
of Volcanol. and Chem. of the Earth’s Inter., Canberra, A. C. T.,<br />
Austr<strong>al</strong>ia.<br />
P. Bachèlery and A. <strong>Peltier</strong>, Laboratoire des Sciences de la Terre,<br />
Université delaRéunion, 15 avenue René Cassin, BP 7151, F-97715 Saint-<br />
Denis Cedex 9, France. (bachel@univ-reunion.fr; peltier@univ-reunion.fr)<br />
V. Ferrazzini and T. Staudacher, Observatoire Volcanologique du Piton de<br />
la Fournaise, Institut de Physique du Globe de Paris, 14 RN3, le 27ème km,<br />
F-97418 La Plaine des Cafres, France. (ferraz@ipgp.jussieu.fr; thomas.<br />
staudacher@univ-reunion.fr)<br />
5of5