demarcating coal fire risk areas based on spectral test sequences ...
demarcating coal fire risk areas based on spectral test sequences ...
demarcating coal fire risk areas based on spectral test sequences ...

Create successful ePaper yourself
Turn your PDF publications into a flip-book with our unique Google optimized e-Paper software.
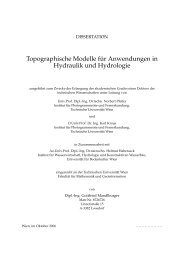
DISSERTATION<br />
DEMARCATING COAL FIRE RISK AREAS BASED ON<br />
SPECTRAL TEST SEQUENCES AND PARTIAL UNMIXING<br />
USING MULTI SENSOR REMOTE SENSING DATA<br />
ausgeführt zum Zwecke der Erlangung des akademischen Grades eines Doktors der<br />
Naturwissenschaften unter der Leitung v<strong>on</strong><br />
Univ. Prof. Dipl. Ing. Dr. Wolfgang Wagner<br />
Institut für Photogrammetrie und Fernerkundung<br />
eingereicht an der Technischen Universität Wien<br />
Fakultät für Technische Mathematik und Vermessung und Geoinformati<strong>on</strong><br />
v<strong>on</strong><br />
Claudia KÜNZER<br />
0227503<br />
Pasinger Str. 37, Planegg D-82152, Deutschland<br />
Wien, am 2005-01-03
- 2 -
Coal Fire Research<br />
Sino-German Research Initiative<br />
German Remote Sensing Data Center (DFD)<br />
German Aerospace Center (DLR)<br />
Postfach 1116<br />
D-82230 Wessling, Germany<br />
http://www.<str<strong>on</strong>g>coal</str<strong>on</strong>g><str<strong>on</strong>g>fire</str<strong>on</strong>g>.caf.dlr.de/intro_en.html<br />
Claudia Künzer<br />
German Remote Sensing Data Center (DFD)<br />
German Aerospace Center (DLR)<br />
Postfach 1116<br />
D-82230 Wessling, Germany<br />
Tel. +49 (0)8153-28-1338<br />
email: claudia.kuenzer@dlr.de<br />
Prof. Dr. Wolfgang Wagner<br />
Vienna University of Technology<br />
Institute of Photogrammetry and Remote Sensing<br />
Gusshausstrasse 27-29/E122<br />
A-1040 Vienna, Austria<br />
Tel. +43 (0) 1-58801-12225<br />
email: ww@ipf.tuwien.ac.at<br />
Prof. Dr. Mathias Schardt<br />
Graz University of Technology<br />
Institute for Remote Sensing and Photogrammetry<br />
Steyrergasse 30<br />
A-8010 Graz, Austria<br />
Tel. +43 (0) 316-873-6330<br />
email: mathias.schardt@tugraz.at<br />
- 3 -
Acknowledgements<br />
This thesis was completed during my first three years working at the German Remote Sensing Data<br />
Center, DFD, of the German Aerospace Center, DLR in Oberpfaffenhofen, Germany. Many scientists,<br />
colleagues and friends have supported this work. Their encouragement, help and critical opini<strong>on</strong>s have<br />
had a great influence <strong>on</strong> the outcome of this thesis. I am grateful to many people. The most important<br />
c<strong>on</strong>tributors I would like to thank here.<br />
In the first place, I would like to thank Prof. Dr. Wolfgang Wagner (Vienna University of Technology,<br />
Institute of Photogrammetry and Remote Sensing, IPF), who was willing to supervise this thesis. I<br />
could always rely <strong>on</strong> him for support with the structure of this work, with technical details or general<br />
questi<strong>on</strong>s. As the former coordinator of the <str<strong>on</strong>g>coal</str<strong>on</strong>g> <str<strong>on</strong>g>fire</str<strong>on</strong>g> remote sensing project he always had a str<strong>on</strong>g<br />
insight and interest in the project. I especially enjoyed the possibility to communicate very openly<br />
about all aspects of completing a PhD next to a full time job. His critical opini<strong>on</strong>, but at the same time<br />
very motivating impulses helped me to stay focused throughout the last two years.<br />
I am grateful to my sec<strong>on</strong>d supervisor Prof. Dr. Mathias Schardt (Graz University of Technology,<br />
Institute of Remote Sensing and Photogrammetry / Joanneum Research) for accepting the coevaluati<strong>on</strong><br />
of this thesis. He c<strong>on</strong>tributed with many fruitful comments <strong>on</strong> topics of data preprocessing<br />
and signature analysis, as well as c<strong>on</strong>cerning the structure of this work.<br />
My sincere thanks go to Dr. Stefan Voigt, (DLR-DFD), project coordinator of the geoscientific Sino-<br />
German <str<strong>on</strong>g>coal</str<strong>on</strong>g> <str<strong>on</strong>g>fire</str<strong>on</strong>g> project. He always shows interest in scientific topics and visi<strong>on</strong>s and he supported<br />
this work through c<strong>on</strong>structive criticism and many discussi<strong>on</strong>s.<br />
Dr. Harald Mehl, (DLR-DFD), head of the unit ‘Envir<strong>on</strong>ment and Geoinformati<strong>on</strong>’ at DFD and my<br />
former team-leader Dr. Günter Strunz, (DLR-DFD), both supported me in a quiet but c<strong>on</strong>sistent way. I<br />
enjoyed a very stable and friendly working atmosphere and always found an open door, when having<br />
organizati<strong>on</strong>al or thematic questi<strong>on</strong>s. Their guidance, c<strong>on</strong>structive criticism and thoughts have always<br />
helped me a lot. Thank you.<br />
I want to deeply thank my friend and former colleague Dr. Jianzh<strong>on</strong>g Zhang, (Leica Beijing), for his<br />
help during the field campaigns in China, for l<strong>on</strong>g scientific and pers<strong>on</strong>al talks and last but not least<br />
for our close friendship, which developed during the three years of sharing an office. I am extremely<br />
thankful for having the chance, to experience the incredible variety of things, when looking at them<br />
from a completely different cultural perspective.<br />
I am also grateful to Andreas Hirner and Anke Tetzlaff for their support and all the joint work during<br />
the last years working in the <str<strong>on</strong>g>coal</str<strong>on</strong>g> <str<strong>on</strong>g>fire</str<strong>on</strong>g> c<strong>on</strong>text at DFD.<br />
Special thanks go to Prof. Dr. Patrick Hostert, (Humboldt University of Berlin), for answering<br />
numerous spectrometry related questi<strong>on</strong>s. He has been <strong>on</strong>e of the pers<strong>on</strong>s during my former time at the<br />
University of Trier, who greatly increased my fascinati<strong>on</strong> for remote sensing related research. I am<br />
furthermore very thankful to Prof. Dr. Joachim Hill – supervisor of my diploma thesis – for making<br />
remote sensing lectures and seminars in Trier finest.<br />
I am grateful to Prof. Dr. Stefan Dech (DFD / University of Würzburg), director of the German<br />
Remote Sensing Data Center, for caring about a friendly, motivated and dynamic atmosphere in his<br />
institute and within the different work units. He has always followed the Sino-German Coal Fire<br />
Research Innitiative with great interest and enthusiasm.<br />
- 4 -
In additi<strong>on</strong>, I would like to express my sincere thanks to:<br />
… Dr. Rolf Richter, (DLR-DFD), for his str<strong>on</strong>g support with questi<strong>on</strong>s <strong>on</strong> radiative transfer, algorithm<br />
design or physics related topics. He always had at least five minutes, sometimes hours to spare and<br />
shared many helpful IDL routines.<br />
… our colleagues Prof. Dr. Horst Rüter (HarbourDom), Dr. Fritz Bandelow, Dr. Hartwig Gielisch,<br />
(DMT), Prof. Dr. Christian Buhrow (TU-BAF), Prof. Uli Krause, Martin Schmidt (BAM) and<br />
Stefan Wessling (GGA) for the good cooperati<strong>on</strong>, answers <strong>on</strong> geophysical questi<strong>on</strong>s and the<br />
willingness to close the gap between remote sensing, field geology and geophysics.<br />
… Dr. Paul van Dijk, (ITC), for his help with geology related subjects and the sharing of his overall<br />
field experience during the fieldwork campaigns in 2002 and 2003.<br />
… Christoph Hecker, (ITC), for his work c<strong>on</strong>tributi<strong>on</strong> during the field campaign in 2003, interesting<br />
scientific discussi<strong>on</strong>s and the very good cooperati<strong>on</strong>.<br />
… my colleague Dr. Andreas Hirner, (DLR-DFD), for the good time during the 2004 field campaign<br />
and technical as well as moral support during the last half year.<br />
… to the Chinese colleagues Yaor<strong>on</strong>g Jia (Wuda mine), Yulin Sun (Wuda mine), K<strong>on</strong>g Bing (BRSC),<br />
Jing Li (BNU), Jiah<strong>on</strong>g Li (NRSCC), Jianwei Ma (BRSC), Xianming Zhang (University of Delft,<br />
Netherlands), Yang Bo (BNU), Wang Xiaopeng (ARSC), and Zhang S<strong>on</strong>gmei (NRSCC) for the<br />
good cooperati<strong>on</strong> and the great support during the various field campaigns.<br />
… Andreas Müller and Martin Habermeyer, (DLR-DFD), for lending the field spectrometer, providing<br />
the spectrometry laboratory and for answering many spectrometry related questi<strong>on</strong>s.<br />
… Gao Yan, (former ITC master student) for her help with ground truth data collecti<strong>on</strong> during the<br />
field campaign in 2002.<br />
… Dr. Anupma Prakash (University of Alaska, Fairbanks) for answering many questi<strong>on</strong>s related to<br />
<str<strong>on</strong>g>coal</str<strong>on</strong>g> <str<strong>on</strong>g>fire</str<strong>on</strong>g>s from a distance and providing ground truth for the Jharia <str<strong>on</strong>g>coal</str<strong>on</strong>g> field.<br />
… Martin Bachmann, (University of Würzburg), for his kind support with the preprocessing of<br />
laboratory and field spectra as well as for forwarding a lot of interesting scientific articles.<br />
… Stefanie Holzwarth, (DLR-DFD), and Andrea Cihlar, (DLR), for the introducti<strong>on</strong> to laboratory<br />
spectroscopy.<br />
… Prof. Eckehart Jäger (University of Halle) for identifying the plant material from Inner M<strong>on</strong>golia.<br />
… my former interns Jens Wunderlich, David Mörth, Manuel Löhnertz, Lena Lieckfeld and Arne<br />
Bergau, who helped with the processing of data and literature collecti<strong>on</strong>.<br />
… Dr. Jörn Hoffmann, Dr. Andreas Hirner, Dr. Stefan Voigt, Dr. Rolf Richter, Tanja Kraus, Dr. Gerd<br />
Rücker and Dr. Michael Schmidt for the proof reading of chapters.<br />
Last but not least, very special thanks to my dear friends Torsten and Petra Riedlinger, Annette<br />
Wentzel, Stefan Schwarzer, Kerstin Kolodzie, Marcus Schneider, Lena Lieckfeld, Susanne Jansen,<br />
David Casey and Angela Porter, as well as my parents for all their general support, the necessary<br />
distracti<strong>on</strong> from work and the great times outside DLR-DFD.<br />
- 5 -
Abstract<br />
Unc<strong>on</strong>trolled <str<strong>on</strong>g>coal</str<strong>on</strong>g> seam <str<strong>on</strong>g>fire</str<strong>on</strong>g>s are a tremendous natural hazard and ec<strong>on</strong>omic disaster occurring in over<br />
15 <str<strong>on</strong>g>coal</str<strong>on</strong>g> producing countries worldwide. In China al<strong>on</strong>e, <str<strong>on</strong>g>coal</str<strong>on</strong>g> <str<strong>on</strong>g>fire</str<strong>on</strong>g> related emissi<strong>on</strong>s of green house<br />
relevant gasses are equivalent to approximately 0.1 %-0.2 % of the annual human induced CO 2 input<br />
into the atmosphere. Toxic gasses released by the <str<strong>on</strong>g>fire</str<strong>on</strong>g>s are a threat to human health. This is<br />
documented by increased lung cancer- and respiratory disease rates in the Chinese <str<strong>on</strong>g>coal</str<strong>on</strong>g> <str<strong>on</strong>g>fire</str<strong>on</strong>g>s regi<strong>on</strong>s.<br />
Furthermore, subsurface <str<strong>on</strong>g>coal</str<strong>on</strong>g> <str<strong>on</strong>g>fire</str<strong>on</strong>g>s, leading to volume loss underground, cause slow as well as sudden<br />
land surface movements and collapses. In additi<strong>on</strong>, in the vicinity of <str<strong>on</strong>g>coal</str<strong>on</strong>g> <str<strong>on</strong>g>fire</str<strong>on</strong>g>s vegetati<strong>on</strong> degradati<strong>on</strong><br />
is comm<strong>on</strong>place.<br />
China faces severe <str<strong>on</strong>g>coal</str<strong>on</strong>g> <str<strong>on</strong>g>fire</str<strong>on</strong>g> problems in over 50 <str<strong>on</strong>g>coal</str<strong>on</strong>g> fields located within China’s <str<strong>on</strong>g>coal</str<strong>on</strong>g> belt, which<br />
stretches over 5000 km from East to West al<strong>on</strong>g the whole northern part of the country. The ec<strong>on</strong>omic<br />
loss of <str<strong>on</strong>g>coal</str<strong>on</strong>g> due to burning <str<strong>on</strong>g>coal</str<strong>on</strong>g> seams in China is estimated to 20-30 Mio. t<strong>on</strong>s per year. This is in the<br />
order of Germany’s current annual producti<strong>on</strong> of hard <str<strong>on</strong>g>coal</str<strong>on</strong>g>. Since many of the <str<strong>on</strong>g>coal</str<strong>on</strong>g> mining regi<strong>on</strong>s<br />
affected by <str<strong>on</strong>g>coal</str<strong>on</strong>g> <str<strong>on</strong>g>fire</str<strong>on</strong>g>s are sparsely populated remote <str<strong>on</strong>g>areas</str<strong>on</strong>g>, satellite remote sensing techniques are a<br />
cost efficient and powerful tool for local, regi<strong>on</strong>al and country-wide investigati<strong>on</strong>s.<br />
This thesis presents a c<strong>on</strong>ceptual approach and two algorithms to automatically demarcate <str<strong>on</strong>g>coal</str<strong>on</strong>g> <str<strong>on</strong>g>fire</str<strong>on</strong>g><br />
<str<strong>on</strong>g>risk</str<strong>on</strong>g> <str<strong>on</strong>g>areas</str<strong>on</strong>g> from Landsat-7 ETM+ and Aster remote sensing satellite data. The focus lies <strong>on</strong><br />
multi<strong>spectral</strong> data analyses to delineate <str<strong>on</strong>g>areas</str<strong>on</strong>g>, where <str<strong>on</strong>g>coal</str<strong>on</strong>g> <str<strong>on</strong>g>fire</str<strong>on</strong>g>s are likely to occur. Such delineated<br />
regi<strong>on</strong>s can support the exclusi<strong>on</strong> of false alarms from thermal anomaly detecti<strong>on</strong>. Furthermore, the<br />
demarcati<strong>on</strong> of <str<strong>on</strong>g>coal</str<strong>on</strong>g> <str<strong>on</strong>g>fire</str<strong>on</strong>g> <str<strong>on</strong>g>risk</str<strong>on</strong>g> <str<strong>on</strong>g>areas</str<strong>on</strong>g> can highlight regi<strong>on</strong>s, which are in danger of <str<strong>on</strong>g>coal</str<strong>on</strong>g> <str<strong>on</strong>g>fire</str<strong>on</strong>g> igniti<strong>on</strong> but<br />
do not show a thermal expressi<strong>on</strong> yet.<br />
Based <strong>on</strong> field observati<strong>on</strong>s and mappings during three fieldwork campaigns in 2002, 2003 and 2004 it<br />
has been found that <str<strong>on</strong>g>coal</str<strong>on</strong>g> <str<strong>on</strong>g>fire</str<strong>on</strong>g> related thermal anomalies are always located adjacent to <str<strong>on</strong>g>coal</str<strong>on</strong>g> exposed to<br />
the surface. These surfaces can be outcropping <str<strong>on</strong>g>coal</str<strong>on</strong>g> seams, <str<strong>on</strong>g>coal</str<strong>on</strong>g> waste piles, <str<strong>on</strong>g>coal</str<strong>on</strong>g> storage piles or<br />
mining portals. Furthermore, <str<strong>on</strong>g>coal</str<strong>on</strong>g> <str<strong>on</strong>g>fire</str<strong>on</strong>g>s lead to the degradati<strong>on</strong> and decay of vegetati<strong>on</strong>. Subsurface<br />
<str<strong>on</strong>g>fire</str<strong>on</strong>g>s are not found underneath densely vegetated soil or bedrock. An additi<strong>on</strong>al phenomen<strong>on</strong> induced<br />
by very hot <str<strong>on</strong>g>coal</str<strong>on</strong>g> <str<strong>on</strong>g>fire</str<strong>on</strong>g>s is the pyrometamorphosis of the surrounding bedrock. If the thermal intensity of<br />
a <str<strong>on</strong>g>fire</str<strong>on</strong>g> is high enough color and texture changes of the adjacent strata can occur. Depending <strong>on</strong> the<br />
spatial extent of this phenomen<strong>on</strong> it can be detected in remote sensing data.<br />
Supported by the automated extracti<strong>on</strong> of three surfaces classes– <str<strong>on</strong>g>coal</str<strong>on</strong>g>, dense vegetati<strong>on</strong> and<br />
pyrometamorphic rock - two algorithms have been developed to automatically demarcate <str<strong>on</strong>g>coal</str<strong>on</strong>g> <str<strong>on</strong>g>fire</str<strong>on</strong>g><br />
<str<strong>on</strong>g>areas</str<strong>on</strong>g> and future <str<strong>on</strong>g>coal</str<strong>on</strong>g> <str<strong>on</strong>g>fire</str<strong>on</strong>g> <str<strong>on</strong>g>risk</str<strong>on</strong>g> <str<strong>on</strong>g>areas</str<strong>on</strong>g>. The first is a knowledge-<str<strong>on</strong>g>based</str<strong>on</strong>g> <strong>spectral</strong> <strong>test</strong> sequence allowing for<br />
the mapping of the surfaces of interest. Coal surfaces are automatically extracted and the area in a<br />
certain radius is delineated, to yield possible <str<strong>on</strong>g>coal</str<strong>on</strong>g> <str<strong>on</strong>g>fire</str<strong>on</strong>g> <str<strong>on</strong>g>risk</str<strong>on</strong>g> <str<strong>on</strong>g>areas</str<strong>on</strong>g>. Within these regi<strong>on</strong>s densely<br />
vegetated <str<strong>on</strong>g>areas</str<strong>on</strong>g> are excluded. Furthermore, pixels of pyrometamorphic rock are highlighted. This<br />
algorithm runs fully automatic without any user interacti<strong>on</strong> necessary.<br />
The sec<strong>on</strong>d approach relies <strong>on</strong> linear partial unmixing techniques. Coal surfaces, vegetated <str<strong>on</strong>g>areas</str<strong>on</strong>g> and<br />
pyrometamorphic regi<strong>on</strong>s are extracted <str<strong>on</strong>g>based</str<strong>on</strong>g> <strong>on</strong> a quantitative subpixel fracti<strong>on</strong> estimati<strong>on</strong>. An<br />
extensive <strong>spectral</strong> database including field and laboratory spectra of over 50 different surface samples<br />
collected during the field campaigns has been set up. This library provides the input reference spectra<br />
- 6 -
for the partial unmixing analyses. Just like the knowledge-<str<strong>on</strong>g>based</str<strong>on</strong>g> <strong>test</strong> sequence, this method proves<br />
stable and solid enough for automati<strong>on</strong>. Therefore, the two algorithms outperform standard surface<br />
extracti<strong>on</strong> and classificati<strong>on</strong> approaches, where interactive input is always mandatory.<br />
Surface extracti<strong>on</strong> and <str<strong>on</strong>g>coal</str<strong>on</strong>g> <str<strong>on</strong>g>fire</str<strong>on</strong>g> area demarcati<strong>on</strong> has been performed for a time series of eight ETM+<br />
and two Aster scenes covering the main study <str<strong>on</strong>g>areas</str<strong>on</strong>g> in China. Furthermore, applicability has been<br />
<strong>test</strong>ed <strong>on</strong> an ETM+ scene covering the area of Baotou, China, located outside the known study<br />
regi<strong>on</strong>s. In additi<strong>on</strong>, transfer has been successfully <strong>test</strong>ed <strong>on</strong> ETM+ scenes for the Jharia- and Rāy <str<strong>on</strong>g>coal</str<strong>on</strong>g><br />
mining regi<strong>on</strong>s in India and the Leigh Creek <str<strong>on</strong>g>coal</str<strong>on</strong>g> mining area in Australia.<br />
From the results of automated <str<strong>on</strong>g>coal</str<strong>on</strong>g> extracti<strong>on</strong> an increase in mining activity in the order of 230 %-<br />
350 % could be obtained for the two main study <str<strong>on</strong>g>areas</str<strong>on</strong>g> in north central China during the past 15 years.<br />
Surface extracti<strong>on</strong> accuracies were validated using an extensive set of over 50 ground truth polyg<strong>on</strong>s<br />
and seven mapped mixture grids. Accuracies ranged between 76 % and 100 % for all surfaces. Good<br />
surface extracti<strong>on</strong> accuracies averaging 91 % have also been calculated for the transfer regi<strong>on</strong>s, where<br />
pyrometamorphic <str<strong>on</strong>g>areas</str<strong>on</strong>g> at a detectable scale did not exist.<br />
Many new <str<strong>on</strong>g>coal</str<strong>on</strong>g> <str<strong>on</strong>g>fire</str<strong>on</strong>g> <str<strong>on</strong>g>risk</str<strong>on</strong>g> <str<strong>on</strong>g>areas</str<strong>on</strong>g> could be delineated next to the already well known <str<strong>on</strong>g>coal</str<strong>on</strong>g> <str<strong>on</strong>g>fire</str<strong>on</strong>g> <str<strong>on</strong>g>areas</str<strong>on</strong>g><br />
located within the two Chinese study regi<strong>on</strong>s. They are presented in detailed maps at a spatial scale of<br />
1:100,000. Within two of these <str<strong>on</strong>g>risk</str<strong>on</strong>g> <str<strong>on</strong>g>areas</str<strong>on</strong>g> formerly unknown <str<strong>on</strong>g>coal</str<strong>on</strong>g> <str<strong>on</strong>g>fire</str<strong>on</strong>g>s could already be detected,<br />
when combining the automated <str<strong>on</strong>g>coal</str<strong>on</strong>g> <str<strong>on</strong>g>fire</str<strong>on</strong>g> area demarcati<strong>on</strong> results and automated thermal anomaly<br />
detecti<strong>on</strong> as developed by ZHANG, J. 2004. These findings have been verified during two field<br />
campaigns in 2003 and 2004. This proves that formerly unknown <str<strong>on</strong>g>coal</str<strong>on</strong>g> <str<strong>on</strong>g>fire</str<strong>on</strong>g>s can be extracted from<br />
remote sensing data exclusively.<br />
The synergy effects of <str<strong>on</strong>g>coal</str<strong>on</strong>g> <str<strong>on</strong>g>fire</str<strong>on</strong>g> area demarcati<strong>on</strong> and <str<strong>on</strong>g>coal</str<strong>on</strong>g> <str<strong>on</strong>g>fire</str<strong>on</strong>g> related thermal anomaly detecti<strong>on</strong> was<br />
furthermore assessed processing six scenes. The findings of the analyses reveal that <str<strong>on</strong>g>coal</str<strong>on</strong>g> <str<strong>on</strong>g>fire</str<strong>on</strong>g> area<br />
demarcati<strong>on</strong> can clearly reduce false alarms resulting from automated thermal anomaly extracti<strong>on</strong>.<br />
Many subtle thermal anomalies picked up from the thermal algorithm are related to industry,<br />
settlement, biomass <str<strong>on</strong>g>fire</str<strong>on</strong>g>s, limest<strong>on</strong>e processing and solar effects. If located outside the delineated <str<strong>on</strong>g>risk</str<strong>on</strong>g><br />
<str<strong>on</strong>g>areas</str<strong>on</strong>g> they have a negligible probability to be <str<strong>on</strong>g>coal</str<strong>on</strong>g> <str<strong>on</strong>g>fire</str<strong>on</strong>g>s. Thermal anomalies for all scenes processed<br />
could be reduced in number and overall area for 50 % <strong>on</strong> average for nighttime data and >80 % for<br />
daytime data. Thus, automated <str<strong>on</strong>g>coal</str<strong>on</strong>g> <str<strong>on</strong>g>fire</str<strong>on</strong>g> (<str<strong>on</strong>g>risk</str<strong>on</strong>g>) area demarcati<strong>on</strong> is a powerful tool to focus thermal<br />
anomaly m<strong>on</strong>itoring to the appropriate and relevant spots.<br />
The results of this thesis prove the applicability of automated large scale <str<strong>on</strong>g>coal</str<strong>on</strong>g> <str<strong>on</strong>g>fire</str<strong>on</strong>g> area demarcati<strong>on</strong><br />
and can support the m<strong>on</strong>itoring of <str<strong>on</strong>g>coal</str<strong>on</strong>g> <str<strong>on</strong>g>fire</str<strong>on</strong>g> <str<strong>on</strong>g>areas</str<strong>on</strong>g> and <str<strong>on</strong>g>risk</str<strong>on</strong>g> <str<strong>on</strong>g>areas</str<strong>on</strong>g> for the whole northern part of China.<br />
- 7 -
Zusammenfassung<br />
Unk<strong>on</strong>trollierte Kohleflözbrände sind eine Naturkatastrophe und ein wirtschaftliche Problem globalen<br />
Ausmaßes. Die Brände existieren weltweit in über 15 Kohle fördernden Ländern und führen nicht nur<br />
zur Vernichtung der wertvollen wirtschaftlichen Ressource, s<strong>on</strong>dern auch zu treibhausrelevanten<br />
Emissi<strong>on</strong>en. Es wird angenommen, dass Kohlebrandemissi<strong>on</strong>en einem Equivalent v<strong>on</strong> 0,1 % bis 0,2 %<br />
der jährlichen anthropogen verursachten CO 2 Emissi<strong>on</strong> entsprechen. Des Weiteren setzen sie toxische<br />
Gase frei, die sich schädlich auf die Gesundheit der Einwohner in den Kohlebrandregi<strong>on</strong>en auswirken.<br />
Durch den Volumenschwund im Untergrund führen die Brände zudem zu langsamer Landabsenkung<br />
sowie Oberflächeneinbrüchen. Des Weiteren kommt es durch die aus Spalten emittierenden toxischen<br />
Gase zu Degradati<strong>on</strong> und Absterben der Vegetati<strong>on</strong> in der unmittelbaren Umgebung.<br />
In China existieren Kohlebrände in über 50 Kohlefeldern, die sich über den nördlichen<br />
Kohleabbaugürtel erstrecken. Dieser Gürtel dehnt sich 5000 km v<strong>on</strong> Osten nach Westen über den<br />
gesamten nördlichen Teil des Landes aus. Der wirtschaftliche Verlust durch Kohlebrände wird in<br />
China auf 20 bis 30 Mio. T<strong>on</strong>nen pro Jahr beziffert. Dies entspricht in etwa der deutschen<br />
Jahresprodukti<strong>on</strong> an Steinkohle. Viele der Kohleabbauregi<strong>on</strong>en befinden sich in entlegenen, nur dünn<br />
besiedelten Gebieten. Daher stellt die Fernerkundung ein kostengünstiges und robustes Werkzeug dar,<br />
um die Brandregi<strong>on</strong>en auf lokalem, regi<strong>on</strong>alem und landesweitem Maßstab zu untersuchen.<br />
Diese Arbeit stellt einen k<strong>on</strong>zeptuellen Ansatz und zwei Algorithmen zur automatisierten Ausweisung<br />
v<strong>on</strong> Kohlebrandgebieten und zukünftigen Risikogebieten basierend auf Landsat-7 ETM+ und Aster<br />
Satellitendaten vor. Der Fokus liegt hierbei auf der Analyse multispektraler Satellitendaten zur<br />
Abgrenzung v<strong>on</strong> Gegenden, in denen Kohlebrände mit hoher Wahrscheinlichkeit auftreten. Solche<br />
ausgewiesenen Bereiche unterstützen die Differenzierung Kohlebrand-bedingter und anderer<br />
Thermalanomalien. Zugleich kann die Ausweisung v<strong>on</strong> Kohlebrand-Risikogebieten die Überwachung<br />
v<strong>on</strong> Regi<strong>on</strong>en unterstützen, die ein hohes Gefährdungspotential für die Entstehung der Brände- aber<br />
noch keine thermalen Anomalien aufweisen.<br />
Während drei Feldarbeitskampagnen in 2002, 2003 und 2004 k<strong>on</strong>nte beobachtet werden, dass<br />
Thermalanomalien v<strong>on</strong> oberflächennahen und unterirdischen Kohlebränden immer in der näheren<br />
Umgebung v<strong>on</strong> Kohle an der Erdoberfläche auftreten. Dies können ausstreichende Kohleflöze,<br />
Kohleabraumhalden, Kohlelagerhalden oder Mineneingänge sein. Des Weiteren führen Kohlebrände<br />
zur Degradierung und dem Absterben v<strong>on</strong> Vegetati<strong>on</strong> in ihrer unmittelbaren Umgebung. Daher sind<br />
unterirdische Kohlebrände nicht unterhalb dicht mit Vegetati<strong>on</strong> bedeckter Böden zu finden. Eine<br />
weitere Auswirkung der Brände ist die Entstehung pyrometamorphen Gesteines. Eine hohe thermale<br />
Intensität des Brandes vorausgesetzt, kommt es zu Farb- und Texturveränderungen des<br />
Umgebungsgesteines. Diese Auswirkungen können in Satellitendaten detektiert werden, wenn diese<br />
Gesteine in entsprechend großen Arealen an der Oberfläche exp<strong>on</strong>iert sind.<br />
Basierend auf diesen Beobachtungen wurden in dieser Arbeit zwei Algorithmen entwickelt, um die<br />
drei Oberflächentypen aus Fernerkundungsdaten zu extrahieren und Kohlebrandgebiete automatisiert<br />
auszuweisen. Bei dem ersten Algorithmus handelt es sich um eine wissensbasierte spektrale<br />
Testsequenz, die die automatisierte Extrakti<strong>on</strong> v<strong>on</strong> Kohle, dichter Vegetati<strong>on</strong> und pyrometamorphem<br />
Gestein ermöglicht. Kohleflächen werden ausgewiesen und ein Bereich in einem bestimmten Radius<br />
wird abgegrenzt. Dieser Radius kann durch den Einfallswinkel der Schichten sowie eine<br />
- 8 -
Tiefenbegrenzung v<strong>on</strong> Kohlebränden definiert werden. Innerhalb des Radius’ werden Gebiete dichter<br />
Vegetati<strong>on</strong> eliminiert und pyrometamorphen Areale hervorgehoben.<br />
Der zweite Ansatz basiert auf linear partieller Entmischung. Kohleflächen, Areale dichter Vegetati<strong>on</strong><br />
und pyrometamophe Bereiche werden mit dieser quantitativen Methode bezüglich ihres prozentualen<br />
Sub-Pixel Anteiles extrahiert. Eine spektrale Datenbank, die aus Labor- und Feldmessungen v<strong>on</strong> über<br />
50 verschiedenen Proben erstellt wurde, dient als Referenzdatenbank für die Entmischung. Wie auch<br />
der wissensbasierte Ansatz ist diese Methode voll automatisierbar. Beide Algorithmen haben daher in<br />
Bezug auf eine großräumige Anwendung einen deutlichen Vorteil gegenüber gängigen überwachten<br />
Klassifikati<strong>on</strong>s- und Extrakti<strong>on</strong>smethoden, bei denen interaktive Schritte und ein deutlicher Einfluss<br />
des Bearbeiters unvermeidbar sind.<br />
Oberflächenextrakti<strong>on</strong> und die Ausweisung v<strong>on</strong> Kohlebrandgebieten wurde für eine acht ETM+<br />
Szenen umfassende Zeitreihe sowie zwei Aster Szenen für die beiden Untersuchungsgebiete in China<br />
vorgenommen. Zusätzlich wurden außerhalb der Untersuchungsgebiete Datensätze für die Gegend<br />
Baotou, in Nord-China sowie für die Jharia- und Rāy Kohleabbaugebiete in Indien und das Leigh<br />
Creek Kohleabbaugebiet in Australien analysiert, um den Transfer der Algorithmen zu dem<strong>on</strong>strieren.<br />
Basierend auf den Ergebnissen automatisierter Kohleextrakti<strong>on</strong> kann ein deutlicher Anstieg der<br />
bergbaulichen Aktivitäten in den beiden chinesischen Untersuchungsgebieten innerhalb der letzten 15<br />
Jahre aufgezeigt werden. Extrakti<strong>on</strong>sgenauigkeiten wurden anhand umfangreicher Kartierungen v<strong>on</strong><br />
über 50 Arealen v<strong>on</strong> Kohle-, Vegetati<strong>on</strong>- und pyrometamophen Gestein sowie dem Vergleich mit<br />
sieben kartierten Mischungs-Rastern berechnet. Die Produzenten Genauigkeiten liegen dabei in den<br />
Untersuchungsgebieten für alle Oberflächen zwischen 76 % und 100 %. In den drei Gebieten, in denen<br />
der Transfer der Algorithmen ge<strong>test</strong>et wurde liegen sie im Mittel bei 91 %.<br />
Neben den bekannten Kohlebrandbereichen in den beiden Untersuchungsgebieten k<strong>on</strong>nten mehrere<br />
neue Kohlebrandgebiete und potentielle Risikogebiete ausgegliedert werden. Diese werden anhand<br />
detaillierter Karten vorgestellt. Innerhalb zwei dieser neu ausgewiesenen Kohlebrandgebiete k<strong>on</strong>nten<br />
mehrere Thermalanomalien detektiert and bereits als vormals unbekannte Kohlebrände im Gelände<br />
verifiziert werden. Dadurch k<strong>on</strong>nte gezeigt werden, dass mit Hilfe der automatisierten Ausweisung<br />
v<strong>on</strong> Kohlebrandgebieten die Detekti<strong>on</strong> unbekannter Kohlebrände in Fernerkundungsdaten möglich ist.<br />
Die Kombinati<strong>on</strong> der Ausweisung v<strong>on</strong> Kohlebrandgebieten und Detekti<strong>on</strong> v<strong>on</strong> Thermalanomalien<br />
wurde anhand v<strong>on</strong> sechs Szenen überprüft. Es k<strong>on</strong>nte gezeigt werden, dass die Ausweisung v<strong>on</strong><br />
Brandgebieten die Zurückweisung fälschlich extrahierter Anomalien, die v<strong>on</strong> Industrie, Siedlungen,<br />
Biomassebränden, Kalkbrennereien oder solaren Einflüssen resultieren, deutlich unterstützt. Sind<br />
Thermalanomalien außerhalb der ausgewiesenen Gebiete lokalisiert, handelt es sich mit hoher<br />
Wahrscheinlichkeit nicht um Kohlebrände. Thermalanomalien k<strong>on</strong>nten hinsichtlich Anzahl und<br />
Gesamtgröße für alle prozessierten Szenen um über 50 % in Nachtszenen und über 80 % in Tagszenen<br />
reduziert werden.<br />
Die Ergebnisse dieser Arbeit zeigen, dass eine großflächige automatisierte Ausweisung v<strong>on</strong><br />
Kohlebrandgebieten und Risikogebieten möglich ist. In Kombinati<strong>on</strong> mir der Auswertung thermaler<br />
Daten können somit rezente Kohlebrandbereiche und potentielle Risikogebiete gezielt mit Methoden<br />
der Fernerkundung überwacht werden.<br />
- 9 -
摘 要<br />
煤 火 作 为 一 种 严 重 的 自 然 灾 害 和 经 济 灾 害 在 世 界 上 的 15 个 产 煤 国 都 有 发 生 。 仅 在 中 国 , 由 煤<br />
火 释 放 出 的 与 温 室 效 应 有 关 的 气 体 就 占 人 类 向 大 气 释 放 二 氧 化 碳 总 量 的 0.1%-0.2%。 煤 火 释 放<br />
的 有 毒 气 体 威 胁 人 类 的 健 康 , 据 记 载 , 在 中 国 煤 火 地 区 , 肺 癌 和 呼 吸 道 疾 病 的 比 例 正 在 升 高 。<br />
进 一 步 地 , 地 下 煤 火 可 产 生 地 下 空 洞 , 从 而 引 起 或 快 或 慢 的 地 表 运 动 和 塌 陷 。 同 时 , 在 煤 火 的<br />
周 边 地 区 , 植 被 退 化 也 经 常 发 生 。<br />
中 国 正 面 对 着 50 多 个 煤 田 火 区 的 严 重 问 题 。 这 些 火 区 位 于 中 国 的 东 西 长 5000 公 里 , 覆 盖 整 个<br />
北 方 地 区 的 产 煤 带 。 在 中 国 , 估 计 每 年 烧 失 煤 炭 2-3 千 万 吨 。 这 相 当 于 德 国 当 前 煤 年 产 量 的 三<br />
分 之 一 。<br />
由 于 受 煤 火 影 响 的 很 多 采 矿 区 都 位 于 人 烟 稀 少 , 人 迹 罕 至 的 地 区 , 所 以 不 论 是 对 工 区 范 围 , 区<br />
域 范 围 , 还 是 对 国 家 范 围 的 火 区 进 行 调 查 , 遥 感 都 可 以 作 为 一 种 经 济 且 有 效 的 工 具 。<br />
本 篇 论 文 介 绍 了 从 Landsat-7 ETM+ 和 Aster 遥 感 数 据 上 自 动 圈 划 煤 火 危 险 区 的 理 论 方 法 和 两 种<br />
算 法 。 着 重 讨 论 通 过 多 光 谱 数 据 分 析 技 术 来 勾 划 煤 火 可 能 发 生 的 区 域 。 这 些 勾 划 出 的 可 能 发 生<br />
煤 火 的 区 域 可 以 用 来 支 持 排 除 从 热 异 常 探 测 中 得 到 的 噪 音 。<br />
基 于 在 2002,2003 和 2004 年 的 三 次 野 外 观 测 和 制 图 , 我 们 发 现 与 煤 火 有 关 的 热 异 常 总 是 发 生<br />
在 一 种 地 表 信 息 — 煤 体 的 周 围 。 这 些 煤 体 包 括 煤 层 露 头 , 煤 矸 石 堆 , 煤 堆 , 或 矿 井 口 。 进 一 步<br />
地 , 煤 火 可 引 起 植 被 的 退 化 和 坏 死 。 在 拥 有 茂 密 植 被 的 土 壤 和 基 岩 下 , 一 般 没 有 煤 火 。 煤 火 产<br />
生 的 另 一 现 象 就 是 围 岩 的 热 变 质 。 如 果 火 的 强 度 足 够 大 , 围 岩 的 颜 色 和 结 构 都 会 发 生 变 化 。 这<br />
种 现 象 是 否 能 被 遥 感 影 像 探 测 到 则 取 决 于 它 的 空 间 分 布 范 围 。<br />
基 于 对 以 下 三 种 地 表 信 息 的 提 取 — 煤 , 茂 密 的 植 被 和 烧 变 岩 — 两 种 算 法 被 开 发 出 来 用 以 自 动 勾<br />
划 煤 火 区 域 和 将 来 有 可 能 发 生 煤 火 的 区 域 。 第 一 种 算 法 是 一 个 基 于 知 识 的 光 谱 测 试 序 列 分 析 ,<br />
它 能 对 所 需 的 地 表 信 息 进 行 制 图 。 煤 体 被 自 动 提 取 出 来 , 同 时 与 之 有 一 定 距 离 的 区 域 也 被 勾 划<br />
出 来 , 以 此 来 产 生 可 能 发 生 煤 火 的 危 险 区 。 在 这 些 区 域 中 , 拥 有 茂 密 植 被 的 地 区 被 排 除 在 外 。<br />
进 一 步 地 , 拥 有 烧 变 岩 的 像 元 被 强 调 。 这 一 算 法 完 全 自 动 运 行 , 没 有 任 何 的 用 户 介 入 。<br />
第 二 种 方 法 基 于 线 性 亚 像 元 分 解 技 术 。 这 是 通 过 一 种 定 量 的 亚 像 元 比 例 估 计 方 法 , 来 提 取 煤<br />
体 , 植 被 区 和 烧 变 区 。 首 先 建 立 一 个 大 容 量 的 光 谱 数 据 库 , 它 包 含 50 多 种 采 自 野 外 的 不 同 的<br />
地 表 样 品 的 野 外 和 实 验 室 的 光 谱 数 据 。 这 一 数 据 库 为 亚 像 元 分 解 分 析 提 供 了 输 入 参 考 光 谱 。 同<br />
基 于 知 识 的 光 谱 测 试 序 列 分 析 一 样 , 这 一 方 法 结 果 稳 定 , 足 以 自 动 实 现 。 因 此 , 这 两 种 方 法 大<br />
大 优 于 传 统 的 地 表 信 息 提 取 方 法 和 分 类 方 法 , 因 为 在 传 统 的 分 类 方 法 中 , 人 机 交 互 式 的 输 入 是<br />
必 不 可 少 的 。<br />
- 10 -
首 先 , 在 中 国 的 主 要 研 究 区 内 , 地 表 信 息 提 取 和 煤 火 区 域 勾 划 方 法 被 应 用 到 不 同 时 相 的 八 景<br />
ETM+ 和 两 景 Aster 影 像 上 。 接 着 , 使 用 一 景 位 于 已 知 区 外 的 , 覆 盖 中 国 包 头 的 ETM+ , 测 试<br />
了 方 法 的 应 用 能 力 。 最 后 , 通 过 对 覆 盖 印 度 Jharia 及 Rāy 煤 矿 和 澳 大 利 亚 Leigh Creek 煤 矿 的<br />
ETM+ 影 像 上 的 测 试 成 功 , 证 实 了 该 方 法 的 通 用 性 。<br />
从 自 动 煤 体 提 取 的 结 果 中 可 以 看 出 , 在 中 国 北 部 的 两 个 主 要 研 究 区 , 采 矿 活 动 的 增 长 超 过<br />
230 %-350 %。 地 表 信 息 提 取 的 精 度 是 通 过 超 过 50 个 的 地 面 验 证 多 边 形 和 7 个 混 合 栅 格 区 域 制<br />
图 来 验 证 的 。 对 所 有 地 表 信 息 类 型 来 说 , 精 度 介 于 76 % and 100 % 。 在 印 度 和 澳 大 利 亚 的 矿<br />
区 , 不 存 在 能 探 测 得 到 的 烧 变 区 , 地 表 信 息 提 取 的 精 度 据 计 算 可 好 到 平 均 为 91 % 。<br />
在 中 国 的 两 个 研 究 区 内 , 新 提 取 出 的 很 多 煤 火 危 险 区 都 与 已 知 的 煤 火 区 紧 密 相 连 。 他 们 在 详 细<br />
的 空 间 比 例 尺 为 1:100000 的 图 件 上 有 很 好 的 呈 现 。 在 这 些 煤 火 危 险 区 中 , 得 知 有 两 个 含 有 未<br />
知 煤 火 , 这 是 通 过 叠 加 自 动 煤 火 区 域 圈 划 的 结 果 和 张 建 中 于 2004 年 开 发 的 自 动 热 异 常 探 测 的<br />
结 果 来 实 现 的 。 这 些 新 发 现 的 煤 火 在 两 次 野 外 验 证 中 被 证 实 。 这 说 明 只 用 遥 感 数 据 就 可 以 探 测<br />
未 知 煤 火 。<br />
通 过 处 理 6 景 的 影 像 , 融 合 煤 火 区 域 的 圈 划 结 果 和 煤 火 热 异 常 探 测 结 果 的 效 果 得 到 了 进 一 步 的<br />
评 价 。 结 果 显 示 , 煤 火 区 域 圈 划 能 有 效 地 去 除 自 动 热 异 常 提 取 中 产 生 的 噪 音 。 从 热 算 法 中 提 取<br />
出 的 很 多 小 的 热 异 常 是 来 自 于 工 业 , 居 民 区 , 生 物 火 源 , 石 灰 厂 和 太 阳 的 影 响 。 如 果 他 们 位 于<br />
危 险 区 外 , 他 们 是 煤 火 的 可 能 性 就 很 小 。 所 有 景 的 热 异 常 可 以 在 数 目 上 平 均 减 少 50 %-80 %。<br />
因 此 , 自 动 的 火 区 圈 划 对 正 确 的 煤 火 监 测 是 一 个 有 力 的 工 具 。<br />
本 论 文 的 结 果 证 明 , 遥 感 大 面 积 的 煤 火 区 域 圈 划 是 可 行 的 , 同 时 他 能 支 持 对 整 个 中 国 北 方 地 区<br />
的 火 区 及 危 险 区 的 监 测 。<br />
- 11 -
List of C<strong>on</strong>tents<br />
1. Introducti<strong>on</strong> .................................................................................................................................- 30 -<br />
1.1. Coal Fires................................................................................................................................- 30 -<br />
1.2. Remote Sensing of Coal Fires: Brief Status of Research .......................................................- 31 -<br />
1.3. Research Objectives ...............................................................................................................- 34 -<br />
1.4. Thesis Outline.........................................................................................................................- 36 -<br />
2. The Study Areas: Wuda, Ruqigou / Gulaben and Envir<strong>on</strong>mental Coal Fire Impacts .........- 38 -<br />
2.1. Geographic Locati<strong>on</strong> ..............................................................................................................- 38 -<br />
2.2. Geologic and Geomorphologic Characteristics......................................................................- 40 -<br />
2.3. Climatic Characteristics..........................................................................................................- 45 -<br />
2.4. Hydrographic Characteristics .................................................................................................- 46 -<br />
2.5. Soils and Natural Vegetati<strong>on</strong>..................................................................................................- 46 -<br />
2.6. Socio-ec<strong>on</strong>omic Characteristics .............................................................................................- 48 -<br />
2.7. Impact of Coal Mining and Coal Fires ...................................................................................- 50 -<br />
3. Theoretical Background: Image Classificati<strong>on</strong> and Feature Extracti<strong>on</strong>...............................- 53 -<br />
3.1. Feature Space Manipulati<strong>on</strong> Techniques................................................................................- 53 -<br />
3.2. Unsupervised Classificati<strong>on</strong> Algorithms (UCA)....................................................................- 55 -<br />
3.3. Supervised Classificati<strong>on</strong> Algorithms (SCA).........................................................................- 57 -<br />
3.4. C<strong>on</strong>textual or Object Oriented Classificati<strong>on</strong> Approaches (OOC).........................................- 59 -<br />
3.5. Decisi<strong>on</strong> Tree Classifiers and Knowledge Based Methods (DTC) ........................................- 60 -<br />
3.6. Artificial Neural Networks (ANN).........................................................................................- 61 -<br />
3.7. Binary Encoding (BE) ............................................................................................................- 62 -<br />
3.8. Spectral Mixture Analysis (SMA)..........................................................................................- 62 -<br />
3.9. Spectral Angle Mapping (SAM).............................................................................................- 65 -<br />
3.10. Spectral Feature Fitting (SFF) ..............................................................................................- 66 -<br />
3.11. Other Spectral Matching and Classificati<strong>on</strong> Techniques......................................................- 67 -<br />
3.12. Thermal Approaches for Geologic Mapping........................................................................- 68 -<br />
3.13. Change Detecti<strong>on</strong> Studies.....................................................................................................- 69 -<br />
3.14. Assessing Classificati<strong>on</strong> and Surface Extracti<strong>on</strong> Accuracy .................................................- 69 -<br />
4. Data Analyzed..............................................................................................................................- 71 -<br />
4.1. Satellite Data ..........................................................................................................................- 71 -<br />
4.1.1. Landsat-7 ETM+ Data.....................................................................................................- 71 -<br />
4.1.2. Landsat-5 TM Data..........................................................................................................- 73 -<br />
4.1.3. Aster Data........................................................................................................................- 73 -<br />
4.1.4. Quickbird Data ................................................................................................................- 74 -<br />
4.1.5. ERS-2 SAR Data .............................................................................................................- 74 -<br />
4.2. Field- and Laboratory Spectral Measurements.......................................................................- 75 -<br />
4.2.1. Surface Spectra Measured During the Field Campaign ..................................................- 75 -<br />
4.2.2. Laboratory Spectra Measured from Samples Collected During the Fieldwork...............- 76 -<br />
4.3. GIS Data .................................................................................................................................- 78 -<br />
4.3.1. Available GIS Data..........................................................................................................- 78 -<br />
4.3.2. GPS Locati<strong>on</strong>s Measured During the Fieldwork in 2002 and 2003................................- 78 -<br />
4.3.3. Landcover Polyg<strong>on</strong>s Mapped During the 2002 and 2003 Fieldwork..............................- 78 -<br />
4.3.4. Mixture Grids Mapped During the 2002- and 2003 Fieldwork.......................................- 79 -<br />
4.3.5. Coal Fires Mapped During the 2002- 2003 and 2004 Fieldwork....................................- 79 -<br />
4.4. Maps and Descriptive Data.....................................................................................................- 80 -<br />
5. Data Preprocessing: Rectificati<strong>on</strong>, Calibrati<strong>on</strong>, Radiometry..................................................- 81 -<br />
5.1. Geometric Correcti<strong>on</strong>s............................................................................................................- 81 -<br />
5.1.1. Principles of Geometric Distorti<strong>on</strong>s and Applied Correcti<strong>on</strong> Methods...........................- 81 -<br />
5.1.2. Results and Validati<strong>on</strong>.....................................................................................................- 84 -<br />
5.2. Radiometric Correcti<strong>on</strong>s for the Reflective Bands.................................................................- 85 -<br />
- 12 -
5.2.1. Sensor Calibrati<strong>on</strong>...........................................................................................................- 86 -<br />
5.2.2. Atmospheric and Topographic Correcti<strong>on</strong>s ....................................................................- 87 -<br />
5.2.3. Results and Validati<strong>on</strong> ....................................................................................................- 91 -<br />
5.3 Radiometric Correcti<strong>on</strong> of the Thermal Band.........................................................................- 96 -<br />
5.3.1. Principles and Methods Applied .....................................................................................- 96 -<br />
5.3.2. Results and Validati<strong>on</strong> ..................................................................................................- 100 -<br />
6. C<strong>on</strong>ceptual Approach of Coal Fire Area Demarcati<strong>on</strong> .........................................................- 102 -<br />
6.1. Extracti<strong>on</strong> of Coal Surfaces..................................................................................................- 102 -<br />
6.2. Analysis of Vegetati<strong>on</strong> Density............................................................................................- 103 -<br />
6.3. Pyrometamorphic Rocks ......................................................................................................- 105 -<br />
6.4. Automati<strong>on</strong> of the Demarcati<strong>on</strong> Scheme .............................................................................- 106 -<br />
7. Signature Analysis.....................................................................................................................- 110 -<br />
7.1. Fundamentals of Spectral Surface Properties.......................................................................- 110 -<br />
7.2. Signature Analysis of Coal Based <strong>on</strong> Chemical and Physical Properties ............................- 111 -<br />
7.3. Signature Analysis of Vegetati<strong>on</strong>.........................................................................................- 115 -<br />
7.4. Signature Analysis of Pyrometamorphic Rock ....................................................................- 115 -<br />
7.5. Signature Analysis and Spectral Properties of Other Surfaces ............................................- 118 -<br />
7.6. Separability of Surface Spectra and Temporal Spectral Variability ....................................- 119 -<br />
8. Knowledge Based Surface Extracti<strong>on</strong> .....................................................................................- 129 -<br />
8.1. Set Up of the Knowledge Based Test Sequence ..................................................................- 129 -<br />
8.1.1. Automated Extracti<strong>on</strong> of Coal Surfaces........................................................................- 129 -<br />
8.1.2. Automated Extracti<strong>on</strong> of Densely Vegetated Areas......................................................- 135 -<br />
8.1.3. Automated Extracti<strong>on</strong> of Pyrometamorphic Rock ........................................................- 137 -<br />
8.1.4. Transfer of the <strong>test</strong> sequence to the Aster Sensor..........................................................- 140 -<br />
8.2. Results of the Knowledge Based Test Sequence..................................................................- 141 -<br />
8.2.1. Results for the Main Study Areas..................................................................................- 141 -<br />
8.2.2. Results for the Transfer Regi<strong>on</strong>s...................................................................................- 151 -<br />
8.3. Quantificati<strong>on</strong> and Error Analysis of the Test Sequence Results.........................................- 156 -<br />
8.3.1. Quantificati<strong>on</strong> and Error Analysis for the Main Study Areas .......................................- 156 -<br />
8.3.2. Quantificati<strong>on</strong> and Error Analyses of the Transfer Regi<strong>on</strong>s .........................................- 161 -<br />
8.4. Discussi<strong>on</strong> ............................................................................................................................- 164 -<br />
9. Quantitative Surface Extracti<strong>on</strong> applying Partial Unmixing................................................- 167 -<br />
9.1. Method .................................................................................................................................- 167 -<br />
9.1.1. C<strong>on</strong>cept and Mathematical Background .......................................................................- 167 -<br />
9.1.2. Design of Prototype Spectra and Spectral Interpolati<strong>on</strong> ...............................................- 169 -<br />
9.1.3. Analysis of Extreme Pixels ...........................................................................................- 170 -<br />
9.2. Results of the Partial Unmixing Analyses............................................................................- 172 -<br />
9.2.1. Results for the Main Study Areas..................................................................................- 172 -<br />
9.2.2. Results for the Transfer Regi<strong>on</strong>s...................................................................................- 181 -<br />
9.3. Quantificati<strong>on</strong> and Error Analysis of the Partial Unmixing Results ....................................- 184 -<br />
9.3.1. Quantificati<strong>on</strong> and Error Analysis of the Main Study Areas ........................................- 184 -<br />
9.3.2. Quantificati<strong>on</strong> and Error Analysis of the Transfer Regi<strong>on</strong>s..........................................- 188 -<br />
9.4. Discussi<strong>on</strong> ............................................................................................................................- 189 -<br />
10. Coal Fire (Risk) Area Demarcati<strong>on</strong> and Synergy with the Thermal Algorithm ...............- 195 -<br />
10.1. Demarcated Coal Fire Areas and Coal Fire Risk Areas.....................................................- 195 -<br />
10.2. Synergy with the Thermal Algorithm ................................................................................- 209 -<br />
10.3. Discussi<strong>on</strong> ..........................................................................................................................- 216 -<br />
11. C<strong>on</strong>clusi<strong>on</strong>s and Outlook........................................................................................................- 219 -<br />
11.1. C<strong>on</strong>clusi<strong>on</strong>s ........................................................................................................................- 219 -<br />
11.2 Outlook................................................................................................................................- 225 -<br />
12. References ................................................................................................................................- 227 -<br />
- 13 -
List of Figures<br />
Figure 2-1: Small area of pyrometamorphic rock<br />
Figure 2-2: Sulfur minerals above a former <str<strong>on</strong>g>coal</str<strong>on</strong>g> <str<strong>on</strong>g>fire</str<strong>on</strong>g><br />
Figure 2-3: Thick Yellow River deposits – clayy loam<br />
Figure 2-4: Crusting of top soil <strong>on</strong> an alluvial fan<br />
Figure 2-5: Shrubs <strong>on</strong> desert sand<br />
Figure 2-6: Shrubs in a sparsely settled mining area<br />
Figure 2-7: Coal processing factory<br />
Figure 2-8: Coal processing factory<br />
Figure 2-9: Calcite burning near a limest<strong>on</strong>e mine<br />
Figure 2-10: Clay mining<br />
Figure 2-11: Coal mining in Ruqigou<br />
Figure 2-12: Coal infrastructure in Wuda<br />
Figure 2-13: Coal miner in Wuda<br />
Figure 2-14: Housing of a <str<strong>on</strong>g>coal</str<strong>on</strong>g> miner in Wuda<br />
Figure 2-15: Cracked surface due to <str<strong>on</strong>g>coal</str<strong>on</strong>g> <str<strong>on</strong>g>fire</str<strong>on</strong>g>s<br />
Figure 2-16: Coal <str<strong>on</strong>g>fire</str<strong>on</strong>g> in Wuda during daytime<br />
Figure 2-17: Dead vegetati<strong>on</strong> due to <str<strong>on</strong>g>coal</str<strong>on</strong>g> <str<strong>on</strong>g>fire</str<strong>on</strong>g>s<br />
Figure 2-18: Woman wearing a face mask against the gaseous emissi<strong>on</strong>s<br />
Figure 3-1: Ideal (left) and realistic (right) distributi<strong>on</strong> of four classes in a 2-D feature space. In<br />
most remote sensing data sets clusters of thematic classes overlap, complicating<br />
extracti<strong>on</strong><br />
Figure 3-2: Classificati<strong>on</strong> tree with root node (R), internal nodes (Y/N) and terminal nodes (L)<br />
Figure 3-3: Scheme of an Artificial Neural network (ANN) with input layers (I), processing nodes<br />
(P) and output layers (O),<br />
Figure 3-4: Different types of mixed pixels, (FISHER 1997)<br />
Figure 3-5: Principle of linear Spectral Mixture Analysis (SMA).<br />
Figure 3-6: Principle of Spectral Angle Mapping (SAM). Material 1 and 2 can clearly be<br />
distinguished by the angle. In the 2-D feature space to the right, the two ellipsoids<br />
located <strong>on</strong> <strong>on</strong>e vector (no angle difference) will be difficult to distinguish.<br />
Figure 4-1: Locati<strong>on</strong> of the recording points for field <strong>spectral</strong> measurements and surface sample<br />
collecti<strong>on</strong> for later laboratory <strong>spectral</strong> measurements within the broader Wuda study<br />
area. Background: gray scale Landsat image (band 1) acquired during the same week<br />
as spectra- and surface sampling.<br />
Figure 4-2: C<strong>on</strong>cept of the mixing grids mapped during the fieldwork<br />
Figure 5-1: Principle of terrain induced object displacement<br />
Figure 5-2: Orthorectified panchromatic ETM+ band (left) next to ERS-2 amplitude image (right).<br />
Center locati<strong>on</strong>: 573529E, 4818025N, UTM, Z45N<br />
Figure 5-3: Geometric accuracy compared with GPS ground truth before (a) and after (b) the<br />
orthorectificati<strong>on</strong> dem<strong>on</strong>strated <strong>on</strong> a subset of ETM+ scene 129/033, Center locati<strong>on</strong>:<br />
650651E, 4377299N, UTM, Z48N.<br />
Figure 5-4: Radiance comp<strong>on</strong>ents of the signal reaching the sensor (RICHTER 1998, modified)<br />
Figure 5-5: Image input parameters in ATCOR-3 (image bands, DEM, aspect, slope, skyview and<br />
shadow file)<br />
- 14 -
Figure 5-6:<br />
Figure 5-7:<br />
Figure 5-8:<br />
Figure 5-9:<br />
Figure 5-10:<br />
Figure 5-11:<br />
Figure 5-12:<br />
Figure 5-13:<br />
Figure 5-14:<br />
Figure 6-1:<br />
Figure 6-2:<br />
Figure 6-3:<br />
Figure 6-4:<br />
Figure 6-5:<br />
Figure 7-1:<br />
Figure 7-2:<br />
Regressi<strong>on</strong> analysis for 4 calibrati<strong>on</strong> targets inflight calibrating the scene 129/33 of<br />
2000 here shown for bands 1-5.<br />
Visual impressi<strong>on</strong> before (top row) and after (bottom row) the radiometric correcti<strong>on</strong><br />
for a subset of the Landsat-7 ETM+ scene from India (a), Australia (b) and Baotou (c)<br />
used for later transfer purposes. Center locati<strong>on</strong>s: UTM, a: 385657E, 2624616N,<br />
Z45N, b: 256271E, 6655205S Z54S, c: 356912E, 4405175N, Z49N<br />
Quality assessment of the radiometrically corrected scenes <str<strong>on</strong>g>based</str<strong>on</strong>g> <strong>on</strong> the recorded<br />
spectra<br />
Landsat-7 ETM+ spectra of three different surfaces (Yellow River=dark turquoise,<br />
lake water=light turquoise, <str<strong>on</strong>g>coal</str<strong>on</strong>g>=black) before (left) and after (right) the atmospheric<br />
correcti<strong>on</strong>. Band number 6 <strong>on</strong> the x-axis is band 7 (MIR) of the Landsat ETM+ data.<br />
Visual impressi<strong>on</strong> before (a) and after (b) the combined radiometric correcti<strong>on</strong> using<br />
ATCOR-3. Center locati<strong>on</strong>: 642959E, 4360922N, UTM, Z48N<br />
Regressi<strong>on</strong> analysis of the cosine of the illuminati<strong>on</strong> angle versus scene reflectances<br />
before and after the topographic correcti<strong>on</strong> for eight pixels located <strong>on</strong> a sun-facing and<br />
sun opposing limest<strong>on</strong>e ridge in the area around center locati<strong>on</strong> 661553E, 4360919N,<br />
UTM, Z48N<br />
very hot temperatures shift the radiati<strong>on</strong> maximum to the nIR resulting in bright pixel<br />
values not representing an optical phenomen<strong>on</strong>. Locati<strong>on</strong>: 639085E, 4374840N, UTM,<br />
Z48N<br />
Subset of the thermal nighttime scene (ETM+) from 28.09.2002; DNs transferred to<br />
temperature in °C and atmospherically corrected, center locati<strong>on</strong> (right subset):<br />
645646E, 4376164N, UTM, Z48N.<br />
Subset of the thermal daytime scene from 12.02.2003; left: false color infrared image,<br />
right: DNs transferred to temperature in ° C. Light: high temperatures, dark: lower<br />
temperatures (atmospherically corrected with ATCOR-3), center locati<strong>on</strong>: 650695E,<br />
4373295N, UTM, Z48N.<br />
C<strong>on</strong>cept of <str<strong>on</strong>g>demarcating</str<strong>on</strong>g> the area, in which <str<strong>on</strong>g>coal</str<strong>on</strong>g> <str<strong>on</strong>g>fire</str<strong>on</strong>g> related thermal anomalies with<br />
regard to the outcropping <str<strong>on</strong>g>coal</str<strong>on</strong>g> seam can be expected.<br />
a, b: dead vegetati<strong>on</strong> above <str<strong>on</strong>g>coal</str<strong>on</strong>g> <str<strong>on</strong>g>fire</str<strong>on</strong>g> # 8, Wuda syncline. c: heavy smoke, vegetati<strong>on</strong><br />
density 0%, d: slowly degrading vegetati<strong>on</strong> al<strong>on</strong>g a new <str<strong>on</strong>g>fire</str<strong>on</strong>g> fr<strong>on</strong>t.<br />
Kriged vegetati<strong>on</strong> density maps over the three <str<strong>on</strong>g>coal</str<strong>on</strong>g> <str<strong>on</strong>g>fire</str<strong>on</strong>g>s #6, #8 and #12 as mapped in<br />
2002 and the development of vegetati<strong>on</strong> density above <str<strong>on</strong>g>fire</str<strong>on</strong>g> #8 between 2002 and 2003<br />
Pyrometamorphic rocks exposed to the surface in Baijigou <str<strong>on</strong>g>coal</str<strong>on</strong>g> mining area. Photos:<br />
C. Kuenzer, September 2003, Locati<strong>on</strong>: 595837E, 4322295N<br />
Unsupervised classificati<strong>on</strong> into 20 classes, the first (“darkest”) class is colored in<br />
orange <strong>on</strong> superimposed <strong>on</strong> the grey scale classificati<strong>on</strong> result. Coal, shadow, deep<br />
water, water of the Yellow River and even dense agricultural vegetati<strong>on</strong> are all<br />
assigned to <strong>on</strong>e class. Center coordinate: 650705E, 4373287N<br />
a: field spectra and +/- standard deviati<strong>on</strong> (green and red) of pure <str<strong>on</strong>g>coal</str<strong>on</strong>g> (a) and of <str<strong>on</strong>g>coal</str<strong>on</strong>g><br />
waste (b); c: 5 different <str<strong>on</strong>g>coal</str<strong>on</strong>g> laboratory spectra; d: 3 different <str<strong>on</strong>g>coal</str<strong>on</strong>g> waste laboratory<br />
spectra (highest spectrum mixed with <str<strong>on</strong>g>coal</str<strong>on</strong>g> waste dust); a’-d’: c<strong>on</strong>tinuum removed<br />
spectra of a,b,c and d.<br />
a: field spectra of three main desert shrub types, pure; b: field spectra of the three<br />
desert shrubs with soil influence; c: three different sandst<strong>on</strong>e samples of different<br />
- 15 -
locati<strong>on</strong>s measured in the <strong>spectral</strong> laboratory; (from highest to lowest: grey, yellow,<br />
light grey) and a dark red siltst<strong>on</strong>e sample; d: four different desert sand samples of<br />
different locati<strong>on</strong>s measured in the <strong>spectral</strong> laboratory; a’-d’: c<strong>on</strong>tinuum removed<br />
spectra of a-d.<br />
Figure 7-3: a: laboratory spectra of four different grey limest<strong>on</strong>es; b: laboratory spectra of a light<br />
and a dark magmatic and metamorphic rock; c: laboratory spectra of four different<br />
yellowish to dark brown shale-sandst<strong>on</strong>e mixes, the lowest is a shale with very high<br />
organic c<strong>on</strong>tent; d: four laboratory spectra of four yellow to dark red<br />
pyrometamorphic rocks; a’-d’: c<strong>on</strong>tinuum removed spectra of a-d.<br />
Figure 7-4: Radiometrically corrected Landsat-7 ETM+ spectra for different surfaces. 6=MIR,<br />
7=TIR.<br />
Figure 7-5: Spectral profiles over seven ETM+ bands for two spatial profiles: shadow (right,<br />
center locati<strong>on</strong>: 4321784N, 605360E), <str<strong>on</strong>g>coal</str<strong>on</strong>g> (left, center locati<strong>on</strong>: 4323488N, 595692E,<br />
UTM, Z 48N).<br />
Figure 7-6: Spectral profiles over seven Landsat-7 ETM+ bands for two spatial profiles: shadow<br />
(left), <str<strong>on</strong>g>coal</str<strong>on</strong>g> (right), band 6 is the thermal TIR band and therefore is displayed behind<br />
channel 7, which represents the MIR.<br />
Figure 7-7: Temporal <strong>spectral</strong> variability of three surfaces for eight time steps in Ruqigou mining<br />
area<br />
Figure 7-8: Temporal <strong>spectral</strong> variability of four surfaces for eight time steps in Wuda area<br />
Figure 7-9: Spatial <strong>spectral</strong> variability of 3 to 6 surfaces in the transfer regi<strong>on</strong>s Baotou in China,<br />
Jharia in India, and Leigh Creek <str<strong>on</strong>g>coal</str<strong>on</strong>g> mining area in Australia<br />
Figure 8-1: Synthetic <strong>spectral</strong> mean channel over bands 1, 2, 3, 4, 5 and 7 (a); result after the first<br />
<strong>test</strong>: pixels, which passed the <strong>test</strong> are presented in white and include <str<strong>on</strong>g>coal</str<strong>on</strong>g>, shadow and<br />
very dark water pixels (b). Center coordinate: 650705E, 4373287N, UTM, Z48 N.<br />
Figure 8-2: Spectral mean for bands 123457 and bands 123 for eight time steps for the Ruqigou<br />
area<br />
Figure 8-3: Spectral mean for bands 123457 and bands 123 for eight time steps for the Wuda area<br />
Figure 8-4: Visible band displayed in gray scale mode (a) and shadowed <str<strong>on</strong>g>areas</str<strong>on</strong>g> extracted by <strong>test</strong> 3<br />
supported by available illuminati<strong>on</strong> data derived from a DEM. Here presented for the<br />
str<strong>on</strong>gly shadowed area of Ruqigou. Center coordinate: 607794E, 4336506N, UTM,<br />
Z48N<br />
Figure 8-5: Relati<strong>on</strong>ship between number of excluded shadow pixels and scene acquisiti<strong>on</strong> date;<br />
calculated for three scenes of the Ruqigou area for the m<strong>on</strong>ths of August, October and<br />
December. As expected, the area eliminated by <strong>test</strong> 3 (pixels do not undergo further<br />
<strong>test</strong>ing for “<str<strong>on</strong>g>coal</str<strong>on</strong>g>”) increases with decreasing sun angles.<br />
Figure 8-6: Pixels which passed <strong>test</strong>s 1, 2, 4 and 5 and were not excluded by <strong>test</strong> 3 (white) in the<br />
left image (a), result after the final relative temperature <strong>test</strong> 6 (b), Center coordinate:<br />
650705E, 4373287N, UTM, Z48 N<br />
Figure 8-7: SAVI image of Wuda area <strong>on</strong> 21.09.2002.<br />
Figure 8-8: Spatial pattern of the average SAVI in buffer z<strong>on</strong>es around the active <str<strong>on</strong>g>coal</str<strong>on</strong>g> <str<strong>on</strong>g>fire</str<strong>on</strong>g>s #6, #7,<br />
#8 and #11 of Wuda syncline.<br />
Figure 8-9: Result of the vegetati<strong>on</strong> <strong>test</strong> for Wuda area, white: dense vegetati<strong>on</strong>, black <str<strong>on</strong>g>areas</str<strong>on</strong>g> below<br />
the SAVI threshold. Center coordinate: 650705E, 4373287N, UTM, Z48 N<br />
Figure 8-10:<br />
Coal mining area Ruqigou, Landsat image (a), Quickbird image (b). Center coordinate<br />
of both displayed subsets: 59443 E, 4322273 N, UTM Z48N, WGS84. Both images<br />
- 16 -
are displayed in real color combinati<strong>on</strong>: bands 1,2,3 = BGR. The pyrometamorphically<br />
changed rocks of reddish colour are clearly visible in the Quickbird image. Only a few<br />
pixel in the Landat image experience a str<strong>on</strong>g enough <strong>spectral</strong> signal to be c<strong>on</strong>sidered<br />
as a 30 × 30 m pixel representing pyrometamorph rock.<br />
Figure 8-11: Workflow of the knowledge <str<strong>on</strong>g>based</str<strong>on</strong>g> <strong>test</strong> sequence (not every temporary output file is<br />
shown). After the SPM channels and the SAVI data is generated 16 equati<strong>on</strong>s and<br />
inequalities are <strong>test</strong>ed for the automated extracti<strong>on</strong> of <str<strong>on</strong>g>coal</str<strong>on</strong>g>, 2 equati<strong>on</strong>s are <strong>test</strong>ed for<br />
the extracti<strong>on</strong> of dense vegetati<strong>on</strong> and 9 relati<strong>on</strong>ships need to be fulfilled for a pixel to<br />
be assigned to the class of pyrometamorphic rock.<br />
Figure 8-12: Pixels automatically extracted as <str<strong>on</strong>g>coal</str<strong>on</strong>g> (white) for 8 time steps for the broader Wuda<br />
area (filtered).<br />
Figure 8-13: Development of the number of <str<strong>on</strong>g>coal</str<strong>on</strong>g> pixels extracted from 1987 until 2003 for the<br />
Wuda area including all scenes processed (a), and excluding the winter scenes (b). The<br />
trend was calculated for the filtered results.<br />
Figure 8-14: Difference between <str<strong>on</strong>g>coal</str<strong>on</strong>g> accumulati<strong>on</strong> comparing September 2002 and February 2003.<br />
The summer/fall scenes acquired present a stable linear increase in <str<strong>on</strong>g>coal</str<strong>on</strong>g> surfaces over<br />
the past years The two winter scenes of December 2002 and February 2003 act as<br />
outliers. This can be explained with the heavy <str<strong>on</strong>g>coal</str<strong>on</strong>g> use during the winter m<strong>on</strong>th. It is<br />
obvious that <str<strong>on</strong>g>coal</str<strong>on</strong>g> storage and <str<strong>on</strong>g>coal</str<strong>on</strong>g> waste piles and the piles around the mine portals<br />
shrink in size during times when <str<strong>on</strong>g>coal</str<strong>on</strong>g> is increasingly used for heating and electricity<br />
producti<strong>on</strong>.<br />
Figure 8-15: Pixels automatically extracted as <str<strong>on</strong>g>coal</str<strong>on</strong>g> for 8 time steps for the broader Wuda area<br />
(filtered). The color scheme represents how often a pixel was c<strong>on</strong>sidered as a <str<strong>on</strong>g>coal</str<strong>on</strong>g><br />
surface.<br />
Figure 8-16: Pixels automatically extracted as <str<strong>on</strong>g>coal</str<strong>on</strong>g> (white) for 8 time steps for the Ruqigou area<br />
(filtered),<br />
Figure 8-17: Development of the number of <str<strong>on</strong>g>coal</str<strong>on</strong>g> pixels extracted from 1987 until 2003 for the<br />
Ruqigou area including all scenes processed (a), excluding the winter scenes (b). The<br />
trend was calculated for the filtered results.<br />
Figure 8-18: Pixels automatically extracted as <str<strong>on</strong>g>coal</str<strong>on</strong>g> for 8 time steps for the broader Ruqigou area<br />
(filtered). The color scheme represents, how often a pixel was c<strong>on</strong>sidered as a <str<strong>on</strong>g>coal</str<strong>on</strong>g><br />
surface. Center coordinate of main subset: 607794E, 4336506N, UTM, Z48N<br />
Figure 8-19: Spectral mean for bands 123457 and bands 123 for the three transfer <str<strong>on</strong>g>areas</str<strong>on</strong>g><br />
Figure 8-20: Number of extracted <str<strong>on</strong>g>coal</str<strong>on</strong>g> pixels for the Leigh Creek area, Australia, the Baotou area<br />
in northern China and the Jahria <str<strong>on</strong>g>coal</str<strong>on</strong>g> mining regi<strong>on</strong> in India. An excepti<strong>on</strong>al high<br />
amount of single scattered pixels is extracted in the scene from India. This scene has<br />
much larger <str<strong>on</strong>g>coal</str<strong>on</strong>g> occurrences than the regi<strong>on</strong>s of Baotou and Leigh Creek area,<br />
Australia.<br />
Figure 8-21: Locati<strong>on</strong> of the transfer ETM+ scene from Australia<br />
Figure 8-22: The Leigh Creek <str<strong>on</strong>g>coal</str<strong>on</strong>g> mining area (a), <str<strong>on</strong>g>coal</str<strong>on</strong>g> pixels extracted for the scene (b), this<br />
subset displays <strong>on</strong>ly 1/15 th of the full scene. Center coordinate of subset: 6626009 S;<br />
252463 E, UTM, Z54 S, WGS 84.<br />
Figure 8-23: Locati<strong>on</strong> of theETM+ transfer scene from India<br />
Figure 8-24:<br />
Coal pixels extracted for the scene of India. The two subsets display <strong>on</strong>ly parts of the<br />
full scene. The upper two images (a, b) present the Jharia <str<strong>on</strong>g>coal</str<strong>on</strong>g> field. The lower two<br />
- 17 -<br />
N
subsets (c, d) present a <str<strong>on</strong>g>coal</str<strong>on</strong>g> field approximately 100 km west of Jharia close to the<br />
small town of Rāy. Center coordinate of upper subset: 428060E, 2624047N, UTM,<br />
Z45 N, WGS 84. Center coordinate of lower subset: 307711 E, 2621553 N, UTM,<br />
Z45 N, WGS84.<br />
Figure 8-25: Locati<strong>on</strong> of the ETM+ transfer scene from northern China<br />
Figure 8-26: Original data (a) and <str<strong>on</strong>g>coal</str<strong>on</strong>g> pixels extracted for the scene of Baotou, northern China (b).<br />
The subset displays <strong>on</strong>ly part of the full scene. Center coordinate: 404361E,<br />
4502452N, UTM, Z49 N, WGS 84.<br />
Figure 8-27: Areal reducti<strong>on</strong> with progressi<strong>on</strong> of the knowledge <str<strong>on</strong>g>based</str<strong>on</strong>g> <str<strong>on</strong>g>coal</str<strong>on</strong>g> extracti<strong>on</strong> <strong>test</strong> sequence<br />
(a, b) and for the overall <strong>test</strong> sequence (c, d) for the broader Wuda and Ruqigou area.<br />
Exemplarily visualized for three time steps 2000, 2001 and 2002-09.<br />
Figure 8-28: a: Extracted <str<strong>on</strong>g>coal</str<strong>on</strong>g> surfaces (white) and superimposed <str<strong>on</strong>g>coal</str<strong>on</strong>g> <str<strong>on</strong>g>fire</str<strong>on</strong>g> polyg<strong>on</strong>s. b: Extracted<br />
<str<strong>on</strong>g>coal</str<strong>on</strong>g> <str<strong>on</strong>g>fire</str<strong>on</strong>g> (<str<strong>on</strong>g>risk</str<strong>on</strong>g>) area (white) and mapped <str<strong>on</strong>g>coal</str<strong>on</strong>g> <str<strong>on</strong>g>fire</str<strong>on</strong>g> outlines for the year 2002-09 (red)<br />
for the broader area of Wuda. Center coordinate of the subset: 641952E, 4376514N,<br />
UTM, Z48N, WGS84. The Wuda <str<strong>on</strong>g>coal</str<strong>on</strong>g> <str<strong>on</strong>g>fire</str<strong>on</strong>g>s are numbered from 1-17<br />
Figure 8-29: a: Extracted <str<strong>on</strong>g>coal</str<strong>on</strong>g> surfaces (white) and superimposed <str<strong>on</strong>g>coal</str<strong>on</strong>g> <str<strong>on</strong>g>fire</str<strong>on</strong>g> polyg<strong>on</strong>s. b: Extracted<br />
<str<strong>on</strong>g>coal</str<strong>on</strong>g> <str<strong>on</strong>g>fire</str<strong>on</strong>g> (<str<strong>on</strong>g>risk</str<strong>on</strong>g>) area (white) and mapped <str<strong>on</strong>g>coal</str<strong>on</strong>g> <str<strong>on</strong>g>fire</str<strong>on</strong>g> outlines for the year 2002 (red) for<br />
the broader area of Ruqigou. Center coordinate of the subset: 595800E, 4325705 N,<br />
UTM, Z48N, WGS 84. The Gulaben <str<strong>on</strong>g>coal</str<strong>on</strong>g> <str<strong>on</strong>g>fire</str<strong>on</strong>g>s are numbered from 21-25, the Ruqigou<br />
<str<strong>on</strong>g>coal</str<strong>on</strong>g> <str<strong>on</strong>g>fire</str<strong>on</strong>g>s are numbered from 31-45. All together the mapped <str<strong>on</strong>g>coal</str<strong>on</strong>g> <str<strong>on</strong>g>fire</str<strong>on</strong>g> area (red<br />
polyg<strong>on</strong>s) covers 6,11 km².<br />
Figure 8-30: Areal reducti<strong>on</strong> with progressi<strong>on</strong> of the knowledge <str<strong>on</strong>g>based</str<strong>on</strong>g> <str<strong>on</strong>g>coal</str<strong>on</strong>g> extracti<strong>on</strong> <strong>test</strong> sequence<br />
(a, b, c) and for the overall <strong>test</strong> sequence (d, e, f) for three transfer <str<strong>on</strong>g>areas</str<strong>on</strong>g>, Baotou in<br />
northern China, Leigh Creek in Australia and Jharia in India.<br />
Figure 9-1: Results of partial unmixing to <str<strong>on</strong>g>coal</str<strong>on</strong>g> for the broader Wuda area, image from 1999.<br />
Bright pixel values indicate a high sub-pixel <str<strong>on</strong>g>coal</str<strong>on</strong>g> fracti<strong>on</strong>, dark <str<strong>on</strong>g>areas</str<strong>on</strong>g> have lower subpixel<br />
fracti<strong>on</strong>s. Center coordinate: 650705E, 4373287N, UTM, Z48 N, 43km×36km<br />
Figure 9-2: left: prototype spectrum of <str<strong>on</strong>g>coal</str<strong>on</strong>g> derived by creating a mean of all averaged input<br />
spectra measurements. The black spectra represent the mean spectra of 8 <str<strong>on</strong>g>coal</str<strong>on</strong>g> samples.<br />
Each was measured 20 times. Right: overall mean spectrum of <str<strong>on</strong>g>coal</str<strong>on</strong>g> interpolated to the<br />
SRF of Aster (blue), Landsat-5 TM (turquoise) and Landsat-7 ETM+ (violet); the<br />
resampled spectra are stacked with offset for better visualizati<strong>on</strong>.<br />
Figure 9-3: Results of a PPI calculati<strong>on</strong> (10k iterati<strong>on</strong>s) superimpo-sed <strong>on</strong> band <strong>on</strong>e (blue) of<br />
ETM+ 129/33 from 17.10.2000. Center co-ordinate of left subset: 650705E,<br />
4373287N, UTM, Z48 N, 43km×36km<br />
Figure 9-4: Partial unmixing results for the borader Wuda area for all 8 scenes. Light <str<strong>on</strong>g>areas</str<strong>on</strong>g><br />
indicate a high spatial fracti<strong>on</strong> of the input prototype spectrum (<str<strong>on</strong>g>coal</str<strong>on</strong>g>), while dark <str<strong>on</strong>g>areas</str<strong>on</strong>g><br />
represent pixels with a smaller fracti<strong>on</strong> of this surface. Mimicking surfaces include<br />
shaded <str<strong>on</strong>g>areas</str<strong>on</strong>g> and partially water. Center coordinate: 650705E, 4373287N, UTM, Z48<br />
N, 43km×36km<br />
Figure 9-5: Subpixel fracti<strong>on</strong> of the input prototype surface (<str<strong>on</strong>g>coal</str<strong>on</strong>g>) plotted against the percenttage<br />
of the scene area, which would remain, if the partial unmixing result is thresholded for<br />
the pixels c<strong>on</strong>taining equal or above the percentage subpixel fracti<strong>on</strong>. All eight time<br />
steps were calculated and displayed.<br />
Figure 9-6:<br />
Subpixel fracti<strong>on</strong> of the input prototype surface (<str<strong>on</strong>g>coal</str<strong>on</strong>g>) plotted against the percenttage<br />
of the scene area, which would remain, if the partial unmixing result is thresholded for<br />
- 18 -
N<br />
the pixels c<strong>on</strong>taining equal or above the percentage subpixel fracti<strong>on</strong>. Presented for<br />
Wuda, 20.09.1987 and 21.09. 2002 (River not included).<br />
Figure 9-7: Subpixel fracti<strong>on</strong> of the input pattern surface (<str<strong>on</strong>g>coal</str<strong>on</strong>g>) plotted against the percentage of<br />
the scene area, which would remain, if the partial unmixing result is thresholded for<br />
the pixels c<strong>on</strong>taining equal or above the percentage subpixel fracti<strong>on</strong>. Here <strong>on</strong>ly flat<br />
regi<strong>on</strong>s were included in the calculati<strong>on</strong> to exclude shadow effects induced by<br />
differing sun angles, (a).(b) presents a zoom into (a) for better clarity.<br />
Figure 9-8: Partial unmixing results for vegetati<strong>on</strong> for the broader Wuda area for 1987-09 (a) and<br />
2002-09 (b). Light <str<strong>on</strong>g>areas</str<strong>on</strong>g> indicate a high spatial fracti<strong>on</strong> of the input prototype<br />
spectrum (pure Artemisia leaves), while dark <str<strong>on</strong>g>areas</str<strong>on</strong>g> represent pixels with a smaller<br />
fracti<strong>on</strong> of vegetati<strong>on</strong>. Center coordinate: 650705E, 4373287N, UTM, Z48 N,<br />
43km×36km.<br />
Figure 9-9: Linear <strong>spectral</strong> unmixing result for the broader Wuda area for 2002-09. The selected<br />
endmembers are <str<strong>on</strong>g>coal</str<strong>on</strong>g> (a), quartzite desert sand (b), arcotic sandst<strong>on</strong>e (c) and Artemisia<br />
vegetati<strong>on</strong> (d). Light <str<strong>on</strong>g>areas</str<strong>on</strong>g> indicate high subpixel fracti<strong>on</strong>s, while dark <str<strong>on</strong>g>areas</str<strong>on</strong>g> represent<br />
pixels with a smaller fracti<strong>on</strong> of the endmember. Center coordinate: 640134E,<br />
4377377N, UTM, Z48 N, 43km×36km<br />
Figure 9-10: RMSE image (a) and color coded unmixing resul (b). Here the endmember <str<strong>on</strong>g>coal</str<strong>on</strong>g>,<br />
vegetati<strong>on</strong> and sandst<strong>on</strong>e are displayed in red, green and blue. The RMSE image<br />
shows high errors for the vegetated <str<strong>on</strong>g>areas</str<strong>on</strong>g>. This goes in line with the c<strong>on</strong>fusi<strong>on</strong><br />
between desert sand and vegetati<strong>on</strong>. Center coordinate: 640134E, 4377377N, UTM,<br />
Z48 N, 43km×36km<br />
Figure 9-11: Partial unmixing results for the broader Ruqigou study area for all 8 scenes. Light<br />
<str<strong>on</strong>g>areas</str<strong>on</strong>g> indicate a high spatial fracti<strong>on</strong> of the input prototype spectrum, while dark <str<strong>on</strong>g>areas</str<strong>on</strong>g><br />
represent pixels with a smaller fracti<strong>on</strong>s. Mimicking surfaces include shaded <str<strong>on</strong>g>areas</str<strong>on</strong>g>.<br />
Center coordinate: 606211E, 4334381N, UTM, Z48N, 33km×28km<br />
Figure 9-12: Subpixel fracti<strong>on</strong> of the input pattern surface (<str<strong>on</strong>g>coal</str<strong>on</strong>g>) plotted against the per-centtage of<br />
the scene area, which would remain, if the partial unmixing result is thresholded for<br />
the pixels c<strong>on</strong>taining equal or above the percentage subpixel fracti<strong>on</strong>. All eight time<br />
steps were calculated and displayed.<br />
Figure 9-13: Subpixel fracti<strong>on</strong> of the input pattern surface (<str<strong>on</strong>g>coal</str<strong>on</strong>g>) plotted against the percentage of<br />
the scene area, which would remain, if the partial unmixing result is thresholded for<br />
the pixels c<strong>on</strong>taining equal or above the percentage subpixel fracti<strong>on</strong>. Presented for<br />
Ruqigou, 20.09.1987 and 21.09.2002.<br />
Figure 9-14: Subpixel fracti<strong>on</strong> result image for <str<strong>on</strong>g>coal</str<strong>on</strong>g> intersected with a 85% threshold, to retrieve<br />
pure <str<strong>on</strong>g>coal</str<strong>on</strong>g> surfaces; for the broader stury area of Ruqigou, 1999 (a) and 2002-09 (b),<br />
Center coordinate: 606211E, 4334381N, UTM, Z48N, 33km×28km<br />
Figure 9-15: Partial unmixing results for vegetati<strong>on</strong> for the broader Ruqigou area for 1987-09 (a)<br />
and 2002-09 (b). Light <str<strong>on</strong>g>areas</str<strong>on</strong>g> indicate a high fracti<strong>on</strong> (pure Artemisia leaves), while<br />
dark <str<strong>on</strong>g>areas</str<strong>on</strong>g> represent pixels with a smaller fracti<strong>on</strong> of vegetati<strong>on</strong>. Center coordinate:<br />
610605E, 43327047N, UTM, Z48 N, 33km×28km.<br />
Figure 9-16: Subpixel fracti<strong>on</strong> image for pyrometamorphic rock (averaged prototype spectrum) for<br />
the broader Ruqigou area calculated for the scene from 2002-09. Center coordinate of<br />
a: 607794E, 4336506N, b and b’: 595287E, 4325273N, UTM, Z48N, 33km×28km.<br />
- 19 -
Figure 9-17: Fracti<strong>on</strong> image of <str<strong>on</strong>g>coal</str<strong>on</strong>g> resulting from partial unmixing for the broader Leigh Creek<br />
area, Australia, (a) and fracti<strong>on</strong> image of vegetati<strong>on</strong> (b). Center coordinate: 6626009<br />
S; 252463 E, UTM, Z54 S.<br />
Figure 9-18: Thresholded 85% subpixel <str<strong>on</strong>g>coal</str<strong>on</strong>g> fracti<strong>on</strong> imagebefore (a) and after (b) the intersecti<strong>on</strong><br />
with the temperature <strong>test</strong> (majority filtered). Center coordinate: 6626009 S; 252463 E,<br />
UTM, Z54 S, 60km×50km.<br />
Figure 9-19: PMA result for the scene of India (<strong>on</strong>ly the Jharia area is presented). Original image<br />
(a), grey scale fracti<strong>on</strong> image (b) and result after thresholding at the 85% fracti<strong>on</strong><br />
(majority filtered) (c). Center coordinate: 430324E; 2622931N, UTM, Z45N,<br />
33km×25km<br />
Figure 9-20: PMA result for the scene of India (<strong>on</strong>ly the Ray area is presented). Original image (a),<br />
grey scale fracti<strong>on</strong> image (b) and result after thresholding at the 85% fracti<strong>on</strong> (c).<br />
Center coordinate: 301422E; 2622092N, UTM, Z45N, 17km×13km.<br />
Figure 9-21: PMA result for the scene of Baotou (<strong>on</strong>ly a subset is presented). Original image (a),<br />
grey scale fracti<strong>on</strong> image (b) and result after thresholding at the 85% fracti<strong>on</strong> (c). Also<br />
a post processing temperature <strong>test</strong> applied cannot improve the result presented in c.<br />
Center coordinate: 375443E; 4495960N, UTM, Z49N, 80km×60km.<br />
Figure 9-22: Locati<strong>on</strong> of the seven mixture grids mapped during the field campaign in September<br />
2002. Over 600 cells were mapped with regard to their percentage subcell fracti<strong>on</strong> of<br />
the occurring surface comp<strong>on</strong>ents. The grids are superimposed <strong>on</strong> an ETM+ PMA<br />
result of 2002-09. Center coordinate of the presented subset 644123E, 4370610N,<br />
UTM, Z48N, 23km×10km<br />
Figure 9-23: The three main grids mapped within Wuda syncline, Suhai Tu (left), Wuhushan (upper<br />
right) and Wuhushan south (lower right). The mapping result from the field in<br />
September 2002 (left side) as well as the PMA result for the partial unmixing to <str<strong>on</strong>g>coal</str<strong>on</strong>g> –<br />
also from a September 2002 scene - (right side) are shown. Orange boxes indicate<br />
<str<strong>on</strong>g>areas</str<strong>on</strong>g>, which were not mapped.<br />
Figure 9-24: Thematic principle of class- or material membership infeasibility. Deviati<strong>on</strong> from the<br />
prototype spectrum is given in noise δ units. The right part illustrates, where the<br />
desired pixels requested to be extracted are located. Pixels with a high PMA score and<br />
a low infeasibility (= high feasibility) are similar or tend to be close to the prototype<br />
input. DAMM, 2004, modified and extended.<br />
Figure 9-25: Partial unmixing result post processed with infeasibility informati<strong>on</strong>. a: PMA result<br />
for Wuda from 2002-12, b: infeasibility calculati<strong>on</strong> for the prototype spectrum of <str<strong>on</strong>g>coal</str<strong>on</strong>g>,<br />
c: 85% subpixel fracti<strong>on</strong> thresholded image of the PMA score, d: intersected image of<br />
high PMA scores (>85 %) and low infeasibility scores (
layer in light blue, thermal anomalies in yellow, the demarcated <str<strong>on</strong>g>coal</str<strong>on</strong>g><str<strong>on</strong>g>fire</str<strong>on</strong>g> (<str<strong>on</strong>g>risk</str<strong>on</strong>g>) <str<strong>on</strong>g>areas</str<strong>on</strong>g><br />
are superimposed in red. Center coordinate:669169E, 4365414N, UTM, Z48N<br />
Figure 10-3: Newly detected <str<strong>on</strong>g>coal</str<strong>on</strong>g> <str<strong>on</strong>g>fire</str<strong>on</strong>g>s <str<strong>on</strong>g>based</str<strong>on</strong>g> <strong>on</strong> <str<strong>on</strong>g>coal</str<strong>on</strong>g> <str<strong>on</strong>g>fire</str<strong>on</strong>g> (<str<strong>on</strong>g>risk</str<strong>on</strong>g>) area demarcati<strong>on</strong> and thermal<br />
anomaly detecti<strong>on</strong> 25 km southeast of Wuda. Note the <str<strong>on</strong>g>coal</str<strong>on</strong>g> <str<strong>on</strong>g>fire</str<strong>on</strong>g> related smoke in<br />
figure 10-3 a and the improperly sealed former private mines in figure 10-3 b. The<br />
trench is excavated to prevent the spreading of the <str<strong>on</strong>g>fire</str<strong>on</strong>g>. Photos: a: C. KUENZER. b: J.<br />
ZHANG, June 2004<br />
Figure 10-4: Thermal anomalies in numbers of pixels extracted (orange), anomalies rejected by the<br />
knowledge <str<strong>on</strong>g>based</str<strong>on</strong>g> <str<strong>on</strong>g>coal</str<strong>on</strong>g> <str<strong>on</strong>g>fire</str<strong>on</strong>g> area demarcati<strong>on</strong> (dark grey) and anomalies rejected by<br />
PMA <str<strong>on</strong>g>based</str<strong>on</strong>g> <str<strong>on</strong>g>coal</str<strong>on</strong>g> <str<strong>on</strong>g>fire</str<strong>on</strong>g> area demarcati<strong>on</strong> (light grey). Exemplarily presented for six<br />
satellite scenes. Displayed are a nighttime and daytime scene from 2002 of the two<br />
main study <str<strong>on</strong>g>areas</str<strong>on</strong>g>, a scene of these <str<strong>on</strong>g>areas</str<strong>on</strong>g> for 1987 and scenes for the three transfer<br />
<str<strong>on</strong>g>areas</str<strong>on</strong>g> in India, Baotou and Australia.<br />
- 21 -
List of Tables<br />
Table 2-1:<br />
Table 3-1:<br />
Table 4-1:<br />
Table 4-2:<br />
Table 4-3:<br />
Table 4-4:<br />
Table 4-5:<br />
Table 5-1:<br />
Table 5-2:<br />
Table 5-3:<br />
Table 5-4:<br />
Table 5-5:<br />
Table 5-6:<br />
Table 5-7:<br />
Table 7-1:<br />
Table 7-2 a:<br />
Table 7-2 b:<br />
Table 7-3 a:<br />
Table 7-3 b:<br />
Table 8-1:<br />
Table 8-2:<br />
Table 8-3:<br />
Table 8-4:<br />
Table 8-5:<br />
Table 8-6:<br />
Climate data for the main study <str<strong>on</strong>g>areas</str<strong>on</strong>g><br />
C<strong>on</strong>cept of an accuracy assessment error matrix<br />
Spectral and spatial properties of Landsat 7 ETM+ data versus Landsat 5 TM (in<br />
brackets)<br />
LS7 ETM+ scenes processed and analyzed in the framework of this thesis<br />
Spectral and spatial properties of ASTER data<br />
ASTER scenes processed and analyzed in the framework of the thesis<br />
Geologic surface samples measured in the <strong>spectral</strong> laboratory<br />
Elevati<strong>on</strong> dependence of relief induced displacement (ETM+)<br />
Relief induced displacement in the main study <str<strong>on</strong>g>areas</str<strong>on</strong>g> relative to NN in Landsat-7<br />
ETM+ data<br />
RMSE-results in orthorectificati<strong>on</strong> of Landsat-5 TM, Landsat-7 ETM+, Aster and<br />
Quickbird data<br />
MODTRAN 4 standard atmospheres applied<br />
Temperature of saturati<strong>on</strong> in the low- and high gain bands of Landsat-7 ETM+<br />
Emissivity of different surfaces<br />
Thermal properties of geologic materials<br />
Physical and chemical properties of <str<strong>on</strong>g>coal</str<strong>on</strong>g>s from the study <str<strong>on</strong>g>areas</str<strong>on</strong>g><br />
Separabilities (D E ) for the most comm<strong>on</strong> surface classes in Wuda (no thermal band<br />
included)<br />
Separabilities (D E ) for the most comm<strong>on</strong> surface classes in Wuda (thermal band<br />
included)<br />
Separabilities (D E ) for the most comm<strong>on</strong> surface classes in Ruqigou (thermal band not<br />
included)<br />
Separabilities (D E ) for the most comm<strong>on</strong> surface classes in Ruqigou (thermal band<br />
included)<br />
Reducti<strong>on</strong> of the full scene <str<strong>on</strong>g>areas</str<strong>on</strong>g> to <str<strong>on</strong>g>coal</str<strong>on</strong>g> <str<strong>on</strong>g>fire</str<strong>on</strong>g> <str<strong>on</strong>g>risk</str<strong>on</strong>g> <str<strong>on</strong>g>areas</str<strong>on</strong>g> <str<strong>on</strong>g>based</str<strong>on</strong>g> <strong>on</strong> the automated<br />
extracti<strong>on</strong> of <str<strong>on</strong>g>coal</str<strong>on</strong>g>, a delineati<strong>on</strong> <str<strong>on</strong>g>based</str<strong>on</strong>g> <strong>on</strong> this area and the exclusi<strong>on</strong> of densely<br />
vegetated <str<strong>on</strong>g>areas</str<strong>on</strong>g> withinthis z<strong>on</strong>e for the Wuda regi<strong>on</strong><br />
Reducti<strong>on</strong> of the full scene <str<strong>on</strong>g>areas</str<strong>on</strong>g> to <str<strong>on</strong>g>coal</str<strong>on</strong>g> <str<strong>on</strong>g>fire</str<strong>on</strong>g> <str<strong>on</strong>g>risk</str<strong>on</strong>g> <str<strong>on</strong>g>areas</str<strong>on</strong>g> <str<strong>on</strong>g>based</str<strong>on</strong>g> <strong>on</strong> the automated<br />
extracti<strong>on</strong> of <str<strong>on</strong>g>coal</str<strong>on</strong>g>, a delineati<strong>on</strong> <str<strong>on</strong>g>based</str<strong>on</strong>g> <strong>on</strong> this area and exclusi<strong>on</strong> of densely vegetated<br />
<str<strong>on</strong>g>areas</str<strong>on</strong>g> within this z<strong>on</strong>e for the Ruqigou regi<strong>on</strong><br />
Reducti<strong>on</strong> of the full scene <str<strong>on</strong>g>areas</str<strong>on</strong>g> to <str<strong>on</strong>g>coal</str<strong>on</strong>g> <str<strong>on</strong>g>fire</str<strong>on</strong>g> <str<strong>on</strong>g>risk</str<strong>on</strong>g> <str<strong>on</strong>g>areas</str<strong>on</strong>g> <str<strong>on</strong>g>based</str<strong>on</strong>g> <strong>on</strong> the automated<br />
extracti<strong>on</strong> of <str<strong>on</strong>g>coal</str<strong>on</strong>g>, a delineati<strong>on</strong> <str<strong>on</strong>g>based</str<strong>on</strong>g> <strong>on</strong> this area, exclusi<strong>on</strong> of densely vegetated<br />
<str<strong>on</strong>g>areas</str<strong>on</strong>g> within this z<strong>on</strong>e for the Leigh Creek regi<strong>on</strong><br />
Reducti<strong>on</strong> of the full scene <str<strong>on</strong>g>areas</str<strong>on</strong>g> to <str<strong>on</strong>g>coal</str<strong>on</strong>g> <str<strong>on</strong>g>fire</str<strong>on</strong>g> <str<strong>on</strong>g>risk</str<strong>on</strong>g> <str<strong>on</strong>g>areas</str<strong>on</strong>g> <str<strong>on</strong>g>based</str<strong>on</strong>g> <strong>on</strong> the automated<br />
extracti<strong>on</strong> of <str<strong>on</strong>g>coal</str<strong>on</strong>g>, a delineati<strong>on</strong> <str<strong>on</strong>g>based</str<strong>on</strong>g> <strong>on</strong> this area and exclusi<strong>on</strong> of densely vegetated<br />
<str<strong>on</strong>g>areas</str<strong>on</strong>g> within this z<strong>on</strong>e for the Jharia regi<strong>on</strong><br />
Reducti<strong>on</strong> of the full scene <str<strong>on</strong>g>areas</str<strong>on</strong>g> to <str<strong>on</strong>g>coal</str<strong>on</strong>g> <str<strong>on</strong>g>fire</str<strong>on</strong>g> <str<strong>on</strong>g>risk</str<strong>on</strong>g> <str<strong>on</strong>g>areas</str<strong>on</strong>g> <str<strong>on</strong>g>based</str<strong>on</strong>g> <strong>on</strong> the automated<br />
extracti<strong>on</strong> of <str<strong>on</strong>g>coal</str<strong>on</strong>g>, a delineati<strong>on</strong> around this area and exclusi<strong>on</strong> of densely vegetated<br />
<str<strong>on</strong>g>areas</str<strong>on</strong>g> within this z<strong>on</strong>e for the Baotou regi<strong>on</strong><br />
Relevance of the single <strong>test</strong>s, filters and delineati<strong>on</strong> for the areal reducti<strong>on</strong> of the input<br />
data set for three exemplary time steps for the broader Wuda study area<br />
- 22 -
Table 8-7: Relevance of the single <strong>test</strong>s, filters and buffers for the areal reducti<strong>on</strong> of the input<br />
data set for three exemplary time steps for the broader Ruqigou study area<br />
Table 8-8: Accuracy of the extracted <str<strong>on</strong>g>coal</str<strong>on</strong>g> (filtered) and dense vegetati<strong>on</strong> pixels for Wuda<br />
Table 8-9: Accuracy of the extracted <str<strong>on</strong>g>coal</str<strong>on</strong>g> (filtered), dense vegetati<strong>on</strong> and burned rock pixels for<br />
Ruqigou<br />
Table 8-10: Percentage of <str<strong>on</strong>g>fire</str<strong>on</strong>g> polyg<strong>on</strong>s mapped in the Wuda area during the field campaign in<br />
2002 included in the delineated area from the 2002-09 scene for a 500m and a 1000<br />
m buffer.<br />
Table 8-11: Percentage of <str<strong>on</strong>g>fire</str<strong>on</strong>g> polyg<strong>on</strong>s mapped in the Ruqigou during the field campaign in 2002<br />
included in the demarcated <str<strong>on</strong>g>coal</str<strong>on</strong>g> <str<strong>on</strong>g>fire</str<strong>on</strong>g> (<str<strong>on</strong>g>risk</str<strong>on</strong>g>) area from the September 2002 scene.<br />
Table 8-12: Relevance of the single <strong>test</strong>s, filters and delineati<strong>on</strong> for the areal reducti<strong>on</strong> of the input<br />
data set for three exemplary time steps for the three transfer <str<strong>on</strong>g>areas</str<strong>on</strong>g><br />
Table 8-13: Relevance of the single <strong>test</strong>s, filters and delineati<strong>on</strong> for the reducti<strong>on</strong><br />
of the input data. Averaged % reducti<strong>on</strong> in comparis<strong>on</strong> with the<br />
previous <strong>test</strong> sequence result calculated for all five <str<strong>on</strong>g>areas</str<strong>on</strong>g><br />
Table 8-14: Accuracy of the extracted <str<strong>on</strong>g>coal</str<strong>on</strong>g> (filtered) and dense vegetati<strong>on</strong> pixels for Australia<br />
Table 8-15: Accuracy of the extracted <str<strong>on</strong>g>coal</str<strong>on</strong>g> (filtered) and dense vegetati<strong>on</strong> pixels for India<br />
Table 8-16: Accuracy of the extracted <str<strong>on</strong>g>coal</str<strong>on</strong>g> (filtered) and dense vegetati<strong>on</strong> pixels for Baotou<br />
Table 9-1: Accuracy assessment for the 85 % thresholded <str<strong>on</strong>g>coal</str<strong>on</strong>g> fracti<strong>on</strong>s and 85 % thresholded<br />
vegetati<strong>on</strong> fracti<strong>on</strong>s for the Wuda study area<br />
Table 9-2: Accuracy assessment for the 85 % thresholded <str<strong>on</strong>g>coal</str<strong>on</strong>g> fracti<strong>on</strong>s and 85 % thresholded<br />
vegetati<strong>on</strong> fracti<strong>on</strong>s for the Ruqigou study area<br />
Table 9-3: Regressi<strong>on</strong> analyses between mapped subpixel fracti<strong>on</strong>s and the PMA result<br />
Table 9-4: Accuracy of the extracted <str<strong>on</strong>g>coal</str<strong>on</strong>g> for Australia<br />
Table 9-5: Accuracy of the extracted <str<strong>on</strong>g>coal</str<strong>on</strong>g> and dense vegetati<strong>on</strong> pixels for India<br />
Table 9-6: Accuracy of the extracted <str<strong>on</strong>g>coal</str<strong>on</strong>g> and dense vegetati<strong>on</strong> pixels for Baotou<br />
Table 10-1: Coal <str<strong>on</strong>g>fire</str<strong>on</strong>g> area demarcati<strong>on</strong> supporting the exclusi<strong>on</strong> of false alarms: knowledge <str<strong>on</strong>g>based</str<strong>on</strong>g><br />
demarcati<strong>on</strong><br />
Table 10-2: Coal <str<strong>on</strong>g>fire</str<strong>on</strong>g> area demarcati<strong>on</strong> supporting the exclusi<strong>on</strong> of false alarms: PMA <str<strong>on</strong>g>based</str<strong>on</strong>g><br />
demarcati<strong>on</strong><br />
- 23 -
List of Maps<br />
Map 1:<br />
Map 2:<br />
Map 3:<br />
Map 4:<br />
Map 5:<br />
Map 6:<br />
Map 7:<br />
Map 8:<br />
Map 9:<br />
Map 10:<br />
Map 11:<br />
Map 12:<br />
Map 13:<br />
Map 14:<br />
Map 15:<br />
Map 16:<br />
Locati<strong>on</strong> of the study <str<strong>on</strong>g>areas</str<strong>on</strong>g> Wuda and Ruqigou/Gulaben within China<br />
Geology of the main study <str<strong>on</strong>g>areas</str<strong>on</strong>g> Wuda and Ruqigou/Gulaben<br />
General characteristics and topography of the study <str<strong>on</strong>g>areas</str<strong>on</strong>g> Wuda and Ruqigou/Gulaben<br />
Demarcated Coal Fire Risk Areas an Thermal Anomalies for Wuda Syncline<br />
Demarcated Coal Fire Risk Areas an Thermal Anomalies for Southern Wuhai<br />
Demarcated Coal Fire Risk Areas an Thermal Anomalies Southeast of Wuhai<br />
Demarcated Coal Fire Risk Areas an Thermal Anomalies far Southeast of Wuda<br />
Demarcated Coal Fire Risk Areas an Thermal Anomalies East of Shizuishan City<br />
Demarcated Coal Fire Risk Areas an Thermal Anomalies East of the Newly Detected<br />
Coal Fires of 2004<br />
Demarcated Coal Fire Risk Areas an Thermal Anomalies for Ruqigou / Gulaben<br />
Mining Area<br />
Demarcated Coal Fire Risk Areas an Thermal Anomalies for the Valleys Hulusitai and<br />
Shitanjing<br />
Demarcated Coal Fire Risk Areas an Thermal Anomalies East of Shitanjing<br />
Demarcated Coal Fire Risk Areas an Thermal Anomalies for Leigh Creek Mining<br />
Area<br />
Demarcated Coal Fire Risk Areas an Thermal Anomalies for the City Area of Baotou<br />
Demarcated Coal Fire Risk Areas an Thermal Anomalies for the Jharia Mining Regi<strong>on</strong><br />
Demarcated Coal Fire Risk Areas an Thermal Anomalies for the Rāy Mining Regi<strong>on</strong><br />
- 24 -
List of Symbols and Acr<strong>on</strong>yms<br />
τ υ (z): Ground to sensor view angle transmittance with direct and diffuse comp<strong>on</strong>ents<br />
β(x,y): Angle between the solar ray and the surface normal (illuminati<strong>on</strong> angle)<br />
≈: Approximately<br />
°: Degree<br />
ε: Emissivity<br />
ϕ: Orbit parameter of platform (gear)<br />
σ: Orbit parameter of platform (pitch)<br />
κ: Orbit parameter of platform (roll)<br />
π: Pi, = 3.14159265<br />
±: Plus-minus<br />
ρ: Reflectance<br />
θ: Sun zenith angle<br />
×: Times (multiplicati<strong>on</strong>)<br />
≠: Unequal<br />
γ: Viewing angle between point <strong>on</strong> earth’s surface and sensor<br />
λ: Wavelength<br />
Δ: Difference<br />
μm: Micrometer<br />
τ s (z): Sun to ground beam (direct) transmittance<br />
ΔT: Temperature difference between a diurnal solar cycle<br />
ρ Terrain : Terrain reflected radiati<strong>on</strong> obtained by weighting the reflected radiati<strong>on</strong> in a 0.5 km<br />
surrounding of a pixel with the terrain view factor<br />
τ v :<br />
ground-to-sensor transmittance<br />
(x,y): Horiz<strong>on</strong>tal coordinates<br />
ALI: Advanced Land Imager<br />
ANN: Artificial Neural Network<br />
Arc/Info: GIS Software<br />
ArcGIS: GIS Software<br />
ARSC: Aerophotgrammetry & Remote Sensing Bureau of China<br />
asl:<br />
Above sea level<br />
ASTM: American Society of Testing and Materials<br />
ATCOR: Program for atmospheric and topographic correcti<strong>on</strong><br />
ATI: Apparent thermal inertia<br />
b: Binary factor with b = 1 if a pixel receives a direct solar beam, otherwise b = 0<br />
BE: Binary Encoding<br />
BNU: Beijing Normal University<br />
BRDF: Bidirecti<strong>on</strong>al Reflectance Distributi<strong>on</strong> Functi<strong>on</strong><br />
BRSC: Bureau of Remote Sensing China<br />
c: Specific warmth<br />
c: Speed of light (2.998 * 10 8 m/s)<br />
c 0 :<br />
Calibrati<strong>on</strong> coefficient<br />
c 1 :<br />
Calibrati<strong>on</strong> coefficient<br />
CAS: Chinese Academy of Sciences<br />
CCSM: Cross Correlogram Spectral Matching<br />
- 25 -
CH 4 : Methane<br />
CO 2 : Carb<strong>on</strong> dioxide<br />
cosθ s : Cosine of the sun zenith angle<br />
Cpf: Calibrati<strong>on</strong> parameter file<br />
d: Astr<strong>on</strong>omical unit (earth to sun distance)<br />
DCT: Decisi<strong>on</strong> Tree Classifier<br />
D E:<br />
Euclidean distance<br />
DEM: Digital Elevati<strong>on</strong> Model<br />
DFD: Deutsche Fernerkundungsdatenzentrum<br />
DLR: German Aerospace Center<br />
DN: Digital Number<br />
DN max : Maximum DN<br />
DN min : Minimum DN<br />
E: East<br />
E dif : Diffuse solar flux<br />
E dir : Direct solar flux<br />
E g :<br />
Global direct and diffuse flux <strong>on</strong> the ground<br />
EM: Endmember<br />
EMR: Electromagnetic Radiati<strong>on</strong><br />
ENVI: Envir<strong>on</strong>ment for visualizing images, Image Processing Software<br />
EO-1: Earth Observing Missi<strong>on</strong> 1<br />
ERS-2: European Radar Satellite 2<br />
E s :<br />
Exatmospheric irradiance (TOA)<br />
ETM+: Enhanced Thematic Mapper of Landsat-7<br />
F th :<br />
Thermal downwelling flux <strong>on</strong> the ground<br />
GCP: Ground C<strong>on</strong>trol Point<br />
GIS: Geographic Informati<strong>on</strong> System<br />
h: Height, terrain elevati<strong>on</strong><br />
h: Planck’s c<strong>on</strong>stant (6.63 × 10 -34 W*s²)<br />
HCMM: Heat Capacity Mapping Missi<strong>on</strong><br />
IDL: Interactive Data Language<br />
IFOV: Instantanious field of view<br />
Imagine: Image Processing Software<br />
K: Kelvin<br />
k: Bolzmann’s c<strong>on</strong>stant (1.3805 ×10 -23 W*S*K -1 )<br />
k: Thermal c<strong>on</strong>ductivity of an object.<br />
km²: Square Kilometers<br />
L: Incoming radiance<br />
L 1 :<br />
Reflected direct and diffuse radiati<strong>on</strong> from the currently viewed pixel<br />
L 2 , L P : Path radiance<br />
L 3 :<br />
Terrain reflected radiati<strong>on</strong> from opposite hills<br />
L 4 :<br />
Adjacency radiati<strong>on</strong><br />
Landsat-7: American earth observing satellite<br />
Lat: Latitude<br />
L maxλ : Maximum radiance at wavelength λ<br />
L minλ : Minimum radiance at wavelength λ<br />
L<strong>on</strong>: L<strong>on</strong>gitude<br />
- 26 -
L p (z, θ v , φ): Path radiance depending <strong>on</strong> elevati<strong>on</strong> and viewing geometry;<br />
LS-7: Landsat-7<br />
L Sat : Radiance reaching the sensor<br />
LST: Land surface temperature<br />
L Surf : Blackbody radiance at the ground surface (W/m²/µm/sr/λ)<br />
LTAP: L<strong>on</strong>g Term Acquisiti<strong>on</strong> Plan<br />
m: Meter<br />
m³:<br />
Cubic meter<br />
MB: Megabytes<br />
MDC: Minimum Distance Classificati<strong>on</strong><br />
MF: Matched Filtering<br />
Mio.: Milli<strong>on</strong><br />
MIR: Middle Infrared part of the EMR<br />
MLC: Maximum Likelihood Classificati<strong>on</strong><br />
MNF: Minimum Noise Fracti<strong>on</strong> Transformati<strong>on</strong><br />
MODTRAN: MODerate <strong>spectral</strong> resoluti<strong>on</strong> atmospheric TRANsmittance<br />
Mtce: Milli<strong>on</strong> t<strong>on</strong>s of <str<strong>on</strong>g>coal</str<strong>on</strong>g> equivalent (refers to the intntl. standard of 29.3 GJ per t<strong>on</strong> of <str<strong>on</strong>g>coal</str<strong>on</strong>g>)<br />
MTMF: Mixture Tuned Matched Filtering<br />
mW: Milliwatts<br />
N: North<br />
NDVI: Normalized difference vegetati<strong>on</strong> index<br />
NIR: Near Infrared part of the EMR<br />
nm: Nanometer<br />
NN: Neural Network<br />
NO x : Nitrous Oxides<br />
NRSCC: Nati<strong>on</strong>al Remote sensing Center China<br />
O 2 :<br />
Oxygen<br />
O 3 :<br />
Oz<strong>on</strong>e<br />
OA: Overall Accuracy<br />
OOC: Object Oriented Classificati<strong>on</strong><br />
p: Density of a material<br />
P: Thermal inertia<br />
PA: Producers Accuracy<br />
PAN: Panchromatic<br />
PCA: Principal Comp<strong>on</strong>ent Analysis<br />
PCS: Principal Comp<strong>on</strong>ent Substituti<strong>on</strong><br />
PGS: Product Generati<strong>on</strong> System<br />
PMA: Partial Mixture Analysis<br />
PPC: Parallellipiped Classificati<strong>on</strong><br />
PPI: Pixel Purity Index<br />
q: Weighing factor<br />
RMSE: Root Mean Square Error<br />
SAM: Spectral Angle Mapping<br />
SAR: Synthetic Aperture Radar<br />
SCA: Supervized Classificati<strong>on</strong> Algorithms<br />
SD: Standard deviati<strong>on</strong><br />
SFF: Spetral Feature Fitting<br />
- 27 -
SM: Spectral Matching<br />
SMA: Spectral Mixture Analysis<br />
SNR: Signal to noise rati<strong>on</strong><br />
SO 2 : Sulfur Dioxide<br />
SPM: Spectral Mean<br />
sr:<br />
Steradian<br />
SRF: Spectral Resp<strong>on</strong>se Functi<strong>on</strong><br />
SSD: Sum of Squared Distances<br />
T: Surface temperature<br />
Tab.: Table<br />
tan: Tangens<br />
TCT: Tasseled Cap Transformati<strong>on</strong><br />
TIMS: Thermal Infrared Multi<strong>spectral</strong> Scanner<br />
TM: Thematic Mapper<br />
TOA: Top of the atmosphere<br />
UA: Users Accuracy<br />
UCA: Unsupervized Classificati<strong>on</strong> Algorithms<br />
UTM: Universal Transverse Mercator<br />
VIS Visible part of the EMR<br />
V terrain (x,y): Terrain view factor (0-1 range) calculated from the local slope or a horiz<strong>on</strong> analysis (<br />
W: Watt<br />
WGS84: Spheroid Type<br />
z: Elevati<strong>on</strong> informati<strong>on</strong><br />
Z: Z<strong>on</strong>e<br />
Φ: Slope of the upper hull curve<br />
Any abbreviati<strong>on</strong>s missing in this list will be explained in text or can be found below the equati<strong>on</strong>s<br />
- 28 -
- 29 -
1. Introducti<strong>on</strong><br />
1.1. Coal Fires<br />
Unc<strong>on</strong>trolled <str<strong>on</strong>g>coal</str<strong>on</strong>g> seam <str<strong>on</strong>g>fire</str<strong>on</strong>g>s are an envir<strong>on</strong>mental and ec<strong>on</strong>omic problem of internati<strong>on</strong>al magnitude.<br />
They occur in many countries worldwide including China, India, Russia, the United States, Ind<strong>on</strong>esia,<br />
Venezuela, Australia and South Africa, but also at a smaller scale for example in Germany, Romania<br />
or the Czech Republic (GLOVER 1998, PRAKASH & GUPTA 1998, PRAKASH et al. 1999, DENG et al.<br />
2001, PENNIG 2002, BOEKEMEIER et al. 2002).<br />
The term <str<strong>on</strong>g>coal</str<strong>on</strong>g> <str<strong>on</strong>g>fire</str<strong>on</strong>g> refers to a burning or smoldering <str<strong>on</strong>g>coal</str<strong>on</strong>g> seam, <str<strong>on</strong>g>coal</str<strong>on</strong>g> storage pile or <str<strong>on</strong>g>coal</str<strong>on</strong>g> waste pile.<br />
The adsorpti<strong>on</strong> of oxygen at the outer and inner surface of <str<strong>on</strong>g>coal</str<strong>on</strong>g> and resulting oxidati<strong>on</strong> is an<br />
exothermic reacti<strong>on</strong>. This leads to an increase in temperature within the <str<strong>on</strong>g>coal</str<strong>on</strong>g> accumulati<strong>on</strong>. If the<br />
temperature exceeds approximately 80°C the <str<strong>on</strong>g>coal</str<strong>on</strong>g> can ignite and start to burn. This process, referred to<br />
as “sp<strong>on</strong>taneous combusti<strong>on</strong>”, is the most comm<strong>on</strong> cause for <str<strong>on</strong>g>coal</str<strong>on</strong>g> <str<strong>on</strong>g>fire</str<strong>on</strong>g>s of large extent. Sp<strong>on</strong>taneous<br />
combusti<strong>on</strong> processes can be accelerated through human impact. Mining operati<strong>on</strong>s expose formerly<br />
covered <str<strong>on</strong>g>coal</str<strong>on</strong>g> to oxidati<strong>on</strong> processes and additi<strong>on</strong>ally lead to the accumulati<strong>on</strong> of large <str<strong>on</strong>g>coal</str<strong>on</strong>g> waste and<br />
storage piles (CHAIKEN et al. 1980, KIM & CHAIKEN 1993, WALKER 1999, VAN GENDEREN &<br />
GUAN1997). Coal <str<strong>on</strong>g>fire</str<strong>on</strong>g>s can also be ignited by lightning, forest- or peat <str<strong>on</strong>g>fire</str<strong>on</strong>g>s, mining accidents or<br />
careless human interacti<strong>on</strong> (PAGE et al. 1997, RUECKER 2003, JIA 2002).<br />
Depending <strong>on</strong> cause, locati<strong>on</strong>, age and burning intensity, <str<strong>on</strong>g>coal</str<strong>on</strong>g> <str<strong>on</strong>g>fire</str<strong>on</strong>g>s can be classified into different<br />
types. Coal <str<strong>on</strong>g>fire</str<strong>on</strong>g>s can be human induced, when <str<strong>on</strong>g>coal</str<strong>on</strong>g> seams in <str<strong>on</strong>g>areas</str<strong>on</strong>g> of mining activity start to smolder<br />
or burn due to anthropogenic causes. They can occur naturally, when the <str<strong>on</strong>g>fire</str<strong>on</strong>g> is a result of natural<br />
sp<strong>on</strong>taneous combusti<strong>on</strong>. Furthermore, underground and surface <str<strong>on</strong>g>coal</str<strong>on</strong>g> <str<strong>on</strong>g>fire</str<strong>on</strong>g>s, cold and hot <str<strong>on</strong>g>coal</str<strong>on</strong>g> <str<strong>on</strong>g>fire</str<strong>on</strong>g>s,<br />
paleo- and recent <str<strong>on</strong>g>coal</str<strong>on</strong>g> <str<strong>on</strong>g>fire</str<strong>on</strong>g>s, as well as <str<strong>on</strong>g>coal</str<strong>on</strong>g> <str<strong>on</strong>g>fire</str<strong>on</strong>g>s in <str<strong>on</strong>g>coal</str<strong>on</strong>g>-seams, <str<strong>on</strong>g>coal</str<strong>on</strong>g> waste- or <str<strong>on</strong>g>coal</str<strong>on</strong>g> storage piles can be<br />
differentiated (ZHANG, J., et al. 2004a). VAN GENDEREN & GUAN (1997) additi<strong>on</strong>ally classify shallow<br />
(0-10m), intermediate (10-30m) and deep <str<strong>on</strong>g>fire</str<strong>on</strong>g>s (>30m), depending <strong>on</strong> their locati<strong>on</strong> underground. The<br />
oldest documented <str<strong>on</strong>g>coal</str<strong>on</strong>g> <str<strong>on</strong>g>fire</str<strong>on</strong>g> <strong>on</strong> a global scale, which has been burning for over 2,000 years, is located<br />
in New South Wales, Australia (ZHANG, J., et al. 2004a). Another case that has attracted str<strong>on</strong>g public<br />
attenti<strong>on</strong> is the subsurface <str<strong>on</strong>g>coal</str<strong>on</strong>g> <str<strong>on</strong>g>fire</str<strong>on</strong>g> in Centralia in Pennsylvania, U.S., which started in 1962. Here,<br />
between 1980 and 1998 a whole city had to be evacuated and relocated. The slowly advancing <str<strong>on</strong>g>coal</str<strong>on</strong>g><br />
<str<strong>on</strong>g>fire</str<strong>on</strong>g> underneath the city endangered houses and infrastructure. Even today the <str<strong>on</strong>g>fire</str<strong>on</strong>g> still leads to the<br />
collapse of formerly inhabited ground.<br />
Coal <str<strong>on</strong>g>fire</str<strong>on</strong>g>s in China are menti<strong>on</strong>ed in historic documents as early as 1000 AC in the travel report of Li<br />
Dao Yuan, who explored Northwest China during the “Northern S<strong>on</strong>g Dynasty” (960-1280 AC). Also<br />
the travel documents of Marco Polo (1254-1324 BC) menti<strong>on</strong> the “burning mountains al<strong>on</strong>g the silk<br />
road” as well as paleo <str<strong>on</strong>g>coal</str<strong>on</strong>g> <str<strong>on</strong>g>fire</str<strong>on</strong>g>s in Xinjiang, which are dated back to be of Pleistocene age (GIELISCH<br />
2002, SCHNEIDER 1996). Today, China is the leading country c<strong>on</strong>cerning <str<strong>on</strong>g>coal</str<strong>on</strong>g> producti<strong>on</strong>,<br />
c<strong>on</strong>sumpti<strong>on</strong> and export, whereas Russia and the US rank first and sec<strong>on</strong>d in terms of <str<strong>on</strong>g>coal</str<strong>on</strong>g> reserves <strong>on</strong><br />
a global scale. Annual Chinese <str<strong>on</strong>g>coal</str<strong>on</strong>g> producti<strong>on</strong> averages above 1400 Mio. t<strong>on</strong>s (WALKER, 1999). The<br />
energy supply for approximately 1.3 Billi<strong>on</strong> Chinese people, of which over 25% live in cities, is<br />
mainly provided by <str<strong>on</strong>g>coal</str<strong>on</strong>g>. Oil accounts for <strong>on</strong>ly 20% of the total energy supply. Only two nuclear<br />
power plants exist and gas producti<strong>on</strong> is negligible. Next to <str<strong>on</strong>g>coal</str<strong>on</strong>g>, <strong>on</strong>ly hydroelectric power is of higher<br />
- 30 -
elevance, showing increasing growth rates in Southwest China. Therefore, the country at present<br />
accounts for 28% of the world’s <str<strong>on</strong>g>coal</str<strong>on</strong>g> use with projected requirements of 1632 Mio. t<strong>on</strong>s <str<strong>on</strong>g>coal</str<strong>on</strong>g><br />
equivalent in 2010 and faces the problem of numerous unc<strong>on</strong>trolled burning <str<strong>on</strong>g>coal</str<strong>on</strong>g> <str<strong>on</strong>g>fire</str<strong>on</strong>g>s (DANIEL 1994,<br />
WALKER 1999, TODD & FENGJUN 1997).<br />
Nowadays, the main <str<strong>on</strong>g>coal</str<strong>on</strong>g> <str<strong>on</strong>g>fire</str<strong>on</strong>g> <str<strong>on</strong>g>areas</str<strong>on</strong>g> stretch al<strong>on</strong>g the <str<strong>on</strong>g>coal</str<strong>on</strong>g> mining belt in China, which extends for<br />
5000km from East to West al<strong>on</strong>g the North of the country. Here more than 50 <str<strong>on</strong>g>coal</str<strong>on</strong>g> fields affected by<br />
<str<strong>on</strong>g>coal</str<strong>on</strong>g> <str<strong>on</strong>g>fire</str<strong>on</strong>g>s have been identified (VAN GENDEREN & GUAN. 1997). At present in China an estimated 20-<br />
30 Mio. t<strong>on</strong>s of <str<strong>on</strong>g>coal</str<strong>on</strong>g> burn each year. This corresp<strong>on</strong>ds to the amount of Germany’s annual hard <str<strong>on</strong>g>coal</str<strong>on</strong>g><br />
producti<strong>on</strong>. Actually, the tenfold amount of the resource is lost, since <str<strong>on</strong>g>coal</str<strong>on</strong>g> adjacent to a <str<strong>on</strong>g>coal</str<strong>on</strong>g> <str<strong>on</strong>g>fire</str<strong>on</strong>g><br />
becomes inaccessible. The ec<strong>on</strong>omic loss of the valuable resource in China is estimated to sum up to<br />
total 4.2 Billi<strong>on</strong> t<strong>on</strong>s since 1960 (BETHGE, 1999). Thus, China faces the world’s biggest problem of<br />
<str<strong>on</strong>g>coal</str<strong>on</strong>g> <str<strong>on</strong>g>fire</str<strong>on</strong>g>s both in terms of the spatial area affected and the amount of <str<strong>on</strong>g>coal</str<strong>on</strong>g> lost each year.<br />
Besides the ec<strong>on</strong>omic loss, <str<strong>on</strong>g>coal</str<strong>on</strong>g> <str<strong>on</strong>g>fire</str<strong>on</strong>g>s pose many envir<strong>on</strong>mental threats. The <str<strong>on</strong>g>fire</str<strong>on</strong>g>s produce large<br />
amounts of greenhouse-relevant and partially toxic gasses including CO 2 , CH 4 , NO x , N 2 O, CO and<br />
SO 2 . According to most recent estimati<strong>on</strong>s <str<strong>on</strong>g>coal</str<strong>on</strong>g> <str<strong>on</strong>g>fire</str<strong>on</strong>g>s in China c<strong>on</strong>tribute about 0.1% to 0.2% of the<br />
annual human induced CO 2 emissi<strong>on</strong>s globally. They c<strong>on</strong>tribute 12% of all Chinese <str<strong>on</strong>g>coal</str<strong>on</strong>g>-<str<strong>on</strong>g>based</str<strong>on</strong>g> carb<strong>on</strong><br />
emissi<strong>on</strong>s in the form of CO 2 (KUENZER et al. in review, WALKER 1999). In additi<strong>on</strong>, <str<strong>on</strong>g>coal</str<strong>on</strong>g> <str<strong>on</strong>g>fire</str<strong>on</strong>g>s lead to<br />
the degradati<strong>on</strong> of their direct surrounding area through significant aerosol input to water sources and<br />
agricultural <str<strong>on</strong>g>areas</str<strong>on</strong>g>. Additi<strong>on</strong>ally, the toxic fumes released pose a threat to the health of the local<br />
inhabitants (SARAF et al. 1995, RATHORE & WRIGHT 1993, LIVINGOOD et al. 1999). Furthermore, land<br />
subsidence can occur due to the loss of volume underground, when a <str<strong>on</strong>g>coal</str<strong>on</strong>g> seam, supporting several<br />
layers of overlying strata, turns into ash. The resulting slow or very sudden subsidence can be a threat<br />
to infrastructure, local inhabitants and miners (CHEN 1997, GUAN 1989, RATHORE & WRIGHT 1993,<br />
ZHANG, X. 1998, WRIGHT & STOW 1999, PRAKASH et al. 2001). Each year, several thousand workers<br />
are killed in mining accidents, which are quite often also <str<strong>on</strong>g>coal</str<strong>on</strong>g> <str<strong>on</strong>g>fire</str<strong>on</strong>g> related (ZHANG et al. 2004a,<br />
BETHGE 1999, PENNIG 2002, BOEKEMEIER et al. 2002, JIA 2002).<br />
These negative envir<strong>on</strong>mental impacts of <str<strong>on</strong>g>coal</str<strong>on</strong>g> <str<strong>on</strong>g>fire</str<strong>on</strong>g>s explain the urgent need for methodologies to map,<br />
analyze and m<strong>on</strong>itor the <str<strong>on</strong>g>coal</str<strong>on</strong>g> <str<strong>on</strong>g>fire</str<strong>on</strong>g> regi<strong>on</strong>s. Since many Chinese mining regi<strong>on</strong>s are located in remote<br />
<str<strong>on</strong>g>areas</str<strong>on</strong>g>, airborne or satellite remote sensing can play a key role for <str<strong>on</strong>g>coal</str<strong>on</strong>g> <str<strong>on</strong>g>fire</str<strong>on</strong>g> detecti<strong>on</strong> and m<strong>on</strong>itoring.<br />
With respect to the large spatial extent of the Chinese <str<strong>on</strong>g>coal</str<strong>on</strong>g> mining belt and the number of existing <str<strong>on</strong>g>coal</str<strong>on</strong>g><br />
<str<strong>on</strong>g>fire</str<strong>on</strong>g> <str<strong>on</strong>g>areas</str<strong>on</strong>g>, remote sensing is a powerful tool for the generati<strong>on</strong> of land cover- and <str<strong>on</strong>g>coal</str<strong>on</strong>g> <str<strong>on</strong>g>fire</str<strong>on</strong>g> maps.<br />
Reflective and thermal indicators can be derived from satellite data to develop early warning- or <str<strong>on</strong>g>risk</str<strong>on</strong>g><br />
assessment strategies and to implement priority schemes for future <str<strong>on</strong>g>coal</str<strong>on</strong>g> <str<strong>on</strong>g>fire</str<strong>on</strong>g> extinguishing activities.<br />
1.2. Remote Sensing of Coal Fires: Brief Status of Research<br />
Documented <str<strong>on</strong>g>coal</str<strong>on</strong>g> <str<strong>on</strong>g>fire</str<strong>on</strong>g> research <str<strong>on</strong>g>based</str<strong>on</strong>g> <strong>on</strong> remote sensing data started around 1963, when a company<br />
producing airborne thermal cameras, <strong>test</strong>ed their equipment above burning <str<strong>on</strong>g>coal</str<strong>on</strong>g> waste piles in<br />
Scrant<strong>on</strong>, Pennsylvania. The thermal imagery clearly showed the burning <str<strong>on</strong>g>areas</str<strong>on</strong>g> within the <str<strong>on</strong>g>coal</str<strong>on</strong>g> waste<br />
piles as light grey values (SLAVECKI 1964). Further aerial surveys with thermal cameras in the 1960s<br />
and 1970s were c<strong>on</strong>ducted by MOXHAM & GREENE (1967), GREENE et al. (1968), KNUTH et al.<br />
(1968), FISHER & KNUTH (1968), RABCHEVSKY (1972) and ELLYETT & FLEMING (1974). Their main<br />
research foci were investigati<strong>on</strong>s of <str<strong>on</strong>g>coal</str<strong>on</strong>g> <str<strong>on</strong>g>fire</str<strong>on</strong>g>s in the U.S. at a very local scale (ZHANG, J., et al. 2004a).<br />
- 31 -
These approaches were dominated by visual interpretati<strong>on</strong> and the localizati<strong>on</strong> of the well-known <str<strong>on</strong>g>fire</str<strong>on</strong>g>s<br />
within the imagery. Density slicing was used exclusively to extract the <str<strong>on</strong>g>fire</str<strong>on</strong>g>s from the image data.<br />
In the early 1980s <str<strong>on</strong>g>coal</str<strong>on</strong>g> <str<strong>on</strong>g>fire</str<strong>on</strong>g>s were already studied in several countries. Still aerial remote sensing was<br />
the main tool applied. In 1983 multi-<strong>spectral</strong> scanner data and thermal infrared scanner data was used<br />
for the investigati<strong>on</strong> of <str<strong>on</strong>g>coal</str<strong>on</strong>g> <str<strong>on</strong>g>fire</str<strong>on</strong>g>s in the Chinese regi<strong>on</strong>s of Taiyuan Xishan in Shanxi province (GUAN<br />
1984, LI 1985). Coal <str<strong>on</strong>g>fire</str<strong>on</strong>g> research <str<strong>on</strong>g>based</str<strong>on</strong>g> <strong>on</strong> aerial multi<strong>spectral</strong> scanner data c<strong>on</strong>tinued in India, where<br />
BHATTACHARYA et al. (1991, 1994), MUKHERJEE (1991) and PRAKASH (1995) investigated the Jharia<br />
<str<strong>on</strong>g>coal</str<strong>on</strong>g> field, generating <str<strong>on</strong>g>coal</str<strong>on</strong>g> <str<strong>on</strong>g>fire</str<strong>on</strong>g> maps derived from the aerial thermal data <str<strong>on</strong>g>based</str<strong>on</strong>g> <strong>on</strong> ground truth<br />
knowledge. Details <strong>on</strong> the capability of <str<strong>on</strong>g>coal</str<strong>on</strong>g> <str<strong>on</strong>g>fire</str<strong>on</strong>g> detecti<strong>on</strong> from airborne thermal scanner data are<br />
presented by ZHANG, X. et al. 2004.<br />
The Jharia regi<strong>on</strong> was later studied <str<strong>on</strong>g>based</str<strong>on</strong>g> <strong>on</strong> satellite data by MANSOR et al. (1994), using thermal and<br />
mid-infrared NOAA-AVHRR and thermal Landsat-5 TM data. SARAF et al. (1995) as well as<br />
PRAKASH et al. (1997), PRAKASH & GUPTA (1998) and GUPTA & PRAKASH (1999) studied the <str<strong>on</strong>g>coal</str<strong>on</strong>g><br />
<str<strong>on</strong>g>fire</str<strong>on</strong>g>s in the Jharia <str<strong>on</strong>g>coal</str<strong>on</strong>g> field, using Landsat-5 TM thermal band data with 120m spatial resoluti<strong>on</strong>.<br />
Their studies focused <strong>on</strong> <str<strong>on</strong>g>coal</str<strong>on</strong>g> <str<strong>on</strong>g>fire</str<strong>on</strong>g> detecti<strong>on</strong> within the satellite data, supported by ground truth, as well<br />
as <strong>on</strong> depth estimati<strong>on</strong> of subsurface <str<strong>on</strong>g>coal</str<strong>on</strong>g> <str<strong>on</strong>g>fire</str<strong>on</strong>g>s. The spatial resoluti<strong>on</strong> of Landsat-5 TM was sufficient<br />
for the detecti<strong>on</strong> of surface <str<strong>on</strong>g>fire</str<strong>on</strong>g>s but often proved too coarse to detect very deep or small <str<strong>on</strong>g>coal</str<strong>on</strong>g> <str<strong>on</strong>g>fire</str<strong>on</strong>g>s<br />
(ZHANG, X. 1998). Even Landsat-5 TM nighttime data often was too coarse for the early detecti<strong>on</strong> of<br />
new <str<strong>on</strong>g>coal</str<strong>on</strong>g> <str<strong>on</strong>g>fire</str<strong>on</strong>g>s (VAN GENDEREN & GUAN 1997). Furthermore, from 1997 <strong>on</strong> the thermal band of<br />
Landsat-5 was not l<strong>on</strong>ger operati<strong>on</strong>al.<br />
Overall, studies applying Landsat-5 TM band 6 were mainly limited to the exact demarcati<strong>on</strong> of hot<br />
and large surface <str<strong>on</strong>g>coal</str<strong>on</strong>g> <str<strong>on</strong>g>fire</str<strong>on</strong>g>s and the rough localizati<strong>on</strong> of hot or large underground <str<strong>on</strong>g>coal</str<strong>on</strong>g> <str<strong>on</strong>g>fire</str<strong>on</strong>g>s supported<br />
by field measurements. Research undertaken included the applicati<strong>on</strong> of this satellite data to different<br />
locati<strong>on</strong>s, the evaluati<strong>on</strong> of density slicing techniques for <str<strong>on</strong>g>coal</str<strong>on</strong>g> <str<strong>on</strong>g>fire</str<strong>on</strong>g> detecti<strong>on</strong>, and temperature retrieval<br />
in case of <str<strong>on</strong>g>coal</str<strong>on</strong>g> <str<strong>on</strong>g>fire</str<strong>on</strong>g>s exceeding several pixels in size. Furthermore, time series analyses were pursued to<br />
describe the movement of the <str<strong>on</strong>g>fire</str<strong>on</strong>g>s. First relief-<str<strong>on</strong>g>based</str<strong>on</strong>g> thermal calibrati<strong>on</strong> methods, differencing<br />
methods between thermal daytime and nighttime data and the combined interpretati<strong>on</strong> of the two were<br />
employed. In additi<strong>on</strong>, combining the informati<strong>on</strong> of Landsat band 6 with band 5 and 7 (1.55-1.75µm<br />
and 2.08-2.35µm) was <strong>test</strong>ed. Based <strong>on</strong> the ‘dual band method’ developed by MATSON & DOZIER<br />
(1981), the size and temperature of very hot surface <str<strong>on</strong>g>coal</str<strong>on</strong>g> <str<strong>on</strong>g>fire</str<strong>on</strong>g>s occupying sub-pixel porti<strong>on</strong>s could be<br />
calculated (ZHANG, X. 1998, ZHANG, X. et al. 1997, PRAKASH & GUPTA 1999). This approach has<br />
also been proposed for Aster data with 6 bands of 30m resoluti<strong>on</strong> in the SWIR and 5 bands of 90m<br />
resoluti<strong>on</strong> in the TIR (WANG, 2002). TETZLAFF (2004) discusses the detectability of <str<strong>on</strong>g>coal</str<strong>on</strong>g> <str<strong>on</strong>g>fire</str<strong>on</strong>g>s with<br />
different sensors depending <strong>on</strong> the size and temperature of a <str<strong>on</strong>g>fire</str<strong>on</strong>g>. SPOT-XS data at 20m spatial<br />
resoluti<strong>on</strong> proved to be less useful for <str<strong>on</strong>g>coal</str<strong>on</strong>g> <str<strong>on</strong>g>fire</str<strong>on</strong>g> research. Due to the limited swath width of <strong>on</strong>ly 60 km<br />
and the lack of a thermal band the sensor never gained high relevance (VAN GENDEREN & GUAN<br />
1997).<br />
Generally, satellite data with a coarser spatial resoluti<strong>on</strong> than that of Landsat-TM was rarely used for<br />
<str<strong>on</strong>g>coal</str<strong>on</strong>g> <str<strong>on</strong>g>fire</str<strong>on</strong>g> research and did not yield promising results. Though MANSOR et al. (1994) could spot very<br />
hot surface <str<strong>on</strong>g>coal</str<strong>on</strong>g> <str<strong>on</strong>g>fire</str<strong>on</strong>g>s in Jharia, ZHANG, X. (1998) showed that the spatial resoluti<strong>on</strong> of NOAA-<br />
AVHRR data (1km) in general is too low to detect underground <str<strong>on</strong>g>coal</str<strong>on</strong>g> <str<strong>on</strong>g>fire</str<strong>on</strong>g>s in Northwest China. The<br />
same applies to unenhanced 1km resoluti<strong>on</strong> data from MODIS. In thermal pixels with a spatial<br />
- 32 -
esoluti<strong>on</strong> of 1km the subsurface <str<strong>on</strong>g>coal</str<strong>on</strong>g> <str<strong>on</strong>g>fire</str<strong>on</strong>g> anomalies are usually not large- and not hot enough to have<br />
a measurable impact <strong>on</strong> the overall thermal signal of the pixel. However, HECKER (2003) could show<br />
that MODIS data with several thermal bands can support the extracti<strong>on</strong> of thermal anomalies resulting<br />
from surface <str<strong>on</strong>g>coal</str<strong>on</strong>g> <str<strong>on</strong>g>fire</str<strong>on</strong>g>s. Ratio images from MODIS nighttime data (band 20 versus band 32) were used<br />
to detect surface <str<strong>on</strong>g>coal</str<strong>on</strong>g> <str<strong>on</strong>g>fire</str<strong>on</strong>g>s <str<strong>on</strong>g>based</str<strong>on</strong>g> <strong>on</strong> related thermal anomalies, even where the <str<strong>on</strong>g>fire</str<strong>on</strong>g>s <strong>on</strong>ly covered a<br />
fracti<strong>on</strong> of the pixel size. Nevertheless, in daytime ratio images these anomalies were masked by solar<br />
effects. Underground <str<strong>on</strong>g>coal</str<strong>on</strong>g> <str<strong>on</strong>g>fire</str<strong>on</strong>g>s could not be detected.<br />
Also sensors with an intermediate spatial resoluti<strong>on</strong> like the DLR sensor BIRD with 185m pixel size<br />
can <strong>on</strong>ly detect extremely hot surface <str<strong>on</strong>g>coal</str<strong>on</strong>g> <str<strong>on</strong>g>fire</str<strong>on</strong>g>s in the mid infrared (3,4-4,2µm). However, surface <str<strong>on</strong>g>coal</str<strong>on</strong>g><br />
<str<strong>on</strong>g>fire</str<strong>on</strong>g>s, such as those found in the Jharia <str<strong>on</strong>g>coal</str<strong>on</strong>g> field in India, the site of over 70 major mine <str<strong>on</strong>g>fire</str<strong>on</strong>g>s,<br />
(PRAKASH & GUPTA 1999, PRAKASH et al. 1997) or in the Ruqigou <str<strong>on</strong>g>coal</str<strong>on</strong>g> mining area of Ningxia Hui<br />
Aut<strong>on</strong>omous Regi<strong>on</strong>, China, are not the standard case (GUPTA & PRAKASH 1998, ZHANG, J., et al.<br />
2004a, VOIGT et al. 2004). Most <str<strong>on</strong>g>coal</str<strong>on</strong>g> <str<strong>on</strong>g>fire</str<strong>on</strong>g>s are deeper subsurface <str<strong>on</strong>g>fire</str<strong>on</strong>g>s. These underground <str<strong>on</strong>g>fire</str<strong>on</strong>g>s pose a<br />
great challenge for detecti<strong>on</strong> and quantificati<strong>on</strong> by means of remote sensing. For these <str<strong>on</strong>g>fire</str<strong>on</strong>g>s, leading to<br />
<strong>on</strong>ly subtle thermal surface anomalies, Landsat-7 ETM+ data with a spatial resoluti<strong>on</strong> of 60m in the<br />
thermal band is a promising data source for new developments in <str<strong>on</strong>g>coal</str<strong>on</strong>g> <str<strong>on</strong>g>fire</str<strong>on</strong>g> research as shown by<br />
ZHANG, J. (2004) and TETZLAFF (2004). For a very detailed overview <strong>on</strong> <str<strong>on</strong>g>coal</str<strong>on</strong>g> <str<strong>on</strong>g>fire</str<strong>on</strong>g> research before<br />
2000 see ZHANG, J. et al. (2004a).<br />
It can be c<strong>on</strong>cluded that the main foci in the field of remote sensing <str<strong>on</strong>g>based</str<strong>on</strong>g> <str<strong>on</strong>g>coal</str<strong>on</strong>g> <str<strong>on</strong>g>fire</str<strong>on</strong>g> research have been<br />
thermal investigati<strong>on</strong>s <str<strong>on</strong>g>based</str<strong>on</strong>g> <strong>on</strong> different airborne and spaceborne sensors. Different methods have<br />
been applied for the extracti<strong>on</strong> of thermal anomalies. The detecti<strong>on</strong> capability of the thermal bands of<br />
NOAA-AVHRR, MODIS, BIRD, Landsat-5 TM, Landsat 7 ETM+ and Aster has been evaluated by<br />
many authors. The applicati<strong>on</strong> of different techniques like density slicing (PRAKASH et al. 1997,<br />
ZHANG, X. 1998, ROSEMA et al 1999), automated statistical analysis (ZHANG, J. 2004), the dual band<br />
method (PRAKASH & GUPTA 1998, ZHANG, X. 1998) or multitemporal analysis (PRAKASH et al. 1999)<br />
has been pursued within recent years.<br />
Coal <str<strong>on</strong>g>fire</str<strong>on</strong>g> research <str<strong>on</strong>g>based</str<strong>on</strong>g> <strong>on</strong> multi<strong>spectral</strong> reflective remote sensing informati<strong>on</strong> has <strong>on</strong>ly been<br />
c<strong>on</strong>ducted in rare cases, focusing <strong>on</strong> local descrpti<strong>on</strong>s of <str<strong>on</strong>g>coal</str<strong>on</strong>g> <str<strong>on</strong>g>fire</str<strong>on</strong>g> area envir<strong>on</strong>ments (VAN GENDEREN<br />
& GUAN 1997, PRAKASH & Gupta 1998, 1999, PRAKASH et al. 2001). Mostly, reflective parameters<br />
for <str<strong>on</strong>g>coal</str<strong>on</strong>g> <str<strong>on</strong>g>fire</str<strong>on</strong>g> detecti<strong>on</strong> were not c<strong>on</strong>sidered to be as obvious and representative as thermal anomalies in<br />
satellite data with c<strong>on</strong>tinuously improving spatial resoluti<strong>on</strong> in the thermal bands. N<strong>on</strong>-thermal data<br />
have <strong>on</strong>ly been used for the “synoptic overview” <strong>on</strong> the regi<strong>on</strong>al structure and tect<strong>on</strong>ic setting of the<br />
study <str<strong>on</strong>g>areas</str<strong>on</strong>g> or the detecti<strong>on</strong> of burned rock related to paleo <str<strong>on</strong>g>coal</str<strong>on</strong>g> <str<strong>on</strong>g>fire</str<strong>on</strong>g>s (VAN GENDEREN & GUAN 1997).<br />
Starting in 2003 a Sino German Research Initiative has been addressing the problem of <str<strong>on</strong>g>coal</str<strong>on</strong>g> <str<strong>on</strong>g>fire</str<strong>on</strong>g>s<br />
involving different research disciplines. Remote sensing, geology, geophysics, chemistry and mining<br />
technology c<strong>on</strong>tribute to investigati<strong>on</strong>s <strong>on</strong> <str<strong>on</strong>g>coal</str<strong>on</strong>g> <str<strong>on</strong>g>fire</str<strong>on</strong>g> area demarcati<strong>on</strong>, thermal anomaly detecti<strong>on</strong>, <str<strong>on</strong>g>fire</str<strong>on</strong>g><br />
quantificati<strong>on</strong>, 3D modeling, sp<strong>on</strong>taneous combusti<strong>on</strong> processes, <str<strong>on</strong>g>fire</str<strong>on</strong>g> dynamics and envir<strong>on</strong>mental<br />
impacts. This project <strong>on</strong> <str<strong>on</strong>g>coal</str<strong>on</strong>g> <str<strong>on</strong>g>fire</str<strong>on</strong>g>s in China is funded by the German Ministry of Educati<strong>on</strong> and<br />
Science (BMBF) <strong>on</strong> the German side. The Ministry of Science and Technology (MOST) is resp<strong>on</strong>sible<br />
for funding <strong>on</strong> the Chinese side. The initiative is coordinated by the German Remote Sensing Data<br />
Center (DFD) of the German Aerospace Center (DLR). The research presented in this thesis was<br />
undertaken within the framework of this initiative and a foregoing remote sensing project.<br />
- 33 -
The overall goal of the research initiative is to provide the scientific basis and techniques, which allow<br />
the efficient assessment, m<strong>on</strong>itoring and development of extincti<strong>on</strong> strategies for <str<strong>on</strong>g>coal</str<strong>on</strong>g> <str<strong>on</strong>g>fire</str<strong>on</strong>g>s in China.<br />
Extincti<strong>on</strong> strategies to reduce the Kyoto relevant emissi<strong>on</strong>s released through this envir<strong>on</strong>mental<br />
hazard shall be supported. The objectives of the remote sensing part of the project are to detect the<br />
<str<strong>on</strong>g>coal</str<strong>on</strong>g> <str<strong>on</strong>g>fire</str<strong>on</strong>g>s from thermal Landsat-7 ETM+, BIRD and ASTER daytime and nighttime data operati<strong>on</strong>ally<br />
and to demarcate possible <str<strong>on</strong>g>coal</str<strong>on</strong>g> <str<strong>on</strong>g>fire</str<strong>on</strong>g> <str<strong>on</strong>g>areas</str<strong>on</strong>g> and future <str<strong>on</strong>g>coal</str<strong>on</strong>g> <str<strong>on</strong>g>fire</str<strong>on</strong>g>s <str<strong>on</strong>g>risk</str<strong>on</strong>g> <str<strong>on</strong>g>areas</str<strong>on</strong>g> <str<strong>on</strong>g>based</str<strong>on</strong>g> <strong>on</strong> multi<strong>spectral</strong><br />
informati<strong>on</strong>. Furthermore, it is intended to analyze the landcover patterns in the <str<strong>on</strong>g>coal</str<strong>on</strong>g> <str<strong>on</strong>g>fire</str<strong>on</strong>g> <str<strong>on</strong>g>areas</str<strong>on</strong>g>.<br />
Multitemporal land cover analysis can reveal where new mining <str<strong>on</strong>g>areas</str<strong>on</strong>g> develop and if unc<strong>on</strong>trolled<br />
private mining is spreading. This will help to understand the link between land cover changes, mining<br />
development and <str<strong>on</strong>g>coal</str<strong>on</strong>g> <str<strong>on</strong>g>fire</str<strong>on</strong>g>s. It shall be observed if <str<strong>on</strong>g>coal</str<strong>on</strong>g> <str<strong>on</strong>g>fire</str<strong>on</strong>g>s tend to grow or shrink, and how l<strong>on</strong>g<br />
extinguished <str<strong>on</strong>g>fire</str<strong>on</strong>g>s will remain extinct. In combinati<strong>on</strong> with the research results of the other<br />
geoscientific disciplines the remote sensing results can support the overall understanding of <str<strong>on</strong>g>coal</str<strong>on</strong>g> <str<strong>on</strong>g>fire</str<strong>on</strong>g><br />
related processes and the quantitative assessment of the problem. This can support the development of<br />
a comprehensive m<strong>on</strong>itoring and extinguishing scheme.<br />
Building <strong>on</strong> remote sensing <str<strong>on</strong>g>based</str<strong>on</strong>g> <str<strong>on</strong>g>coal</str<strong>on</strong>g> <str<strong>on</strong>g>fire</str<strong>on</strong>g> research completed before 2001, a major challenge in this<br />
recent project is the development of automated methods, which need to be applicable <strong>on</strong> a large spatial<br />
scale. To implement operati<strong>on</strong>al m<strong>on</strong>itoring, techniques like knowledge <str<strong>on</strong>g>based</str<strong>on</strong>g> temperature<br />
thresholding, <strong>on</strong> screen digitizati<strong>on</strong> of features, manual land cover classificati<strong>on</strong>s or locally adapted<br />
image arithmetic are inefficient. Therefore – <str<strong>on</strong>g>based</str<strong>on</strong>g> <strong>on</strong> detailed regi<strong>on</strong>al studies –automated algorithms<br />
for <str<strong>on</strong>g>coal</str<strong>on</strong>g> <str<strong>on</strong>g>fire</str<strong>on</strong>g> detecti<strong>on</strong> and demarcati<strong>on</strong> applicable over large geographic regi<strong>on</strong>s are being developed.<br />
1.3. Research Objectives<br />
This thesis aims at the automated demarcati<strong>on</strong> of <str<strong>on</strong>g>coal</str<strong>on</strong>g> <str<strong>on</strong>g>fire</str<strong>on</strong>g> <str<strong>on</strong>g>areas</str<strong>on</strong>g> and <str<strong>on</strong>g>coal</str<strong>on</strong>g> <str<strong>on</strong>g>fire</str<strong>on</strong>g> <str<strong>on</strong>g>risk</str<strong>on</strong>g> <str<strong>on</strong>g>areas</str<strong>on</strong>g>. It focuses <strong>on</strong><br />
multi<strong>spectral</strong> data analyses to find <strong>spectral</strong> features or indicators, which can support the delineati<strong>on</strong> of<br />
potential <str<strong>on</strong>g>coal</str<strong>on</strong>g> <str<strong>on</strong>g>fire</str<strong>on</strong>g> <str<strong>on</strong>g>areas</str<strong>on</strong>g>. At the same time <str<strong>on</strong>g>coal</str<strong>on</strong>g> <str<strong>on</strong>g>fire</str<strong>on</strong>g> area demarcati<strong>on</strong> is developed to have a synergetic<br />
effect with the algorithm for thermal anomaly detecti<strong>on</strong>, implemented and presented by ZHANG, J.<br />
(2004).<br />
Automated statistical analysis can reach good results extracting thermal anomalies resulting from <str<strong>on</strong>g>coal</str<strong>on</strong>g><br />
<str<strong>on</strong>g>fire</str<strong>on</strong>g>s from thermal nighttime data. This applies, although these anomalies usually show <strong>on</strong>ly a very<br />
subtle c<strong>on</strong>trast towards the background pixels not influenced by <str<strong>on</strong>g>coal</str<strong>on</strong>g> <str<strong>on</strong>g>fire</str<strong>on</strong>g>s (ZHANG, J. 2004). The<br />
majority of <str<strong>on</strong>g>coal</str<strong>on</strong>g> <str<strong>on</strong>g>fire</str<strong>on</strong>g>s occur underground. In c<strong>on</strong>trast to surface <str<strong>on</strong>g>coal</str<strong>on</strong>g> <str<strong>on</strong>g>fire</str<strong>on</strong>g>s a lot of energy is absorbed by<br />
the overlaying bedrock. Therefore, subsurface <str<strong>on</strong>g>fire</str<strong>on</strong>g>s do not produce very str<strong>on</strong>g thermal signals.<br />
Anomalies are typically 3-10 °C warmer than the unaffected background. Thus, automated statistical<br />
analyses of thermal anomalies still leads to the extracti<strong>on</strong> of anomalous pixels that are not related to<br />
<str<strong>on</strong>g>coal</str<strong>on</strong>g> <str<strong>on</strong>g>fire</str<strong>on</strong>g>s, which cannot necessarily be distinguished from a <str<strong>on</strong>g>coal</str<strong>on</strong>g> <str<strong>on</strong>g>fire</str<strong>on</strong>g> anomaly. These are thermal<br />
anomalies caused by industry, settlement, biomass <str<strong>on</strong>g>fire</str<strong>on</strong>g>s, limest<strong>on</strong>e burning and uneven solar heating in<br />
both daytime and nighttime images (RATHORE & WRIGHT 1993, ZHANG, X. 1998, ZHANG, J. et al.<br />
2004a). Especially the accurate automated extracti<strong>on</strong> of <str<strong>on</strong>g>coal</str<strong>on</strong>g> <str<strong>on</strong>g>fire</str<strong>on</strong>g> related thermal anomalies from<br />
daytime data, which includes a str<strong>on</strong>g solar comp<strong>on</strong>ent in the thermal band, remains challenging<br />
(DENG et al. 2001, ZHANG, X., 1998). Based <strong>on</strong> measurements, taken during the 2002 field campaign,<br />
ZHANG, J. (2004) could show that thermal anomalies – even in the close vicinity of very hot cracks –<br />
were masked by the effect of solar heating already <strong>on</strong>e hour past sunrise.<br />
- 34 -
This problem can usually be overcome with thermal nighttime data. Such data offers the advantage of<br />
a much lower solar influence within the thermal bands than found in daytime data. ROSEMA et al.<br />
(1999) could show that the difference between an east- and a west facing slope at 10:30 am can be<br />
over 12 K, while in nighttime data (22:30) the c<strong>on</strong>trast is less than 2 K. However, nighttime satellite<br />
data is very expensive and difficult to acquire. It cannot be c<strong>on</strong>sidered a standard product, which is<br />
accessible for large <str<strong>on</strong>g>areas</str<strong>on</strong>g> (DENG et al. 2001). Therefore, nighttime satellite datasets of Landsat or<br />
Aster cannot be employed for a large scale thermal m<strong>on</strong>itoring nor can they al<strong>on</strong>e be used as the base<br />
for <str<strong>on</strong>g>coal</str<strong>on</strong>g> <str<strong>on</strong>g>fire</str<strong>on</strong>g> detecti<strong>on</strong>. VAN GENDEREN & GUAN (1997) state that for operati<strong>on</strong>al routine <str<strong>on</strong>g>coal</str<strong>on</strong>g> <str<strong>on</strong>g>fire</str<strong>on</strong>g><br />
detecti<strong>on</strong> the user will need to work predominantly with daytime data. This complicates the detecti<strong>on</strong><br />
of <str<strong>on</strong>g>coal</str<strong>on</strong>g> <str<strong>on</strong>g>fire</str<strong>on</strong>g> related thermal anomalies. In the worst case, some <str<strong>on</strong>g>fire</str<strong>on</strong>g>s will not even result in a thermal<br />
expressi<strong>on</strong>. New and deep <str<strong>on</strong>g>fire</str<strong>on</strong>g>s are <strong>on</strong>ly detectable when heat is transferred through fractures or<br />
cracks, since it takes several years for exclusively c<strong>on</strong>ductive heat to manifest at the surface (ROSEMA<br />
et al. 1999, ZHANG, J. et al. 2004a). Even high temperature <str<strong>on</strong>g>fire</str<strong>on</strong>g>s can exist closely beneath the ground<br />
surface and yet exhibit little or no surface expressi<strong>on</strong>. Research has found that even though ‘hot spots’<br />
in large mine waste piles generally occur between 1.5 and 2.5 meters below the surface, thermal<br />
imaging equipment is often of limited benefit (WALKER 1999).<br />
Furthermore, the absolute calibrati<strong>on</strong> of thermal daytime data to improve <str<strong>on</strong>g>coal</str<strong>on</strong>g> <str<strong>on</strong>g>fire</str<strong>on</strong>g> detecti<strong>on</strong> appears<br />
very challenging. To account for effects of uneven solar heating a very precise DEM is needed. To<br />
account for uneven heating due to differing surface inherent physical characteristics (albedo, density,<br />
c<strong>on</strong>ductivity etc.) detailed surface maps need to be provided. Furthermore, time integrated heating<br />
effects with respect to the overpass time of the satellite have to be taken into account (SABINS 1996,<br />
ZHANG, X., 1998,).<br />
It becomes obvious that thermal anomaly detecti<strong>on</strong> as well as thermal calibrati<strong>on</strong> al<strong>on</strong>e both face<br />
problems not easily overcome. Therefore, this work focuses <strong>on</strong> the demarcati<strong>on</strong> of <str<strong>on</strong>g>areas</str<strong>on</strong>g>, where <str<strong>on</strong>g>coal</str<strong>on</strong>g><br />
<str<strong>on</strong>g>fire</str<strong>on</strong>g>s are likely to occur. It is assumed that informati<strong>on</strong> extracted from multi<strong>spectral</strong> data will not <strong>on</strong>ly<br />
help to better understand landscape patterns and the temporal dynamics in the <str<strong>on</strong>g>coal</str<strong>on</strong>g> <str<strong>on</strong>g>fire</str<strong>on</strong>g> regi<strong>on</strong>s, but<br />
can furthermore support the analysis of thermal satellite imagery.<br />
The following research questi<strong>on</strong>s will be addressed in this study:<br />
1. How did <str<strong>on</strong>g>coal</str<strong>on</strong>g> mining activity in the study <str<strong>on</strong>g>areas</str<strong>on</strong>g> develop over the past 15 years and can changes of<br />
<str<strong>on</strong>g>coal</str<strong>on</strong>g> mining activity be qualitatively and quantitatively assessed from time series satellite data?<br />
2. What influence do <str<strong>on</strong>g>coal</str<strong>on</strong>g> <str<strong>on</strong>g>fire</str<strong>on</strong>g>s have <strong>on</strong> their surrounding envir<strong>on</strong>ment and how can such influences<br />
be observed in reflective satellite data?<br />
3. Which surfaces types or indicators can be extracted from satellite data, which support the<br />
demarcati<strong>on</strong> of <str<strong>on</strong>g>coal</str<strong>on</strong>g> <str<strong>on</strong>g>fire</str<strong>on</strong>g> <str<strong>on</strong>g>areas</str<strong>on</strong>g> and probable <str<strong>on</strong>g>coal</str<strong>on</strong>g> <str<strong>on</strong>g>fire</str<strong>on</strong>g> <str<strong>on</strong>g>risk</str<strong>on</strong>g> <str<strong>on</strong>g>areas</str<strong>on</strong>g>?<br />
4. Which approach proves most applicable to design a fully automated algorithm for the<br />
demarcati<strong>on</strong> of <str<strong>on</strong>g>coal</str<strong>on</strong>g> <str<strong>on</strong>g>fire</str<strong>on</strong>g> <str<strong>on</strong>g>areas</str<strong>on</strong>g> <str<strong>on</strong>g>based</str<strong>on</strong>g> <strong>on</strong> multi<strong>spectral</strong> remote sensing informati<strong>on</strong>?<br />
5. Can such an automated algorithm be combined with existing thermal algorithms?<br />
6. How will the combinati<strong>on</strong> of multi<strong>spectral</strong> and thermal research influence the detecti<strong>on</strong> accuracy<br />
of <str<strong>on</strong>g>coal</str<strong>on</strong>g> <str<strong>on</strong>g>fire</str<strong>on</strong>g> related thermal anomalies?<br />
7. What role does multi<strong>spectral</strong> reflective informati<strong>on</strong> play for the demarcati<strong>on</strong> of possible future<br />
<str<strong>on</strong>g>coal</str<strong>on</strong>g> <str<strong>on</strong>g>fire</str<strong>on</strong>g> <str<strong>on</strong>g>risk</str<strong>on</strong>g> <str<strong>on</strong>g>areas</str<strong>on</strong>g>?<br />
- 35 -
1.4. Thesis Outline<br />
Chapter 1 introduces the problem of <str<strong>on</strong>g>coal</str<strong>on</strong>g> <str<strong>on</strong>g>fire</str<strong>on</strong>g>s <strong>on</strong> a global and China-wide scale. A short review <strong>on</strong><br />
<str<strong>on</strong>g>coal</str<strong>on</strong>g> <str<strong>on</strong>g>fire</str<strong>on</strong>g> related remote sensing research undertaken since 1963 is presented. The current project<br />
framework as well as most recent challenges in <str<strong>on</strong>g>coal</str<strong>on</strong>g> <str<strong>on</strong>g>fire</str<strong>on</strong>g> research are introduced. This is followed by<br />
the definiti<strong>on</strong> of research objectives for this thesis. A short outline of this work is presented.<br />
Chapter 2 gives an overview of the two main study <str<strong>on</strong>g>areas</str<strong>on</strong>g> in North-central China: Wuda and Ruqigou /<br />
Gulaben. The geographic locati<strong>on</strong> of these <str<strong>on</strong>g>areas</str<strong>on</strong>g> is specified and physical-geographic characteristics<br />
like geologic setting, geomorphologic appearance, climatic and hydrographic influences as well as<br />
dominating soil- and vegetati<strong>on</strong> patterns are explained. Furthermore, the socio-geographic parameters<br />
are briefly introduced. The effects and hazards of <str<strong>on</strong>g>coal</str<strong>on</strong>g> <str<strong>on</strong>g>fire</str<strong>on</strong>g>s dominating the local envir<strong>on</strong>mental<br />
situati<strong>on</strong> are described.<br />
Chapter 3 introduces the theoretical c<strong>on</strong>cepts as well as the status of research in the field of<br />
multi<strong>spectral</strong> surface classificati<strong>on</strong> and <strong>spectral</strong> feature extracti<strong>on</strong>. Here, the variety of mathematical<br />
statistical approaches for informati<strong>on</strong> extracti<strong>on</strong> from satellite data is illustrated. This chapter forms<br />
the theoretical backb<strong>on</strong>e for the two algorithms developed for <str<strong>on</strong>g>coal</str<strong>on</strong>g> <str<strong>on</strong>g>fire</str<strong>on</strong>g> area demarcati<strong>on</strong>.<br />
Chapter 4 presents the satellite-, field-, GIS- and map-data acquired for this research. The satellite data<br />
used is listed and the sensor characteristics of the different satellites are presented. In additi<strong>on</strong>, the data<br />
collected and recorded during a <strong>on</strong>e-m<strong>on</strong>th field campaign in the study <str<strong>on</strong>g>areas</str<strong>on</strong>g> in September 2002 and a<br />
three-week field campaign in September 2003 is presented. Available GIS data and maps are listed.<br />
Chapter 5 deals with the spatial and <strong>spectral</strong> accuracy of the satellite data analyzed. The preprocessing<br />
of this data in a complete chain including orthorectificati<strong>on</strong>, sensor calibrati<strong>on</strong> and a combined<br />
atmospheric and topographic correcti<strong>on</strong> is explained. Results of surface reflectance retrieval over all<br />
wavelength are presented. The accuracy is assessed <str<strong>on</strong>g>based</str<strong>on</strong>g> <strong>on</strong> field and laboratory spectra of pseudoinvariant<br />
objects. Thermal data sets are corrected to land surface temperatures. Results of these<br />
analyses are presented and validated.<br />
Chapter 6 presents the c<strong>on</strong>cept of <str<strong>on</strong>g>coal</str<strong>on</strong>g> <str<strong>on</strong>g>fire</str<strong>on</strong>g> area demarcati<strong>on</strong> <str<strong>on</strong>g>based</str<strong>on</strong>g> <strong>on</strong> field observati<strong>on</strong>s and remote<br />
sensing analysis. This c<strong>on</strong>ceptual approach is the basis for the algorithms developed to delineate <str<strong>on</strong>g>coal</str<strong>on</strong>g><br />
<str<strong>on</strong>g>fire</str<strong>on</strong>g> <str<strong>on</strong>g>areas</str<strong>on</strong>g> and <str<strong>on</strong>g>risk</str<strong>on</strong>g> <str<strong>on</strong>g>areas</str<strong>on</strong>g>.<br />
In chapter 7 a detailed <strong>spectral</strong> signature analysis of the surfaces, which are c<strong>on</strong>sidered to be of<br />
relevance for <str<strong>on</strong>g>coal</str<strong>on</strong>g> <str<strong>on</strong>g>fire</str<strong>on</strong>g> area demarcati<strong>on</strong> as defined in chapter 6, is undertaken. This analysis explains<br />
the chemical, physical and <strong>spectral</strong> properties of the surfaces and materials of interest. The separability<br />
of these surfaces against each other, as well as against other <strong>spectral</strong> comp<strong>on</strong>ents present in the image<br />
data is discussed. The results and c<strong>on</strong>clusi<strong>on</strong>s drawn from signature analysis form the basis for the<br />
algorithm design presented in chapter 8.<br />
In chapter 8 the first algorithm for the automated demarcati<strong>on</strong> of <str<strong>on</strong>g>coal</str<strong>on</strong>g> <str<strong>on</strong>g>fire</str<strong>on</strong>g> <str<strong>on</strong>g>areas</str<strong>on</strong>g> is presented. It is<br />
designed as a knowledge-<str<strong>on</strong>g>based</str<strong>on</strong>g> <strong>spectral</strong> <strong>test</strong> sequence. The chapter is subdivided into the<br />
methodological part, results, a validati<strong>on</strong> and error estimati<strong>on</strong> of these results, a spatial transfer to<br />
different regi<strong>on</strong>s and a discussi<strong>on</strong>.<br />
- 36 -
Chapter 9 presents a sec<strong>on</strong>d – more quantitative – approach of automated surface extracti<strong>on</strong> <str<strong>on</strong>g>based</str<strong>on</strong>g> <strong>on</strong><br />
partial unmixing of image data. Partial unmixing bases <strong>on</strong> the fundamentals of linear <strong>spectral</strong> mixture<br />
analysis and supports the mapping of single surfaces within raster imagery. As in chapter 8, the<br />
methodological frame, results, validati<strong>on</strong> and error estimati<strong>on</strong>, a spatial transfer and a detailed<br />
discussi<strong>on</strong> are presented.<br />
In chapter 10 the two developed algorithms are applied to a large number of data sets. Results<br />
presented in chapter 8 and 9 are combined in the form of <str<strong>on</strong>g>coal</str<strong>on</strong>g> <str<strong>on</strong>g>fire</str<strong>on</strong>g> area maps and <str<strong>on</strong>g>coal</str<strong>on</strong>g> <str<strong>on</strong>g>fire</str<strong>on</strong>g> <str<strong>on</strong>g>risk</str<strong>on</strong>g> maps<br />
for several regi<strong>on</strong>s. Regi<strong>on</strong>s mapped include the two main study <str<strong>on</strong>g>areas</str<strong>on</strong>g>, their broader surroundings as<br />
well as the transfer <str<strong>on</strong>g>areas</str<strong>on</strong>g>. The transfer <str<strong>on</strong>g>areas</str<strong>on</strong>g> are located in north central China, India and Australia to<br />
dem<strong>on</strong>strate the spatial transfer of the algorithms employed. Furthermore, results of the combinati<strong>on</strong><br />
of automated <str<strong>on</strong>g>coal</str<strong>on</strong>g> <str<strong>on</strong>g>fire</str<strong>on</strong>g> area demarcati<strong>on</strong> and thermal anomaly detecti<strong>on</strong> as developed by ZHANG, J.<br />
(2004) are shown. The demarcati<strong>on</strong> c<strong>on</strong>cept, the results of the developed algorithms and synergetic<br />
effects of multi<strong>spectral</strong> and thermal analysis are discussed. Furthermore, the map products are<br />
evaluated c<strong>on</strong>cerning their practical value.<br />
In chapter 11 a c<strong>on</strong>clusi<strong>on</strong> summarizes the most important results. An outlook <strong>on</strong> c<strong>on</strong>tinuing <str<strong>on</strong>g>coal</str<strong>on</strong>g> <str<strong>on</strong>g>fire</str<strong>on</strong>g><br />
research and questi<strong>on</strong>s to be addressed in the future is given.<br />
- 37 -
2. The Study Areas: Wuda, Ruqigou / Gulaben and Envir<strong>on</strong>mental<br />
Coal Fire Impacts<br />
2.1. Geographic Locati<strong>on</strong><br />
The field sites and mining <str<strong>on</strong>g>areas</str<strong>on</strong>g> of Wuda and Ruqigou / Gulaben are both located in North Central<br />
China. Although the surroundings of these two <str<strong>on</strong>g>areas</str<strong>on</strong>g> were investigated also, during the field<br />
campaigns a clear focus was research in these two mining <str<strong>on</strong>g>areas</str<strong>on</strong>g>. Accordingly, this chapter introduces<br />
the geophysical and socio-ec<strong>on</strong>omical factors characterizing the two regi<strong>on</strong>s. It should be menti<strong>on</strong>ed<br />
that during the field campaigns research was possible in Wuda regi<strong>on</strong> for 21 days in 2002 and 10 days<br />
in 2003 and 2004, while the Ruqigou area could <strong>on</strong>ly be studied in detail for three days in 2002 and<br />
2003, respectively. Therefore, the Wuda regi<strong>on</strong> is the main area for general characterizati<strong>on</strong>, mapping,<br />
ground truthing and <strong>spectral</strong> as well as thermal measurements and receives a higher priority<br />
c<strong>on</strong>cerning data analysis within this thesis. In c<strong>on</strong>trast to Ruqigou / Gulaben <str<strong>on</strong>g>coal</str<strong>on</strong>g> <str<strong>on</strong>g>fire</str<strong>on</strong>g>s in the Wuda<br />
study area have not been internati<strong>on</strong>ally studied prior to the start of this project and informati<strong>on</strong> <strong>on</strong> the<br />
geographic characteristics were scarce. Internati<strong>on</strong>al publicati<strong>on</strong>s were not available. Therefore, this<br />
chapter includes a novel synoptic overview of physical geographic characteristics of this regi<strong>on</strong>.<br />
Wuda is located in Inner M<strong>on</strong>golia Aut<strong>on</strong>omous Regi<strong>on</strong>, which covers an area of 1,180,000 km² or<br />
about <strong>on</strong>e-eighth of the country (PEOPLE’S REPUBLIC OF CHINA MINISTRY OF GEOLOGY AND<br />
MINERAL RESOURCES, 1991). The city borders the structural syncline hosting a large <str<strong>on</strong>g>coal</str<strong>on</strong>g> <str<strong>on</strong>g>fire</str<strong>on</strong>g> area<br />
investigated. It is located <strong>on</strong> the western side of the Yellow River, north of the Helan Shan mountain<br />
range, not far from the border to Ningxia Hui Aut<strong>on</strong>omous Regi<strong>on</strong>. Ten kilometers west of Wuda the<br />
first dunes of the Badain Jaran desert can be found. The geographic locati<strong>on</strong> of Wuda city is<br />
approximately 39.51° North and 106.60° East (see map 1). The nearest bigger cities are Wuhai,<br />
located 20 km to the Northeast, Shizuishan-Dawukou, 75km southwest of Wuda and Yinchuan, the<br />
capital of Ningxia Hui Aut<strong>on</strong>omous Regi<strong>on</strong>, which is located 150 km to the South. The broader study<br />
area of Wuda includes a regi<strong>on</strong> of approximately 1600 km², with Wuda at the center. Land elevati<strong>on</strong>s<br />
in this regi<strong>on</strong> vary from 1010 to 1980 meters above sea level.<br />
The other study area, Ruqigou / Gulaben, is located in the northern part of the Helan Shan mountain<br />
range in Ningxia Hui Aut<strong>on</strong>omous Regi<strong>on</strong>, which covers an area of 66,400 km² and therefore is 17<br />
times smaller than Inner M<strong>on</strong>golia Aut<strong>on</strong>omous Regi<strong>on</strong> (PEOPLE’S REPUBLIC OF CHINA MINISTRY OF<br />
GEOLOGY AND MINERAL RESOURCES, 1990). The Helan Shan mountains strike from Southwest to<br />
Northeast for ca. 200 km al<strong>on</strong>g the northwestern border between Ningxia and Inner M<strong>on</strong>golia. Their<br />
average height is 2000 meters; the highest peak, Helan Mountain, reaches 3557 meters. The mining<br />
area is located at approximately 39.07° North and 106.12° East, close to the border of Inner M<strong>on</strong>golia<br />
Aut<strong>on</strong>omous Regi<strong>on</strong> to the West (see map 1). The nearest larger cities are Shizuishan-Dawukou, 25<br />
km east and Yinchuan, 70 km southeast of Ruqigou. Wuda is located 75km to the Northeast. The<br />
broader study area of Ruqigou includes the adjacent regi<strong>on</strong>s within a radius of 8 km around the city.<br />
This also includes the mining area of Gulaben – already located in Inner M<strong>on</strong>golia – neighboring the<br />
Ruqigou syncline. Elevati<strong>on</strong>s in this regi<strong>on</strong> vary from 1400 to 2640 meters above sea level. Though<br />
<str<strong>on</strong>g>coal</str<strong>on</strong>g> mining- and <str<strong>on</strong>g>coal</str<strong>on</strong>g> <str<strong>on</strong>g>fire</str<strong>on</strong>g> <str<strong>on</strong>g>areas</str<strong>on</strong>g> in China are widespread, the <str<strong>on</strong>g>areas</str<strong>on</strong>g> of Wuda and Ruqigou offer the<br />
major advantage that different types of <str<strong>on</strong>g>coal</str<strong>on</strong>g> <str<strong>on</strong>g>fire</str<strong>on</strong>g>s occur within a small regi<strong>on</strong>. Furthermore, different<br />
mining methods are applied, the <str<strong>on</strong>g>areas</str<strong>on</strong>g> were partially (Ruqigou) studied before (ROSEMA et al. 1999,<br />
PRAKASH et al. 1999, PRAKASH et al. 2001) and they offer sufficient accessibility.<br />
- 38 -
- 39 -
2.2. Geologic and Geomorphologic Characteristics<br />
The geology of the broader area of northern Ningxia and south-central Inner M<strong>on</strong>golia is rather<br />
complex, since the area is located within the transiti<strong>on</strong> z<strong>on</strong>e between the different geotect<strong>on</strong>ic units of<br />
eastern and western China. Detailed geologic descripti<strong>on</strong>s can be found in PEOPLE’S REPUBLIC OF<br />
CHINA MINISTRY OF GEOLOGY AND MINERAL RESOURCES 1990 and PEOPLE’S REPUBLIC OF CHINA<br />
MINISTRY OF GEOLOGY AND MINERAL RESOURCES 1991, as well as ZHANG (1997), analyzing the<br />
area and its strata from oldest geologic times until today. This includes detailed discussi<strong>on</strong>s of<br />
processes of sedimentati<strong>on</strong>, tect<strong>on</strong>ics, erosi<strong>on</strong> etc. of Archean-, Proterozoic-, Paleozoic- and the<br />
following younger units. Since the strata of interest in the Wuda study area are not older than<br />
Carb<strong>on</strong>iferous next to some local deposits of Ordovician strata, older units will not be discussed. The<br />
same applies for Ruqigou, where the major area of interest c<strong>on</strong>sists of Triassic and younger strata,<br />
though Precambrian metamorphics do occur as well. Readers with deeper geologic interest are referred<br />
to the above sources. Map 2 gives an impressi<strong>on</strong> of the geology in the two study <str<strong>on</strong>g>areas</str<strong>on</strong>g>.<br />
The north-south striking structural syncline located 5 km west of Wuda has a spatial extent of 35km²<br />
and holds a total reserve of 630 Mio. t<strong>on</strong>s of <str<strong>on</strong>g>coal</str<strong>on</strong>g>. The <str<strong>on</strong>g>coal</str<strong>on</strong>g> layers originate from Upper Carb<strong>on</strong>iferous<br />
and Lower Permian times (DAI et al. 2002). Mineable reserves are stated to be 27 Mio. t<strong>on</strong>s with seam<br />
thickness varying between 1.5 and 12 meters. The <str<strong>on</strong>g>coal</str<strong>on</strong>g> layers are interbedded in different layers of<br />
coarse to fine-grained white to dark grey or yellowish sandst<strong>on</strong>e and grayish-, brown- or greenyellowish<br />
shale with varying organic c<strong>on</strong>tent also originating from the Carb<strong>on</strong>iferous and Permian.<br />
Occurring formati<strong>on</strong>s are the Taiyuan-, Shanxi-, Xiashihezi- and Shangshihezi formati<strong>on</strong>. The Taiyuan<br />
formati<strong>on</strong> is the major <str<strong>on</strong>g>coal</str<strong>on</strong>g> bearing formati<strong>on</strong> (DAI et al. 2002). The strata dip to the East with an<br />
average dip angle of 6 to 10°, but steeper dips occur as well. Quaternary alluvial layers of silt, shale<br />
and gravel unc<strong>on</strong>formably cover small parts of the Permian and Carb<strong>on</strong>iferous outcrops. Outside the<br />
syncline also Lower- and Middle Ordovician marine facies sediments including thick bedded dolomite<br />
and limest<strong>on</strong>e occur. The Silurian and Dev<strong>on</strong>ian sequence is missing in the Helan Mountain area and<br />
its surroundings.<br />
In the syncline area the <str<strong>on</strong>g>coal</str<strong>on</strong>g> layers have been mined under the authority of the “Wuda <str<strong>on</strong>g>coal</str<strong>on</strong>g> mine<br />
bureau” within the three <str<strong>on</strong>g>coal</str<strong>on</strong>g> mines of Wuhushan operating in the South, Huangbaici in the East and<br />
Suhai-Tu in the Northwest since 1958. In these three mines three different qualities of <str<strong>on</strong>g>coal</str<strong>on</strong>g> – fat<str<strong>on</strong>g>coal</str<strong>on</strong>g>,<br />
cooking <str<strong>on</strong>g>coal</str<strong>on</strong>g> and steam <str<strong>on</strong>g>coal</str<strong>on</strong>g> – are being extracted from the 17 mineable of the overall 24 <str<strong>on</strong>g>coal</str<strong>on</strong>g> seams.<br />
The upper seven <str<strong>on</strong>g>coal</str<strong>on</strong>g> seams from Permian times, bel<strong>on</strong>ging to the Shanxi group, have an overall<br />
thickness of 88 meters and are characterized by a low sulfur and a high ash c<strong>on</strong>tent. All lower seems<br />
from the Carb<strong>on</strong>iferous bel<strong>on</strong>g to the Thairen group and have a high sulfur and low ash c<strong>on</strong>tent. The<br />
heating value of the Wuda <str<strong>on</strong>g>coal</str<strong>on</strong>g> varies between 5000-7000 kcal/kg (JIA 2002, SUN 2003).<br />
The broader Ruqigou / Gulaben study area is located in the Helan mountains – a significant boundary<br />
in the geographical z<strong>on</strong>ati<strong>on</strong> of China. They form the fold- and fault belt of the western rim of the<br />
transiti<strong>on</strong>al Ordos Basin, which has been affected by the Trans-Eurasian Tethys tect<strong>on</strong>ism and the<br />
circum-Pacific tect<strong>on</strong>ism including dual extensi<strong>on</strong>al and compressi<strong>on</strong>al shearing mechanisms<br />
(ROSEMA et al. 1999). The Helan Shan has underg<strong>on</strong>e several phases of orogeny. In its present shape<br />
it was formed in a compressi<strong>on</strong>al regime between the Xiaos<strong>on</strong>gshan thrust fault system in the<br />
Northwest and the Helanshan fault z<strong>on</strong>e in the East during various tect<strong>on</strong>ic phases of the Yanshan<br />
orogeny in the Jurassic. After erosi<strong>on</strong> and basin formati<strong>on</strong> during the late Jurassic a renewed uplift<br />
- 40 -
egan 25 Mio. years ago during the Himalayan period which is still c<strong>on</strong>tinuing (ROSEMA et al. 1999).<br />
Today, in the North and West this mountain chain borders the desert with gentle hill slopes formed<br />
through broad alluvial fans. East of the mountains steep hill slopes form the transiti<strong>on</strong> to the large<br />
Yinchuan alluvial plain, which developed through the accumulati<strong>on</strong> of deposits from the Yellow<br />
River.<br />
The Ruqigou- and Gulaben <str<strong>on</strong>g>coal</str<strong>on</strong>g> fields bel<strong>on</strong>g to an asymmetrical Jurassic synclinal basin located at<br />
the western rim of the Paleo-Mesozoic sedimentary Ordos Basin. The Jurassic syncline stretches 14<br />
km from Southwest to Northeast, 7 km from Southeast to Northwest and covers an area of<br />
approximately 80 km². The Gulaben area is located at the western rim of Ruqigou syncline at the<br />
transiti<strong>on</strong> to Houlugou anticline. Strata in the Ruqigou syncline show dip angles of 5-30° while 35- up<br />
to 75° are reached in Gulaben. The 10 main <str<strong>on</strong>g>coal</str<strong>on</strong>g> seams of the two regi<strong>on</strong>s were deposited under<br />
lacustrine-fluvial c<strong>on</strong>diti<strong>on</strong>s during the Middle Jurassic and bel<strong>on</strong>g to the Yan’an formati<strong>on</strong>. Due to<br />
the Yanshanian movement the covering layers were partially eroded and the <str<strong>on</strong>g>coal</str<strong>on</strong>g> seams are well<br />
exposed (ZHANG, X., 1997). Coal rank is high and ranges from low volatile bituminous <str<strong>on</strong>g>coal</str<strong>on</strong>g> to<br />
Anthracite with low ash and sulfur c<strong>on</strong>tents resulting in a very good export market. The Anthracite<br />
distributi<strong>on</strong> corresp<strong>on</strong>ds spatially with an underlying magmatic intrusi<strong>on</strong> into the Helan Shan complex<br />
during the early Yanshanian movement. It is assumed that this thermal intrusi<strong>on</strong> supported the highdegree<br />
<str<strong>on</strong>g>coal</str<strong>on</strong>g>ificati<strong>on</strong> (ZHANG, X., 1997). Ruqigou and Gulaben area together hold a proven geologic<br />
reserve of 1.04 Mio. t<strong>on</strong>s with prospects ranging around 1 Billi<strong>on</strong> t<strong>on</strong>s. The <str<strong>on</strong>g>coal</str<strong>on</strong>g> is mined within three<br />
major mines: Ruqigou- and Baijigou underground mines and Dafeng open pit mine. The <str<strong>on</strong>g>coal</str<strong>on</strong>g> seams<br />
are interbedded in different layers of older Triassic (Yanchang formati<strong>on</strong>) and younger Jurassic<br />
(Zhiluo formati<strong>on</strong>) fine to coarse grained white to grey sandst<strong>on</strong>es, purplish red mudst<strong>on</strong>es, yellowgreen<br />
siltst<strong>on</strong>es and shales, occasi<strong>on</strong>al deposits of clayst<strong>on</strong>es and interbedded c<strong>on</strong>glomerates. These<br />
strata were deposited during seven sedimentati<strong>on</strong> cycles each of which represented a certain climate,<br />
ranging from dry to humid envir<strong>on</strong>ments (CHEN 1997). Apart from this strata, some Quaternary<br />
alluvial deposits occur al<strong>on</strong>g the small seas<strong>on</strong>al rivers dissecting the syncline (ROSEMA et al. 1999).<br />
The tect<strong>on</strong>ic system is characterized by several large and many small faults in the study area. These<br />
explain displacements and disc<strong>on</strong>tinuities in the Triassic and Jurassic strata. The most important <strong>on</strong>e is<br />
the north-south running Westfoot fault west of the Helan Mountains, which has been active during all<br />
orogenic movements (Caled<strong>on</strong>ian, Hercynian, Yanshanian and younger). Furthermore, the Eastfoot<br />
fault in the East of the orogenic complex demarcates the boundary between the mountains and the<br />
Yinchuan graben. The Xiaos<strong>on</strong>gshan reverse fault in the Northwest of Ruqigou divides the Archean<br />
and Precambrian metamorphic <strong>sequences</strong> from the younger sedimentary cover. Additi<strong>on</strong>ally, the<br />
Zhenyiguan strike fault runs east-west through the northern part of the Helan Mountains (ZHANG, X.<br />
1997).<br />
A local geologic phenomen<strong>on</strong> resulting from <str<strong>on</strong>g>coal</str<strong>on</strong>g> <str<strong>on</strong>g>fire</str<strong>on</strong>g> induced metamorphism is the occurrence of<br />
pyrometamorphic rocks. These are rocks that have been baked or heated by <str<strong>on</strong>g>coal</str<strong>on</strong>g> <str<strong>on</strong>g>fire</str<strong>on</strong>g>s, resulting in<br />
texture- and color changes due to oxidati<strong>on</strong> and dehydrati<strong>on</strong>. Within the Wuda syncline they occur<br />
<strong>on</strong>ly locally in very small places (see figure 2-1), while in the H<strong>on</strong>gliang area within the Ruqigou<br />
basin they can be observed even at a larger spatial extent. Also newly formed fumarolic minerals such<br />
as salmiac, sulfur (see figure 2-1), gypsum and calcite indicate <str<strong>on</strong>g>coal</str<strong>on</strong>g> <str<strong>on</strong>g>fire</str<strong>on</strong>g> activity (LAPHAM et al. 1980,<br />
ZHANG, J. 1996, VAN GENDEREN & GUAN 1997, ZHANG, X. 1998, ZHANG, J. et al. 2004a).<br />
- 41 -
- 42 -
Figure 2-1: Small area of pyrometamorphic rock<br />
Figure 2-2: Sulfur minerals above a former <str<strong>on</strong>g>coal</str<strong>on</strong>g> <str<strong>on</strong>g>fire</str<strong>on</strong>g><br />
Photos: C. Kuenzer, 09/2002, locati<strong>on</strong>: 638906E, 4377468N, UTM Z48N<br />
Next to the sulfides and sulfates in rare occasi<strong>on</strong>s Selenium, oxides like Hematite, Arsenolite,<br />
Cassiterite, Downeyite and Halides like Mascagnite or Tschermigite can be found (LAPHAM et al.<br />
1980).<br />
Geomorphologic features at this local scale are mainly dependent <strong>on</strong> the properties of the surface<br />
material. Apart from climate, this is the key parameter in the development of present-day morphology.<br />
Due to differential erosi<strong>on</strong> hard rocks like sandst<strong>on</strong>e outcrop in scarps, dip slope surfaces and plateaus,<br />
while soft bedrock like siltst<strong>on</strong>e or shale with a lower resistance to weathering outcrop in gentle<br />
landforms (CHEN 1997). Four types of landforms occur in the Ruqigou study area: structural<br />
denudati<strong>on</strong>al landforms like dip slopes, face slopes and structural plateaus, denudati<strong>on</strong>al landforms<br />
that are near vertical scarps, denudati<strong>on</strong>al slopes, denudati<strong>on</strong>al valleys, asymmetric hills and foot<br />
slopes, alluvial landforms including flood plains, alluvial terraces and alluvial fans and<br />
anthropogenically induced landforms. This last type can be further classified into opencast <str<strong>on</strong>g>coal</str<strong>on</strong>g> mining<br />
<str<strong>on</strong>g>areas</str<strong>on</strong>g> with complete removal of overburden, opencast mining with partial removal of overburden,<br />
mine dump <str<strong>on</strong>g>areas</str<strong>on</strong>g>, underground <str<strong>on</strong>g>coal</str<strong>on</strong>g> mining <str<strong>on</strong>g>areas</str<strong>on</strong>g>, cut-slopes, artificial lakes, subsidence <str<strong>on</strong>g>areas</str<strong>on</strong>g> and<br />
residential <str<strong>on</strong>g>areas</str<strong>on</strong>g> (CHEN 1997).<br />
The broader Wuda study area is characterized by less varying relief than the Ruqigou / Gulaben area,<br />
since the regi<strong>on</strong> is not located within the Helan Shan. The Wuda syncline itself has a slightly<br />
undulating terrain with gentle slopes. Elevati<strong>on</strong>s range from 1030 to 1350 meters. Opencast <str<strong>on</strong>g>coal</str<strong>on</strong>g><br />
mining as in the Dafeng open pit mine of Ruqigou does not exist. Coal mining activities in general are<br />
of smaller scale. Therefore, resulting landscape changes due to mining are less accentuated.<br />
Furthermore, artificial lakes – such as those existing in the Ruqigou area – are also not present in the<br />
Wuda area. Land subsidence resulting from <str<strong>on</strong>g>coal</str<strong>on</strong>g> <str<strong>on</strong>g>fire</str<strong>on</strong>g>s occurring due to the volume loss underground is<br />
widespread and shows as slow trough-like subsidence, sudden doline-like or large area subsidence.<br />
Furthermore, many small scale cracks and crack fields <strong>on</strong> the surface dissect the bedrock layers in<br />
both study <str<strong>on</strong>g>areas</str<strong>on</strong>g> (ZHANG, J. et al. 2004a, RATHORE & WRIGHT 1993, GANGOPADHYAY 2003).<br />
A general impressi<strong>on</strong> of the study <str<strong>on</strong>g>areas</str<strong>on</strong>g> topography is given with map 3 <strong>on</strong> the next page.<br />
- 43 -
- 44 -
2.3. Climatic Characteristics<br />
The climate of Wuda, Ruqigou and the surrounding area can be characterized as a transiti<strong>on</strong>al climate<br />
between a B1sa climate and a CΙ1a climate, indicated by the climate classificati<strong>on</strong> of LAUER and<br />
FRANKENBERG (1986). The B1sa class represents a subtropic, str<strong>on</strong>gly c<strong>on</strong>tinental, semi arid climate,<br />
while CΙ1a indicates a middle latitude, str<strong>on</strong>gly c<strong>on</strong>tinental, fully arid climate. Diagnostic features for<br />
both are large daily and seas<strong>on</strong>al temperature amplitudes. Winters are cold and l<strong>on</strong>g, summers can be<br />
very hot, precipitati<strong>on</strong> amounts are low and winds are str<strong>on</strong>g.<br />
The main climatic system influencing the study area is the East Asian M<strong>on</strong>so<strong>on</strong> (XIE 2001). Unlike<br />
the Indian M<strong>on</strong>so<strong>on</strong>, this m<strong>on</strong>so<strong>on</strong> outside the tropics at about 40° latitude does not necessarily bring<br />
large amounts of precipitati<strong>on</strong>. In winter the polar fr<strong>on</strong>t is pushed back far to the South. The weather in<br />
East Asia (China, Japan) at this time of the year is mainly influenced by the prevailing Westerlies and<br />
their traversing cycl<strong>on</strong>es (lows). At the backside of fr<strong>on</strong>tal cycl<strong>on</strong>es rapid intrusi<strong>on</strong>s of cool air from<br />
Inner Asia (near surface thermal Russian High) can occur, leading to near surface northerly to north<br />
westerly winds in Wuda, Ruqigou and adjacent regi<strong>on</strong>s. In early summer and summer the Inner Asian<br />
near surface thermal Low leads to a shift of the northeastern trade winds to southeastern winds <strong>on</strong> the<br />
c<strong>on</strong>tinent. Due to their small vertical extent these southeastern trade winds can <strong>on</strong>ly transport small<br />
volumes of water. Precipitati<strong>on</strong> in the study area is mainly autochth<strong>on</strong> resulting from the c<strong>on</strong>vergence<br />
of the Westerlies with the southeastern trade winds. Thus the cycl<strong>on</strong>es are the main sources for<br />
precipitati<strong>on</strong>. During the summer seas<strong>on</strong> southeasterly winds dominate the study area (WEISCHET<br />
1988). L<strong>on</strong>g term measurements at the climate stati<strong>on</strong> Yinchuan (1112m asl.) show an average annual<br />
temperature of 8.6°C, an average annual precipitati<strong>on</strong> of 193 mm, an average absolute daily maximum<br />
of 39.3°C and an average absolute daily minimum of –30.6°C. In January the average daily<br />
temperature is –8.4°C, in July 17.7°C (URL 2-1). In Baotou (Inner M<strong>on</strong>golia), 300 km northeast of<br />
Wuda average annual temperature is 6.4°C (RICHTER 1996). An average of 3,230 sunshine hours per<br />
year is recorded for Wuda. Climate data for Wuda, Ruqigou and Gulaben is presented in table 2-1<br />
below.<br />
Table 2-1: Climate data for the main study <str<strong>on</strong>g>areas</str<strong>on</strong>g><br />
Wuda Ruqigou Gulaben<br />
Precipitati<strong>on</strong> 168 mm/a 238 mm/a 200 mm/a<br />
Potential Evaporati<strong>on</strong> 3,500 mm/a 2,720 mm/a 2500 mm/a<br />
Temp. Min. / Max. -26.7°C / 39.6°C -31.0°C / 35.0°C -45.0°C / 41.0°C<br />
Source: HALIK et al. 2003, modified<br />
In Wuda first nights with frost can be expected around the middle of September and in spring last frost<br />
nights occur around the end of April. In Ruqigou, the first and last frost days are shifted due to the<br />
locati<strong>on</strong> at higher elevati<strong>on</strong>. At a broader scale, including the whole province of Ningxia and the south<br />
central part of Inner M<strong>on</strong>golia, precipitati<strong>on</strong> decreases from the South to the North. Therefore,<br />
precipitati<strong>on</strong> in Wuda is substantially less than in Yinchuan. It averages 168 mm and is distributed to<br />
7-20 days within the year (JIA 2003, SUN 2003). The annual precipitati<strong>on</strong> curve for the broader study<br />
area shows single modal properties, with the highest rates occurring in July and August. Annual<br />
evaporati<strong>on</strong> rates of well above 2500 mm lead to a water shortage in surface flows and underground<br />
(CHEN 1997, WU & ZHANG, 2003). For <str<strong>on</strong>g>areas</str<strong>on</strong>g> located al<strong>on</strong>gside the Yellow River the influence of the<br />
- 45 -
iver can be seen in a slight weakening of daily as well as annual temperature amplitudes and the<br />
tendency for morning fog in adjacent regi<strong>on</strong>s. It should be noted that the presented average values<br />
underlie significant variati<strong>on</strong>s due to differing elevati<strong>on</strong> z<strong>on</strong>es, aspect and microclimatic phenomena<br />
(ROSEMA et al. 1999).<br />
C<strong>on</strong>cerning possible climatic trends analyses of meteorological data over the past half century indicate<br />
an increase in annual temperature and a decrease in annual precipitati<strong>on</strong> for the broader study area.<br />
Increasing soil- and vegetati<strong>on</strong> degradati<strong>on</strong>, salinizati<strong>on</strong> and a decreasing number of small lakes and<br />
reed <str<strong>on</strong>g>areas</str<strong>on</strong>g> accompany these observati<strong>on</strong>s (WU et al. 2001, WU & ZHANG 2003). A phenomen<strong>on</strong><br />
occurring <strong>on</strong> average at 75 days within the year are sandstorms, which lead to the intrusi<strong>on</strong> of desert<br />
sand into agricultural <str<strong>on</strong>g>areas</str<strong>on</strong>g> and support the deflati<strong>on</strong> of the top soil and <str<strong>on</strong>g>coal</str<strong>on</strong>g> dust (HALIK et al. 2003).<br />
2.4. Hydrographic Characteristics<br />
Due to the extremely small amount of precipitati<strong>on</strong>, inland waters like lakes hardly exist (with some<br />
excepti<strong>on</strong>s in the vicinity of Yinchuan) and most fluvial features in the regi<strong>on</strong> – like creeks, wadis, and<br />
small rivers – are seas<strong>on</strong>al. One excepti<strong>on</strong> and the most distinct hydrographic fluvial feature in the<br />
study area is the Yellow River, Huang-He, running from South to North through Ningxia Aut<strong>on</strong>omous<br />
Regi<strong>on</strong> and into Inner M<strong>on</strong>golia Aut<strong>on</strong>omous Regi<strong>on</strong>. The river has not been channeled and the width<br />
of its bed shows annual changes. This results in extensive alluvial flood plains <strong>on</strong> both sides. The<br />
water of the Yellow river is extremely rich in sediment and has a light brown color. Although<br />
polluti<strong>on</strong> levels are high the river is the most important water supply for agricultural irrigati<strong>on</strong>. Over<br />
the course of the last 15 years the average water level of the river has declined due to the high water<br />
demand of the steadily growing mining communities (JIA 2003, SUN 2003, VERBURG et al. 1999).<br />
Two smaller rivers are the Xi Ganqu and the Di’er N<strong>on</strong>gchang Qu running parallel to the Yellow<br />
River al<strong>on</strong>g the foothills of the Helan Shan.<br />
Further distinct hydrographic features close to Wuda are wadi beds with <strong>on</strong>ly seas<strong>on</strong>al water flow<br />
stretching from the foothills of the mountain chains East and West of the Yellow River towards their<br />
erosi<strong>on</strong> base. The runoff from the mountains in the Wuda area is nearly 100% due to absence of soil<br />
and vegetati<strong>on</strong>, accounting for large water volumes transported in the wadi beds in times of rainfall or<br />
snowmelt. In Ruqigou, three small braided rivers cross the basin, which have eroded deeply incised<br />
valleys. Their runoff is seas<strong>on</strong>al but can also reach high volumes during heavy rain events or<br />
snowmelt in the spring (ROSEMA et al. 1999). Ground water does not play an important role in the<br />
regi<strong>on</strong> since water for irrigati<strong>on</strong> is pumped from the nearby rivers and, except for the Yellow River<br />
area, sufficient ground water horiz<strong>on</strong>s are usually out of reach. The groundwater quality in Wuda is<br />
not adequate for c<strong>on</strong>sumpti<strong>on</strong> due to its high mineral c<strong>on</strong>tent. In Ruqigou and Gulaben the water<br />
supply is provided by water trucks.<br />
2.5. Soils and Natural Vegetati<strong>on</strong><br />
Bedrock materials for soil development in the regi<strong>on</strong> are sandst<strong>on</strong>e, shale, limest<strong>on</strong>e, desert sand,<br />
other aeolian deposits (loess) and river-terrace- or alluvial fan material with gravel and boulders. Due<br />
to the arid climate physical weathering outweighs chemical weathering and soil development<br />
progresses slowly. Therefore, large <str<strong>on</strong>g>areas</str<strong>on</strong>g> especially in the mountains and structural hill slopes have no<br />
soil cover but weathered bedrock, a cover of aeolian sand or coarse alluvial fan material. Soils<br />
- 46 -
occur mainly <strong>on</strong> the irrigated river terraces of the Yellow River and <strong>on</strong> its actual floodplains as sandy,<br />
silty and loamy types. Clays are rare but can occur locally. Generally the soils of the regi<strong>on</strong> (except<br />
the <strong>on</strong>es influenced by rivers) bel<strong>on</strong>g to the class of grey to brown half-desert and desert soils<br />
including calcisols, gypsisols, leptosols, sol<strong>on</strong>etz and sol<strong>on</strong>chaks (DRIESSEN & DUDAL 1991). Within<br />
the US soil tax<strong>on</strong>omy they are classified as Inceptisols and Aridisols (BRADY & WEIL 1996).<br />
Allocht<strong>on</strong> alluvial loams sedimented by the Yellow River are the most fertile soils in the study area.<br />
Apart from these soils influenced by the river, soils developed from limest<strong>on</strong>e dominated material are<br />
usually rich in clay minerals, bases and nutrients. They are therefore more fertile than soil developed<br />
from quartz dominated material with a more sour and less nutrient-rich character. The higher the<br />
amount of clay within a soil, the smaller the pores and the slower the infiltrati<strong>on</strong> of water. This leads<br />
to the genesis of small temporal wetlands after flooding al<strong>on</strong>g the Yellow River or after rain events in<br />
clay-rich plains. Water also plays a major role in the process of crusting. Some alluvial fans or even<br />
sand dune <str<strong>on</strong>g>areas</str<strong>on</strong>g> show a grayish crusting covering the top horiz<strong>on</strong> or sand. This crusting c<strong>on</strong>tains fine<br />
silty material, <str<strong>on</strong>g>coal</str<strong>on</strong>g> dust and small organic particles of fluvial and aeolian origin baked together<br />
through the influence of intense precipitati<strong>on</strong> and slow surface run off. Crusts reduce the soil’s<br />
infiltrati<strong>on</strong> capacity, hamper the germinati<strong>on</strong> and development of vegetati<strong>on</strong> and reduce the water<br />
retenti<strong>on</strong> capacity of the topsoil as well as aerati<strong>on</strong> processes (VAN DER MEER & DE JONG 2001).<br />
Figure 2-3: Thick Yellow River deposits – clayy loam Figure 2-4: Crusting of top soil <strong>on</strong> an alluvial fan<br />
Photos: C. Kuenzer, 09/2002, locati<strong>on</strong>: 651654E, 4358416N, UTM Z48N<br />
Vegetative cover in general is very sparse. Especially patches of trees are rare. The dominant tree<br />
species are Maple (Acer campestre, Acer davidii), Chinese Poplar (Populus lasiocarpa) and Chinese<br />
Ash (Fraxinus chinensis). Some wooded <str<strong>on</strong>g>areas</str<strong>on</strong>g> occur naturally, but often trees have been planted as<br />
barriers against wind and the aeolian intrusi<strong>on</strong> of desert sand into agricultural fields or residential<br />
<str<strong>on</strong>g>areas</str<strong>on</strong>g>. The most comm<strong>on</strong> vegetati<strong>on</strong> cover are dry desert shrubs with partially sclerophyllous leaves,<br />
which are dominated by Tetranea m<strong>on</strong>golica, Reaumuria so<strong>on</strong>gorica, Bassia dasyphylla and species<br />
of Artemisia (JAEGER 2003). They occur in varying ground cover densities from zero to 80%. Annual<br />
drought-deciduous species show a high photosynthesizing capacity and water use efficiency during the<br />
short weeks when soil moisture is high and photosynthesis is possible.<br />
Very rare in the close vicinity of Wuda, but more comm<strong>on</strong> further south, are belts of reed found at<br />
seas<strong>on</strong>al flooded flats close to the Yellow River. Sparsely distributed grasslands can be found in the<br />
Helan Shan mountains and <strong>on</strong> gentle hill slopes and alluvial fans (CHEN, 1997).<br />
- 47 -
In most cases the <str<strong>on</strong>g>areas</str<strong>on</strong>g> covered with shrubs or grasslands are used to feed cattle, sheep and goats,<br />
which leads to str<strong>on</strong>g grazing pressure. In several research projects it has been shown that more than<br />
70% of the naturally vegetated surfaces in the study area are degraded and species structure and<br />
compositi<strong>on</strong> have been altered and simplified. Soil erosi<strong>on</strong> is comm<strong>on</strong>place (JIA, 2001, XIE 2001).<br />
30 cm<br />
Figure 2-5: Shrubs <strong>on</strong> desert sand<br />
Figure 2-6: Shrubs in a sparsely settled mining area<br />
Photos: C. Kuenzer, 09/2002, locati<strong>on</strong>s: 646647E, 4368793N (2-5) and 641226E, 4371746E (2-6) UTM, Z48N<br />
2.6. Socio-ec<strong>on</strong>omic Characteristics<br />
Ningxia Hui Aut<strong>on</strong>omous Regi<strong>on</strong> has 5.3 Milli<strong>on</strong> inhabitants of Hui-, Han- or Manchu nati<strong>on</strong>ality.<br />
Many Chinese living in Ningxia are Muslims (URL 2-2). Inner M<strong>on</strong>golia Aut<strong>on</strong>omous Regi<strong>on</strong> has<br />
22.3 Milli<strong>on</strong> inhabitants, who either bel<strong>on</strong>g to Han-, Hui-, M<strong>on</strong>golian-, Daur-, Ewenki-, Oroqen- or<br />
Manchu ethnic groups. The broader study area around Ruqigou and Wuda has an estimated average<br />
populati<strong>on</strong> density of 25-50 inhabitants per km². The biggest cities are Shizuishan-Dawukou with<br />
670,000 inhabitants, Wuda city with ca. 50,000 inhabitants and Wuhai city in the Northeast of Wuda<br />
with more than 100,000 inhabitants. The larger Wuhai district including the outskirts of the main cities<br />
has over 420,000 inhabitants. Ruqigou and Gulaben have approximately 40,000 and 3,000 inhabitants,<br />
respectively (HALIK et al. 2003). Houses are predominantly built of bricks or a mixture of loam and<br />
straw. Most of the households have electricity but running water is less comm<strong>on</strong> – many families have<br />
a weekly water supply in tanks. Street access is possible to most places, although some settlements can<br />
<strong>on</strong>ly be reached <strong>on</strong> dirt roads or wadis.<br />
The predominant employment in the Wuda regi<strong>on</strong> and surroundings are <str<strong>on</strong>g>coal</str<strong>on</strong>g> mining and related<br />
activities. Coal mining takes place in state-run, locally-c<strong>on</strong>trolled and private mines. Coal mining<br />
related industry includes <str<strong>on</strong>g>coal</str<strong>on</strong>g> washing, <str<strong>on</strong>g>coal</str<strong>on</strong>g> cooking and <str<strong>on</strong>g>coal</str<strong>on</strong>g> power plants. Further industries in the<br />
area are limest<strong>on</strong>e processing and related calcite and cement factories, dolomite processing, the<br />
explorati<strong>on</strong> of phosphorus deposits, brick burning and loess mining. Also, gypsum producti<strong>on</strong>, clay<br />
mining, quartz mining, ir<strong>on</strong> oxide processing and lead and zinc mining are found locally. A good<br />
network of roads and railways has been developed in the broader area, which enables the<br />
transportati<strong>on</strong> of <str<strong>on</strong>g>coal</str<strong>on</strong>g> and other products to the neighboring provinces and bigger cities. However,<br />
especially the transport of <str<strong>on</strong>g>coal</str<strong>on</strong>g> and <str<strong>on</strong>g>coal</str<strong>on</strong>g> products by road produces a lot of fly-ash polluting the close<br />
vicinity of roads. Most of the sec<strong>on</strong>dary sector industries are emissi<strong>on</strong> intensive and cause heavy<br />
industrial smog, resulting in limited visibility and steadily increasing envir<strong>on</strong>mental polluti<strong>on</strong>. In<br />
- 48 -
additi<strong>on</strong> to <str<strong>on</strong>g>coal</str<strong>on</strong>g> related industry and other industry the primary agricultural sector is another main<br />
source of income for the local inhabitants. Commercially grown food products include corn, wheat,<br />
sunflowers, rice, potatoes, soybeans, grapes, mel<strong>on</strong>s and vegetables. Many households also practice<br />
subsistence agriculture and cultivate small and highly fragmented patches of land. These activities are<br />
mainly restricted to the flood plains of the Yellow River, irrigated river terraces and other irrigated<br />
<str<strong>on</strong>g>areas</str<strong>on</strong>g>. Irrigati<strong>on</strong> activities and cultivati<strong>on</strong> of bare land have increased especially since the ec<strong>on</strong>omic<br />
reform at the end of the 1980s with resulting land cover changes in the Yellow River Valley and plains<br />
(WU & ZHANG 2003). In Ruqigou and Gulaben agriculture is spatially very limited and in many <str<strong>on</strong>g>areas</str<strong>on</strong>g><br />
hardly possible. The sparsely distributed grasslands in the Helan Shan and the shrub covered <str<strong>on</strong>g>areas</str<strong>on</strong>g> of<br />
alluvial fans are comm<strong>on</strong> grounds for grazing, facilitating livestock raising and wool producti<strong>on</strong>.<br />
Figure 2-7: Coal processing factory<br />
Figure 2-8: Coal processing factory<br />
Figure 2-9: Calcite burning near a limest<strong>on</strong>e mine Figure 2-10: Clay mining<br />
Photos: C. Kuenzer, 09/2002, locati<strong>on</strong>s: 673454E, 4360063N (2-7), 665130E, 4356929N (2-8), 663747E,<br />
4361470N (2-9), 654976E, 4365744N (2-10), UTM, Z48N<br />
Average wages range between 700 RMB per m<strong>on</strong>th (ca. 90 €) for a <str<strong>on</strong>g>coal</str<strong>on</strong>g> worker in a state run mine,<br />
who works an average of 10 hours a day, 400 RMB per m<strong>on</strong>th (ca. 50€) for a middle school teacher<br />
and less than 160 RMB (ca. 20€) per m<strong>on</strong>th for a small farmer (JIA, 2002). At the same time Chinese<br />
labor productivity is very low compared to other countries. The average <str<strong>on</strong>g>coal</str<strong>on</strong>g> output per employee is<br />
163 t/y which is <strong>on</strong>ly 1/20 th of that of a worker in e.g. South Africa (DANIEL 1994). Average life<br />
expectancy is 68.62 years and the illiteracy rate of 23.1% – of which 67.3% are women – is still quite<br />
high (URL 2-2).<br />
- 49 -
2.7. Impact of Coal Mining and Coal Fires<br />
Since commercial mining in the Wuda syncline started in 1958, 120 megat<strong>on</strong>s have been mined by<br />
2000. Mainly mechanized l<strong>on</strong>gwall methods are applied and the average mining depth of state run- or<br />
commercial mines is around 100m but can reach up to 200-300 m. The first <str<strong>on</strong>g>coal</str<strong>on</strong>g> <str<strong>on</strong>g>fire</str<strong>on</strong>g>s in the area were<br />
discovered in 1961. The recent annual amount of <str<strong>on</strong>g>coal</str<strong>on</strong>g> being burned is estimated to be 200,000 t<strong>on</strong>s.<br />
An accelerati<strong>on</strong> of the process from year to year is observed. It is assumed that so far, over <strong>on</strong>e Mio.<br />
t<strong>on</strong>s of <str<strong>on</strong>g>coal</str<strong>on</strong>g> have been destroyed or became inaccessible due to <str<strong>on</strong>g>coal</str<strong>on</strong>g> <str<strong>on</strong>g>fire</str<strong>on</strong>g>s. However, no attempt has<br />
been made to date to really quantify the total <str<strong>on</strong>g>coal</str<strong>on</strong>g> loss within the last 35 years. Knowledge about the<br />
influence of the numerous small profit mines is difficult to access. Today 8.8% of the three <str<strong>on</strong>g>coal</str<strong>on</strong>g><br />
mining <str<strong>on</strong>g>areas</str<strong>on</strong>g> in the syncline are affected by <str<strong>on</strong>g>coal</str<strong>on</strong>g> <str<strong>on</strong>g>fire</str<strong>on</strong>g>s and the <str<strong>on</strong>g>coal</str<strong>on</strong>g> <str<strong>on</strong>g>fire</str<strong>on</strong>g> area has an extent of 3.07 km²<br />
(JIA, 2002). Eight <str<strong>on</strong>g>coal</str<strong>on</strong>g> seams are burning: seams 1, 2, 4, 6, 7, 9, 10 and 12.<br />
Small scale private mines with a low level of mechanizati<strong>on</strong> and poor safety standards pose the<br />
grea<strong>test</strong> threat c<strong>on</strong>cerning the development of new <str<strong>on</strong>g>coal</str<strong>on</strong>g> <str<strong>on</strong>g>fire</str<strong>on</strong>g>s or the ventilati<strong>on</strong> of existing <str<strong>on</strong>g>fire</str<strong>on</strong>g>s. Private<br />
mining has been permitted since 1980 as l<strong>on</strong>g as mine shafts are not drilled deeper than 300 m from<br />
the mine entrance into the strata. However, many of the formerly over 100 small scale private mines<br />
scattered al<strong>on</strong>g the seam outcrops are now aband<strong>on</strong>ed, after <str<strong>on</strong>g>coal</str<strong>on</strong>g> <str<strong>on</strong>g>fire</str<strong>on</strong>g>s made mining too dangerous.<br />
Governmental laws led to the closure of many private mines. Since mine entries and ventilati<strong>on</strong><br />
systems were in most cases not properly sealed off, these aband<strong>on</strong>ed private mines are still <str<strong>on</strong>g>risk</str<strong>on</strong>g> <str<strong>on</strong>g>areas</str<strong>on</strong>g><br />
for sp<strong>on</strong>taneous combusti<strong>on</strong> of <str<strong>on</strong>g>coal</str<strong>on</strong>g> seams. The same is true for <str<strong>on</strong>g>coal</str<strong>on</strong>g> waste- and leftover <str<strong>on</strong>g>coal</str<strong>on</strong>g> storage<br />
piles. The <str<strong>on</strong>g>coal</str<strong>on</strong>g> in the Wuda area is particularly pr<strong>on</strong>e to this catalytic effect of self igniti<strong>on</strong>.<br />
The <str<strong>on</strong>g>fire</str<strong>on</strong>g>s in Wuda are m<strong>on</strong>itored by mine engineers and mine administrators and have been numbered<br />
to provide a comm<strong>on</strong> reference. In 2000, an assessment of the boundaries of the <str<strong>on</strong>g>coal</str<strong>on</strong>g> <str<strong>on</strong>g>fire</str<strong>on</strong>g>s by satellite<br />
data, GPS-field measurements and geologic analysis was undertaken (JIA, 2002). Thermal<br />
measurements and borehole drillings supported these activities. The result is a map of Wuda syncline<br />
with 16 demarcated <str<strong>on</strong>g>coal</str<strong>on</strong>g> <str<strong>on</strong>g>fire</str<strong>on</strong>g> <str<strong>on</strong>g>areas</str<strong>on</strong>g>. Furthermore it was found that <str<strong>on</strong>g>coal</str<strong>on</strong>g> <str<strong>on</strong>g>fire</str<strong>on</strong>g>s are burning not <strong>on</strong>ly close<br />
beneath the surface, but up to depths of 50-100 meters (JIA, 2002). Before 1989 most <str<strong>on</strong>g>coal</str<strong>on</strong>g> <str<strong>on</strong>g>fire</str<strong>on</strong>g>s in<br />
Wuda were isolated and scattered in different locati<strong>on</strong>s. The isolated <str<strong>on</strong>g>fire</str<strong>on</strong>g>s started to c<strong>on</strong>nect gradually<br />
between 1989 and 1995 (GANGOPADHYAY, 2003). The changes in <str<strong>on</strong>g>coal</str<strong>on</strong>g> <str<strong>on</strong>g>fire</str<strong>on</strong>g> dynamics observed<br />
between the field visits in 2002, 2003 and 2004 were dramatic. Fires 13-1 and 13-2 had merged, <str<strong>on</strong>g>fire</str<strong>on</strong>g> 6<br />
and <str<strong>on</strong>g>fire</str<strong>on</strong>g> 8 had spread to the North and South and <str<strong>on</strong>g>fire</str<strong>on</strong>g> 3 had shifted southeast. A new very hot <str<strong>on</strong>g>coal</str<strong>on</strong>g> <str<strong>on</strong>g>fire</str<strong>on</strong>g><br />
had developed between <str<strong>on</strong>g>fire</str<strong>on</strong>g>s 6 and 8.<br />
In Ruqigou and Gulaben governmental mining started in 1960. By this time many private small scale<br />
mines already existed. In the year 2000, 4 Mio. t<strong>on</strong>s were mined in the three major mines of Ruqigou<br />
(Dafeng open pit mine, Ruqigou- and Baijigou underground mines) and 1 Mio. t<strong>on</strong>s were produced in<br />
the 7 mines of the Gulaben area, bel<strong>on</strong>ging to the Inner M<strong>on</strong>golia Taixi Anthracite Company, which<br />
exports 30% of the mined <str<strong>on</strong>g>coal</str<strong>on</strong>g> to the world market. About 55 private mines still exist next to these<br />
major mines. At present, the mines in the Ruqigou area are affected by at least 20 <str<strong>on</strong>g>coal</str<strong>on</strong>g> <str<strong>on</strong>g>fire</str<strong>on</strong>g>s, most of<br />
which are currently under the process of extincti<strong>on</strong>. In the Gulaben area, seven active <str<strong>on</strong>g>fire</str<strong>on</strong>g>s are<br />
reported. All are related to former or present small scale commercial mining. In Gulaben al<strong>on</strong>e the<br />
total <str<strong>on</strong>g>coal</str<strong>on</strong>g> <str<strong>on</strong>g>fire</str<strong>on</strong>g> area is estimated to 0.96 km². Here 10 Mio. t<strong>on</strong>s of <str<strong>on</strong>g>coal</str<strong>on</strong>g> are affected and 500,000 t<strong>on</strong>s of<br />
<str<strong>on</strong>g>coal</str<strong>on</strong>g> have already been lost. The total area affected by <str<strong>on</strong>g>coal</str<strong>on</strong>g> <str<strong>on</strong>g>fire</str<strong>on</strong>g>s is assumed to cover more than 2.32.<br />
km² (Ruqigou / Gulaben).<br />
- 50 -
Figure 2-11: Coal mining in Ruqigou<br />
Figure 2-12: Coal infrastructure in Wuda<br />
Figure 2-13: Coal miner in Wuda<br />
Figure 2-14: Housing of a <str<strong>on</strong>g>coal</str<strong>on</strong>g> miner in Wuda<br />
Photos: C. Kuenzer, 09/2002, locati<strong>on</strong>s: 598416E, 4327298N, (2-11), 639280E, 4373504N (2-12 to 2-14), UTM<br />
Z48N<br />
Obvious indicators of underground <str<strong>on</strong>g>coal</str<strong>on</strong>g> <str<strong>on</strong>g>fire</str<strong>on</strong>g>s in both study <str<strong>on</strong>g>areas</str<strong>on</strong>g> are abundant cracks in the surface as<br />
well as land subsidence due to the loss of volume underground (ZHANG, X., 1998, ZHANG, J., et al.<br />
2004a). It has been found that joints in the geologic strata also play a leading role in subsidence<br />
occurrence and <str<strong>on</strong>g>coal</str<strong>on</strong>g> <str<strong>on</strong>g>fire</str<strong>on</strong>g> formati<strong>on</strong> (CHEN 1997). In additi<strong>on</strong> to rockfalls, landslides, cracks and large<br />
scale subsidence other envir<strong>on</strong>mental problems resulting from burning <str<strong>on</strong>g>coal</str<strong>on</strong>g> <str<strong>on</strong>g>fire</str<strong>on</strong>g>s are manifold. Heavy<br />
smoke, rich of carb<strong>on</strong>-m<strong>on</strong>oxide (CO), carb<strong>on</strong>-dioxide (CO 2 ), methane (CH 4 ), sulfur-dioxide (SO 2 ),<br />
nitrous oxides (NO x ) and other green-house relevant and toxic gases (e.g. H 2 S, N 2 O), emit from<br />
openings in the overlying strata. Chemical calculati<strong>on</strong>s indicate that burning of <strong>on</strong>e t<strong>on</strong> of <str<strong>on</strong>g>coal</str<strong>on</strong>g> leads to<br />
an average emissi<strong>on</strong> of 1.17 t<strong>on</strong>s of CO 2 and 0.17 t<strong>on</strong>s of methane, with the latter having a 21-fold<br />
higher greenhouse potency than CO 2 . The gases and the underground heat are resp<strong>on</strong>sible for the<br />
deteriorati<strong>on</strong> of vegetati<strong>on</strong> directly above the <str<strong>on</strong>g>coal</str<strong>on</strong>g> <str<strong>on</strong>g>fire</str<strong>on</strong>g>s. Additi<strong>on</strong>ally, <str<strong>on</strong>g>coal</str<strong>on</strong>g> ash and aerosols are also<br />
deflated to adjacent <str<strong>on</strong>g>areas</str<strong>on</strong>g>, where increasing air polluti<strong>on</strong> can be noticed (HALIK et al. 2003).<br />
A further envir<strong>on</strong>mental problem indirectly induced by <str<strong>on</strong>g>coal</str<strong>on</strong>g> <str<strong>on</strong>g>fire</str<strong>on</strong>g>s is the steadily increasing water<br />
polluti<strong>on</strong>. Since the self purifying capacity of a water body is (am<strong>on</strong>gst others) depending <strong>on</strong> the water<br />
volume, the arid c<strong>on</strong>diti<strong>on</strong>s and precipitati<strong>on</strong> deficit raise the vulnerability of the area for water<br />
polluti<strong>on</strong> through fluid mine waste, <str<strong>on</strong>g>coal</str<strong>on</strong>g> ash and toxic compounds (LAPHAM et al. 1980, RATHORE &<br />
WRIGHT 1993). Since the sparse water sources are used for irrigati<strong>on</strong>, the pollutants easily reach the<br />
- 51 -
30 cm<br />
8 m<br />
Figure 2-15: Cracked surface due to <str<strong>on</strong>g>coal</str<strong>on</strong>g> <str<strong>on</strong>g>fire</str<strong>on</strong>g>s<br />
Photos: C. Kuenzer, 09/2002, locati<strong>on</strong>: 639090E, 4374824N, UTM, Z48N<br />
Figure 2-16: Coal <str<strong>on</strong>g>fire</str<strong>on</strong>g> in Wuda during daytime<br />
food chain. Compared to <str<strong>on</strong>g>areas</str<strong>on</strong>g> not affected by <str<strong>on</strong>g>coal</str<strong>on</strong>g> <str<strong>on</strong>g>fire</str<strong>on</strong>g>s, elevated levels of copper (Cu), zinc (Zn),<br />
fluoride (F), lead (Pb) and cadmium (Cd) have been proven in comm<strong>on</strong> crops. Investigati<strong>on</strong>s of the<br />
health c<strong>on</strong>diti<strong>on</strong>s of local inhabitants have furthermore shown a general decrease of immune system<br />
activity and an increased <str<strong>on</strong>g>risk</str<strong>on</strong>g> for respiratory tract illnesses, tuberculosis and lung cancer (CHEN 1997).<br />
Though envir<strong>on</strong>mental impacts are obvious the main motivati<strong>on</strong> for <str<strong>on</strong>g>coal</str<strong>on</strong>g> <str<strong>on</strong>g>fire</str<strong>on</strong>g> fighting in the study<br />
<str<strong>on</strong>g>areas</str<strong>on</strong>g> is an ec<strong>on</strong>omic <strong>on</strong>e. In all mining <str<strong>on</strong>g>areas</str<strong>on</strong>g> intensive <str<strong>on</strong>g>fire</str<strong>on</strong>g> fighting activities have been undertaken. In<br />
Ruqigou <str<strong>on</strong>g>fire</str<strong>on</strong>g> fighting already started in 1978. Due to the higher quality of <str<strong>on</strong>g>coal</str<strong>on</strong>g> in the Ruqigou-<br />
Gulaben area more governmental funding is provided for the development and applicati<strong>on</strong> of<br />
extinguishing techniques than in Wuda and procedures in this regi<strong>on</strong> are more successful. Coal <str<strong>on</strong>g>fire</str<strong>on</strong>g>s<br />
are fought by sealing off the <str<strong>on</strong>g>fire</str<strong>on</strong>g>s, filling the cracks and openings, pouring water or colloidal mixtures<br />
into cracks or boreholes, covering <str<strong>on</strong>g>fire</str<strong>on</strong>g>s with loess and excavating burning parts of the <str<strong>on</strong>g>coal</str<strong>on</strong>g> seam. All<br />
possible extincti<strong>on</strong> methods either aim at the removal of the combustible, the lowering of the<br />
temperature, the cutting off of the oxygen supply or a combinati<strong>on</strong> of these. In Wuda over 10 Milli<strong>on</strong><br />
Yuan (> 1.2 Milli<strong>on</strong> Euro) have been invested in <str<strong>on</strong>g>coal</str<strong>on</strong>g> <str<strong>on</strong>g>fire</str<strong>on</strong>g> fighting until 2003 (JIA, 2003). However,<br />
many <str<strong>on</strong>g>fire</str<strong>on</strong>g>s are still burning, spreading and are not under c<strong>on</strong>trol. Research has to be undertaken to<br />
improve the early detecti<strong>on</strong> and l<strong>on</strong>g term m<strong>on</strong>itoring of <str<strong>on</strong>g>coal</str<strong>on</strong>g> <str<strong>on</strong>g>fire</str<strong>on</strong>g>s.<br />
30 cm<br />
Figure 2-17: Dead vegetati<strong>on</strong> due to <str<strong>on</strong>g>coal</str<strong>on</strong>g> <str<strong>on</strong>g>fire</str<strong>on</strong>g>s Figure 2-18: Woman wearing a face mask against the<br />
gaseous emissi<strong>on</strong>s, Photos: 2-17: C. Kuenzer, 09/2002, 2-18: S.Voigt, 08/2001<br />
- 52 -
3. Theoretical Background: Image Classificati<strong>on</strong> and Feature<br />
Extracti<strong>on</strong><br />
This chapter presents the theory and state of the art <strong>on</strong> image classificati<strong>on</strong> and feature extracti<strong>on</strong><br />
c<strong>on</strong>sidering different approaches and techniques, combinati<strong>on</strong>s of the latter as well as case studies.<br />
This theoretic complex is the basis for the algorithm design for <str<strong>on</strong>g>coal</str<strong>on</strong>g> <str<strong>on</strong>g>fire</str<strong>on</strong>g> area demarcati<strong>on</strong>.<br />
Within the last decades several approaches and algorithms were developed to classify image data<br />
(FRIEDL & BRODLEY 1997, RICHARDS 1986, TSO & MATHER 2001, LILLESAND & KIEFER 1994).<br />
These methods base <strong>on</strong> the fundamentals of pattern recogniti<strong>on</strong>, where a pattern is defined as a vector<br />
of features describing an object. These features – in the case of image processing defining a pixel or a<br />
cluster of pixels – can be <strong>spectral</strong> reflectance, thermal emittance, radar backscatter, sec<strong>on</strong>dary<br />
derivates like texture, spatial c<strong>on</strong>textual informati<strong>on</strong> or physical values like elevati<strong>on</strong>, slope or aspect.<br />
The final goal of the pattern recogniti<strong>on</strong> process is the establishment of a link between the patterns and<br />
class labels (TSO & MATHER 2001). The extensive number of approaches is roughly grouped into the<br />
main classes presented from chapters 3.2. to 3.12.. Generally speaking, <strong>spectral</strong> classifiers can be split<br />
into the two main categories of parametric and n<strong>on</strong>-parametric classifiers. The first are defined by the<br />
assumpti<strong>on</strong> of an underlying probability distributi<strong>on</strong> of the data, while the latter do not assume<br />
informati<strong>on</strong> about the probability distributi<strong>on</strong> (CORTIJO & PEREZ DE LA BLANCA 1997, 1998,<br />
SCHOWENGERDT 1997). Furthermore, unsupervised and supervised classifiers, c<strong>on</strong>textual and n<strong>on</strong>c<strong>on</strong>textual<br />
methods can be distinguished (KRAUS 1990, KEUCHEL et al. 2003). Most important: it is<br />
impossible to say whether <strong>on</strong>e classifier is better than another, since each classifiers performance<br />
depends <strong>on</strong> the data. Depending <strong>on</strong> their differentiati<strong>on</strong> methodologies, some classifiers or extracti<strong>on</strong><br />
tools are preferred for multi<strong>spectral</strong> data, while others are mainly used for hyper<strong>spectral</strong> data or work<br />
for both inputs. Some yield better results for global, others for local data sets; some require a trained<br />
image analysis expert or extensive ground knowledge, while others need no further input or expertise.<br />
In the examples given, the field of radar data classificati<strong>on</strong> and feature extracti<strong>on</strong> <str<strong>on</strong>g>based</str<strong>on</strong>g> <strong>on</strong> amplitude<br />
or coherence data and parameters like frequency is not treated. This would go bey<strong>on</strong>d the scope of this<br />
work. Detailed studies in the field of radar <str<strong>on</strong>g>based</str<strong>on</strong>g> land cover type discriminati<strong>on</strong> are presented by<br />
BLOM & DAILY (1982), DEROIN et al. (1998), BELCHANSKY & DOUGLAS (2000), BENEDIKTSSON &<br />
SVEINSSON (1997), HAAK (1984), HEIKKONEN et al. (1997), DOUSSET (1995), GAVEAU et al. (2003),<br />
HUBER (2001) and WAGNER et al. (2003), am<strong>on</strong>gst others.<br />
3.1. Feature Space Manipulati<strong>on</strong> Techniques<br />
A central problem for image classificati<strong>on</strong> and feature extracti<strong>on</strong> results from the high data volume of<br />
multi-band satellite images or multitemporal time series (LUNETTA & ELVIDGE 1999, RICHARDS<br />
1986). Hence, a comm<strong>on</strong> technique applied before pattern recogniti<strong>on</strong> is feature space manipulati<strong>on</strong> to<br />
reduce the dimensi<strong>on</strong>ality of the often high-dimensi<strong>on</strong>al data cubes or to manipulate the data in a way<br />
that the maximum informati<strong>on</strong> c<strong>on</strong>tent can be retrieved. TSO & MATHER (2001) give the example that<br />
in an 8 bit Landsat-7 ETM+ scene with 7 bands each pixel could theoretically occupy <strong>on</strong>e of 7×10 16<br />
discrete locati<strong>on</strong>s in feature space. According to the Hughes phenomen<strong>on</strong> (HUGHES 1968) the<br />
effectiveness of a classifier will begin to decrease if a certain number of dimensi<strong>on</strong>s is exceeded. At<br />
- 53 -
the same time it is known that e.g. the first three channels of Landsat TM or ETM+ data are highly<br />
correlated and often have correlati<strong>on</strong> coefficients exceeding 0.9 (HILL 1993a). Feature space<br />
reducti<strong>on</strong>s and manipulati<strong>on</strong>s can therefore help to increase classificati<strong>on</strong> accuracy and enhance<br />
computing speed (LILLESAND & KIEFER 1994). Am<strong>on</strong>gst many similar approaches the most comm<strong>on</strong><br />
feature space manipulati<strong>on</strong> techniques are Principal Comp<strong>on</strong>ent Analysis (PCA), the Minimum Noise<br />
Fracti<strong>on</strong> transformati<strong>on</strong> (MNF), Intensity-Hue-Saturati<strong>on</strong> transformati<strong>on</strong> (HIS), (TSO & MATHER<br />
2001, RICHARDS 1986) and the Tasseled Cap Transformati<strong>on</strong> (TCT). Since the last two are not of<br />
further relevance for this thesis it is referred to the literature, such as KAUTH & THOMAS (1976),<br />
LILLESAND & KIEFER (1994), RICHARDS, (1986), HILL (1993a), CRIST & CICONE (1984), DAVE<br />
(1981), SKAKUN (2003), KUENZER, (2001) and NETELER (1999).<br />
The PCA is a variance analysis of a data set designed to remove the <strong>spectral</strong> redundancy am<strong>on</strong>gst<br />
channels. Applying a PCA orthog<strong>on</strong>alizes the features within the n-dimensi<strong>on</strong>al feature space and<br />
orders the comp<strong>on</strong>ents according to their c<strong>on</strong>tributi<strong>on</strong> to the overall variance of the data set. The first<br />
step in PCA is the calculati<strong>on</strong> of the correlati<strong>on</strong> matrix of the image bands followed by the extracti<strong>on</strong><br />
of eigenvalues and eigenvectors from that matrix and the final transformati<strong>on</strong> of the feature space’s<br />
former coordinate axis using these eigenvectors (RICHARDS 1986, TSO & MATHER 2001, NETELER<br />
1999, BENEDIKTSSON & SVEINSSON 1997). Linear transformati<strong>on</strong>s in general are of the form:<br />
DN’ = W · DN =<br />
⎡W<br />
⎢<br />
⎢<br />
...<br />
⎢⎣<br />
WK<br />
11<br />
1<br />
... W1K<br />
⎤ ⎡ DN1<br />
⎤<br />
... ...<br />
⎥ ⎢ ⎥<br />
⎥ ⎢<br />
...<br />
⎥<br />
... W ⎥⎦<br />
⎢⎣<br />
⎥<br />
KK<br />
DN<br />
K ⎦<br />
(3.1)<br />
where W is the transformati<strong>on</strong> matrix defining the weights for each of the <strong>spectral</strong> bands defining a<br />
coordinate rotati<strong>on</strong> and scaling of the DN to DN’. PCA is of the form:<br />
PC = W PC · DN (3.2)<br />
altering the covariance matrix of a data set C PC according to:<br />
C PC = W PC CW PC<br />
T<br />
(3.3)<br />
The detailed calculati<strong>on</strong> of the PCs is presented in SCHOWENGERDT (1997) and RICHARDS (1986).<br />
Mathematically speaking, the PCA is a rotati<strong>on</strong> of the original coordinate axes in the n-D feature space<br />
to then coincide with the principal axes of the data. The coefficients of the transformati<strong>on</strong> are a<br />
functi<strong>on</strong> of the data <strong>spectral</strong> covariance matrix. Therefore, it is important to note that the PCA is data<br />
dependent. After applying a PCA, the first axis of the feature space points into the directi<strong>on</strong> of the<br />
largest extent of the data cluster. The sec<strong>on</strong>d axis points orthog<strong>on</strong>al to it into the directi<strong>on</strong> of sec<strong>on</strong>d<br />
largest variance and so forth. This indicates that with decreasing comp<strong>on</strong>ent number less of the<br />
variability within the data set is explained (LI & YEH 1998). The result of a PCA are PCA images with<br />
each band c<strong>on</strong>taining <strong>on</strong>e comp<strong>on</strong>ent, being synthetic features, since the new axes resulting from the<br />
rotati<strong>on</strong> are not pre-defined by the user. Due to the newly generated synthetic features, which are<br />
sometimes hard to interpret (LUNETTA & ELVIDGE 1999), preprocessing steps like an atmospheric or<br />
illuminati<strong>on</strong> correcti<strong>on</strong> are not necessarily mandatory (HILL 1993b).<br />
- 54 -
The Minimum Noise Fracti<strong>on</strong> transformati<strong>on</strong> (MNF) – sometimes also referred to as Maximum Noise<br />
Fracti<strong>on</strong> Transformati<strong>on</strong> – produces comp<strong>on</strong>ents, which successively maximize the signal to noise<br />
ratio (TSO & MATHER 2001) requiring estimates of the variance-covariance matrices of signal and<br />
noise of an image, where the latter is often hard to obtain. The problem of PCA, where decreasing<br />
comp<strong>on</strong>ents do not necessarily lead to decreasing image quality, is overcome by sorting the<br />
transformed bands <str<strong>on</strong>g>based</str<strong>on</strong>g> <strong>on</strong> the SNR. The assumpti<strong>on</strong> for the estimati<strong>on</strong> of noise is <str<strong>on</strong>g>based</str<strong>on</strong>g> <strong>on</strong>:<br />
DN(x) = S(x) + N(x) (3.4)<br />
and the theory that variati<strong>on</strong> of the Signal S between a pixel and its neighboring pixel is nearly 0,<br />
while noise N, varies and the difference between two neighboring pixels can be explained by varying<br />
noise; an assumpti<strong>on</strong> which is of course <strong>on</strong>ly true for very homogeneous surfaces and can also lead to<br />
problems if real structures within the image are explained as noise (SCHOWENGERDT 1997,<br />
UNDERWOOD et al. 2003).<br />
The MNF transform (GREEN et al. 1988) is essentially a two cascaded Principal Comp<strong>on</strong>ents<br />
transformati<strong>on</strong>, where the first transformati<strong>on</strong>, <str<strong>on</strong>g>based</str<strong>on</strong>g> <strong>on</strong> an estimated noise covariance matrix,<br />
decorrelates and rescales the noise in the data. This results in transformed data, where the noise has<br />
unit variance and no band-to-band correlati<strong>on</strong>s. The sec<strong>on</strong>d step applies a standard Principal<br />
Comp<strong>on</strong>ents transformati<strong>on</strong> to the noise decorrelated data. For further <strong>spectral</strong> processing, the inherent<br />
dimensi<strong>on</strong>ality of the data can be determined by examining the final eigenvalues and the associated<br />
images. The data space therefore can be divided into two parts. One is associated with large<br />
eigenvalues and coherent eigenimages, while the sec<strong>on</strong>d complementary part shows near-unity<br />
eigenvalues and noise-dominated images. By using <strong>on</strong>ly the coherent porti<strong>on</strong>s, the noise is separated<br />
from the data, thus improving <strong>spectral</strong> processing results (GREEN et al. 1998, RSI 2003).<br />
3.2. Unsupervised Classificati<strong>on</strong> Algorithms (UCA)<br />
Unsupervised classificati<strong>on</strong> approaches (UCA) aim to identify all <strong>spectral</strong> clusters without training<br />
data or ground truth of the area. To apply an unsupervised classificati<strong>on</strong> algorithm the user does not<br />
need a-priori knowledge of the image and in most cases <strong>on</strong>ly has to specify the initial number of<br />
clusters the algorithm shall generate. The most generally used method of unsupervised pattern<br />
recogniti<strong>on</strong> is the basic migrating means or ISODATA clustering algorithm. It accepts from the<br />
analyst the number of clusters to be located in the data. The algorithm then randomly locates artificial<br />
cluster centers within the multidimensi<strong>on</strong>al feature space, before assigning each pixel to the cluster<br />
with the closest arbitrary mean vector. To quantify <strong>spectral</strong> similarity, <strong>spectral</strong> distance measures like<br />
the Euclidean distance (D E ) are used, where the distance between two pixels x 1 and x 2 is calculated as:<br />
D E (x 1 , x 2 ) =<br />
x<br />
n<br />
t<br />
2<br />
1<br />
− x2<br />
= x1<br />
− x2<br />
) ( x1<br />
− x2<br />
) = ∑ ( x1<br />
i<br />
− x2i<br />
)<br />
i=<br />
1<br />
( (3.5)<br />
Here n represents the number of channels and t denotes the matrix transp<strong>on</strong>se. Other than D E many<br />
distance measures between two locati<strong>on</strong>s in feature space exist, such as the Mahalanobis distance, the<br />
Bhattacharyya distance, the Jeffries-Matusita distance or the divergence or angular distance.<br />
Definiti<strong>on</strong>s can be found in SCHOWENGERDT (1997).<br />
- 55 -
Following the distance estimati<strong>on</strong>, revised mean vectors for the single classes are computed in an<br />
iterative process until spatial change of the mean vector is below a certain significance threshold. A<br />
comm<strong>on</strong>ly used criteria for the quality of a clustering process is the sum of squared distances (SSD):<br />
∑∑<br />
t<br />
SSD = x − m ) ( x − m )<br />
C<br />
i<br />
(<br />
i<br />
i<br />
x∈C<br />
i<br />
(3.6)<br />
where m i is the center of the cluster and x∈C i is the assigned <strong>spectral</strong> vector.<br />
Theoretically, the sum of the SSD would be 0 if <strong>on</strong>ly <strong>on</strong>e <strong>spectral</strong> vector is assigned to each cluster.<br />
This would end the clustering process. Practically, iterative cluster analysis is ended through a defined<br />
c<strong>on</strong>vergence criterium: SSD < SSD max . Then the analyst has to determine the land cover identity of<br />
each <strong>spectral</strong> class a posteriori (LILLESAND & KIEFER 1994, CIHLAR et al. 1998).<br />
UCA can be important to observe the <strong>spectral</strong> characteristics of a data cluster before supervised<br />
approaches are applied. In recent years, emphasis has been put <strong>on</strong> the automatic determinati<strong>on</strong> of<br />
cluster numbers by the algorithm itself. The aim is to generate even more user independent methods,<br />
since it is assumed that with unsupervised methods the user has no a-priory knowledge of the area and<br />
therefore cannot necessarily define the cluster number, as it is often the case e.g. with numerous large<br />
scale and time series data sets (VIOVY 2000, CIHLAR et al. 1998). Therefore, UCA are a good<br />
substitute for the usually more accurate supervised methods, when aiming at a large scale applicability<br />
like global or c<strong>on</strong>tinental land cover classificati<strong>on</strong>s using medium to low resoluti<strong>on</strong> satellite data like<br />
MODIS or AVHRR.<br />
Furthermore, they can outperform supervised methods, when an evenly good or <strong>on</strong>ly slightly weaker<br />
classificati<strong>on</strong> result than with supervised methods can be achieved in a very fast time. This is<br />
especially the case, when aiming at the separati<strong>on</strong> of classes with distinct <strong>spectral</strong> differences, as<br />
presented by THOMSON et al. (1998). They preferred unsupervised methods to classify coasts and river<br />
corridors where surface classes could be differentiated very well.<br />
However, UCA have several limitati<strong>on</strong>s. Since the algorithms strive for an overall optimum spanning<br />
of the entire data set, UCA may miss specific detailed but relevant informati<strong>on</strong>. This will not occur in<br />
supervised approaches, where the analyst knows about the existence of such classes, however small<br />
they may be. (CIHLAR et al. 1998, SCHROEDER-BRZOSNIOWSKY, 2000).<br />
Band 1<br />
C3<br />
C4<br />
Band 1<br />
C3<br />
C4<br />
C1<br />
C2<br />
C1<br />
C2<br />
Band 2<br />
Figure 3-1: Ideal (left) and realistic (right) distributi<strong>on</strong> of four classes in a 2-D feature space. In most remote<br />
sensing data sets clusters of thematic classes overlap, complicating extracti<strong>on</strong><br />
Band 2<br />
- 56 -
A hybrid approach between the two was developed by CIHLAR et al. (1998) with their Classificati<strong>on</strong><br />
by Progressive Generalizati<strong>on</strong> (CPG) algorithm. CPG is a combinati<strong>on</strong> of image enhancement,<br />
unsupervised classificati<strong>on</strong> and visual analysis including not <strong>on</strong>ly <strong>spectral</strong> but also spatial measures to<br />
overcome the disadvantages of UCA like cluster number definiti<strong>on</strong> or wr<strong>on</strong>g weighting of clusters.<br />
3.3. Supervised Classificati<strong>on</strong> Algorithms (SCA)<br />
Supervised classificati<strong>on</strong> approaches (SCA) assume that the locati<strong>on</strong>s of some land cover classes /<br />
surface c<strong>on</strong>diti<strong>on</strong>s are known accurately and the analyst therefore has a-priory knowledge of the area<br />
(CIHLAR et al. 1998).<br />
One of the first supervised n<strong>on</strong>-parametric methods developed was the minimum distance (MDC)<br />
approach. A minimum distance classifier uses the mean <strong>spectral</strong> value of classes defined through<br />
training data and computes the distance of an unknown pixel to the given class means. This distance<br />
between the pixel and the class centers is either measured as the Mahalanobis- or the Euclidean<br />
distance, with the first usually showing better classificati<strong>on</strong> results. The Euclidean distance, D E is<br />
defined as shown in equati<strong>on</strong> 3.5. The Mahalanobis distance, D M , is given by:<br />
D M = (X i - µ j ) t × C j -1 + (X i - µ j ) (3.7)<br />
where t denotes the matrix transp<strong>on</strong>se and C j -1 is the inverse of the variance-covariance matrix for<br />
cluster j. While D M takes the shape of the frequency distributi<strong>on</strong> for a given cluster within the feature<br />
space into account and therefore defines ellipsoidal clusters, D E assumes equal variances and a<br />
correlati<strong>on</strong> of 0 between the features resulting in circular clusters, sometimes leading to c<strong>on</strong>trary<br />
assignments of a pixel with regard to cluster centers. In general, the pixel is assigned to the nearest<br />
class (TSO & MATHER 2001, KRAUS 1990). MDC was applied in the work of MALYUTO (2002) or<br />
CARR (1996) and others.<br />
C<strong>on</strong>trary to the MDC method, the parallelepiped (PPC) supervised approach is always sensitive to<br />
variance c<strong>on</strong>sidering the range of <strong>spectral</strong> values in each training class. The range can be defined as<br />
the highest and lowest digital number (DN) value in each <strong>spectral</strong> band creating a multidimensi<strong>on</strong>al<br />
box around the class signatures, the size of which depends <strong>on</strong> the class’ inherent variance. PPC is<br />
quick and easy to implement. However, the classifier has difficulties when decisi<strong>on</strong> regi<strong>on</strong>s overlap as<br />
in the presence of covariance between two or more classes or if a pixel is not c<strong>on</strong>tained within the<br />
predefined parallelepipeds (TSO & MATHER 2001, LILLESAND & KIEFER 1994, KRAUS 1990).<br />
The most frequently used maximum likelihood classifier (MLC) bel<strong>on</strong>gs to the class of parametric<br />
classifiers, assuming that the data is distributed according to a previously defined probability model.<br />
Parameters are defined by the training data. Each pixel x j ∈R d is classified independently by assigning<br />
it to the class y j ∈{ω 1 ,…, ω m }, which has the highest a posteriori probability P(y j = ω k | x j ). The Bayes’<br />
rule is used to calculate these probabilities:<br />
P (y j = ω k | x j ) = (P(x j | y j = ω k ) p(ω k )) / (∑ i P(x j | y j = ω i ) p(ω i )) (3.8)<br />
where P(x j | y j = ω k ) is the probability that x j is observed for the given class ω k, whereas p(ω k ) denotes<br />
the a priori probability of the class ω k , which is known approximately from ground checks. To<br />
- 57 -
calculate P(x j | y j = ω k ) a multivariate Gaussian distributi<strong>on</strong> with mean vector µk and covariance<br />
matrix ∑ k is assumed for each class ω k :<br />
−<br />
d<br />
1<br />
2<br />
P(x j | y j = ω k ) ∝ (( 2π<br />
) Σk<br />
) ⋅ exp( − ( x<br />
j<br />
− μk<br />
)²)<br />
2<br />
1<br />
(3.9)<br />
The resulting a posteriori probability (3.8) is maximized for a given data point x j when it is assigned<br />
the label ω k* according to the classificati<strong>on</strong> rule:<br />
k* = arg<br />
max<br />
k = 1,...,m<br />
1 1<br />
T<br />
−<br />
− ( x )<br />
1<br />
j<br />
− μ<br />
k<br />
Σ<br />
k<br />
( x<br />
j<br />
− μ<br />
k<br />
) − ln ( Σ<br />
k<br />
) + ln ( p ( ω<br />
k<br />
))<br />
2<br />
2<br />
(3.10)<br />
This classificati<strong>on</strong> rule leads to quadratic decisi<strong>on</strong> boundaries between the single classes. The<br />
corresp<strong>on</strong>ding class-dependant parameters µ k and Σ k are estimated from the training data vectors x i<br />
available for class k:<br />
nk<br />
1<br />
μ k = ∑ xi and<br />
n<br />
k<br />
i=<br />
1<br />
∑<br />
1<br />
k )<br />
nk<br />
T<br />
= ∑ ( xi<br />
−μ<br />
k<br />
(3.11)<br />
nk<br />
i=<br />
1<br />
Here n k is the number of training samples for class k (KEUCHEL et al. 2003, SCHROEDER-<br />
BRZOSNIOWSKY, M., 2000, PAL et al. 2001). MLC therefore quantitatively evaluates both, the<br />
variance and the covariance of the individual classes when assigning an unknown pixel. A cluster of a<br />
defined class is described by its mean vector and its covariance matrix. Given these parameters the<br />
statistical probability of a pixel bel<strong>on</strong>ging to a particular predefined class can be computed. After<br />
evaluating the probability of membership for each of the predefined training classes the pixel is<br />
assigned to the class with the highest probability (RICHARDS 1986, YAN 2003). MLC yields the better<br />
results the farther the class means are separated from each other and the smaller the variance within<br />
the predefined classes (KRAUS, 1990). However, PATRONO (1996) states that it is often impossible to<br />
classify an entire image without segmenting or masking the original data.<br />
The MLC approach has been applied <strong>on</strong> global (DEFRIES & TOWNSHEND 1994) and regi<strong>on</strong>al scales<br />
and has been modified by many authors (FRIEDL et al. 2002, KEUCHEL et al. 2003, STOLZ 1998,<br />
BARAL & GUPTA 1997). Furthermore, it has often been transformed from a so called hard classifier<br />
(0/1; either a pixel bel<strong>on</strong>gs to a class or not) to a semi-soft classifier, taking sec<strong>on</strong>d and third pixel<br />
probabilities into account. Furthermore, neighborhood rules, exclusi<strong>on</strong> rules or areal restricti<strong>on</strong> have<br />
softened the MLC approach. Resolving the crispness of standard pixel <str<strong>on</strong>g>based</str<strong>on</strong>g> classifiers has been<br />
developed further e.g. with the supervised fuzzy maximum likelihood classifier proposed by WANG<br />
(1990). Here a pixel can be assigned to several classes as also presented in the study of STOLZ (1998).<br />
HUBERT-MOY et al. (2001) compared different parametric classificati<strong>on</strong> procedures and stress the<br />
variance of classificati<strong>on</strong> results and accuracies depending <strong>on</strong> the character of the study area. They<br />
state that each specific area needs an adapted classificati<strong>on</strong> strategy. However, overall MLC has often<br />
proven to obtain very good classificati<strong>on</strong>s results.<br />
A disadvantage of MLC is the often overall “noisy” impressi<strong>on</strong> of output images. This can be<br />
improved through c<strong>on</strong>textual methods or post-processing (WATSON & WILCOCK 2001). MLC and<br />
- 58 -
other supervised approaches are furthermore limited when large <str<strong>on</strong>g>areas</str<strong>on</strong>g> are to be classified, which<br />
would require too much ground knowledge (cost of field data collecti<strong>on</strong>) (CIHLAR et al. 1998).<br />
Though several large scale case studies prefer minimum distance, n<strong>on</strong>parametric supervised or<br />
unsupervised approaches, many research projects have clearly shown the general superiority of MLC<br />
if ground truth is available (SAN MIGUEL-AYANZ & BIGING 1997, STOLZ 1998). Comparis<strong>on</strong>s of<br />
MLC with n<strong>on</strong>-parametric supervised classifiers were presented by CORTIJO & PEREZ DE LA BLANCA<br />
(1997) and others. Differentiated routines like Support Vector Machine (SVM) approaches, which are<br />
supervised n<strong>on</strong>-parametric algorithms have been developed <strong>on</strong>ly recently and are not yet applied<br />
routinely to remote sensing data (KEUCHEL et al. 2003).<br />
3.4. C<strong>on</strong>textual or Object Oriented Classificati<strong>on</strong> Approaches (OOC)<br />
While pixel <str<strong>on</strong>g>based</str<strong>on</strong>g> approaches <strong>on</strong>ly use the <strong>spectral</strong> informati<strong>on</strong> of the pixel, object oriented<br />
approaches (OOC) combine <strong>spectral</strong> and spatial informati<strong>on</strong> for classificati<strong>on</strong>. This is of advantage<br />
when objects with similar <strong>spectral</strong> informati<strong>on</strong> cannot be separated otherwise. Objects are generated<br />
by image segmentati<strong>on</strong>, subdividing an image into separate regi<strong>on</strong>s <str<strong>on</strong>g>based</str<strong>on</strong>g> <strong>on</strong> measures like object<br />
statistics and -texture, object shape and topological object features. The c<strong>on</strong>cepts of segmentati<strong>on</strong><br />
<str<strong>on</strong>g>based</str<strong>on</strong>g> <strong>on</strong> “n-c<strong>on</strong>nectedness” and rule systems are presented in SCHOWENGERDT (1997). The<br />
segmentati<strong>on</strong> process in the comm<strong>on</strong> OOC software ecogniti<strong>on</strong> allows segmentati<strong>on</strong> <str<strong>on</strong>g>based</str<strong>on</strong>g> <strong>on</strong> primary<br />
features like gray t<strong>on</strong>e and shape or – after an initial classificati<strong>on</strong> – a more advanced classificati<strong>on</strong><br />
<str<strong>on</strong>g>based</str<strong>on</strong>g> segmentati<strong>on</strong>. The multi-resoluti<strong>on</strong> segmentati<strong>on</strong> is a bottom up regi<strong>on</strong> merging technique<br />
starting with <strong>on</strong>e-pixel objects. The objects created <strong>on</strong> different scales can then be linked in a<br />
hierarchical object network defined by the user (BENZ et al. 2004).<br />
Besides, OOC are soft classifiers, which take uncertainties in measurements, parameter variati<strong>on</strong>s,<br />
vague linguistic class descripti<strong>on</strong>s and class mixtures into account. Soft classifiers base <strong>on</strong> fuzzy logic,<br />
which is a multi-value logic. It quantifies uncertain statements, where the boolean logic of “true” and<br />
“false” (or 1 and 0) is replaced by a c<strong>on</strong>tinuous range [0,…,1] with 1 being “true”, 0 being “false” and<br />
the values in between indicating a transiti<strong>on</strong> of the two. Therefore, fuzzy logic is able to approximate<br />
the real world in its complexity much better than boolean approaches. The fuzzy object feature classes<br />
are defined by membership functi<strong>on</strong>s (SCHOWENGERDT 1997, BENZ et al. 2004).<br />
Overall, object oriented approaches are predominantly used for urban area classificati<strong>on</strong> or vegetati<strong>on</strong><br />
type and landscape-unit differentiati<strong>on</strong> (ESCH 2003, BAUER & STEINOCHER 2001, KRESSLER et al.<br />
2003, LOESCHENBRAND et al. 2003). They are generally preferred for the analysis and classificati<strong>on</strong> of<br />
high-spatial-resoluti<strong>on</strong> data like Ik<strong>on</strong>os-, Quickbird- or digital air photo data.<br />
Some authors modified classic OOC approaches, combining them with comm<strong>on</strong> pixel <str<strong>on</strong>g>based</str<strong>on</strong>g> classifiers<br />
(KARTIKEYAN et al. 1998). KEUCHEL et al. (2003) dem<strong>on</strong>strated that the use of a c<strong>on</strong>textual approach<br />
(Iterated C<strong>on</strong>diti<strong>on</strong>al Modes, ICM) in combinati<strong>on</strong> with an MLC could clearly smoothen classificati<strong>on</strong><br />
results. Instead of hard classificati<strong>on</strong> fuzzy labelings can be used during the ICM approach handling<br />
mixed pixels more appropriately. STOLZ (1998) combined MLC and OOC using fuzzy logic theory for<br />
knowledge <str<strong>on</strong>g>based</str<strong>on</strong>g> classificati<strong>on</strong> of an agricultural area. SMITH & FULLER (2001) presented an<br />
improved method for operati<strong>on</strong>al land cover mapping using informati<strong>on</strong> <strong>on</strong> the separati<strong>on</strong> landscape<br />
into land parcels to help classify the data <strong>on</strong> a per parcel basis in an object oriented approach.<br />
- 59 -
Object oriented image analysis is still an extremely interactive process, since the user has to take many<br />
choices c<strong>on</strong>cerning cluster seeds, segmentati<strong>on</strong> size, class definiti<strong>on</strong> etc. and over- or undersegmentati<strong>on</strong><br />
occurs easily. Furthermore, the interactive design of a class hierarchy is a tedious, time<br />
c<strong>on</strong>suming process. The advantages and limitati<strong>on</strong>s of c<strong>on</strong>textual or object oriented approaches are<br />
discussed in detail by HORNSTRA et al. (2000), ESCH (2003), MOELLER-JENSEN (1997), BENZ et al.<br />
(2004), and KARATHANASSI et al. (2000), and others.<br />
3.5. Decisi<strong>on</strong> Tree Classifiers and Knowledge Based Methods (DTC)<br />
A comm<strong>on</strong> and successful method to classify image data are n<strong>on</strong>-parametric unsupervised decisi<strong>on</strong><br />
tree classifier (DTC) approaches (CIHLAR et al. 1998). “A decisi<strong>on</strong> tree is defined as a classificati<strong>on</strong><br />
procedure that recursively partiti<strong>on</strong>s a data set into smaller subdivisi<strong>on</strong>s <strong>on</strong> the basis of a set of <strong>test</strong>s<br />
defined at each branch or node in the tree. A tree is composed of a root node (formed from all of the<br />
data), a set of internal nodes (splits), and a set of terminal nodes (leaves).” (FRIEDL & BRODLEY 1996,<br />
p. 400). Classificati<strong>on</strong> of a pixel in this boolean scheme is performed following the path determined by<br />
the answers to the questi<strong>on</strong>s related to the nodes; from the root node until a leave node is reached<br />
(CORTIJO & PEREZ DE LA BLANCA, 1997).<br />
HANSEN et al. (1996) underline the strengths of DTC approaches compared to standard MLC methods<br />
due to the possibilities of great flexibility in data analysis and interpretati<strong>on</strong> by using the metrics,<br />
which are most useful for discriminating am<strong>on</strong>g cover types. HANSEN et al. (2000) used a DTC for a<br />
global land cover classificati<strong>on</strong> into 12 classes at 1km spatial resoluti<strong>on</strong> <str<strong>on</strong>g>based</str<strong>on</strong>g> <strong>on</strong> AVHRR data. As a<br />
first step the tree splits vegetated from n<strong>on</strong>-vegetated <str<strong>on</strong>g>areas</str<strong>on</strong>g> in a hierarchical pattern splitting the<br />
resulting classes further until the final 11 different vegetati<strong>on</strong> classes, and the class “bare ground” are<br />
distinguished. The rules at the tree intersecti<strong>on</strong>s are purely quantitative, taking channel maxima and<br />
minima, NDVI derivates, channel means and amplitudes into account. BROWN DE COLSTOUN et al.<br />
(2003) employed a decisi<strong>on</strong> tree classifier to distinguish 11 classes in a forest dominated study area.<br />
WEN & TATEISHI (2001) produced a land cover classificati<strong>on</strong> for the whole of Asia using AVHRR<br />
data, taking land surface temperature (LST) derivates, NDVI derivates and elevati<strong>on</strong> data into account.<br />
VOIGT (2000) developed a hierarchical threshold <strong>test</strong> sequence including three <strong>test</strong>s <str<strong>on</strong>g>based</str<strong>on</strong>g> <strong>on</strong><br />
brightness temperature, <strong>on</strong>e <strong>test</strong> <str<strong>on</strong>g>based</str<strong>on</strong>g> <strong>on</strong> the NDVI and two <strong>test</strong>s <str<strong>on</strong>g>based</str<strong>on</strong>g> <strong>on</strong> albedo to automatically<br />
differentiate the classes “cloud”, “snow” and “no snow”. The procedure is similar to a classificati<strong>on</strong><br />
tree approach, though in the strict sense the definiti<strong>on</strong> of a tree is not fulfilled, since some leaves can<br />
be reached via more than <strong>on</strong>e branch. However, the boundary between other knowledge <str<strong>on</strong>g>based</str<strong>on</strong>g><br />
approaches and DTC is not sharp.<br />
R<br />
Y/N<br />
Y/N<br />
Y/N Y/N Y/N Y/N<br />
L L L L L L L L<br />
Figure 3-2: Classificati<strong>on</strong> tree with root node (R), internal nodes (Y/N) and terminal nodes (L)<br />
- 60 -
FRIEDL & BRODLEY (1996) compared several types of DTC, including univarite, multivariate and<br />
hybrid trees, c<strong>on</strong>taining different classificati<strong>on</strong> algorithms within a single tree. They found that<br />
decisi<strong>on</strong> tree approaches – especially hybrid <strong>on</strong>es – generally outperform MLC approaches c<strong>on</strong>cerning<br />
classificati<strong>on</strong> accuracy. Later, MCIVER & FRIEDL (2002) incorporated ML <str<strong>on</strong>g>based</str<strong>on</strong>g> prior probabilities<br />
into decisi<strong>on</strong> tree classificati<strong>on</strong> to better differentiate natural versus agricultural vegetati<strong>on</strong> classes.<br />
Disadvantages of DTC include the fact that the development of a good tree is very time c<strong>on</strong>suming<br />
and c<strong>on</strong>tains several iterati<strong>on</strong>s of training the tree, node-definiti<strong>on</strong>, adding or deleting of leaves,<br />
pruning of the tree etc. Furthermore, trees are sensitive to varying data quality and require detailed<br />
radiometric- and atmospheric correcti<strong>on</strong> (FRIEDL & BRODLEY 1996, BROWN DE COLSTOUN et al.<br />
2003).<br />
3.6. Artificial Neural Networks (ANN)<br />
Many further methods for pattern recogniti<strong>on</strong> exist, am<strong>on</strong>g them neural networks (n<strong>on</strong> parametric). A<br />
artificial neural network (ANN) c<strong>on</strong>sists of a series of layers (input layers, hidden processing layers,<br />
output layers) with a number of processing units or neur<strong>on</strong>s linked to other neur<strong>on</strong>s <strong>on</strong> subsequent<br />
layers. The input layers are an interface to the input data. The processing nodes c<strong>on</strong>tain summati<strong>on</strong>s<br />
and transformati<strong>on</strong>s and within the output nodes the output is calculated, as schematically shown in<br />
figure 3-3.<br />
We igh ts<br />
P<br />
We igh ts<br />
I<br />
O<br />
P<br />
P<br />
I<br />
O<br />
I<br />
Sum<br />
F( S)<br />
O<br />
P<br />
I<br />
O<br />
P<br />
Figure 3-3: Scheme of an Artificial Neural network (ANN) with input layers (I), processing nodes (P) and output<br />
layers (O), (SCHOWENGERDT 1997), modified<br />
The ANN’s training stage is an iterative process c<strong>on</strong>verging to a stable soluti<strong>on</strong> by small incremental<br />
changes in system weights, which determine the decisi<strong>on</strong> boundaries (SCHOWENGERDT 1997). The<br />
ANN’s learning strategy therefore specifies the initial set of weights and indicates how these weights<br />
and neur<strong>on</strong> values should be updated in order to improve performance. Mathematically speaking, most<br />
NN methods are <str<strong>on</strong>g>based</str<strong>on</strong>g> <strong>on</strong> the optimizati<strong>on</strong> (minimizati<strong>on</strong>) of a cost functi<strong>on</strong>. NN topologies can work<br />
in supervised or unsupervised modes. More details <strong>on</strong> the often highly complex NNs can be found in<br />
TSO & MATHER (2001), BENEDIKTSSON & SVEINSSON (1997) and KRAUS (1990). GOPAL et al. (1999)<br />
used a NN architecture named ARTMAP to classify 1° AVHRR data, which before had been<br />
- 61 -
classified with an MLC approach by DEFRIES & TOWNSHEND (1994). They could improve<br />
classificati<strong>on</strong> accuracy when ARTMAP was trained with 80% of the input data. ABUELGASIM et al.<br />
(1996) employed an artificial neural network to identify five different land cover classes, while NIANG<br />
et al. (2003) used an automatic neural classificati<strong>on</strong> approach for ocean color mapping. YANG et al.<br />
(1998) employed NNs to classify different lithologies in Canada’s Northwest Territories.<br />
Nevertheless, in most cases the newer supervised neural network approaches have not gained much<br />
relevance, especially since their results rarely yield greatly increased classificati<strong>on</strong> accuracies<br />
compared with standard methods like MLC (NETELER 1999). FRIEDL & BRODLEY (1996) underline<br />
the drawback of neural networks, stating that they are time c<strong>on</strong>suming, highly complex with regard to<br />
their algorithmic basis and therefore require substantial expertise and interacti<strong>on</strong> or both.<br />
3.7. Binary Encoding (BE)<br />
Though the algorithms described above can be applied to hyper<strong>spectral</strong> data, they are more comm<strong>on</strong>ly<br />
used for multi<strong>spectral</strong> input, while the following methods are mainly applied to the former. Though no<br />
algorithm has theoretical limitati<strong>on</strong>s in the number of bands processable, MLC (e.g.) will appear<br />
inefficient when applied to over 200 different bands.<br />
Binary Encoding (BE) of the <strong>spectral</strong> dimensi<strong>on</strong> of a data set was an early approach to classify high<br />
<strong>spectral</strong> resoluti<strong>on</strong> data. The <strong>spectral</strong> radiances are coded <str<strong>on</strong>g>based</str<strong>on</strong>g> <strong>on</strong> a single DN threshold, which is<br />
specified. Values above the threshold are coded as <strong>on</strong>e, while values located below the threshold are<br />
coded as zero. Therefore, a single bit in each channel can be used to code the spectrum<br />
(SCHOWENGERDT 1997). Discriminati<strong>on</strong> can further be supported by encoding the derivative of the<br />
spectrum also to zero and <strong>on</strong>e, depending if it is negative or positive. Modificati<strong>on</strong>s of BE can reach<br />
that the coded features are less sensitive to solar effects and atmosphere or BE results can be improved<br />
when using multiple thresholds (SCHOWENGERDT 1997). The BE coded spectra can be compared bit<br />
by bit using the “Hamming distance”, which is “defined as the number of bits that are different in two<br />
binary numbers” (SCHOWENGERDT, 1997, p. 468). The drawback of binary encoding is – like for some<br />
other matching techniques – that it does not take the effect of compositi<strong>on</strong>al mixing into account<br />
(MARACCI, 1992). BE is presented in greater detail in MARACCI (1992). It was am<strong>on</strong>gst others applied<br />
by KRUSE et al. (1990), mapping mineral compositi<strong>on</strong> of the Cuprite <strong>test</strong> site, Nevada.<br />
3.8. Spectral Mixture Analysis (SMA)<br />
Spectral Mixture Analysis (SMA) is <str<strong>on</strong>g>based</str<strong>on</strong>g> <strong>on</strong> the c<strong>on</strong>cept that <strong>spectral</strong><br />
characteristics of a pixel are composed of a mixture of several <strong>spectral</strong><br />
patterns resulting from different surface types in the pixel or simply<br />
an evenly mixed medium filling the pixel (e.g. water with sediment).<br />
Hence, <strong>spectral</strong> mixtures can be described with additive linear<br />
processes (SETTLE & DRAKE, 1993, MARACCI, 1992).<br />
Figure 3-4: Different types of mixed pixels, (FISHER 1997)<br />
- 62 -
Though the approach was already known in the 1970s it was not until the early 1990s that the method<br />
started to be applied <strong>on</strong> a broader basis by several authors. Especially with an increase of the<br />
integrati<strong>on</strong> of remote sensing data analysis results into models and the increasing need for quantitative<br />
data SMA is a promising approach.<br />
In SMA pixels are transformed from the n-dimensi<strong>on</strong>al feature space to a mixing space, spanned up by<br />
endmembers, which are automatically defined (TOMPKINS et al. 1997) or derived / supplied by the<br />
user. Calculating the abundances (endmember fracti<strong>on</strong>s in a pixel) is possible with:<br />
A · X = R and X = A -1 · R (3.12)<br />
where:<br />
A: m × n-matrix of <strong>spectral</strong> endmembers (<strong>spectral</strong> library) in n <strong>spectral</strong> bands<br />
X: vector of unknown abundances of the endmembers<br />
R: measured reflecti<strong>on</strong> of the image pixel<br />
So the unknown vector of abundances can be calculated by inverting the endmember-matrix, where<br />
the number of comp<strong>on</strong>ent spectra may not exceed the number of <strong>spectral</strong> bands.<br />
In other terms, <strong>spectral</strong> mixtures can be derived <str<strong>on</strong>g>based</str<strong>on</strong>g> <strong>on</strong> an optimizati<strong>on</strong> of surface comp<strong>on</strong>ent<br />
percentages <str<strong>on</strong>g>based</str<strong>on</strong>g> <strong>on</strong> a residual error minimizati<strong>on</strong> of the input channels:<br />
R<br />
i<br />
n<br />
= Σ<br />
j=<br />
1<br />
f ×<br />
j<br />
RE<br />
ij<br />
+ ε<br />
i<br />
and<br />
n<br />
Σ<br />
j=<br />
1<br />
f<br />
j<br />
= 1<br />
(3.13)<br />
where:<br />
R i : <strong>spectral</strong> reflectance of a mixed spectrum in image band i<br />
f j : fracti<strong>on</strong> of each endmember j calculated band by band<br />
RE ij : reflectance of the endmember spectrum j in band i<br />
i: band number<br />
j: each of the n image endmembers<br />
f j : residual error or the difference between the measured and the modeled DN in band i<br />
ε i : modeling error in band i<br />
n: number of endmembers<br />
The residual error ε i of each of the image end-members is approximated by the measured and the<br />
modeled DN in band i. Minimizing ε i in a least squares soluti<strong>on</strong> yields a unique soluti<strong>on</strong> to the<br />
unmixing equati<strong>on</strong>. ε i should – in an ideal case – be equal to the instrument noise, if <strong>on</strong>ly the<br />
endmembers of the selected model were present in the pixel. However, this case is very rare. Residuals<br />
ε i over all <strong>spectral</strong> bands for a pixel can be averaged to receive the root mean square error (RMSE),<br />
which can be displayed as an image. It is calculated from the difference of the modeled (with SMA)<br />
and the measured (actual) pixel spectrum as:<br />
RMS =<br />
1<br />
m<br />
m<br />
n<br />
∑ ∑<br />
k = 1 j=<br />
1<br />
( R<br />
where:<br />
m: number of pixels within the image<br />
n: number of <strong>spectral</strong> bands<br />
− R'<br />
)² n<br />
(3.14)<br />
jk jk<br />
/<br />
- 63 -
R jk : modeled pixel spectrum<br />
R’ jk : real pixel spectrum<br />
Furthermore, ε i can also be calculated <strong>on</strong> a per channel basis to evaluate the quality of the model, with:<br />
n<br />
i<br />
=<br />
i<br />
− ∑<br />
i=1<br />
ε R f × RE<br />
(3.15)<br />
j<br />
ij<br />
(symbols and abbreviati<strong>on</strong>s as in 3.13.)<br />
Since the sum of all <strong>spectral</strong> endmember reflecti<strong>on</strong> fracti<strong>on</strong>s including the RMSE needs to reach a sum<br />
of 1 (100%) as shown in equati<strong>on</strong> 3.13. this approach is also referred to as “c<strong>on</strong>strained” <strong>spectral</strong><br />
unmixing. This additi<strong>on</strong>al c<strong>on</strong>diti<strong>on</strong> of forcing the endmember fracti<strong>on</strong>s to sum up to unity (yielding<br />
an additi<strong>on</strong>al equati<strong>on</strong>) allows the input of an additi<strong>on</strong>al endmember. In this c<strong>on</strong>strained case the<br />
maximum number of endembers is equal to the number of input bands plus <strong>on</strong>e. In case the number of<br />
endmembers is lower than the number of bands, the linear equati<strong>on</strong>s are over-determined and can be<br />
solved applying a pseudo-inversi<strong>on</strong> of the form:<br />
X<br />
T −1 T<br />
= ( A A)<br />
A R + E<br />
(3.16.)<br />
where X is the vector of unknown abundances of the endmembers, A is the m × n-matrix of <strong>spectral</strong><br />
endmembers, R is the pixel reflectance and E the error term. A T is the transposed matrix of A.<br />
Reflectance<br />
= A x<br />
+ B x + C x<br />
Re flectance<br />
Reflectance<br />
Reflectance<br />
Wavelen gth<br />
Wave len gth<br />
Figure 3-5: Principle of linear Spectral Mixture Analysis (SMA).<br />
Wavelen gth<br />
Wave length<br />
Advantages of SMA are the possibility to estimate surface fracti<strong>on</strong>s within a pixel in a standardized<br />
way. Furthermore, trends in fracti<strong>on</strong> time series can be analyzed to perform change detecti<strong>on</strong> studies<br />
<strong>on</strong> a quantitative basis. HILL (1993b) states that <strong>spectral</strong> training is <strong>on</strong>e of the major drawbacks to<br />
traditi<strong>on</strong>al parametric land cover mapping. Classificati<strong>on</strong> approaches and results are hardly<br />
reproducible. The classificati<strong>on</strong> process will furthermore be str<strong>on</strong>gly biased by the analyst. It is<br />
therefore doubtful that mapping results can be compared objectively with reference maps from earlier<br />
dates. Here SMA can be a soluti<strong>on</strong>.<br />
Furthermore, the axes defining the feature space do not have to be orthog<strong>on</strong>al like in PCA or TCT, but<br />
can be defined through the focus of the analyst, although with decreasing angle between the axes<br />
(increasing dimensi<strong>on</strong>s) redundancies grow. Problematic is that e.g. for Landsat data the number of<br />
extractable endmembers is reduced to three to four, due to the high correlati<strong>on</strong> of the first bands<br />
- 64 -
(RADELOFF et al. 1997, VAN DER MEER & DE JONG 2001, HILL 1998, MUECHER et al. 2000,<br />
GARCIA-HARO et al. 1994).<br />
Spectral unmixing approaches to assess human induced soil erosi<strong>on</strong> or land degradati<strong>on</strong> were am<strong>on</strong>gst<br />
many others applied by HILL (19963b), KOCH (2000), HOSTERT (2001), and NETELER (1999). Studies<br />
in the field of vegetati<strong>on</strong> discriminati<strong>on</strong> were am<strong>on</strong>gst others undertaken by COCHRANE & SOUZA<br />
(1998), FOODY & COX (1994), ROBERTS et al. (1998), BACHMANN (2002) and multi land cover<br />
mapping by DRAKE et al. (1999). ASNER & HEIDEBRACHT (2003) applied SMA to recent<br />
hyper<strong>spectral</strong> HYPERION satellite data while FARAND (1997) extracted endmembers from AVIRIS<br />
data to trace mine waste flows al<strong>on</strong>g a river streambed.<br />
Standard SMA has been modified by many authors like VAN DER MEER (1999b), THESEIRA et al.<br />
(2002) and TOMPKINS et al. 1997. DRAKE et al. (1999) underline the problem of unmixing data that is<br />
n<strong>on</strong>linearly mixed with a linear data model. Linear mixing assumes that each phot<strong>on</strong> has <strong>on</strong>ly<br />
interacted with <strong>on</strong>e material in the image. In reality – especially in highly vegetated <str<strong>on</strong>g>areas</str<strong>on</strong>g> – objects are<br />
not always opaque and significant amounts of transmissi<strong>on</strong> induce multiple scattering, resulting in<br />
n<strong>on</strong>linear mixing (ROBERTS et al. 1993, BOREL & GERSTL 1994, RAY & MURRAY 1996). However,<br />
the vast amount of a-priory and additi<strong>on</strong>al data necessary for n<strong>on</strong>-linear calculati<strong>on</strong>s make n<strong>on</strong>-linear<br />
SMA rarely feasible (HOSTERT 2001).<br />
In general, it needs to be remembered that all natural and most man made surfaces are mixed at some<br />
level of spatial resoluti<strong>on</strong>. Signature mixing therefore occurs at all scales and does not “disappear” as<br />
<strong>on</strong>e increases the spatial resoluti<strong>on</strong> of the data set. However, since there is a “natural scale” to most<br />
surfaces depending <strong>on</strong> the research questi<strong>on</strong>, the decisi<strong>on</strong> to apply or not apply SMA can be met.<br />
3.9. Spectral Angle Mapping (SAM)<br />
A technique often used for the mapping of abundances is <strong>spectral</strong> angle mapping (SAM), which<br />
calculates the <strong>spectral</strong> similarity between a <strong>test</strong> reflectance spectrum and a reference reflectance<br />
spectrum, assuming that the data is correctly calibrated to apparent reflectance (VAN DER MEER & DE<br />
JONG 2001). The <strong>spectral</strong> similarity between the pixel, t, and the reference spectrum, r, is expressed in<br />
terms of the average angle, Θ, between the two spectra as calculated for each channel, i, as:<br />
which equals:<br />
Θ = cos<br />
−1<br />
⎛<br />
⎜<br />
⎜<br />
⎝<br />
⎯→⋅<br />
⎯→<br />
⎯→ ⋅ ⎯→<br />
t<br />
t<br />
r<br />
r<br />
⎞<br />
⎟<br />
⎟<br />
⎠<br />
(3.17)<br />
Θ = cos<br />
−1<br />
(<br />
n<br />
∑<br />
n<br />
∑<br />
i=<br />
1<br />
t<br />
t r<br />
²<br />
n<br />
∑<br />
i<br />
i= 1 i=<br />
1<br />
i<br />
i<br />
r ²<br />
i<br />
)<br />
(3.18)<br />
The spectra are seen as vectors in a multidimensi<strong>on</strong>al feature space. The dimensi<strong>on</strong>s are defined by the<br />
number of bands, n. The result of SAM is an image representing angular differences measured in<br />
radians ranging from 0 to π/2, which gives a qualitative estimate of the presence of absorpti<strong>on</strong><br />
- 65 -
features (VAN DER MEER & DE JONG 2001). The derived <strong>spectral</strong> angle maps therefore form a new<br />
data cube with the number of bands equal to the number of reference spectra in the mapping. The<br />
method is insensitive to illuminati<strong>on</strong> differences, since the SAM algorithm uses <strong>on</strong>ly the vector<br />
directi<strong>on</strong> and not the vector length. Furthermore it is <str<strong>on</strong>g>based</str<strong>on</strong>g> <strong>on</strong> simple linear algebra, computati<strong>on</strong>ally<br />
easy and <strong>on</strong>e can add and drop bands as desired. SAM is usually used as a first procedure to determine<br />
the mineralogy in high to hyper<strong>spectral</strong> resoluti<strong>on</strong> images of geologically interesting <str<strong>on</strong>g>areas</str<strong>on</strong>g>.<br />
KRUSE et al. (2003) applied SAM to c<strong>on</strong>duct mineral mapping investigati<strong>on</strong>s <strong>on</strong> AVIRIS and<br />
HYPERION data, VAN DER MEER et al. 1997 mapped ophiolote lithologies in Cyprus, and HORNSTRA<br />
et al. (2003) compare SMA to other classificati<strong>on</strong> methods from a c<strong>on</strong>ceptual point of view.<br />
Material 1<br />
Band 1<br />
Sp ectral a ngle<br />
Mate ria l 2<br />
Band 1<br />
Ba nd 2<br />
Ba nd 2<br />
Figure 3-6: Principle of Spectral Angle Mapping (SAM). Material 1 and 2 can clearly be distinguished by the<br />
angle. In the 2-D feature space to the right, the two ellipsoids located <strong>on</strong> <strong>on</strong>e vector (no angle<br />
difference) will be difficult to distinguish.<br />
3.10. Spectral Feature Fitting (SFF)<br />
Spectral feature fitting (CLARK & SWAYZE 1995) is a method matching pixel spectra to reference<br />
spectra <str<strong>on</strong>g>based</str<strong>on</strong>g> <strong>on</strong> their characteristic absorpti<strong>on</strong> features. The matching process is <str<strong>on</strong>g>based</str<strong>on</strong>g> <strong>on</strong> a least<br />
squares “best fit” approach. The better the fit, the smaller the sum of squared distances between the<br />
two spectra compared. The measure for this fit, the root mean square error (RMS), is used to create an<br />
RMS image, which indicates if pixels are more or less similar to the selected reference endmember<br />
(VAN DER MEER & DE JONG 2001, KOKALY et al. 2003).<br />
CLARK & SWAYZE (1995) developed an algorithm named “Tetracorder” (formerly “Tricorder”) that<br />
uses a digital library of known materials and a fast, modified-least-squares method to determine, if a<br />
single <strong>spectral</strong> feature of a given material is present in an image. The algorithm can simultaneously<br />
map multiple materials using multiple <strong>spectral</strong> input features. It furthermore has the capability to<br />
analyze spectra step wise, using operator defined case <strong>sequences</strong> or gives the opti<strong>on</strong> of fit, band depth<br />
and c<strong>on</strong>tinuum thresholding.<br />
Preferably, c<strong>on</strong>tinuum removed spectra are used and compared to known c<strong>on</strong>tinuum reference spectra<br />
(CLARK et al. 1990). Absorpti<strong>on</strong> in a spectrum c<strong>on</strong>sists of the c<strong>on</strong>tinuum and the individual features.<br />
- 66 -
The absorpti<strong>on</strong> bands are characterized by parameters like wavelength positi<strong>on</strong>, depth, width,<br />
asymmetry, slope of the upper c<strong>on</strong>vex hull and area (URL 3-1). The c<strong>on</strong>tinuum or background<br />
represents the overall albedo of the reflectance curve. This is removed to extract absorpti<strong>on</strong> features<br />
using the Hull technique, also referred to as c<strong>on</strong>tinuum removal (VAN DER MEER & DE JONG 2001),<br />
normalizing the data. The hull c<strong>on</strong>sists of a series of line segments that c<strong>on</strong>nect various local<br />
reflectance maxima within the spectrum. Therefore, the upper c<strong>on</strong>vex hull is calculated as an<br />
enveloping curve <strong>on</strong> the pixel spectra having no absorpti<strong>on</strong> features. The hull difference is created by<br />
subtracting the hull from the spectrum and then adding 100% to the result (VAN DER MEER & DE JONG<br />
2001, ZHANG, J., 1996). The c<strong>on</strong>tinuum removed spectra can then be used for further characterizati<strong>on</strong><br />
of absorpti<strong>on</strong> features (KOKALY et al. 2003, UNDERWOOD et al. 2002).<br />
In general, absorpti<strong>on</strong> feature depth is proporti<strong>on</strong>al to the <strong>spectral</strong> abundance of the material in the<br />
pixel. In SFF several library spectra or other reference spectra are used for the calculati<strong>on</strong> of fits and<br />
the spectrum with the best fit is chosen as the identified material. Identificati<strong>on</strong> of this <strong>spectral</strong>ly<br />
dominant material does not imply though that other materials do not exist within the spectrum.<br />
3.11. Other Spectral Matching and Classificati<strong>on</strong> Techniques<br />
Spectral matching (SM) as applied by DE JONG (1994) works <strong>on</strong> a pixel by pixel basis <str<strong>on</strong>g>based</str<strong>on</strong>g> <strong>on</strong> the<br />
approach that a pixel spectrum of an image is matched with a reference spectrum for the entire- or<br />
parts of the <strong>spectral</strong> range respectively. The similarity index (SI) calculates the normalized Euclidean<br />
distance between two spectra in a user defined <strong>spectral</strong> window:<br />
n<br />
( W −<br />
SI = i<br />
Ri<br />
)²<br />
∑<br />
(3.19)<br />
( n − m 1)<br />
i= m +<br />
where W i is the pixel spectrum, R i is the reference spectrum and n and m are the band numbers of a<br />
user defined window. The lower the SI value, the better the match of the two spectra. Hence, a SI<br />
value of 0 indicates a perfect match. Prior to SI calculati<strong>on</strong> the spectra should be corrected for their<br />
vertical offset.<br />
DRAKE et al. (1999) found that <strong>spectral</strong> matching of pure library spectra to those in an image was an<br />
effective method to classify image data prior to SMA and to identify and locate endmembers for SMA,<br />
including the very purest pixels of each identified material (MARACCI 1992). VAN DER MEER (2000)<br />
introduced Cross Correlogram Spectral Matching (CCSM) to match known <strong>spectral</strong> signatures to<br />
unknown <strong>spectral</strong> signatures in order to determine the similarity of the two. His technique calculates<br />
cross correlograms between the two spectra, with<br />
r m =<br />
r t r t<br />
2<br />
2<br />
2<br />
2<br />
[ nΣλ<br />
− Σλ<br />
) ][ nΣλ<br />
− ( Σλ<br />
) ]<br />
r<br />
nΣλ<br />
λ − Σλ<br />
Σλ<br />
(<br />
r<br />
t<br />
t<br />
(3.20)<br />
where r m is the cross correlati<strong>on</strong> at matching positi<strong>on</strong> m, λ t is the target spectrum, λ r is the reference<br />
spectrum and n is the number of overlapping positi<strong>on</strong>s (= <strong>spectral</strong> bands). The reference spectrum is<br />
- 67 -
shifted subsequently over m channels to shorter and l<strong>on</strong>ger wavelengths using the RMS, derived from<br />
the difference between the calculated CC and the ideal CC for the reference, as a measure for<br />
matching-success. As in any <strong>spectral</strong> matching procedure c<strong>on</strong>tinuum removal is suggested prior to the<br />
operati<strong>on</strong>. The advantages of CCSM are the insensitivity to gain factors, the fact that the CC is equally<br />
affected by random noise, the direct correlati<strong>on</strong> of the correlati<strong>on</strong> maximum with the relative positi<strong>on</strong><br />
of absorpti<strong>on</strong> features and the opti<strong>on</strong> to compare target and reference statistically. A disadvantage is<br />
the fact that CCSM does not c<strong>on</strong>sider mixtures (VAN DER MEER 2000).<br />
Further additi<strong>on</strong>al approaches are manifold, and it is often hard to determine, if an approach still<br />
bel<strong>on</strong>gs to the above defined methods or if it is modified str<strong>on</strong>gly enough to be c<strong>on</strong>sidered a standal<strong>on</strong>e<br />
new method. Furthermore, many authors assign own names or abbreviati<strong>on</strong>s to their algorithms.<br />
ZHU & BLUMBERG (2002) and KEUCHEL et al. (2003) used support vector machine (SVM) algorithms<br />
<str<strong>on</strong>g>based</str<strong>on</strong>g> <strong>on</strong> statistical learning theory for accurate classificati<strong>on</strong> procedures of urban <str<strong>on</strong>g>areas</str<strong>on</strong>g> from Aster<br />
and TM data for general land cover classificati<strong>on</strong>s, respectively. PALACIOS-ORUETA et al. (1999) used<br />
a hierarchical foreground and background analysis to discriminate soil properties (organic matter and<br />
ir<strong>on</strong> c<strong>on</strong>tent) from two valleys in the Santa M<strong>on</strong>ica Mountains, CA. RESMINI et al. (1997) employed a<br />
c<strong>on</strong>strained energy minimizati<strong>on</strong> (CEM) algorithm <strong>on</strong> HYDICE data for mineral mapping at the<br />
Cuprite, Nevada, <strong>test</strong> site. To review all these less known hybrid approaches is not within the scope of<br />
this work. Review papers including most classificati<strong>on</strong> and feature extracti<strong>on</strong> approaches are rare;<br />
however, good overviews can be found in TSO & MATHER (2001), RICHARDS (1986),<br />
SCHOWENGERDT 1997 and VAN DER MEER & DE JONG (2001) am<strong>on</strong>gst others.<br />
3.12. Thermal Approaches for Geologic Mapping<br />
Geologic surfaces have been classified and mapped with all the methods presented and explained<br />
above. Examples for case studies are given in the respective subchapters. Still, there are some<br />
approaches specific to geologic mapping, which shall briefly be menti<strong>on</strong>ed here also.<br />
A comm<strong>on</strong> tool for data transformati<strong>on</strong> of geologic data used prior to classificati<strong>on</strong> are PCA and IHS<br />
transforms. PCA is explained in 3.1, details <strong>on</strong> IHS transformati<strong>on</strong>, rotating the Red-Green-Blue<br />
(RGB) color space to an Intensity-Hue-Saturati<strong>on</strong> color (IHS) space are given by LILLESAND &<br />
KIEFER (1994). KENEA (1997) presents the often applied techniques of calculating a PCA or IHS<br />
transformati<strong>on</strong> <strong>on</strong> geologic remote sensing data, decorrelati<strong>on</strong>-stretching the transformed data and<br />
employing an inverse PCA or IHS transformati<strong>on</strong> afterwards to <strong>spectral</strong>ly improve the separability of<br />
geologic units and rocks with subtle mineralogical differences. Also CASACCHIA et al. (1999) applied<br />
these methods to differentiate rock units in Antarctica. Nevertheless, both methods result in changed<br />
pixel values and synthetic features. Hence, they are mainly applied for visual interpretati<strong>on</strong> or<br />
classificati<strong>on</strong> procedures not relying <strong>on</strong> field spectra or radiometrically corrected input data as<br />
presented by MICKUS & JOHNSON (2001), who used Landsat-TM and SPOT data for the<br />
discriminati<strong>on</strong> of sedimentary and volcanic units in Petriefied Forest Nati<strong>on</strong>al Park, Ariz<strong>on</strong>a. They<br />
applied the transforms menti<strong>on</strong>ed above and classified the data with an MLC approach as also d<strong>on</strong>e by<br />
KRISHNAMURTHY (1997).<br />
Often times, different rocks do not have distinctly different <strong>spectral</strong> reflectance curves, since they<br />
might be of similar mineral c<strong>on</strong>tent, grain size or water c<strong>on</strong>tent. However, a comm<strong>on</strong> method for rock<br />
type discriminati<strong>on</strong> is to incorporate a thermal band into the analysis. Different rock types may show a<br />
- 68 -
different thermal behavior, due to different thermal inertias, which characterize the warming and<br />
cooling behavior of rocks. Therefore, an interesting approach to map different rock units is the<br />
classificati<strong>on</strong> of thermal image products generated by subtracting thermal nighttime data from thermal<br />
daytime data. KAHLE et al. (1976) e.g. mapped different geologic units <str<strong>on</strong>g>based</str<strong>on</strong>g> <strong>on</strong> airborne scanner<br />
derived diurnal temperature ranges (ΔT), which were studied as a functi<strong>on</strong> of albedo, slope, aspect and<br />
thermal inertia. Also ABRAMS et al. (1984) stress the fact that thermal radiance data can augment the<br />
surface reflectance data and provide additi<strong>on</strong>al informati<strong>on</strong> related to material compositi<strong>on</strong>. This<br />
applies especially, when coatings <strong>on</strong> exposed materials mask their true compositi<strong>on</strong>. They employed<br />
HCMM (Heat Capacity Mapping Missi<strong>on</strong>) daytime and nighttime data to calculate thermal inertia<br />
images and generated image products c<strong>on</strong>sisting of thermal IR daytime-, thermal IR nighttime and<br />
VNIR daytime data, presenting a wide variety of rocks, which had similar colors or similar overall<br />
spectra in Landsat MSS data. They reached very detailed mapping results, but stated that the spatial<br />
resoluti<strong>on</strong> of HCMM (600 m at nadir) was a limiting factor. Also CRACKNELL & XUE (1996) discuss<br />
the possibilities to employ thermal informati<strong>on</strong> for geologic mapping. Thermal inertia images as well<br />
as the more easily derived apparent thermal inertia (ATI) images (SABINS 1996), ΔT images and<br />
emissivity images (HOOK et al. 1992) can be derived, if thermal daytime and nighttime data or data<br />
with different thermal bands exist.<br />
3.13. Change Detecti<strong>on</strong> Studies<br />
Independently of the classificati<strong>on</strong> or feature detecti<strong>on</strong> algorithm applied, typical applicati<strong>on</strong>s for<br />
advanced studies are change detecti<strong>on</strong> analyses. An overview of the most comm<strong>on</strong>ly used change<br />
detecti<strong>on</strong> methods including image differencing, vegetative index differencing, selective PCA, direct<br />
multi-date unsupervised classificati<strong>on</strong>, post classificati<strong>on</strong> change differencing and combinati<strong>on</strong>s of the<br />
above is given by MAS (1999). Also in the range of <strong>spectral</strong> feature matching or SMA many<br />
differencing approaches, trend analysis studies of fracti<strong>on</strong> images etc. are undertaken. The thematic<br />
foci of change detecti<strong>on</strong> studies are as manifold as the broad range of geoscientific research topics.<br />
YOUNG & WANG (2001) assessed the land cover changes of the whole of China using global<br />
Pathfinder AVHRR land cover data between 1982 and 1992 <strong>on</strong> the basis of NDVI time series. REES et<br />
al. (2003) mapped land cover changes in a reindeer herding area of the Russian Arctic to show the<br />
dynamics and temporal trends in phenology induced by grazing. PRAKASH & GUPTA (1998)<br />
investigated land cover changes in the Jharia <str<strong>on</strong>g>coal</str<strong>on</strong>g> mining area, India, and GREY et al. (2003)<br />
investigated urban area changes <str<strong>on</strong>g>based</str<strong>on</strong>g> <strong>on</strong> satellite radar interferometry. ANDRÉFOUET et al. (2001)<br />
analyzed the temporal development of coral reef envir<strong>on</strong>ments, ABUELGASIM et al. (1999) employed<br />
fuzzy neural networks for the change detecti<strong>on</strong> of envir<strong>on</strong>mental damage after the first Gulf war and<br />
COLLINS et al. (1996) assessed changes in forest mortality. These are just a few examples representing<br />
the wide span of thematic applicati<strong>on</strong>s with numerous published case studies in comm<strong>on</strong> remote<br />
sensing and geoscience journals.<br />
3.14. Assessing Classificati<strong>on</strong> and Surface Extracti<strong>on</strong> Accuracy<br />
Classificati<strong>on</strong> and feature extracti<strong>on</strong> is not complete without a quantitative error estimati<strong>on</strong> called<br />
accuracy assessment. No classificati<strong>on</strong> or extracti<strong>on</strong> of a certain surface will yield as good results as a<br />
ground mapping and a varying uncertainty of the classificati<strong>on</strong> results has to be expected for each<br />
classifier. Misclassificati<strong>on</strong>s mostly result from <strong>spectral</strong> ambiguities between classes, represented in<br />
feature space through overlapping pixel clusters, analyst-induced errors in training data selecti<strong>on</strong> or a<br />
- 69 -
weak geometric co-registrati<strong>on</strong> of image data and ground truth data (STOLZ 1998). Classificati<strong>on</strong><br />
accuracies are presented in so-called error matrices, which have the schematic form illustrated in table<br />
3-1.<br />
Quantitative measures for classificati<strong>on</strong> accuracy are the overall accuracy, the producer accuracy and<br />
the user accuracy. The overall accuracy is defined as the overall percentage of correctly classified<br />
pixels with respect to the combined set of training data. It is the least specific accuracy measure, since<br />
it does not yield informati<strong>on</strong> <strong>on</strong> the classificati<strong>on</strong> accuracy of the single classes. A class with a very<br />
high classificati<strong>on</strong> accuracy can “blur” the fact that e.g. the other remaining classes were classified<br />
with less accurate results. To account for this, many critical image analysts present their accuracy data<br />
including and excluding the class of “water” if water is present in the classificati<strong>on</strong>. Water – due to its<br />
good <strong>spectral</strong> separability and low class inherent variance – often yields class accuracies exceeding<br />
95% and therefore improves the overall accuracy substantially.<br />
Producer accuracy for a specific land cover class defines, how much of the training <str<strong>on</strong>g>areas</str<strong>on</strong>g> of this land<br />
cover class were classified correctly, and user accuracy is a measure defining the probability that a<br />
classificati<strong>on</strong> pixel, assigned to the specific land cover class, really represents that class. Therefore,<br />
producer and user accuracy can differ from each other, with the latter being the stric<strong>test</strong> and most<br />
objective measure for the definiti<strong>on</strong> of single class classificati<strong>on</strong> accuracy (CONGALTON & GREEN<br />
1999).<br />
Table 3-1: C<strong>on</strong>cept of an accuracy assessment error matrix<br />
Reference Data<br />
Class 1 Class 2 … Class n Row total<br />
Classificati<strong>on</strong><br />
Data<br />
Class 1 a 11 a 12 … a 1n<br />
Class 2 a 21 a 22 … a 2n<br />
… … … … … …<br />
Class n a n1 a n2 … a nn<br />
Column<br />
total<br />
N<br />
∑ K =<br />
N<br />
a<br />
1 K1 ∑ K =<br />
a<br />
1 K 2<br />
…<br />
N<br />
∑ K =<br />
a<br />
1 KN<br />
N<br />
∑ K =<br />
N<br />
∑ K =<br />
a<br />
1 1 K<br />
a<br />
1 2K<br />
N<br />
∑ K =<br />
a<br />
1 NK<br />
N<br />
N=∑ I , K = 1<br />
aik<br />
The overall accuracy can be calculated according to: OA =<br />
k<br />
∑<br />
i=1<br />
n<br />
n<br />
ij<br />
(3.21)<br />
the producers accuracy with: PA = n jj / n +j (3.22)<br />
and the user’s accuracy with: UA = n jj / n i+ (3.23)<br />
with n i+ being the number of samples classified into category i in the remotely sensed classificati<strong>on</strong><br />
and n +j being the number of samples classified into category j in the reference data set and k<br />
representing the categories (CONGALTON & GREEN 1999, HUBERT-MOY et al. 2001). A good<br />
overview of accuracy measures and their appropriate use is also given by STEHMAN (1997).<br />
- 70 -
4. Data Analyzed<br />
Most of the data used for this thesis were collected for the data base in the framework of the BMBF<br />
project “Recepti<strong>on</strong> and project specific processing of remote sensing data for the support of current<br />
and future projects within the Sino-German envir<strong>on</strong>mental research co-operati<strong>on</strong>”. Furthermore, a lot<br />
of data was acquired within the Sino-German <str<strong>on</strong>g>coal</str<strong>on</strong>g> <str<strong>on</strong>g>fire</str<strong>on</strong>g> research initiative “Innovative Technologies for<br />
the Explorati<strong>on</strong>, Extincti<strong>on</strong> and M<strong>on</strong>itoring of Coal Fires in North China”. A large number of Landsat-<br />
7 ETM+, Modis- and ERS-scenes was acquired during two DLR acquisiti<strong>on</strong> campaigns at a mobile<br />
ground stati<strong>on</strong> in Ulan Bator, M<strong>on</strong>golia, in fall 2001 and spring 2002. Furthermore, data of the sensors<br />
Aster, ALI, Hyperi<strong>on</strong> and Quickbird was available for the main study <str<strong>on</strong>g>areas</str<strong>on</strong>g>. However, the following<br />
subchapters will <strong>on</strong>ly present the data processed and analyzed within this thesis. Since this chapter<br />
<strong>on</strong>ly introduces the data, explanati<strong>on</strong>s <strong>on</strong> the geometric and radiometric quality and preprocessing of<br />
the data is presented in chapter 5.<br />
4.1. Satellite Data<br />
Landsat-7 ETM+ data is the main source of remote sensing informati<strong>on</strong> used in this thesis. Reas<strong>on</strong>s<br />
for this are the broad spatial coverage of Landsat data, the sensors spatial resoluti<strong>on</strong> of up to 15 meters<br />
and its 7 <strong>spectral</strong> channels including a thermal band. Although bands are not overwhelming in number<br />
they are evenly distributed and well studied. The l<strong>on</strong>g term acquisiti<strong>on</strong> plan (LTAP) of the Landsat<br />
program predestines Landsat data for l<strong>on</strong>g term m<strong>on</strong>itoring. The recording of land- and water surfaces<br />
started in 1972 with Landsat-1, therefore offering now 30 years of coverage (ARVIDSON et al. 2001,<br />
GOWARD et al. 2001, FLYNN et al. 2001). Furthermore, up to date thermal remote sensing research in<br />
the field of <str<strong>on</strong>g>coal</str<strong>on</strong>g> <str<strong>on</strong>g>fire</str<strong>on</strong>g> analyses focuses <strong>on</strong> the capabilities of Landsat-7 ETM+. This sensor promised<br />
new achievements compared to the ‘older generati<strong>on</strong>’ of <str<strong>on</strong>g>coal</str<strong>on</strong>g> <str<strong>on</strong>g>fire</str<strong>on</strong>g> research undertaken with satellite<br />
data of lower spatial resoluti<strong>on</strong>. The utilizati<strong>on</strong> of ETM+ data for multi<strong>spectral</strong> investigati<strong>on</strong>s pursued<br />
within this work will therefore grant the comparability and possible combinati<strong>on</strong> with ETM+ <str<strong>on</strong>g>based</str<strong>on</strong>g><br />
approaches from thermal oriented research.<br />
For small <str<strong>on</strong>g>areas</str<strong>on</strong>g> the analyses were also c<strong>on</strong>ducted for partially available Aster data. This sensor is of<br />
interest due to its 14 <strong>spectral</strong> bands. Furthermore Quickbird data was available for the two main study<br />
<str<strong>on</strong>g>areas</str<strong>on</strong>g>. ERS-2 SAR data was mainly used for rectificati<strong>on</strong> purposes <str<strong>on</strong>g>based</str<strong>on</strong>g> <strong>on</strong> amplitude and coherence<br />
data as well as for the derivati<strong>on</strong> of terrain informati<strong>on</strong>. Although the easy data accessibility and the<br />
number of thermal channels of Modis might be interesting for <str<strong>on</strong>g>coal</str<strong>on</strong>g> <str<strong>on</strong>g>fire</str<strong>on</strong>g> research also, satellite data of<br />
this sensor was not used due to the low spatial resoluti<strong>on</strong> of the satellite (MASEK et al. 2001, Zhang, J.<br />
2002).<br />
4.1.1. Landsat-7 ETM+ Data<br />
The <strong>spectral</strong> and spatial properties of Landsat-7 ETM+ are briefly presented in table 4-1. The satellite<br />
was launched into its near polar, sun synchr<strong>on</strong>ous orbit (inclinati<strong>on</strong> 98.2°) <strong>on</strong> April 15 th of 1999. It has<br />
a repetiti<strong>on</strong> rate of 16 days and covers 90.6 % of the earth’s surface (ARVIDSON et al. 2001, GOWARD<br />
et al. 2001). Data is acquired in frames covering an area of approximately 183 km × 170 km at 10:00<br />
a.m. local time. Frames acquired over the equator show a sidelap of adjacent swaths of 7.3 %, while at<br />
80° latitude they overlap by 83.9 % (MASEK et al. 2001, USGS 1999). The LTAP grants the<br />
- 71 -
opti<strong>on</strong> for short term special requests for science and government sp<strong>on</strong>sored companies. Although<br />
mainly operating in the daytime mode, also nighttime data in the tIR band could be acquired within the<br />
project for thermal research. The nighttime frames are acquired at 10:00 p.m. local time. All channels<br />
show 8 bit data depth represented in a maximum of 256 digital numbers (DNs). Opposite to Landsat-5<br />
TM, Landsat-7 ETM+ includes a panchromatic channel ranging from 0.52-0.9 µm with 15 m<br />
resoluti<strong>on</strong> and a thermal channel with 60 m resoluti<strong>on</strong> offering a high- and a low gain mode (FLYNN<br />
2001). For more detailed informati<strong>on</strong> <strong>on</strong> the Landsat program and the satellite’s characteristics see<br />
MIKA (2000) or URL 4-1. For Landsat data earlier than April 1999 the Landsat TM or MSS archives<br />
have to be c<strong>on</strong>sulted.<br />
As shown in table 4-2 available scenes for this thesis covered regi<strong>on</strong>s of Ningxia and Inner M<strong>on</strong>golia<br />
in China (for the main study <str<strong>on</strong>g>areas</str<strong>on</strong>g> also multitemporal coverage), as well as <str<strong>on</strong>g>areas</str<strong>on</strong>g> outside of China for<br />
later validati<strong>on</strong> and the transfer of methods. These two scenes outside China cover the Jharia <str<strong>on</strong>g>coal</str<strong>on</strong>g><br />
fields in Northeast India (PRAKASH et al. 1997) at approximately 23°42’N and 86°15’E and an area in<br />
South-central Australia at the foothills of the Flinders Range at approximately 30°18’S and 138°36’E.<br />
For all data the pre-requirement of nearly 0% cloud coverage was fulfilled.<br />
Towards the end of this thesis it became clear that unexpected instabilities of the scan mirror of<br />
ETM+, which started to occur in May 2003, could not be fixed. Only a center stripe close the nadir<br />
line is unaffected. This challenge for the project and this work is discussed in chapter 10.<br />
Table 4-1: Spectral and spatial properties of Landsat 7 ETM+ data versus Landsat 5 TM (in brackets)<br />
Part of the electromagnetic spectrum Band width / EMS-area [μm]<br />
Spatial resoluti<strong>on</strong> Depth [bit]<br />
(1) visible (blue) 0.45 - 0.51, [0.45-0.52] 30 m, [30m] 8<br />
(2) visible (green) 0.52 - 0.60, [0.52-0.60] 30 m, [30m] 8<br />
(3) visible (red) 0.63 - 0.69, [0.63-0.69] 30 m, [30m] 8<br />
(4) near Infrared (nIR) 0.75 - 0.90, [0.76-0.90] 30 m, [30m] 8<br />
(5) middle Infrared (nIR 2) 1.55 - 1.75, [1.55-1.75] 30 m, [30m] 8<br />
(6) thermal Infrared (tIR) 10.40 -12.50, [10.40-12.50] 60 m, [120m] 8<br />
(7) middle Infrared (mIR) 2.09 - 2.35, [2.08-2.35] 30 m, [30m] 8<br />
(8) panchromatic (PAN) 0.52 - 0.90, [n<strong>on</strong>e] 15 m, [n<strong>on</strong>e] 8<br />
(Source: URL 4-2, SCHWARZ et al. 1999, MASEK et al. 2001)<br />
Table 4-2: LS7 ETM+ scenes processed and analyzed in the framework of this thesis<br />
Path/Row<br />
Acquisiti<strong>on</strong><br />
date<br />
latitude<br />
[UL corner]<br />
l<strong>on</strong>gitude<br />
[UL corner]<br />
Sun elevati<strong>on</strong><br />
[dec. deg.]<br />
Sun azimut<br />
[dec. deg.]<br />
day/night<br />
129/033 12.08.1999 39.88 N 105.62 E + 58.59 + 132.73 day<br />
129/033 17.10.2000 39.88 N 105.55 E + 38.60 + 155.63 day<br />
129/033 04.10.2001 39.86 N 105.64 E + 42.96 + 151.53 day<br />
129/033 21.09.2002 39.87 N 105.58 E + 47.02 + 147.12 day<br />
129/033 10.12.2002 39.89 N 105.61 E + 31.63 + 149.16 day<br />
129/033 12.02.2003 39.88 N 105.62 E + 25.04 + 158.22 day<br />
129/033 03.05.2003 39.87 N 105.59 E + 30.52 + 133.69 day<br />
128/032 29.08.2002 41.28 N 107.45 E + 52.84 + 139.80 day<br />
098/081 15.11.2002 29.33 S 137.42 E + 59.53 + 074.15 day<br />
140/044 02.11.2001 24.05 N 087.81 E + 46.31 + 147.98 day<br />
- 72 -
It is obvious, that most scenes were acquired in fall, winter or spring. Due to the larger thermal<br />
c<strong>on</strong>trast image data from these seas<strong>on</strong>s is preferred to summer data with overall higher temperatures.<br />
Data acquired during the summer seas<strong>on</strong> should be avoided (ZHANG, X. 1998). Daytime data were<br />
used for automated <str<strong>on</strong>g>coal</str<strong>on</strong>g> <str<strong>on</strong>g>fire</str<strong>on</strong>g> area demarcati<strong>on</strong> as well as for the investigati<strong>on</strong> of parameters coinciding<br />
with thermal anomalies and <str<strong>on</strong>g>coal</str<strong>on</strong>g> <str<strong>on</strong>g>fire</str<strong>on</strong>g>s respectively. Nighttime data were used for thermal anomaly<br />
extracti<strong>on</strong> applying the algorithm of ZHANG, J. (2004) and combined analysis of the two approaches.<br />
4.1.2. Landsat-5 TM Data<br />
One Landsat-5 TM scene of path 129, row 33 covering the Wuda and the Ruqigou / Gulaben <strong>test</strong> sites,<br />
acquired <strong>on</strong> 20.09.1987 was available. The charcateristics of Landsat-5 TM are shown in table 4-1.<br />
The major difference to ETM+ data is the weaker spatial resoluti<strong>on</strong> in the thermal band (120 m, no<br />
double gain setting) and the lack of a panchromatic channel (MASEK et al. 2001). Furthermore, TM<br />
data have a weaker SNR ratio and radiometric sensitivity . Also, Landsat-7 ETM+ c<strong>on</strong>centrates a<br />
larger part of the image amplitude in the lower wavelength part of the spectrum associated with the<br />
actual image c<strong>on</strong>tent, rather than shorter wavelengths associated with noise. Therefore, subtle land<br />
cover feature differences of darker objects (e.g. forest, water) might be less easy to resolve than in<br />
ETM+ data. The scene is the <strong>on</strong>ly fully cloud-free <strong>on</strong>e available from the 1980s and offers the chance<br />
for l<strong>on</strong>g term change detecti<strong>on</strong>.<br />
4.1.3. Aster Data<br />
The <strong>spectral</strong> and spatial properties of the Aster sensor, installed <strong>on</strong> the satellite Terra and flying 30<br />
min. behind Landsat-7, are briefly introduced in table 4-3. Since December 1999 Aster circles in a<br />
near polar, sun synchr<strong>on</strong>ous orbit, acquiring data since February 24, 2000, with a repetiti<strong>on</strong> rate of 16<br />
days. Data is downlinked in frames covering an area of approximately 60 km × 60 km at 10:30 a.m.<br />
local time. Unlike Landsat-.7, which acquires data c<strong>on</strong>stantly and therefore providing a nearworldwide<br />
coverage of frames (except the poles), ASTER <strong>on</strong>ly scans the earth’s surface when<br />
specifically required by a customer. Thus it does not grant a sufficient areal coverage (EARTH REMOTE<br />
SENSING DATA ANALYSIS CENTER. 2000 & 2001, ABRAMS & HOOK 1995). Also nighttime data with<br />
five thermal bands, acquired at 10:30 p.m. local time, could be requested within the project. A major<br />
advantage of thermal nighttime data recorded by Landsat-7 or Aster is the effect that at 10 p.m. <strong>on</strong>ly<br />
few solar effects modify the thermal signal. Influences of uneven heating due to slope and aspect are<br />
minimized (PRAKASH et al. 1999. ZHANG, J., et al. 2003). However, the optimal time for thermal data<br />
acquisiti<strong>on</strong> would be around 5 a.m., when objects have the lowest temperature (ZHANG, X., 1998). For<br />
more detailed informati<strong>on</strong> <strong>on</strong> the Aster program and the sensors characteristics see URL 4-3.<br />
Table 4-3: Spectral and spatial properties of ASTER data<br />
Part of the electromagnetic spectrum Band width / EMR-area [μm]<br />
Spatial resoluti<strong>on</strong> Depth [bit]<br />
(1) VNIR 0.52 – 0.60 15 m 8<br />
(2) VNIR 0.63 – 0.69 15 m 8<br />
(3) VNIR nadir looking 0.76 – 0.86 15 m 8<br />
(3) VNIR backward looking 0.76 – 0.86 15 m 8<br />
(4) SWIR 1.6 – 1.7 15 m 8<br />
(5) SWIR 2.145 – 2.185 30 m 8<br />
- 73 -
Table 4-3 c<strong>on</strong>t’d<br />
Part of the electromagnetic spectrum Band width / EMS-area [μm]<br />
Spatial resoluti<strong>on</strong> Depth [bit]<br />
(6) SWIR 2.185 – 2.225 30 m 8<br />
(7) SWIR 2.235 – 2.285 30 m 8<br />
(8) SWIR 2.295 – 2.365 30 m 8<br />
(9) SWIR 2.360 – 2.430 30 m 8<br />
(11) TIR 8.125 - 8.475 90 m 12<br />
(12) TIR 8.475 - 8.825 90 m 12<br />
(13) TIR 8.925 - 9.275 90 m 12<br />
(14) TIR 10.25 - 10.95 90 m 12<br />
(15) TIR 10.95 - 11.65 90 m 12<br />
(Source: URL 4-4)<br />
Table 4-4: ASTER scenes processed and analyzed in the framework of the thesis<br />
Path/Row<br />
Acquisiti<strong>on</strong><br />
date<br />
Latitude<br />
(UL corner)<br />
L<strong>on</strong>gitude<br />
(UL corner)<br />
Sun elevati<strong>on</strong><br />
[dec. deg.]<br />
Sun azimuth<br />
[dec. deg.]<br />
day/night<br />
Ruqigou 08.09.2003 34.40 105.66 43.5 126.5 day<br />
Wuda 24.09.2003 39.87 106.26 39.4 133.6 day<br />
4.1.4. Quickbird Data<br />
Quickbird is a high spatial resoluti<strong>on</strong> sensor, which was launched in October 2001. Quickbird circles<br />
in a 97.2° sun-synchr<strong>on</strong>ous near polar orbit at 450km altitude with an equatorial crossing time of<br />
10:30 am. It acquires images in five bands, which are the panchromatic band, ranging from 0.45-<br />
0.9µm, the blue band (0.45-0.52µm), the green band (0.52-0.6µm), the red band (0.63-0.67µm) and<br />
the near Infrared (NIR) band, ranging from 0.76-0.9µm. The nominal swath width at nadir is 16.5 km.<br />
The panchromatic channel has a spatial resoluti<strong>on</strong> of 0.6 meters per pixel, while the other<br />
multi<strong>spectral</strong> bands have a resoluti<strong>on</strong> of 2.4 meters per pixel (URL 4-6). The data for the Wuda study<br />
area was acquired <strong>on</strong> October 5 th 2003 and covers 64 km², while the data for the Ruqigou / Gulaben<br />
study area was acquired <strong>on</strong> September 22 nd 2003 and covers an area of 81 km². For both acquisiti<strong>on</strong>s a<br />
nadir-mode was requested granting minimal viewing angles. Since the panchromatic and multi<strong>spectral</strong><br />
image channels fit well due to a parallaxis correcti<strong>on</strong> undertaken by the data provider they can easily<br />
be fused to integrate the high spatial informati<strong>on</strong> c<strong>on</strong>tent of the 0.6 m panchromatic channel into the<br />
multi<strong>spectral</strong> bands. A Quickbird standard product has a geometric accuracy in the desired map<br />
projecti<strong>on</strong> of +/- 14 meters RMSE. The geometric accuracy of the products is increased as presented in<br />
chapter 5. For further details <strong>on</strong> Quickbird see URL 4-6.<br />
4.1.5. ERS-2 SAR Data<br />
ERS-2 is an earth observing satellite, launched in 1995 and circling the earth at 800 km height in a<br />
polar orbit, thus covering 100% of the earth’s surface. Instruments <strong>on</strong> board include an Active<br />
Microwave Instrument (AMI), a Radar Altimeter (RA), an Al<strong>on</strong>g Track Scanning Radiometer (ATSR)<br />
and a spectrometer, m<strong>on</strong>itoring oz<strong>on</strong>e, CFCs and trace gas levels (GOME) (BAMLER et al. 1996). The<br />
SAR data used in this thesis was recorded with the AMI. The instrument can record weather- and sunindependent,<br />
pulsing its microwave beam in an angle of 23°. Amplitude and coherence data as well as<br />
- 74 -
digital elevati<strong>on</strong> models (DEM), which were derived from SAR interferograms, were available for<br />
large <str<strong>on</strong>g>areas</str<strong>on</strong>g> of North-central and Northwest China. The data could be extracted from a database<br />
c<strong>on</strong>taining ERS-SAR data of the SAR-Topo team of DFD. ERS DEMs are characterized by a spatial<br />
resoluti<strong>on</strong> of 25 meters and a data depth of signed 16 bit, while amplitude and coherence data c<strong>on</strong>tain<br />
unsigned 8 bit informati<strong>on</strong>. The spatial accuracy of the DEM depends <strong>on</strong> many factors of which <strong>on</strong>e is<br />
the local relief. It varies between 25-70 m in flat terrain and several hundred meters of up to a<br />
kilometer in str<strong>on</strong>g relief (see also chapter 5.1). Further factors influencing the DEM accuracy are the<br />
opti<strong>on</strong> to calculate the digital elevati<strong>on</strong> model from single pass interferometry data (Tandem data,<br />
which was <strong>on</strong>ly available in 1995/96), staples of data for <strong>on</strong>e specific regi<strong>on</strong> and good baselines (URL<br />
4-7). For the DEM generated for the Coal Fire Project Tandem data was not available and furthermore<br />
baselines and coverage were often not sufficient. Therefore a general overall quality assessment of the<br />
DEM, generated for an area of 780.000 km² focussing <strong>on</strong> the provinces of Ningxia and Xinjiang,<br />
cannot be pursued. The accuracy has to be assessed for individual use for specific <str<strong>on</strong>g>areas</str<strong>on</strong>g>. However, no<br />
reference for this DEM other than GLOBE with a much lower resoluti<strong>on</strong> or 1:100,000 topographic<br />
maps with <strong>on</strong>ly few elevati<strong>on</strong> lines were available. The accuracy assessment had to be a qualitative<br />
<strong>on</strong>e <str<strong>on</strong>g>based</str<strong>on</strong>g> <strong>on</strong> field observati<strong>on</strong>s and visual data comparis<strong>on</strong> for the main study <str<strong>on</strong>g>areas</str<strong>on</strong>g>. SRTM products<br />
for central Asia were not available early enough to be incorporated in this work.<br />
Other than the DEM, coherence data can be of interest for land surface characterizati<strong>on</strong> and<br />
classificati<strong>on</strong>, as shown am<strong>on</strong>gst many others, by LE HÉGARAT-MASCALE et al. 2000, LIU et al. 2001<br />
and WAGNER et al. 2003. However, the coherence data was not used within this study. The ERS<br />
datasets from which the coherence was derived, did not fit the Landsat data c<strong>on</strong>cerning data<br />
acquisiti<strong>on</strong> times.<br />
4.2. Field- and Laboratory Spectral Measurements<br />
4.2.1. Surface Spectra Measured During the Field Campaign<br />
During the fieldwork c<strong>on</strong>ducted in Wuda in September 2002 spectra of the most important<br />
representative surfaces of the study area were sampled with a GER3700 single beam portable field<br />
spectrometer from the Geophysical and Envir<strong>on</strong>ment Research Corporati<strong>on</strong> (KUENZER et al. 2003).<br />
The instrument has a <strong>spectral</strong> range between 350-2500 nm, sampling with a 1.5 nm step in the range of<br />
350-1050 nm, 6.2 nm in the range of 1050-1900 nm and 9.5 nm between 1900-2500nm. The <strong>spectral</strong><br />
resoluti<strong>on</strong> in these three sampling intervals is 3nm, 11nm and 16nm respectively. The field of view is<br />
3° under normal c<strong>on</strong>diti<strong>on</strong>s. Although a fiber optic allows to furthermore use a FOV of 10°. Data<br />
depth is 16 bit in the range of 300-1050 nm and 15 bit in the range of 1050-2500 nm.<br />
Spectra in the field were measured ± 2 hours before/after no<strong>on</strong>time, when cloud coverage was less<br />
than 2/8 th and weather c<strong>on</strong>diti<strong>on</strong>s were sunny and clear. The recording process was kept as<br />
standardized as possible. A reference measurement with a Barium-Sulfate-panel (standard white,<br />
approximated 100% reflectance, Lambertian reflectance characteristics) was taken before each <strong>spectral</strong><br />
measurement. Dividing the resp<strong>on</strong>se of the target by the resp<strong>on</strong>se of the reference yields the<br />
reflectivity of the target. A c<strong>on</strong>stant height of the spectrometer <strong>on</strong> a tripod granting the total fill of the<br />
FOV was calculated and kept stable during field measurements. Furthermore the geometry of<br />
reference and target was similar under all c<strong>on</strong>diti<strong>on</strong>s (GER 1999, MILTON 1987, ROSEMA et al. 1999,<br />
MARACCI 1992).<br />
- 75 -
Homogeneous large <str<strong>on</strong>g>areas</str<strong>on</strong>g> with an extent of several Landsat-7 pixels where chosen for the <strong>spectral</strong><br />
measurements to grant the representativity of the spectra for a certain land surface class. For instance,<br />
desert sand was sampled in flat <str<strong>on</strong>g>areas</str<strong>on</strong>g> within large fields of sand dunes. When sampling vegetati<strong>on</strong><br />
spectra it was c<strong>on</strong>sidered that staples of leaves (8 layers minimum) had to be recorded to receive<br />
highly saturated pure vegetati<strong>on</strong> spectra and to exclude the signal of the underlying ground/soil<br />
(GUYOT 1990). Also mixtures of vegetati<strong>on</strong> and soil where measured. For each set of recorded spectra<br />
additi<strong>on</strong>al informati<strong>on</strong> like GPS locati<strong>on</strong>, a digital photograph and a surface sample were collected.<br />
Due to technical and logistic problems in China no spectra could be measured during the ETM+<br />
daytime overflight <strong>on</strong> 21.09.2002 (clear sky, 0% clouds), but most spectra where collected five days<br />
before under the same illuminati<strong>on</strong> c<strong>on</strong>diti<strong>on</strong>s and during the overpass time at around 10:00 a.m. local<br />
time. Hierarchical priorities were assigned to the surfaces selected for measuring to record most<br />
important spectra first. Within the four weeks of time during the field campaign in 2003 <strong>on</strong>ly few days<br />
were suitable for <strong>spectral</strong> measurements.<br />
The focus of this thesis is to derive multi<strong>spectral</strong> parameters for <str<strong>on</strong>g>coal</str<strong>on</strong>g> <str<strong>on</strong>g>fire</str<strong>on</strong>g> area demarcati<strong>on</strong>. Since<br />
vegetati<strong>on</strong> – <str<strong>on</strong>g>based</str<strong>on</strong>g> <strong>on</strong> field observati<strong>on</strong>s – is assumed to be <strong>on</strong>e of the relevant parameters spectra of<br />
the dominant desert shrubs were recorded first. They could not be transported to Germany to be<br />
investigated under laboratory c<strong>on</strong>diti<strong>on</strong>s (decay). Spectra of four different shrubs in a pure state as<br />
well as in mixtures with the underlying soil were collected. Furthermore, spectra of pure <str<strong>on</strong>g>coal</str<strong>on</strong>g>, <str<strong>on</strong>g>coal</str<strong>on</strong>g><br />
dust, pure desert sand, crusted desert sand, pure solid sandst<strong>on</strong>e of different colors, weathered<br />
sandst<strong>on</strong>e, shale of different colors and limest<strong>on</strong>es of different colors were acquired. Next to<br />
vegetati<strong>on</strong> these were the main geologic c<strong>on</strong>stituents in the arid study area. The field spectra show no<br />
or a disturbed signal in the wavelengths, where the atmosphere is completely absorbing and therefore<br />
leading to a poor SNR ratio.<br />
4.2.2. Laboratory Spectra Measured from Samples Collected During the Fieldwork<br />
Due to time limits and weather c<strong>on</strong>diti<strong>on</strong>s for some surface types no spectra could be recorded in the<br />
field. Therefore 28 kg of mainly rock- and soil samples were collected from the study <str<strong>on</strong>g>areas</str<strong>on</strong>g> and<br />
brought back to Germany. Here they were analyzed in the <strong>spectral</strong> laboratory of the hyper<strong>spectral</strong><br />
working unit at DFD. Under laboratory c<strong>on</strong>diti<strong>on</strong>s a 1000 Watt light source (Osram Halogen photo<br />
optic light source) illuminates the sample. The reflectance of the sampling surface is then measured<br />
with the GER3700 to retrieve the characteristic reflectance curve. As during the fieldwork, the<br />
reference is recorded before each measurement. In c<strong>on</strong>trast to field-measurements, no atmospheric<br />
absorbti<strong>on</strong> and scattering processes influence the signal. Furthermore, laboratory measurements are<br />
highly standardized. The distance between the GER internal sensor and the surface was always<br />
approximately 40 cm in nadir positi<strong>on</strong>, the source of illuminati<strong>on</strong> was set up in 40 cm distance to the<br />
surface with an incidence angle of 30 °. Also the warm up time of 10 minutes for the spectrometer and<br />
the light source could be c<strong>on</strong>sidered. Field- and laboratory measurements were undertaken as<br />
recommended by GER in the field- and laboratory handbook and represented a typical standard set up<br />
as e.g. used by HOSTERT 2001, BAUMGARDNER et al. 1985 or SCHLERF et al. 2003 and others.<br />
- 76 -
Table 4-5: Geologic surface samples measured in the <strong>spectral</strong> laboratory<br />
Coal Sand Sandst<strong>on</strong>e Shale Limest<strong>on</strong>e Pyrometam. Others<br />
anthracite pure desert white pure black white dark red orange clay<br />
cooking <str<strong>on</strong>g>coal</str<strong>on</strong>g> pure wadi light grey pure brown light grey red dark gneiss<br />
<str<strong>on</strong>g>coal</str<strong>on</strong>g> dust mix w. sst. grey mix w. sst. dark grey orange granite<br />
mine waste mix w. lime yellow mix w. sand yellowish yellow silt crusting<br />
<str<strong>on</strong>g>coal</str<strong>on</strong>g> ash mix w. shale orange-red mix w. soil light brown multicolor wadi pebbles<br />
Table 4-5 presents the samples recorded in the laboratory. The samples were not crushed to keep<br />
aggregates as found in the field. To account for different reflectance properties depending <strong>on</strong> viewing<br />
geometry each sample was measured 20 times from 4 directi<strong>on</strong>s (80 measurements) by horiz<strong>on</strong>tally<br />
rotating the sample for 90° respectively. A major advantage resulting from the climatic situati<strong>on</strong> in the<br />
study <str<strong>on</strong>g>areas</str<strong>on</strong>g> was the fact that the surface samples were very dry when collected. No <strong>spectral</strong> variati<strong>on</strong>s<br />
between field and laboratory measurements depending <strong>on</strong> varying sample moisture occurred.<br />
UL: 628744E, 4391885N<br />
Different sandst<strong>on</strong>es<br />
Different shales<br />
Coal (waste) samples<br />
Weathered material<br />
Desert sand<br />
Wadi sand / pebbles<br />
Vegetati<strong>on</strong><br />
Desert sand<br />
Vegetati<strong>on</strong> / Mixes<br />
Desert sand<br />
Weathered<br />
Sandst<strong>on</strong>e<br />
Desert sand<br />
Limest<strong>on</strong>e<br />
Vegetati<strong>on</strong><br />
Desert sand<br />
Limest<strong>on</strong>e<br />
Limest<strong>on</strong>e<br />
Coal / <str<strong>on</strong>g>coal</str<strong>on</strong>g>waste<br />
Granite<br />
Diorite<br />
Clay<br />
Limest<strong>on</strong>e<br />
Silt crusting<br />
N<br />
5 km<br />
LR: 672604E, 4355345N, UTM, Z48 N, WGS84<br />
Figure 4-1: Locati<strong>on</strong> of the recording points for field <strong>spectral</strong> measurements and surface sample collecti<strong>on</strong> for<br />
later laboratory <strong>spectral</strong> measurements within the broader Wuda study area. Background: gray scale Landsat<br />
image (band 1) acquired during the same week as spectra- and surface sampling.<br />
- 77 -
4.3. GIS Data<br />
4.3.1. Available GIS Data<br />
GIS data available for this research were very rare and had to be newly generated for most parts.<br />
Available data included data from the Digital Chart of the World (DCW) compiled by agencies that<br />
produce the Operati<strong>on</strong>al Navigati<strong>on</strong> Charts (ONC) map series. The data is freely available via the<br />
Internet at a scale of 1:1,000,000. This database c<strong>on</strong>tains informati<strong>on</strong> <strong>on</strong> borders, major rivers, towns<br />
etc. and is <strong>on</strong>ly useful for a general overview of a regi<strong>on</strong>. It is too inaccurate to be used for scientific<br />
queries and was <strong>on</strong>ly useful for overview map generati<strong>on</strong> (see e.g. map 1, chapter 2). To collect more<br />
digital informati<strong>on</strong> some data from 1:100,000 topographic maps was digitized for the broader study<br />
area including road and railway networks, settlements and mining related informati<strong>on</strong>.<br />
4.3.2. GPS Locati<strong>on</strong>s Measured During the Fieldwork in 2002 and 2003<br />
During the fieldwork campaign in 2002 the GIS database was extended by GPS (Garmin GPS 12).<br />
The complete road network of the broader study area was tracked by GPS and later c<strong>on</strong>verted into<br />
vector data sets readable in comm<strong>on</strong> GIS. Furthermore, distinct points like road intersecti<strong>on</strong>s, railway<br />
bridges or edges of large buildings were measured and transferred to point-data sets to serve as ground<br />
c<strong>on</strong>trol points. Also the locati<strong>on</strong>s of surface sampling points, <strong>spectral</strong> measurement points, digital<br />
photographs and <str<strong>on</strong>g>coal</str<strong>on</strong>g> <str<strong>on</strong>g>fire</str<strong>on</strong>g> related thermal anomalies were recorded. During all measurements the time<br />
was taken for sufficient averaging of the GPS measurement to receive estimated positi<strong>on</strong> errors (EPE)<br />
below 5 meters. However, it should be menti<strong>on</strong>ed that according to users manuals and field guides a<br />
n<strong>on</strong>-differential GPS can still yield displacements of up to 15 meters, even though the EPE display is<br />
indicating less. Nevertheless, GPS measurements in this project have the highest spatial accuracy<br />
compared with other reference data. During a sec<strong>on</strong>d field campaign in 2003 high precisi<strong>on</strong> ground<br />
c<strong>on</strong>trol points were recorded with three independent GPS and 5 minute positi<strong>on</strong> averaging times with<br />
a Garmin GPS12, a handheld GPS-GIS Compaq iPAQ computer (3950, GPS: EMTAC GPSJAQ<br />
D15A8) and a Garmin GPS 3 for the syncline <str<strong>on</strong>g>areas</str<strong>on</strong>g> in Wuda and Ruqigou / Gulaben. These data were<br />
used to rectify the high spatial resoluti<strong>on</strong> Quickbird data.<br />
4.3.3. Landcover Polyg<strong>on</strong>s Mapped During the 2002 and 2003 Fieldwork<br />
During the 2002 and 2003 fieldwork polyg<strong>on</strong>s of homogeneous landcover of 100 m × 100 m up to<br />
1km×1km were mapped by GPS to act as ground truth for landcover classificati<strong>on</strong>s and their accuracy<br />
assessment within the framework of the project. Over 170 of such ground truth polyg<strong>on</strong>s were<br />
collected and transferred to vector-polyg<strong>on</strong> data with descriptive attributes. Am<strong>on</strong>gst these polyg<strong>on</strong>s<br />
are many, covering <str<strong>on</strong>g>areas</str<strong>on</strong>g> of <str<strong>on</strong>g>coal</str<strong>on</strong>g> outcrops or <str<strong>on</strong>g>coal</str<strong>on</strong>g> piles, which will be used as reference <str<strong>on</strong>g>areas</str<strong>on</strong>g> for the<br />
sensitivity analysis of the <str<strong>on</strong>g>coal</str<strong>on</strong>g> surface extracti<strong>on</strong> algorithm. Also polyg<strong>on</strong>s of other land cover classes<br />
interesting for the approach to demarcate <str<strong>on</strong>g>coal</str<strong>on</strong>g> <str<strong>on</strong>g>fire</str<strong>on</strong>g> <str<strong>on</strong>g>areas</str<strong>on</strong>g> as outlined in the introducti<strong>on</strong> are stored in<br />
this database.<br />
- 78 -
4.3.4. Mixture Grids Mapped During the 2002- and 2003 Fieldwork<br />
Seven detailed mixture grids of up to 500m×500m distributed within the Wuda mining area and<br />
broader surroundings were mapped. They act as ground truth for processes of unmixing activities<br />
within the project. Mapping took place during the fieldwork in 2002 and 2003. Therefore some grids<br />
are available in a “multitemporal” versi<strong>on</strong>. The grids have a cell size of 50 meters with each cell<br />
c<strong>on</strong>taining a percentage informati<strong>on</strong> of each individual surface, which is represented within the cell.<br />
This informati<strong>on</strong> was transferred in a multi-layer database with all the surface percentages adding up<br />
to 100 %. It was then included into a GIS to make the surface informati<strong>on</strong> available within its spatial<br />
c<strong>on</strong>text.<br />
500 meters<br />
Coal %<br />
Sand %<br />
Shale %<br />
Limest<strong>on</strong>e %<br />
Sandst<strong>on</strong>e %<br />
10 20 25 25 25 20 15 15 5 5<br />
Vegetati<strong>on</strong> %<br />
10 10 10 10 20 25 30 35 10 10<br />
10 10 10 10 10 20 20 25 25 15<br />
5 5 5 10 20 25 15 20 10 10<br />
10 20 25 25 25 20 15 15 5 5<br />
10 30 40 30 30 30 20 15 0 0<br />
10 20 25 25 25 20 15 15 5 5<br />
15 15 10 10 10 10 15 10 10 10<br />
20 15 0 0 0 5 10 15 15 15<br />
25 10 5 5 5 10 15 20 20 20<br />
Figure 4-2: C<strong>on</strong>cept of the mixing grids mapped during the fieldwork<br />
Σ<br />
50m*50m grid cells c<strong>on</strong>taining aereal<br />
percentage of surface c<strong>on</strong>tributi<strong>on</strong>s<br />
summing up to 100%<br />
100 100 100 100 100 100 100 100 100 100<br />
100 100 100 100 100 100 100 100 100 100<br />
100 100 100 100 100 100 100 100 100 100<br />
100 100 100 100 100 100 100 100 100 100<br />
100 100 100 100 100 100 100 100 100 100<br />
100 100 100 100 100 100 100 100 100 100<br />
100 100 100 100 100 100 100 100 100 100<br />
100 100 100 100 100 100 100 100 100 100<br />
100 100 100 100 100 100 100 100 100 100<br />
100 100 100 100 100 100 100 100 100 100<br />
4.3.5. Coal Fires Mapped During the 2002- 2003 and 2004 Fieldwork<br />
During three field campaigns the <str<strong>on</strong>g>coal</str<strong>on</strong>g> <str<strong>on</strong>g>fire</str<strong>on</strong>g>s in the Wuda and Ruqigou study area were mapped using<br />
GPS and thermal radiometers supported by handheld GPS-GIS units during the last campaign. The<br />
mapping of the year 2002 was undertaken by Zhang, J., Sun, Y. and Tetzlaff, A., the mapping in 2003<br />
by Zhang, J., Tetzlaff, A., Kuenzer, C. and Hecker, C., the mapping in 2004 by Kuenzer, C., Hirner,<br />
A., Zhang, J and Y. Sun. While the Wuda <str<strong>on</strong>g>coal</str<strong>on</strong>g> <str<strong>on</strong>g>fire</str<strong>on</strong>g>s were mapped for all these three years the <str<strong>on</strong>g>coal</str<strong>on</strong>g><br />
<str<strong>on</strong>g>fire</str<strong>on</strong>g>s of Ruqigou and Gulaben were <strong>on</strong>ly mapped in 2002, due to logistic and administrative reas<strong>on</strong>s.<br />
The mapping registered the locati<strong>on</strong>s of active cracks and subsidence holes exhaling hot gasses. Based<br />
<strong>on</strong> a large number of such thermal measurements as well as surface features like mining entrances,<br />
vegetati<strong>on</strong> degradati<strong>on</strong>, bedrock changes and subsidence phenomena the underground <str<strong>on</strong>g>coal</str<strong>on</strong>g> <str<strong>on</strong>g>fire</str<strong>on</strong>g><br />
outlines were mapped the best way possible. However, the result of these mappings – polyg<strong>on</strong> layers<br />
of subsurface <str<strong>on</strong>g>coal</str<strong>on</strong>g> <str<strong>on</strong>g>fire</str<strong>on</strong>g> outlines – can <strong>on</strong>ly approximate the size, extent and shape of the real <str<strong>on</strong>g>coal</str<strong>on</strong>g> <str<strong>on</strong>g>fire</str<strong>on</strong>g>s.<br />
The mapping results are influenced by a lot of analyst interpretati<strong>on</strong>. It was found that mapping results<br />
of 2003 and 2004 vary str<strong>on</strong>gly from those in 2002, where the subsurface <str<strong>on</strong>g>coal</str<strong>on</strong>g> <str<strong>on</strong>g>fire</str<strong>on</strong>g> area has probably<br />
been mapped too large. The <str<strong>on</strong>g>coal</str<strong>on</strong>g> <str<strong>on</strong>g>fire</str<strong>on</strong>g> polyg<strong>on</strong>s are important to <strong>test</strong>, if the <str<strong>on</strong>g>coal</str<strong>on</strong>g> <str<strong>on</strong>g>fire</str<strong>on</strong>g> (<str<strong>on</strong>g>risk</str<strong>on</strong>g>) <str<strong>on</strong>g>areas</str<strong>on</strong>g><br />
demarcated are precise enough to c<strong>on</strong>tain the actual known <str<strong>on</strong>g>coal</str<strong>on</strong>g> <str<strong>on</strong>g>fire</str<strong>on</strong>g>s.<br />
- 79 -
4.4. Maps and Descriptive Data<br />
Topographic and thematic maps of China are difficult to obtain, especially when detailed scales are<br />
required. Expensive Russian military maps in the scale of 1:100,000 are available via the Internet.<br />
Two map sheets which <strong>on</strong>ly cover about 15% of <strong>on</strong>e Landsat-7 satellite scene were ordered for both<br />
studay <str<strong>on</strong>g>areas</str<strong>on</strong>g>. They could therefore not exclusively be used for geometric rectificati<strong>on</strong> procedures and<br />
were mainly used for an accuracy assessment of the orthorectificati<strong>on</strong> process within the distinct study<br />
<str<strong>on</strong>g>areas</str<strong>on</strong>g>. In additi<strong>on</strong> they were used for vector extracti<strong>on</strong> of infrastructure informati<strong>on</strong>. A list of further<br />
maps, which were of help for this thesis, is given below.<br />
• Geologic Map of Ningxia 1:350,000 +<br />
• Tect<strong>on</strong>ic Map of Ningxia 1:500,000 +<br />
• Geologic Map of Helan Mountains 1:500,000 +<br />
• Geologic Map of Inner M<strong>on</strong>golia 1:1,500,000 +<br />
• Russian Military Map 1:100,000 “j48022” for Wuda #<br />
• Russian Military Map 1:100,000 “j48033” for Ruqigou #<br />
• Gulaben Topographic Map 1:50,000 *<br />
• Gulaben Geological Structure Map 1:50,000 *<br />
• Geologic and thematic map of Leigh Creek area, Australia, 1:250.000 #<br />
Items marked with * were <strong>on</strong>ly available as scanned versi<strong>on</strong>s <strong>on</strong> CD in Chinese coordinates not<br />
transferable to a known projecti<strong>on</strong>. Therefore they could <strong>on</strong>ly be used as ‘relative’ informati<strong>on</strong> and not<br />
support rectificati<strong>on</strong> or absolute object retrieval. Data marked with + was acquired in Beijing while<br />
data marked with # was ordered via the Internet.<br />
C<strong>on</strong>cerning descriptive data the scientific journal papers, book chapters and other publicati<strong>on</strong>s<br />
menti<strong>on</strong>ed in chapters 1.1. and 1.2. as well as the <strong>on</strong>es listed in the references at the end of this thesis<br />
have been accumulated. In additi<strong>on</strong> some fieldwork reports and photographic material from past and<br />
current and project partners were available.<br />
- 80 -
5. Data Preprocessing: Rectificati<strong>on</strong>, Calibrati<strong>on</strong>, Radiometry<br />
Data preprocessing is of utmost importance when aiming at the retrieval of quantitative parameters<br />
from remote sensing data sets <str<strong>on</strong>g>based</str<strong>on</strong>g> <strong>on</strong> physical characteristics. Also for multitemporal or transferable<br />
studies a thorough preprocessing is the <strong>on</strong>ly opti<strong>on</strong> to guarantee the spatial and <strong>spectral</strong> comparability<br />
of data. SCHOTT (1997) from a c<strong>on</strong>ceptual point of view refers to an image processing chain approach<br />
<str<strong>on</strong>g>based</str<strong>on</strong>g> <strong>on</strong> spatial, radiometric and <strong>spectral</strong> preprocessing steps as links. Since each link in the chain is<br />
partially a result of previous links, the output product can <strong>on</strong>ly be as str<strong>on</strong>g as the weakest link.<br />
Therefore putting emphasis <strong>on</strong> the quality of each link in the preprocessing chain can build the basis<br />
for a high quality output result.<br />
5.1. Geometric Correcti<strong>on</strong>s<br />
5.1.1. Principles of Geometric Distorti<strong>on</strong>s and Applied Correcti<strong>on</strong> Methods<br />
The aim of each geometric correcti<strong>on</strong> procedure of satellite data is to rectify raster data in a way that<br />
all objects within the scene are located in their exact spatial topology towards each other within a<br />
projecti<strong>on</strong> system. Such a spatially exact topology between objects can be found in topographic maps,<br />
characterized by a parallel projecti<strong>on</strong>. Furthermore, the process of geometric correcti<strong>on</strong> can aim at the<br />
precise co-registrati<strong>on</strong> of satellite images towards each other. Coregistrati<strong>on</strong> is of high relevance for<br />
multitemporal studies (LUNETTA 1999, LILLESAND & KIEFER 1994, ROSEMA et al. 1999).<br />
During the satellite’s scanning process systematic and n<strong>on</strong>-systematic shifts and displacements occur,<br />
which lead to a spatial displacement of objects within a scene. Systematic distorti<strong>on</strong>s result from many<br />
factors such as the earth’s rotati<strong>on</strong> during the scanning process, a shift in scan lines due to the forward<br />
movement of the satellite (scan time skew), a growing IFOV with increasing distance from the scene’s<br />
nadir line (panoramic effect), instabilities in the satellite’s scan rhythm as well as slightly different<br />
orientati<strong>on</strong> of the instrument’s detector axes (RICHARDS 1986, HOSTERT 2001, LÖFFLER 1994).<br />
The systematic distorti<strong>on</strong>s of the Landsat-7 raw data (.fred-format or level 0R data) were resolved with<br />
the Product Generati<strong>on</strong> System (PGS) of MacD<strong>on</strong>ald Dettwiler (MDA). This system accounts for the<br />
systematic distorti<strong>on</strong>s as well as for basic radiometric calibrati<strong>on</strong> procedures <str<strong>on</strong>g>based</str<strong>on</strong>g> <strong>on</strong> regularly<br />
updated Landsat-7 calibrati<strong>on</strong> parameter files. A complete sensor calibrati<strong>on</strong> of the data is not<br />
included yet. For geometric registrati<strong>on</strong> the system uses altitude data c<strong>on</strong>tained in the Landsat-7<br />
payload correcti<strong>on</strong> data files and the sensor’s focal plane and detector alignment parameters from the<br />
.cpf-files. Systematically corrected Landsat-7 1G data have a spatial accuracy of approximately 50<br />
meters in a scene with no significant relief (GOWARD et al. 2001). Details of these processor internal<br />
rectificati<strong>on</strong>s can be found in the MDA PGS handbook.<br />
N<strong>on</strong>-systematic distorti<strong>on</strong>s result from instabilities of the satellite’s orbit (κ, ϕ, σ, = roll, pitch and<br />
gear) and the terrain-induced object displacement orthog<strong>on</strong>al to the nadir line. These displacements<br />
need to be eliminated interactively in a parametric geocorrecti<strong>on</strong> approach rec<strong>on</strong>structing the image<br />
acquisiti<strong>on</strong> procedure. Therefore, sensor parameters, orbit descripti<strong>on</strong>, local terrain elevati<strong>on</strong> and<br />
projecti<strong>on</strong> parameters need to be known. This way a level 1T product can be generated leading to a<br />
more accurate result than n<strong>on</strong>-parametric correcti<strong>on</strong> approaches (KRAUS 1990, LÖFFLER 1994).<br />
- 81 -
Figure 5-1 dem<strong>on</strong>strates the principle of terrain-induced object displacement. The horiz<strong>on</strong>tal shift ‘Δy’<br />
between the positi<strong>on</strong> Pi of an object in the image and the corresp<strong>on</strong>ding positi<strong>on</strong> P within an<br />
orthog<strong>on</strong>al projecti<strong>on</strong> can be calculated using equati<strong>on</strong> 5.1:<br />
Δy = h × tan γ (5.1)<br />
Pi<br />
Δy<br />
P<br />
LS7<br />
Y<br />
Pi<br />
Δy<br />
P<br />
where h is defined by the terrain elevati<strong>on</strong> of the object in<br />
P and γ is the viewing angle between the point <strong>on</strong> the<br />
earth’s surface and the sensor. Terrain elevati<strong>on</strong> h can<br />
either be derived from a topographic map or a DEM. The<br />
relief induced displacement increases with a growing<br />
positive or negative elevati<strong>on</strong> difference from sea level as<br />
well as with growing distance of an object from the nadirline<br />
of the satellite image (LÖFFLER 1994). Landsat-7<br />
circles in a near polar orbit 705 km above the earth’s<br />
surface (above nadir-line). At an average of 50 kilometers<br />
distance orthog<strong>on</strong>al to the nadir-line the distance to the<br />
satellite is about 706.77km (retrieved from 705²+50²=<br />
706.77² and neglecting earth curvature).<br />
Figure 5-1: Principle of terrain induced object displacement<br />
The viewing angle of the satellite at this positi<strong>on</strong> can be derived from the modified Pythagorean<br />
relati<strong>on</strong>ships, where sinγ = 50/706.77. Calculating the inverse sinus <strong>on</strong>e retrieves a viewing angle of<br />
the sensor to a point at 50 kilometers distance from the nadir-line of 4.05°.<br />
Applying formula 5.1 the terrain induced object displacement at several elevati<strong>on</strong>s as presented in<br />
table 5-1 can be calculated. Within the orthorectificati<strong>on</strong> process the shift of a pixel Δy can therefore<br />
be compensated.<br />
Table 5-1: Elevati<strong>on</strong> dependence of relief induced displacement (ETM+)<br />
Elevati<strong>on</strong> difference to sea level<br />
0 - 500 m 0.00 m - 35.46 m<br />
500 - 1000 m 35.46 m - 70.92 m<br />
1000 - 2000 m 70.92 m - 141.84 m<br />
2000 - 3000 m 141.84 m - 212.76 m<br />
3000 - 4000 m 212.76 m - 283.68 m<br />
4000 - 5000 m 283.68 m - 354.60 m<br />
note that here the reference plane is always 0 meters (SL)<br />
- 82 -<br />
Terrain induced displacement in 50 km distance<br />
orthog<strong>on</strong>al to the nadir line<br />
In the main scene (frame 129/33, LS-7) of the study <str<strong>on</strong>g>areas</str<strong>on</strong>g> Wuda is located in 38 km distance<br />
orthog<strong>on</strong>al to the nadir line while Ruqigou/Gulaben is located in 80 km distance from the nadir. The<br />
satellite scans the <str<strong>on</strong>g>areas</str<strong>on</strong>g> under an angle of 3.08° and 6.49° respectively. Expected displacements for<br />
these specific <str<strong>on</strong>g>areas</str<strong>on</strong>g> as well as for validati<strong>on</strong> <str<strong>on</strong>g>areas</str<strong>on</strong>g> outside the study regi<strong>on</strong>s are shown in table 5-2.
Table 5-2: Relief induced displacement in the main study <str<strong>on</strong>g>areas</str<strong>on</strong>g> relative to NN in Landsat-7 ETM+ data<br />
Coal Fire Area<br />
Elevati<strong>on</strong><br />
Range [m]<br />
Ø terrain<br />
amplitude<br />
Distance to nadir<br />
of ETM+ scene<br />
Relief induced<br />
displacement [m]<br />
China, Wuda 1010-1980 ± 485 m 38 km 54.38–106.60 to SL<br />
max. 26.11 locally<br />
China, Ruqigou 1400-2640 ± 620 m 80 km 159.49 – 300.75 to SL<br />
max 70.63 locally<br />
China, Baotou<br />
SE Australia<br />
India, Jharia<br />
No orthorectificati<strong>on</strong> applied, terrain relatively flat to hilly<br />
Number of<br />
pixels [15m]<br />
3.6 – 7.0<br />
1.6<br />
10.6 – 20.05<br />
4.7<br />
A model approximating the Landsat-7 ETM+ orbit- and sensor parameters is included in the<br />
resampling algorithms of the geocorrecti<strong>on</strong> tools used, which also allows the spatial integrati<strong>on</strong> of a<br />
digital elevati<strong>on</strong> model. It was routinely used for orthorectificati<strong>on</strong> of all scenes except the <strong>on</strong>es of the<br />
transfer <str<strong>on</strong>g>areas</str<strong>on</strong>g>. The amplitude, coherence and DEM tiles were extracted with the same spatial coverage<br />
as the equivalent Landsat-7 frame from the DEM database provided by the SAR-Topo team of DFD.<br />
The DEM tiles were resampled to 30 meters, to adapt to the size of most ETM+ channels. In small<br />
<str<strong>on</strong>g>areas</str<strong>on</strong>g>, which were not covered by the ERS-DEM´, the data gaps were filled with small subsets from<br />
the GLOBE-DEM to grant a rough orthorectificati<strong>on</strong> even within these regi<strong>on</strong>s.<br />
The link between the satellite scenes, the DEM and a reference with parallel projecti<strong>on</strong> was set<br />
through the careful selecti<strong>on</strong> of evenly distributed ground c<strong>on</strong>trol points (GCPs) identifiable in the<br />
scenes as well as the reference. Since no maps, which covered the broader <str<strong>on</strong>g>areas</str<strong>on</strong>g> of interest sufficiently<br />
were available another geometric basis for GCP search had to be found. Therefore, the ERS SAR<br />
amplitude and coherence data proved to be suitable to look for distinct features existing in the SAR as<br />
well as the ETM+ data sets. Also GPS data (tracks al<strong>on</strong>g roads and distinct infrastructure<br />
intersecti<strong>on</strong>s) measured during the field work could be used as a reference. For all daytime Landsat-7<br />
scenes 20 GCPs evenly distributed within the images were chosen for geometric correcti<strong>on</strong>.<br />
Using the coordinates of the GCPs defined in the satellite scene as well as in the reference, the<br />
transformati<strong>on</strong> coefficients (where n is the number of coefficients) of the rectificati<strong>on</strong> using multiple<br />
regressi<strong>on</strong> can be calculated. The applicati<strong>on</strong> of these coefficients to the GCPs of the distorted scene,<br />
allows the calculati<strong>on</strong> of residual values in x- and y-directi<strong>on</strong>. Resulting, <strong>on</strong>e can calculate the ‘Root<br />
Mean Square Error’ (RMSE), which is a measure for the quality of a geometric correcti<strong>on</strong>:<br />
Σ (r(x)² + r(y)²)<br />
RMSE = (5.2)<br />
n − p<br />
The resampling technique used was the ‘nearest neighbor’ approach. It was preferred to the methods<br />
of bilinear interpolati<strong>on</strong> or cubic c<strong>on</strong>voluti<strong>on</strong> since it grants unchanged pixel values (RICHARDS 1986).<br />
In the worst case nearest neighbor resampling can lead to a shift of up to 0.5 pixels which can result in<br />
a ‘blocky’ structure in lineaments (KRAUS 1990, ROSEMA et al. 1999). However, for this work it is of<br />
utmost importance that pixel values stay unchanged. Figure 5-2 gives an example of an orthorectified<br />
Landsat-7 image next to the ERS-2 amplitude data.<br />
- 83 -
Table 5-3 and figure 5-3 present the results of the<br />
orthorectificati<strong>on</strong> process for the different satellite scenes.<br />
To register the scenes of the main study <str<strong>on</strong>g>areas</str<strong>on</strong>g> towards<br />
each other and retrieve a time series of scenes comparable<br />
for change analysis, the frame 129/33 from 2001 was<br />
declared as the master-scene. It was corrected with the<br />
GPS data. Other data sets of the same- and neighboring<br />
frames were registered towards this master scene. All<br />
scenes were assigned to the UTM, Z<strong>on</strong>e 48 N, coordinate<br />
system and the WGS84 datum. This is the comm<strong>on</strong><br />
reference system in the project as well.<br />
Figure 5-2: Orthorectified panchromatic ETM+ band (left)<br />
next to ERS-2 amplitude image (right). Center locati<strong>on</strong>:<br />
573529E, 4818025N, UTM, Z45N<br />
5.1.2. Results and Validati<strong>on</strong><br />
Table 5-3 presents the results of the geo- and orthocorrecti<strong>on</strong> of satellite imagery of four different<br />
sensors. Due to the exact locati<strong>on</strong> of GCPs and including the DEM for orthorectificati<strong>on</strong>, RMS-errors<br />
indicating a shift of less than <strong>on</strong>e pixel (subpixel accuracy) could be received for all scenes.<br />
Table 5-3: RMSE-results in orthorectificati<strong>on</strong> of Landsat-5 TM, Landsat-7 ETM+, Aster and Quickbird data<br />
Path/Row Sensor Date Reference RMSE x, (m) RMSE y, (m) RMSE tot.(m)<br />
129/033 ETM+ 12.08.99 2001 rectified 8.6177 9.1286 12.5537<br />
129/033 ETM+ 17.10.00 2001 rectified 5.6997 8.6340 10.3457<br />
129/033 ETM+ 04.10.01 GPS, ERS 8.9675 11.5214 14.5999<br />
129/033 ETM+ 21.09.02 2001 rectified 7.6434 7.1199 10.4458<br />
129/033 ETM+ 10.12.02 2001 rectified 10.6984 4.8891 11.7626<br />
129/033 ETM+ 12.02.03 2001 rectified 7.7086 7.8451 10.9986<br />
129/033 ETM+ 03.05.03 2001 rectified 6.3943 7.7073 10.0145<br />
128/032 ETM+ 28.09.02 no reference data and DEM available, data +/- 50m exact<br />
098/081 ETM+ 15.11.02 no reference data and DEM available, data +/- 50m exact<br />
140/044 ETM+ 02.11.01 no reference data and DEM available, data +/- 50m exact<br />
129/033 TM 20.09.87 2001 rectified 8.3564 8.9765 12.2640<br />
Wuda AST 24.09. 03 2001 rectified 8.8802 7.5561 11.6599<br />
Ruqigou AST 08.09.03 2001 rectified 7.2751 6.7039 9.8929<br />
Wuda QB 05.10.03 GCPs field 2.2301 1.5610 2.7214<br />
Ruqigou QB 22.09.03 GCPs field 3.2333 5.3418 6.2441<br />
To dem<strong>on</strong>strate the improvement of orthorectificati<strong>on</strong> versus a geometric correcti<strong>on</strong> without the<br />
integrati<strong>on</strong> of a DEM the residual errors of a rectificati<strong>on</strong> not including the DEM were plotted against<br />
elevati<strong>on</strong>. A clear dependence <strong>on</strong> the terrain (elevati<strong>on</strong>) could be noted in an R² exceeding 0.7.<br />
Including the DEM into the correcti<strong>on</strong> the relati<strong>on</strong>ship turned n<strong>on</strong> significant, illustrated in an R²<br />
below 0.2 (n=20). Nevertheless, it should be menti<strong>on</strong>ed that the quality of an orthorectificati<strong>on</strong><br />
predominantly depends <strong>on</strong> the quality of the DEM included in the parametric approach. Strictly<br />
speaking, the RMSEs represent the accuracy close to the GCPs, but internal variati<strong>on</strong> within the scene<br />
- 84 -
can still occur (HOSTERT 2001). Also, the GPS data used as reference may already c<strong>on</strong>tain a spatial<br />
shift of up to 15 meters as menti<strong>on</strong>ed in chapter 3. Therefore, the term ‘subpixel accuracy’ has to be<br />
used with care. Nevertheless, a visual c<strong>on</strong>trol of the remaining shifts to assess the final spatial<br />
accuracy showed no preferred directi<strong>on</strong>. With total RMSEs in the range of 7 to 18 meters for all<br />
ETM+ scenes, the quality of the individual geometric correcti<strong>on</strong>s can be c<strong>on</strong>sidered good.<br />
a<br />
b<br />
Figure 5-3: Geometric accuracy compared with GPS ground truth before (a) and after (b) the orthorectificati<strong>on</strong><br />
dem<strong>on</strong>strated <strong>on</strong> a subset of ETM+ scene 129/033, Center locati<strong>on</strong>: 650651E, 4377299N, UTM, Z48N.<br />
Since very detailed maps for the Wuda syncline are not available the Quickbird data was<br />
geometrically rectified <strong>on</strong> the basis of GPS <str<strong>on</strong>g>based</str<strong>on</strong>g> ground c<strong>on</strong>trol points. These were collected <strong>on</strong><br />
distinct points within the syncline during the satellite’s overpass time during the field campaigns in<br />
2002 and 2003. Three different GPS of the same brand were used to map points, which were thought<br />
to be recognizable in the satellite images. Corners of house roofs, electric poles, water storage tanks,<br />
road intersecti<strong>on</strong>s and similar features were located and mapped with GPS. Furthermore the height<br />
was estimated with an analogue altimeter (Thommen Classic 5000).<br />
Drawings of the ground c<strong>on</strong>trol points (GCPs) collected with GPS were generated and a small<br />
descripti<strong>on</strong> as well as the x, y and z coordinates were noted, to relocate the GCPs within the high<br />
resoluti<strong>on</strong> saetllite images. It turned out that <strong>on</strong>ly 70% of the collected ground c<strong>on</strong>trol points in the<br />
field could be identified in the satellite data. This was especially true for the cemented foundati<strong>on</strong>s of<br />
electric poles. However, the other GCPs were distinct enough and the data could be rectified within<br />
the range of 2.5 meters.<br />
An accurate orthorectificati<strong>on</strong> of imagery is also desirable for the following step in the processing<br />
chain – a combined atmospheric and topographic correcti<strong>on</strong>.<br />
5.2. Radiometric Correcti<strong>on</strong>s for the Reflective Bands<br />
C<strong>on</strong>diti<strong>on</strong>s for analysis of satellite data are best, when reflecti<strong>on</strong> changes detected by the sensor are<br />
caused by <strong>spectral</strong> characteristics of a surface exclusively. This is not the case though, since radiati<strong>on</strong><br />
reaching the sensor represents interacti<strong>on</strong>s of different factors. Illuminati<strong>on</strong> c<strong>on</strong>diti<strong>on</strong>s caused by the<br />
sun-earth-sensor geometry or relief induced topographic illuminati<strong>on</strong> effects, aerosol and gas c<strong>on</strong>tents<br />
- 85 -
and different reflectance patterns of different surfaces play an important role. Therefore, these factors<br />
have to be eliminated as far as possible in order to obtain calibrated images enabling the opti<strong>on</strong> to<br />
quantitatively compare different or multitemporal data sets. This can be achieved applying a combined<br />
atmospheric- and topographic illuminati<strong>on</strong> correcti<strong>on</strong> to the data (RICHTER 1998, RICHARDS 1986,<br />
SCHOTT 1997, SONG et al. 2001, HILL & MEHL 1995, KRAUS 1990, KRAUS 1989, HILL & MEHL<br />
2003). Nevertheless, it should be menti<strong>on</strong>ed that an atmospheric correcti<strong>on</strong> is not necessarily of<br />
importance when aiming at image classificati<strong>on</strong> of a single date image in flat terrain (SONG et al.<br />
2001). However, in rugged terrain a topographic illuminati<strong>on</strong> correcti<strong>on</strong> is indispensable to improve<br />
classificati<strong>on</strong> results. When aiming at multitemporal or spatially comparable data sets, signature<br />
detecti<strong>on</strong> and comparis<strong>on</strong> <str<strong>on</strong>g>based</str<strong>on</strong>g> <strong>on</strong> standard spectra or multitemporal unmixing, a thorough<br />
radiometric correcti<strong>on</strong> is a must. This applies especially with respect to classificati<strong>on</strong>-algorithms or<br />
change detecti<strong>on</strong> methods, which will be applied in <strong>on</strong>e place and shall be transferred in other places<br />
and/or times, including a possible routine development (SONG et al. 2001, RICHTER 2003).<br />
5.2.1. Sensor Calibrati<strong>on</strong><br />
The radiance L Sat reaching the sensor passes the optics, a detector, electr<strong>on</strong>ics, undergoes analogue- to<br />
digital c<strong>on</strong>versi<strong>on</strong> and is finally quantified in a DN. A calibrati<strong>on</strong> functi<strong>on</strong> defines the transformati<strong>on</strong><br />
between the physical radiance quantity and the DN. Since sensor degradati<strong>on</strong> effects are unavoidable<br />
over time, it is an important task to adjust the calibrati<strong>on</strong> coefficients of the linear calibrati<strong>on</strong> functi<strong>on</strong>.<br />
Each channel has its own coefficients and radiometric calibrati<strong>on</strong> functi<strong>on</strong> including the dynamic<br />
range of the specific channel:<br />
- 86 -<br />
L Sat = L minλ + ((L maxλ – L minλ ) / (DN max – DN min )) × DN (5.3)<br />
where L minλ and L maxλ are the minimum- and maximum radiance and DN min and DN max are the<br />
minimum and maximum DN respectively. This can be expressed simplified as:<br />
L Sat = c 0 + c 1 × DN (5.4)<br />
The calibrati<strong>on</strong> coefficients c 0 and c 1 are regularly updated <str<strong>on</strong>g>based</str<strong>on</strong>g> <strong>on</strong> <strong>on</strong>board calibrati<strong>on</strong> methods and<br />
reflectance <str<strong>on</strong>g>based</str<strong>on</strong>g> vicarious calibrati<strong>on</strong> techniques (RICHTER 1998, THOME 2001). Onboard calibrati<strong>on</strong><br />
for ETM+ includes an internal light source, a multifaceted optical device to direct solar radiati<strong>on</strong> <strong>on</strong>to<br />
the focal plane and a full-aperture, full-optical-path solar diffuser (MARKHAM et al. 1996). However,<br />
<strong>on</strong>board calibrators can not provide a calibrati<strong>on</strong> of higher accuracy than preflight laboratory<br />
calibrati<strong>on</strong>s, since the latter are used to calibrate the <strong>on</strong>board devices. Therefore, (and due to the<br />
degradati<strong>on</strong> problem of the optical elements and diffuser panel), vicarious calibrati<strong>on</strong>s <str<strong>on</strong>g>based</str<strong>on</strong>g> <strong>on</strong><br />
ground measurements are regularly undertaken. Ideal <strong>test</strong> sites for this purpose have a high<br />
reflectance, high elevati<strong>on</strong> (to minimize atmospheric influence), high spatial and <strong>spectral</strong> uniformity,<br />
minimal to no changes over the seas<strong>on</strong>s, nearly Lambertian bidirecti<strong>on</strong>al reflectance distributi<strong>on</strong><br />
functi<strong>on</strong>s (isotropic reflectance) and good accessibility (THOME 2001). One of these ideal sites is the<br />
alkalic flat regi<strong>on</strong> White Sands Missile Range in New Mexico. Here, large amounts of ground <str<strong>on</strong>g>based</str<strong>on</strong>g><br />
surface reflectance measurements (>15,000) at over 500 sampling points are used to calculate an<br />
average reflectance for the entire site. Measured reflectance and atmospherically corrected DNs of<br />
multitemporal scenes can then be compared. Landsat-7 – up to its failure in May 2003 – c<strong>on</strong>vinced<br />
with a great stability of all bands and <strong>on</strong>ly little degradati<strong>on</strong> (THOME 2001, GOWARD et al. 2001).
5.2.2. Atmospheric and Topographic Correcti<strong>on</strong>s<br />
Assuming a correct sensor calibrati<strong>on</strong>, the derivati<strong>on</strong> of radiances from the DNs enables to derive the<br />
at satellite reflectance of a surface, ρ. The calculati<strong>on</strong> uses incoming radiance and exatmospheric<br />
irradiance, also referred to as top of the atmosphere irradiance (TOA), E s , which depends <strong>on</strong> the cosine<br />
of the sun zenith angle θ s and the earth-to-sun distance, d, in astr<strong>on</strong>omical units:<br />
ρ = (π × L × d²) / (E s × cosθ s ) (5.5)<br />
However, <strong>on</strong>ly for a hypothetic case of a perfectly transmitting atmosphere equals ρ the reflectance of<br />
the object <strong>on</strong> the earth’s surface. In reality the signal is modified by wavelength dependent<br />
atmospheric influences. These sometimes have such a str<strong>on</strong>g impact that in the worst case the<br />
reflectance characteristics of a surface <strong>on</strong> the earth are totally masked. Although there is no agreement<br />
<strong>on</strong> which atmospheric radiative transfer code should be used to correct satellite data for atmospheric<br />
effects, there is the overall agreement that atmospheric correcti<strong>on</strong> is often a necessity for optical and<br />
thermal data. Most codes lead to results much alike (ATZBERGER 2002, HOLZER-POPP et al. 2002).<br />
When electromagnetic radiati<strong>on</strong> passes through the atmosphere it undergoes the processes of<br />
absorpti<strong>on</strong> and scattering (both add to extincti<strong>on</strong>). Comp<strong>on</strong>ents of atmospheric extincti<strong>on</strong> are gas<br />
absorpti<strong>on</strong> of mainly oz<strong>on</strong>e, oxygen, water vapor and CO 2 , Rayleigh scattering caused by gaseous air<br />
molecules with a radius of less than 10 -4 µm, and Mie scattering caused by aerosol particles between<br />
0.1 µm and 10 µm.<br />
The resistance of the atmosphere to the transmissi<strong>on</strong> of electromagnetic radiati<strong>on</strong> (EMR) – the optical<br />
thickness – is defined by the sum of the weakening influences of these three complexes (LÖFFLER<br />
1994). Rayleigh scattering, showing a symmetrical phase functi<strong>on</strong>, is defined by 0,000873 × λ -4,09 ,<br />
which is also referred to as the molecular optical thickness of a standard Rayleigh atmosphere. It<br />
imposes that scattering shows an inverse relati<strong>on</strong>ship with the wavelength. This means short<br />
wavelengths experience a str<strong>on</strong>ger scattering than l<strong>on</strong>ger wavelengths.<br />
Atmospheric correcti<strong>on</strong> therefore has to account for Rayleigh scattering, aerosol scattering and<br />
absorpti<strong>on</strong> and molecular absorpti<strong>on</strong> mainly caused by CO 2 , O 2 , O 3 and water vapor. The major<br />
atmospheric water vapour absorpti<strong>on</strong> bands are centered at approximately 0.94, 1.14, 1.38 and 1.88<br />
µm, while CO 2 leads to absorpti<strong>on</strong> bands near 2.01 µm and 2.08 µm and O 2 at 0.76 µm. O 3 , CO, N 2 O<br />
and CH 4 produce noticable fatures between 0.4 µm-2.5µm. The Rayleigh c<strong>on</strong>tributi<strong>on</strong> depends <strong>on</strong>ly<br />
<strong>on</strong> the pressure level and can easily be calculated analytically. The absorpti<strong>on</strong> effects caused by CO 2<br />
and O 2 also depend <strong>on</strong> the pressure level, but they have a c<strong>on</strong>stant volume mixing ratio, so this<br />
influence can also be taken into account. Oz<strong>on</strong>e and water vapor c<strong>on</strong>centrati<strong>on</strong>s show large variati<strong>on</strong>s<br />
in space and time. Maps of O 3 or water vapor can be derived from meteorological satellite data. The<br />
remaining challenging task of atmospheric correcti<strong>on</strong> is the calculati<strong>on</strong> of the spatially varying aerosol<br />
c<strong>on</strong>centrati<strong>on</strong> (ATZBERGER 2002, ARANUVACHAPUN 1983, KRAUS 1989, RICHTER 2003).<br />
As presented in figure 5-4, for a rugged terrain, the signal at the sensor c<strong>on</strong>sists of four comp<strong>on</strong>ents<br />
(L 1 , L 2 , L 3 , L 4 ). These are the reflected direct and diffuse radiati<strong>on</strong> from the currently viewed pixel,<br />
path radiance (depending <strong>on</strong> solar and viewing geometry), terrain reflected radiati<strong>on</strong> from nearby hills<br />
and adjacency radiati<strong>on</strong> caused by atmospheric scattering. L 4 therefore mainly depends <strong>on</strong> the<br />
- 87 -
LS 7<br />
Reflected terrain radiati<strong>on</strong><br />
L2<br />
Adjacency radiati<strong>on</strong> caused by<br />
atmospheric scattering over adjacent<br />
fields of different reflectance<br />
L4<br />
Path radiance<br />
Radiati<strong>on</strong> reflected from the pixel into the FOV<br />
L3<br />
L1<br />
Figure 5-4: Radiance comp<strong>on</strong>ents of the signal reaching the sensor (RICHTER 1998, modified)<br />
brightness difference between the pixel of interest and the surrounding neighborhood. Only L 1<br />
c<strong>on</strong>tains the informati<strong>on</strong> of the actual surface properties, while L 2 , L 3 and L 4 have to be removed<br />
during the correcti<strong>on</strong> process.<br />
Depending <strong>on</strong> slope and aspect a ground element (pixel) of a specific land cover class, which is<br />
exposed towards the sun, receives more energy than a pixel of the same land cover class exposed in<br />
opposite directi<strong>on</strong>. Thus, the pixel exposed towards the sun will appear brighter. This effect increases<br />
the <strong>spectral</strong> variance within a single class, which can lead to misclassificati<strong>on</strong>s (TOKOLA et al. 2001,<br />
COLBY 1991, PROY et al. 1989). It has often been reported that this influence leads e.g. to the fact that<br />
deciduous forest <str<strong>on</strong>g>areas</str<strong>on</strong>g> <strong>on</strong> a sunny slope will be classified as meadow while, when located in shadowed<br />
<str<strong>on</strong>g>areas</str<strong>on</strong>g>, they will be classified as c<strong>on</strong>iferous forest (HILL & MEHL 1995). Therefore these topographic<br />
effects should be c<strong>on</strong>sidered within the radiometric correcti<strong>on</strong> process.<br />
Many different radiative transfer codes for atmospheric correcti<strong>on</strong> exist; such as e.g. the 5S code<br />
(Simulati<strong>on</strong> of the Satellite Signal in the Solar Spectrum) developed by TANRÉ et al. (1990) and<br />
further modified to the 6S code (Sec<strong>on</strong>d Simulati<strong>on</strong> ...) by VERMOTE et al. (1997), or codes developed<br />
by OUAIDRARI & VERMOTE (1999) and BERK & BERNSTEIN (1989). Atmospheric and topographic<br />
correcti<strong>on</strong> algorithms <str<strong>on</strong>g>based</str<strong>on</strong>g> <strong>on</strong> these radiative transfer codes were am<strong>on</strong>gst others implemented by<br />
ARANUVACHAPUN (1983), HILL &STURM (1991), HILL & MEHL (2003), CHAVEZ (1996) and RICHTER<br />
(1998). CONGHE et al. (2001) stress that c<strong>on</strong>trary to expectati<strong>on</strong>s, the more complicated algorithms do<br />
not necessarily lead to improved performance of surface classificati<strong>on</strong> and change detecti<strong>on</strong> results for<br />
imagery in flat terrain.<br />
The Landsat-7 scenes used for this research were radiometrically corrected using the IDL code of the<br />
ATCOR 3 model developed by RICHTER (1998, 2003). This model takes the atmospheric and<br />
topographic effects as well as the optical mass into account. The optical mass is defined by the<br />
atmospheric column above a point <strong>on</strong> the earth’s surface depending <strong>on</strong> its elevati<strong>on</strong>.<br />
The code calculates at-sensor radiances (L Sat ) for each pixel in each channel as the first step. Then,<br />
atmospheric transmittance, direct and diffuse solar flux and path radiance as needed for the<br />
atmospheric correcti<strong>on</strong> will be extracted from an atmospheric database compiled with MODTRAN-4<br />
- 88 -
adiative transfer code (BERK & BERNSTEIN 1989). This database represents a wide range of<br />
atmospheric c<strong>on</strong>diti<strong>on</strong>s <str<strong>on</strong>g>based</str<strong>on</strong>g> <strong>on</strong> manifold cross combinati<strong>on</strong>s of water vapor c<strong>on</strong>tent (8 classes, 0.4-<br />
4.1 cm water vapor column), aerosol types (5 classes), ground elevati<strong>on</strong>s (6 classes, 0 km - 2.5 km),<br />
solar zenith angles (8 classes, 0°-70°) and visibility. It allows an approximated definiti<strong>on</strong> of<br />
atmospheric c<strong>on</strong>diti<strong>on</strong>s for the satellite data without the need to recalculate the whole radiative transfer<br />
for each individual case (RICHTER 1998, 2003).<br />
The properties of the selected standard aerosol type will be modified iteratively to match scene<br />
c<strong>on</strong>diti<strong>on</strong>s <str<strong>on</strong>g>based</str<strong>on</strong>g> <strong>on</strong> the “dark dense vegetati<strong>on</strong> / dark object approach” using dark pixels of known<br />
reflectance to derive the scene-specific optical depth. If several dark <str<strong>on</strong>g>areas</str<strong>on</strong>g> exist, a spatially varying<br />
map of the optical depth can be triangulated. In case no dark objects are available, a standard<br />
atmosphere with a user specified visibility can be used. For details <strong>on</strong> the dark object approach see<br />
KAUFMANN & SENDRA (1988) and SONG et al. (2001).<br />
Since all scenes used for this research were completely haze- and cloud free an interactive masking of<br />
these <str<strong>on</strong>g>areas</str<strong>on</strong>g> was not necessary.<br />
The four radiance comp<strong>on</strong>ents summing up to the radiati<strong>on</strong> reaching the sensor (in mW cm -2 sr -1 µm -1 )<br />
have already been introduced in figure 5-4. Comp<strong>on</strong>ent L 1 is calculated as:<br />
L 1 = τ v (ρ/π) (E dir + E dif ) (5.6)<br />
where τ v , ρ, E dir , E dif are ground-to-sensor transmittance, ground reflectance and direct and diffuse<br />
solar flux (RICHTER, 1998).<br />
L 2 – path radiance (L P ) – is known from the radiative transfer code, while comp<strong>on</strong>ent L 3 is described<br />
by:<br />
L 3 = τ v (ρ/π) ρ Terrain E g (5.7)<br />
where Eg is the global direct and diffuse flux <strong>on</strong> the ground and ρ Terrain is an approximati<strong>on</strong> of the<br />
terrain reflected radiati<strong>on</strong> obtained by weighting the reflected radiati<strong>on</strong> in a 0.5 km surrounding of a<br />
pixel with the terrain view factor V terrain . This factor is derived from 1-V sky , with the latter representing<br />
the visible part of the sky hemisphere for a pixel (x,y) calculated from a DEM.<br />
Neglecting the adjacency effect, L 4 , we receive:<br />
which can be transferred to:<br />
L Sat = c 0 + c 1 DN = L 1 + L 2 + L 3 (5.8)<br />
ρ = π (d 2 L Sat‘ - L P ) / [τ v (E dir + E dif + ρ Terrain E g ] (5.9)<br />
- 89 -
where d is the Earth-Sun distance in astr<strong>on</strong>omical units. Equati<strong>on</strong> 5.9 is extended to account for the<br />
directi<strong>on</strong>al dependence of the direct and diffuse solar radiati<strong>on</strong> in a rugged terrain. The reflectance is<br />
then calculated iteratively starting with ρ terrain (0) = 0.1 and neglecting the adjacency effect:<br />
π × { d² [ c0<br />
+ c1DN(x,<br />
y) ] − Lp(z,<br />
θv,<br />
φ)<br />
}<br />
[ b(x, y)Esτs(z) cosβ(x,<br />
y) + Ed<br />
* (x, y, z) + Eg(z)<br />
ρterrain(i)<br />
Vterrain(x,<br />
y) ]<br />
ρi(x,<br />
y) =<br />
τυ (z, θv)<br />
(5.10)<br />
representing the true reflectance ρ of each pixel in each band with:<br />
x,y: horiz<strong>on</strong>tal coordinates corresp<strong>on</strong>ding to the georeferenced pixel positi<strong>on</strong>s;<br />
z: c<strong>on</strong>taining the elevati<strong>on</strong> informati<strong>on</strong> from the DEM;<br />
DN: digital number;<br />
L p (z, θ v , φ): path radiance depending <strong>on</strong> elevati<strong>on</strong> and viewing geometry;<br />
τ υ (z): ground to sensor view angle transmittance with direct and diffuse comp<strong>on</strong>ents;<br />
τ s (z): sun to ground beam (direct) transmittance;<br />
β(x,y): angle between the solar ray and the surface normal (illuminati<strong>on</strong> angle);<br />
b: binary factor with b = 1 if a pixel receives a direct solar beam, otherwise b = 0;<br />
E s : exatmospheric solar irradiance;<br />
E d *(x,y,z): diffuse solar flux;<br />
E g (z): global flux (direct plus diffuse solar flux at a horiz<strong>on</strong>tal surface with elevati<strong>on</strong> z);<br />
ρ terrain (0) : initial value (c<strong>on</strong>stant for each band) of average terrain reflectance;<br />
ρ terrain (i) (x,y): locally varying average terrain reflectance, calculated iteratively (i=1,2,3) by low pass<br />
filtering the image with a box of 1km * 1km, i.e., twice the R = 0.5-km range;<br />
V terrain (x,y): terrain view factor (0-1 range) calculated from the local slope or a horiz<strong>on</strong> analysis<br />
(RICHTER 1998).<br />
Here, the reflectance ρ i of a pixel is calculated iteratively <str<strong>on</strong>g>based</str<strong>on</strong>g> <strong>on</strong> the previously selected atmosphere<br />
(water vaopour, aerosol type), the visibility map and the DEM. After three iterati<strong>on</strong>s the results<br />
indicate an asymptotic behavior not leading to distinct further improvements (RICHTER 1998).<br />
Figure 5-5: Image input parameters in ATCOR-3 (image bands, DEM, aspect, slope, skyview and shadow file)<br />
The final reflectance ρ f including the adjacency effect is calculated from the result of equati<strong>on</strong> 5.10.<br />
and the local average reflectance in the 1km × 1km neighborhood of a pixel:<br />
- 90 -
[ ρ(x,<br />
y) − ρ'<br />
(x, y) ]<br />
ρ f = ρ(x,<br />
y) + q<br />
(5.11.)<br />
where q is a weighing factor (stored in the database derived from MODTRAN-4 representing the ratio<br />
of diffuse to direct transmittance); which is extended further to include the range dependent<br />
exp<strong>on</strong>ential decrease of the adjacency effect (see RICHTER 1998 for further details).<br />
5.2.3. Results and Validati<strong>on</strong><br />
When correcting the multitemporal scenes of frame 129/33 from 1987, 1999, 2000, 2001, 2002 and<br />
2003 it became obvious that the actual calibrati<strong>on</strong> files available for the specific time periods in<br />
ATCOR-3 did not yield good results in calibrating and correcting the data. Pixel values in the blue<br />
band dropped below zero pseudo-indicating either a str<strong>on</strong>g sensor degradati<strong>on</strong> or data inherent errors<br />
in the raw data. Furthermore, for many scenes even after the radiometric correcti<strong>on</strong> did image spectra<br />
not coincide with the spectra measured in the field and laboratory, which were used as reference for<br />
the radiometric correcti<strong>on</strong> quality assessment.<br />
To account for this problem, a relative calibrati<strong>on</strong> procedure was performed. This procedure improves<br />
the <strong>spectral</strong> comparability of scenes after radiometric correcti<strong>on</strong> when dealing with time series of data.<br />
The calibrati<strong>on</strong> parameters of uncorrected scenes are calculated <str<strong>on</strong>g>based</str<strong>on</strong>g> <strong>on</strong> a corrected master scene<br />
(129/33 from 1999) using a linear regressi<strong>on</strong>. To compute the regressi<strong>on</strong> several surfaces, which do<br />
not <strong>spectral</strong>ly change over time (bare sand, bare rock etc.) and which are often referred to as pseudoinvariant<br />
objects, will be <strong>spectral</strong>ly compared. A regressi<strong>on</strong> for the different reflectance values in each<br />
band is derived. Four reference targets, which were pure desert sand, bare soil, pure Sandst<strong>on</strong>e and<br />
mixed sand were chosen to apply this approach. The reference targets were located in homogeneous<br />
<str<strong>on</strong>g>areas</str<strong>on</strong>g> not influenced by mixed signatures or adjacency effects. The calibrati<strong>on</strong> coefficients were then<br />
calculated with a least squares fit approach applied to a linear regressi<strong>on</strong> equati<strong>on</strong> (see figure 5-6).<br />
This process was repeated for all other scenes of this frame. The highly significant correlati<strong>on</strong> derived<br />
from the linear regressi<strong>on</strong> proves the stability of the model and grants inter-scene as well as good<br />
spectra comparability.<br />
Figure 5-6: Regressi<strong>on</strong> analysis for 4 calibrati<strong>on</strong> targets inflight calibrating the scene 129/33 of 2000 here<br />
shown for bands 1-5. x-axis: reflectances in %/100, y-axis: reflectances in %. Four pseudo-invariant targets.<br />
In some cases the generati<strong>on</strong> of an own calibrati<strong>on</strong> file, which can be created <str<strong>on</strong>g>based</str<strong>on</strong>g> <strong>on</strong> the header file<br />
of the individual raw scene were sufficient to reach comparable signatures (e.g. for the two Aster<br />
scenes). Each header file c<strong>on</strong>tains the minimum and maximum radiance (L Sat ) recorded for each<br />
channel respectively. The coefficients c0 and c1 can be derived with:<br />
c 0 = L min / 10 and c 1 = ((L max -L min ) / 254) × 0.1 (5.12.)<br />
- 91 -
After the applicati<strong>on</strong> of the individual parameter files the atmospherically corrected data of the time<br />
series fit very well. This could be proven comparing signatures of pseudo-invariant targets like pure<br />
sandst<strong>on</strong>e, sand and light limest<strong>on</strong>e over time. The atmospheres used for the correcti<strong>on</strong> of the different<br />
satellite scenes are presented in table 5-4.<br />
Table 5-4: MODTRAN 4 standard atmospheres applied. Scenes marked with a * were adjusted (calibrati<strong>on</strong> files,<br />
or relative calibrati<strong>on</strong> as presented <strong>on</strong> the last page)<br />
Path/Row Sensor Date Solar azimuth Solar zenith MODTRAN atmosphere<br />
129/033 ETM+ 12.08.99 132.73 31.41 dry rural atmosphere<br />
129/033 ETM+ 17.10.00 155.63 51.39 dry rural atmosphere<br />
129/033 ETM+ 04.10.01 151.53 47.04 dry rural atmosphere<br />
129/033 ETM+ 21.09.02 147.12 42.97 dry rural atmosphere<br />
129/033* ETM+ 10.12.02 149.16 58.36 dry rural atmosphere<br />
129/033* ETM+ 12.02.03 158.22 64.95 dry rural atmosphere<br />
129/933* ETM+ 03.05.03 133.69 30.52 dry rural atmosphere<br />
128/032 ETM+ 29.08.02 139.80 37.16 dry rural atmosphere<br />
098/081 ETM+ 15.11.02 74.15 30.46 fall desert atmosphere<br />
140/044 ETM+ 02.11.01 147.98 43.68 tropical rural atmosphere<br />
129/033 TM 20.09.87 141.10 43.91 dry rural atmosphere<br />
Wuda AST 24.09.03 126.50 46.50 dry rural atmosphere<br />
Ruqigou AST 08.09.03 133.60 50.60 dry rural atmosphere<br />
Wuda QB 05.10.03 155.60 46.80 no atm. correcti<strong>on</strong><br />
Ruqigou QB 22.09.03 152.70 41.70 no atm. correcti<strong>on</strong><br />
a b c<br />
a’ b’ c’<br />
Figure 5-7: Visual impressi<strong>on</strong> before (top row) and after (bottom row) the radiometric correcti<strong>on</strong> for a subset<br />
of the Landsat-7 ETM+ scene from India (a), Australia (b) and Baotou (c) used for later transfer purposes.<br />
Center locati<strong>on</strong>s: UTM, a: 385657E, 2624616N, Z45N, b: 256271E, 6655205S Z54S, c: 356912E, 4405175N,<br />
Z49N<br />
- 92 -
Figure 5-7 presents the result of atmospheric correcti<strong>on</strong> for the Landsat-7 transfer scenes. Due to the<br />
lack of a DEM and a relatively flat terrain ATCOR-2 was applied. It can clearly be seen that the<br />
amount of Rayleigh scattering still present in the top images has been reduced in the bottom row. The<br />
overall blur due to aerosol influence has decreased substantially.<br />
Figure 5-8- presents a comparis<strong>on</strong> of a resampled<br />
desert sand reference spectrum measured in the<br />
<strong>spectral</strong> laboratory (◊) and three spectra collected<br />
in an atmospherically corrected image. The “×”<br />
spectrum is from the same area as the sample<br />
(close to Wuda) and proves the high quality of the<br />
correcti<strong>on</strong>. The “Δ” and “□” spectra are desert<br />
sand spectra from the scene of Baotou (128/032).<br />
Figure 5-8: Quality assessment of the radiometrically corrected scenes <str<strong>on</strong>g>based</str<strong>on</strong>g> <strong>on</strong> the recorded spectra<br />
Figure 5-9 presents two sets of <strong>spectral</strong> profiles of three different surfaces from the same scene in the<br />
<str<strong>on</strong>g>coal</str<strong>on</strong>g> mining <str<strong>on</strong>g>areas</str<strong>on</strong>g> before and after the correcti<strong>on</strong>. To compare DNs (before) with reflectances<br />
(afterwards) the DNs were transferred into reflectances at the top of the atmosphere (TOA-reflectance,<br />
ρ TOA ), also called ‘apparent reflectance’, defined by equati<strong>on</strong> 5.5. TOA-spectra and surface spectra of<br />
the Yellow River (dark turquoise), water of a small lake (light turquoise), and <str<strong>on</strong>g>coal</str<strong>on</strong>g> (black) were<br />
compared. The overall impressi<strong>on</strong> of the ‘before’- and ‘after’ situati<strong>on</strong> proves that the additive<br />
scattering part especially in the blue range of the spectrum could clearly be eliminated. Also the<br />
scattering in the NIR, which is visible in the spectrum of lake water before the correcti<strong>on</strong>, could be<br />
minimized. This was expected since clear water bodies reflect <strong>on</strong>ly visible EMR while the reflecti<strong>on</strong> in<br />
the NIR should be close to zero. Only turbid water bodies with large amounts of algae or sediment<br />
have a moderate surface reflectance of a few percent. High values of the Yellow River in the green,<br />
red and NIR are caused by high amounts of sediment and algae within the water. Especially the latter<br />
leads to the peak in the NIR.<br />
Figure 5-10 presents two small subsets of frame 129/33 from 1999 before and after the combined<br />
atmospheric and topographic correcti<strong>on</strong> at the foothills of a metamorphic complex south of<br />
Figure 5-9: Landsat-7 ETM+ spectra of three different surfaces (Yellow River=dark turquoise, lake water=light<br />
turquoise, <str<strong>on</strong>g>coal</str<strong>on</strong>g>=black) before (left) and after (right) the atmospheric correcti<strong>on</strong>. Band number 6 <strong>on</strong> the x-axis is<br />
band 7 (MIR) of the Landsat ETM+ data.<br />
- 93 -
Wuda grading into an alluvial fan in the East. The visual comparis<strong>on</strong> illustrates that relief induced<br />
illuminati<strong>on</strong> effects could be reduced substantially through the combined radiometric correcti<strong>on</strong> of the<br />
data. Shadowed <str<strong>on</strong>g>areas</str<strong>on</strong>g> where clearly lightened up. Only after the topographic correcti<strong>on</strong> do similar<br />
objects have a a similar <strong>spectral</strong> behavior. Nevertheless, not all <str<strong>on</strong>g>areas</str<strong>on</strong>g> can completely be equalized<br />
since some <str<strong>on</strong>g>areas</str<strong>on</strong>g> might be located within a core-shadow regi<strong>on</strong> where the signal does not receive any<br />
<strong>spectral</strong> signal of the surface. This is often the case in <str<strong>on</strong>g>areas</str<strong>on</strong>g> of extreme slopes or narrow and deeply<br />
incised valleys and cany<strong>on</strong>s. Therefore no topographic correcti<strong>on</strong> can eliminate 100% of the relief<br />
induced radiometric effects present in the data.<br />
The analysis of spectra before and after atmospheric- and topographic correcti<strong>on</strong> procedures (figure 5-<br />
9) as well as figures 5-7, 5-8 and 5-10 qualitatively support the success of the correcti<strong>on</strong>s. However, it<br />
should be menti<strong>on</strong>ed that direct photometer measurements in the field during overflight times were not<br />
undertaken and a variable aerosol optical thickness over an area of nearly 180 × 180 km² could not be<br />
assessed. Therefore, data other than <strong>spectral</strong> measurements to quantitatively assess the radiometric<br />
correcti<strong>on</strong> <str<strong>on</strong>g>based</str<strong>on</strong>g> <strong>on</strong> ground truth is not available and applicable.<br />
a<br />
b<br />
Figure 5-10: Visual impressi<strong>on</strong> before (a) and after (b) the combined radiometric correcti<strong>on</strong> using ATCOR-3.<br />
Center locati<strong>on</strong>: 642959E, 4360922N, UTM, Z48N<br />
Nevertheless, an approximating quantitative validati<strong>on</strong> for the reducti<strong>on</strong> of topographic influences<br />
could be obtained <strong>on</strong> a statistical basis through a regressi<strong>on</strong> analysis of the relati<strong>on</strong>ship between the<br />
computed scene reflectances and the cosine of the illuminati<strong>on</strong> angle (HILL & MEHL 1995, RICHTER<br />
1998). Before topographic correcti<strong>on</strong>, a significant correlati<strong>on</strong> coefficient of R² = 0.93 is obtained,<br />
illustrating that small illuminati<strong>on</strong> angles cause high radiance values interpreted as high reflectance,<br />
while large illuminati<strong>on</strong> angles cause low radiance values interpreted as low reflectance. After the<br />
combined atmospheric and topographic correcti<strong>on</strong> the correlati<strong>on</strong> coefficient is clearly reduced<br />
(R²=0.24), indicating the successful removal of relief induced reflectance differences. This calculati<strong>on</strong><br />
is <str<strong>on</strong>g>based</str<strong>on</strong>g> <strong>on</strong> 8 pixels, where ground truth was available. The eight plots are all located <strong>on</strong> a small<br />
limest<strong>on</strong>e ridge <strong>on</strong> the eastern side of the Yellow River. The surface c<strong>on</strong>sists of bare limest<strong>on</strong>e<br />
covered with a sparse grass cover <strong>on</strong> the eastern and western slope. Two pixels are located in<br />
completely flat terrain near a road, while two are located <strong>on</strong> a steeper cliff – the others are located <strong>on</strong><br />
the intermediate slope. For a larger area, where no ground truth is available though, the correlati<strong>on</strong><br />
coefficient is 0.73 before- and 0.28 after the combined correcti<strong>on</strong>. However, figure 5-10 dem<strong>on</strong>strates<br />
that some shadowed <str<strong>on</strong>g>areas</str<strong>on</strong>g> remain and that over-correcti<strong>on</strong>s occur as well.<br />
- 94 -
Figure 5-11: Regressi<strong>on</strong> analysis of the cosine of the illuminati<strong>on</strong> angle versus scene reflectances before and<br />
after the topographic correcti<strong>on</strong> for eight pixels located <strong>on</strong> a sun-facing and sun opposing limest<strong>on</strong>e ridge in the<br />
area around center locati<strong>on</strong> 661553E, 4360919N, UTM, Z48N<br />
Regarding inner class seperability investigati<strong>on</strong>s (different vegetati<strong>on</strong> types, differentiati<strong>on</strong> of similar<br />
geologic units etc.) SCHARDT (1990) illustrated that a stratificati<strong>on</strong> of a study area <str<strong>on</strong>g>based</str<strong>on</strong>g> <strong>on</strong><br />
topographic and illuminati<strong>on</strong> parameters is str<strong>on</strong>gly supporting signature discriminati<strong>on</strong>. He stratified<br />
his study area into classes of different elevati<strong>on</strong>, slope, aspect and illuminati<strong>on</strong> and dem<strong>on</strong>strated the<br />
reflectance dependence of tree species signatures <strong>on</strong> these topographic / geometric parameters.<br />
Different tree types and age classes could then be differentiated taking this relief-dependent behavior<br />
into account. However, in this case the aim to extract certain surfaces does not require for as much<br />
precisi<strong>on</strong> as applied in the above investigati<strong>on</strong>, but rather focuses <strong>on</strong> inter-class separability<br />
(vegetati<strong>on</strong> from geology) than <strong>on</strong> inner-class separability (vegetati<strong>on</strong> from vegetati<strong>on</strong>). The accuracy<br />
of correcti<strong>on</strong>s reached in the presented preprocessing procedure is c<strong>on</strong>sidered good and sufficient for<br />
further analysis.<br />
Nevertheless, error sources in radiometric correcti<strong>on</strong> can still occur and should be menti<strong>on</strong>ed. A<br />
critical point for atmospheric correcti<strong>on</strong> is the fact that surfaces – c<strong>on</strong>trary to the default assumpti<strong>on</strong> in<br />
ATCOR3 – usually exhibit n<strong>on</strong>-Lambertian reflectance characteristics as defined by their bidirecti<strong>on</strong>al<br />
reflectance distributi<strong>on</strong> functi<strong>on</strong> (BRDF). If the BRDF of a surface is known, the reflected outgoing<br />
spatial radiance for a given – directi<strong>on</strong>ally varying – incoming radiance can be calculated (KRAUS<br />
1989). RICHTER (1998) underlines that although accounting for the BRDF (which is opti<strong>on</strong>al in<br />
ATCOR3) can lead to improvements, difficulties may still remain. Although the isotropic- or<br />
Lambertian reflectance assumpti<strong>on</strong> is appropriate for sensors with a small scan angle (< ±15°), the<br />
BRDF plays a role especially in mountainous terrain with large slopes and an extreme range of<br />
incidence angles influencing the resulting reflectance. Here, the Lambertian assumpti<strong>on</strong> may cause<br />
over-correcti<strong>on</strong>s of faintly illuminated <str<strong>on</strong>g>areas</str<strong>on</strong>g>, where local solar zenith angles, β, range from 60° - 90°<br />
(RICHTER 2003). However, in these regi<strong>on</strong>s the BRDF is no l<strong>on</strong>ger symmetrical and BRDFs recorded<br />
from flat <str<strong>on</strong>g>areas</str<strong>on</strong>g> cannot be applied.<br />
SCHARDT (1990) underlines that BRDF effects are especially str<strong>on</strong>g in vegetati<strong>on</strong> types of different<br />
surface roughness depending <strong>on</strong> volume and leaf / stem geometry. However, these effects can not be<br />
accounted for in a large study area or in a transferable approach – otherwise ground truth and BRDF<br />
characteristics would have to be available for each scene. Also, most atmospheric / illuminati<strong>on</strong><br />
correcti<strong>on</strong> codes cannot account for BRDF effects since land surface classes are rarely known a priori<br />
(HOSTERT 2001).<br />
- 95 -
A further uncertainty is <strong>on</strong>ce again the quality of the DEM, which str<strong>on</strong>gly influences the quality of<br />
the illuminati<strong>on</strong> correcti<strong>on</strong>. This refers back to the statement at the very beginning of chapter 5. For a<br />
detailed analysis of the influence of DEM inaccuracies <strong>on</strong> atmospheric correcti<strong>on</strong> see RICHTER (1998).<br />
It becomes obvious that the derivati<strong>on</strong> and correcti<strong>on</strong> of atmospheric and topographic influences <str<strong>on</strong>g>based</str<strong>on</strong>g><br />
<strong>on</strong> a radiative transfer code and a radiometric correcti<strong>on</strong> algorithm is everything else but trivial and<br />
can <strong>on</strong>ly approximate c<strong>on</strong>diti<strong>on</strong>s during the satellite’s overpass. Nevertheless, it could be<br />
dem<strong>on</strong>strated above that for the data from varying times and locati<strong>on</strong>s used in this study, a combined<br />
radiometric correcti<strong>on</strong> leads to distinct improvements of the reflectance data of the scenes. However,<br />
manual adjustments to grant a quantitative comparability of time series of data was necessary.<br />
5.3 Radiometric Correcti<strong>on</strong> of the Thermal Band<br />
5.3.1. Principles and Methods Applied<br />
The atmospheric correcti<strong>on</strong> of the thermal band 6 of ETM+ or thermal bands of other sensors is an<br />
integral part of the overall atmospheric correcti<strong>on</strong>. However, the radiometric calibrati<strong>on</strong> is<br />
dem<strong>on</strong>strated separately to account for differences in physical principles and correcti<strong>on</strong> procedures<br />
compared to the reflective bands.<br />
All Landsat bands are acquired in either a low- or a high gain mode. Gain selecti<strong>on</strong> is defined in the<br />
gain strategy of the L<strong>on</strong>g Term Acquisiti<strong>on</strong> Plan (LTAP), depending <strong>on</strong> acquisiti<strong>on</strong> time and the<br />
dominating surface types in a scene (percentages of land, desert, ice/snow, water, sea ice etc.). These<br />
are known a priori <str<strong>on</strong>g>based</str<strong>on</strong>g> <strong>on</strong> maps. Except for very specific requests the user has no influence <strong>on</strong> the<br />
gain setting in the reflective modes. Nevertheless, LS-7 band 6 will always be recorded and delivered<br />
in the low- and the high gain mode extending the dynamic range of the data.<br />
Still, detector saturati<strong>on</strong> can occur if a surface has extremely high temperatures or a surface will<br />
thermally not be detected, if temperature decreases below a certain threshold. Table 5-5 lists the<br />
minimum and maximum temperatures in the low-gain and high-gain (in brackets) setting, indicating<br />
the lowest respectively highest pixel integrated temperature, which can be detected in a certain<br />
wavelength regi<strong>on</strong>. It should be noted that band 6 ranges from 10.4 µm to 12.5 µm <strong>on</strong>ly, to avoid<br />
effects of oz<strong>on</strong>e adsorpti<strong>on</strong>. Its broad bandpass of 2 µm combined with <strong>on</strong>ly 60 m ground resoluti<strong>on</strong><br />
enable a sufficient thermal energy yield.<br />
Table 5-5: Temperature of saturati<strong>on</strong> in the low- and high gain bands of Landsat-7 ETM+<br />
- 96 -<br />
channel µm regi<strong>on</strong>s Minimum temperature [° C] Maximum temperature [° C]<br />
1 0.45 - 0.51 1051 (1075) 1483 (1526)<br />
2 0.52 - 0.60 900 ( 922) 1301 (1340)<br />
3 0.63 - 0.69 755 ( 775) 1119 (1156)<br />
4 0.75 - 0.90 595 ( 613) 926 ( 961)<br />
5 1.55 - 1.75 206 ( 217) 417 ( 440)<br />
6 10.40 - 12.50 -33 (-134) 51 ( 77)<br />
7 2.09 - 2.35 92 ( 101) 258 ( 276)<br />
8 0.52 - 0.90 702 ( 721) 1056 (1092)<br />
(Source: Flynn et al. 2001,modified)
It can be seen that the mid Infrared band 5 can be used to detect thermal anomalies of very high<br />
temperatures leading to saturati<strong>on</strong> in band 6 (ZHANG, X. 1998). Even the near Infrared channel 4<br />
offers opti<strong>on</strong>s for the detecti<strong>on</strong> of extremely high temperatures. It has not been used in <str<strong>on</strong>g>coal</str<strong>on</strong>g> <str<strong>on</strong>g>fire</str<strong>on</strong>g><br />
research up to present, although successfully applied to lava-stream research, where higher<br />
temperatures are comm<strong>on</strong> (ROTHERY & FRANCIS 1990).<br />
However, in the 60 cm resoluti<strong>on</strong> panchromatic Quickbird data<br />
this phenomen<strong>on</strong> can also be detected. Figure 5-12 to the left<br />
shows a small part of <str<strong>on</strong>g>fire</str<strong>on</strong>g> #8 in the Wuda syncline with a very<br />
hot crack observed during all three field campaigns. Here<br />
temperatures up to 800°C were measured. The brightness of<br />
the pixels in band 4 results from these very high temperatures<br />
and not from an reflective expressi<strong>on</strong>.<br />
40 m<br />
Figure 5-12: very hot temperatures shift the radiati<strong>on</strong> maximum to<br />
the NIR resulting in bright pixel values not representing an optical<br />
phenomen<strong>on</strong>. Locati<strong>on</strong>: 639085E, 4374840N, UTM, Z48N<br />
Though the low- and high-gain opti<strong>on</strong>s offering a higher dynamic range are new compared to former<br />
Landsat-TM, the thermal bands of ETM+ are less suitable for high temperature studies. They saturate<br />
at 51° C and 77° C respectively, while TM band 6 saturated at around 90° C. It is also often stated that<br />
ETM+ still suffers from an antiquated 8bit dynamic range, limiting radiance steps to 256 instead of<br />
e.g. 4096 if a 12 bit system was used (FLYNN et al. 2001). Nevertheless, it is also important to<br />
underline that thermal c<strong>on</strong>trasts in 8-14 µm data are much better than in 3-5 µm data (SABINS 1996).<br />
8-14 µm data therefore have great advantages for terrain mapping.<br />
In c<strong>on</strong>trast to radiometric correcti<strong>on</strong>s of the reflective bands, for band 6 the physical principles of<br />
thermal absorpti<strong>on</strong> and -emissi<strong>on</strong> apply. Not the reflectance in percent has to be calculated, but the<br />
temperature of a surface in ° C or K. In the thermal <strong>spectral</strong> regi<strong>on</strong> (8-14µm) water vapor is the<br />
dominating disturbing parameter, while aerosol types play <strong>on</strong>ly a negligible role. These two mainly<br />
determine L P and τ.<br />
The radiance equati<strong>on</strong> in the thermal <strong>spectral</strong> regi<strong>on</strong> can therefore be expressed as:<br />
L Sat = L p + τ v × ε × L Surf (T) + τ v (1-ε) × F th /π (5.13)<br />
with:<br />
L Sat : at-sensor radiance<br />
L p : thermal path radiance<br />
τ v : ground to sensor atmospheric transmittance<br />
ε: surface emissivity<br />
T: surface temperature<br />
L Surf : blackbody radiance at the ground surface<br />
F th : thermal downwelling flux <strong>on</strong> the ground<br />
- 97 -
The sec<strong>on</strong>d and the third term are the emitted surface radiance reaching the sensor and atmospheric<br />
radiance reflected at the surface and attenuated <strong>on</strong> the way to the sensor respectively. τ v accounts for<br />
the influence of the c<strong>on</strong>stituents of the atmosphere. It is again a height dependent term derived from<br />
the MODTRAN database and the DEM. The emissivity is a surface inherent characteristic modifying<br />
the surface’s thermal signal (RICHTER 2003, FLYNN et al. 2001, SCHMUGGE et al. 1991).<br />
Planck’s law (see equati<strong>on</strong> 5.14) defines the radiati<strong>on</strong> released by a black body. Very few terrestrial<br />
surfaces act as black bodies but rather as gray bodies, which re-emit <strong>on</strong>ly a percentage of the radiance<br />
incident <strong>on</strong> them. The emissivity term is defined by Kirchhoff’s law (ε (λ) = 1- R (λ) ) where R (λ) is the<br />
<strong>spectral</strong> reflectance between 0 and 1. Emissivity varies depending <strong>on</strong> surface type and wavelength but<br />
is not temperature dependent (FLYNN et al. 2001). While materials with a high ε absorb large amounts<br />
of incidence energy and radiate large quantities of kinetic energy, materials with low ε absorb and<br />
radiate lower amounts of energy (SABINS 1996). Table 5-6 presents emissivities of comm<strong>on</strong> surfaces<br />
in the wavelength range of 8 to 14 µm.<br />
Table 5-6: Emissivity of different surfaces<br />
surface<br />
Leaves 0.97<br />
Sand 0.93<br />
Asphalt 0.96<br />
Water 0.99<br />
Granite 0.82<br />
Basalt 0.90<br />
Ice 0.98<br />
Wood 0.96<br />
Source: KRAUS 1989<br />
Emissivity at 8-14µm<br />
Correcting for emissivity effects can be d<strong>on</strong>e<br />
by classifying the optical channels of an<br />
image into different surface types and<br />
assigning an emissivity value to each land<br />
cover class. This approach is integrated in<br />
ATCOR-3, pre-classifying the image into<br />
three classes (water, vegetati<strong>on</strong>, bare<br />
ground). Therefore, the emissivity problem<br />
is at least approximated. As so<strong>on</strong> as ε is<br />
known for a pixel the LST can be retrieved<br />
(SCHMUGGE et al. 1991, PRAKASH & GUPTA<br />
1999, GANGOPADHYAY 2003).<br />
RICHTER (2003) states that as a rule of thumb a 0.01 emissivity error leads to a temperature error of<br />
0.5 K, while VIDAL (1991) assumes an error of 1 K. Therefore, a detailed emissivity correcti<strong>on</strong> would<br />
be recommended when aiming at the retrieval of very exact surface temperatures (BECKER 1987).<br />
Even if a-priory classificati<strong>on</strong> knowledge exists, this is difficult though, since the emissivity of a pixel<br />
depends <strong>on</strong> the compositi<strong>on</strong> of surfaces. In case of a mixed pixel mixed emissivities would have to be<br />
calculated. Approaches to derive the emissivity of surfaces were am<strong>on</strong>gst others developed and<br />
applied by BECKER (1987), NERRY et al. (1990), HOOK et al. (1992) and KEALY & HOOK (1993).<br />
They mainly applied data other than Landsat – namely TIMS- or NOAA-AVHRR data in combinati<strong>on</strong><br />
with extensive field measurements. CRACKNELL & XUE (1996) <str<strong>on</strong>g>based</str<strong>on</strong>g> their studies <strong>on</strong> Heat Capacity<br />
Mapping Missi<strong>on</strong> (HCMM) data. Furthermore, soil moisture or general moisture of a surface play an<br />
important role. However, the correcti<strong>on</strong> performed with ATCOR for three broad classes is sufficient<br />
when aiming at the calibrati<strong>on</strong> of the thermal channel as an input into signature extracti<strong>on</strong> algorithms.<br />
This applies also for the retrieval of thermal anomalies c<strong>on</strong>trasting to the background and neglecting<br />
absolute temperature determinati<strong>on</strong>.<br />
The relati<strong>on</strong>ship of the radiati<strong>on</strong> emitted by a blackbody (L Surf ) at a given wavelength (λ) and kinetic<br />
temperature (T) can be derived from Planck’s law:<br />
- 98 -
L Surf(λ, T) = (2hc² / λ 5 ) × (e hc/λkT –1) -1 (5.14)<br />
where L Surf is the emitted radiati<strong>on</strong> in W/m²/µm/sr at wavelength λ and temperature T in Kelvin, h is<br />
the Planck’s c<strong>on</strong>stant (6.63 × 10 -34 W × s²), c is the speed of light (2.998 × 10 8 m/s) and k is the<br />
Bolzmann’s c<strong>on</strong>stant (1.3805 ×10 -23 W × S × K -1 ) (FLYNN et al. 2001, KRAUS 1989). Resulting, the<br />
higher the temperature of a surface, the more radiati<strong>on</strong> it will emit at all wavelengths. To retrieve the<br />
brightness temperature of an object formula 5.14 can be rearranged to:<br />
T (λ, K) = (hc/λk) × (1n((2hc²)/λ 5 L Surf )+1)) -1 (5.15)<br />
Within ATCOR 3 surface temperature is retrieved <strong>on</strong> the basis of the visibility index (optical depth),<br />
water vapor, elevati<strong>on</strong> and scan angle modified for the viewing geometry. While a slope and aspect<br />
correcti<strong>on</strong> is applied for the reflective bands, it is not performed in the thermal regi<strong>on</strong>. However, it<br />
would be reas<strong>on</strong>able to correct for the fact that – until a certain sensor overpass time – pixels are<br />
illuminated unevenly l<strong>on</strong>g and unevenly str<strong>on</strong>g depending <strong>on</strong> their slope and aspect. In mountainous<br />
terrain uneven solar heating is the main source of c<strong>on</strong>fusi<strong>on</strong> for <str<strong>on</strong>g>coal</str<strong>on</strong>g> <str<strong>on</strong>g>fire</str<strong>on</strong>g> induced thermal anomalies in<br />
daytime data (ZHANG, X. 1998, WARNER & CHEN 2001).<br />
The calculati<strong>on</strong> of this time integrated energy gain of surfaces is extremely complicated though. This<br />
results from the fact that different surfaces have different thermal behaviors (TIPLER 2000), am<strong>on</strong>gst<br />
other physical parameters expressed by the thermal inertia. The thermal inertia, P (cal/cm²/sec -0.5 / °C),<br />
is defined as the resistance of a material against its heating for 1°C, depending <strong>on</strong> the specific warmth,<br />
c. This is the energy needed to rise the temperature of a material for 1°C (heat capacity C) per mass<br />
unit of the substance (m), the density of a material, p – the main determining factor – and the thermal<br />
c<strong>on</strong>ductivity, k, of an object.<br />
P = c × p × k<br />
(5.16)<br />
Variati<strong>on</strong>s of P result in changes of ΔT (KAHLE et al. 1976). ΔT is the difference between the<br />
maximum and minimum temperature occurring during a diurnal solar cycle. Low thermal inertias<br />
indicate low resistance to temperature changes resulting in a high ΔT. The opposite applies for<br />
surfaces with a high thermal inertia. With remote sensing, P can usually not be derived, since c, p and<br />
k can <strong>on</strong>ly be measured in the field. However, PRATT et al. (1977) as well as CRACKNELL & XUE<br />
(1996) introduce interesting approaches for the applicati<strong>on</strong> of thermal inertia models – even to derive<br />
P from space.<br />
Table 5-7: Thermal properties of geologic materials<br />
Material<br />
Thermal c<strong>on</strong>ductivity, K<br />
[cal/cm/sec/°C]<br />
Thermal capacity, C<br />
[cal/g/°C]<br />
Clay soil, moist 0.0030 0.35 0.042<br />
Sandst<strong>on</strong>e 0.0120 0.19 0.074<br />
Limest<strong>on</strong>e 0.0048 0.17 0.045<br />
Shale 0.0042 0.17 0.041<br />
Sandy soil 0.0014 0.24 0.024<br />
(Source: SABINS 1996)<br />
Thermal inertia, P<br />
[cal/cm²/sec -0.5 /°C]<br />
- 99 -
Furthermore most surfaces within a 60 × 60 m thermal pixel are mixed surfaces and cannot be<br />
described or even approximated with <strong>on</strong>e specific surface class. Additi<strong>on</strong>ally it is found that even the<br />
BRDF effect (which is actually a BEDF effect in the thermal wavelengths) is of relevance in the<br />
thermal regi<strong>on</strong>. The shape of the BRDF-curve (with respect to the viewing angle) is extremely<br />
dependent <strong>on</strong> the heterogenity within a pixel. Due to all these complex facts so far no sufficient model<br />
for the topographic thermal correcti<strong>on</strong> of unbalanced energy gain and release exists. An approach for<br />
the optical wavelength regi<strong>on</strong> has been developed by SCHAAB (2000) modeling the incidence radiance<br />
<strong>on</strong> a pixel of a certain positi<strong>on</strong> (x,y,z) between sunrise and sunset or between two defined times during<br />
the day respectively (additive approach). Nevertheless, the model – aiming at the retrieval of the<br />
amount of light received by a plant (PAR) – is valid for radiati<strong>on</strong> from the optical regi<strong>on</strong> <strong>on</strong>ly,<br />
assuming that light is reflected and not stored and later emitted like thermal radiati<strong>on</strong>. ZHANG, X.<br />
(1998) employed a basic approach modeling solar heating <str<strong>on</strong>g>based</str<strong>on</strong>g> <strong>on</strong> a DEM, the azimuth and elevati<strong>on</strong><br />
angle of the sun and the overpass time of Landsat-TM. However, the model was <strong>on</strong>ly developed as a<br />
case study for a small area and is not available nor transferable for mass throughput. The same applies<br />
to neural network <str<strong>on</strong>g>based</str<strong>on</strong>g> calibrati<strong>on</strong> studies applied in the Kelazha <str<strong>on</strong>g>coal</str<strong>on</strong>g> <str<strong>on</strong>g>fire</str<strong>on</strong>g> area, Xinjiang, China by<br />
DENG et al. (2001).<br />
5.3.2. Results and Validati<strong>on</strong><br />
The accuracy of the temperatures retrieved after sensor calibrati<strong>on</strong> and atmospheric correcti<strong>on</strong> can be<br />
assessed <str<strong>on</strong>g>based</str<strong>on</strong>g> <strong>on</strong> ground truth temperatures measured during the overflight of the satellite during the<br />
field campaign in 2002. Figure 5-13 shows a subset of an atmospherically corrected Landsat-7 nighttime<br />
scene within the <str<strong>on</strong>g>coal</str<strong>on</strong>g> mining area of Wuda. The different colors illustrate different temperatures<br />
ranging from 1 to 29°C.<br />
During the Landsat-7 nighttime overflight in 2002 the temperature of the Yellow River was measured<br />
as 14.2°C. During the daytime overflight in 2002 three geologic surfaces (<str<strong>on</strong>g>coal</str<strong>on</strong>g>, sandst<strong>on</strong>e, desert sand)<br />
were investigated regarding their thermal behavior over a larger area. Derived and integrated at ground<br />
temperatures vary for less than 1.2° C indicating a good result of the thermal atmospheric correcti<strong>on</strong>.<br />
14°C as<br />
measured<br />
during fieldwork<br />
Figure 5-13: Subset of the thermal nighttime scene (ETM+) from 28.09.2002; DNs transferred to temperature in<br />
°C and atmospherically corrected, center locati<strong>on</strong> (right subset): 645646E, 4376164N, UTM, Z48N.<br />
- 100 -
Additi<strong>on</strong>al temperature observati<strong>on</strong>s were not available, since temperatures – compared to <strong>spectral</strong><br />
signatures change very quickly with time. Unfortunately, in 2003 during the overpass time of Landsat<br />
the sky was cloud covered. During the 2004 field campaign Landsat ETM+ was already suffering from<br />
the err<strong>on</strong>eous scan mirror effect.<br />
The winter scene from 03.02.2003 presented in figure 5-14 is displayed as a false color composite<br />
image (left) and a temperature image (right). Temperatures range between -13° C (black) and 29 °C<br />
(white). The Yellow River is frozen in most parts and temperatures range between -2° C to 1 °C.<br />
Water temperature measurements from Wuhai in n<strong>on</strong> frozen <str<strong>on</strong>g>areas</str<strong>on</strong>g> c<strong>on</strong>firmed these temperature<br />
retrievals (0-1° C). Coal surfaces (15-22° C) and sun-exposed geologic surfaces are the warmest <str<strong>on</strong>g>areas</str<strong>on</strong>g>,<br />
while the deeply incised valleys <strong>on</strong> the eastern side of the Yellow River and the northwest exposed<br />
slopes in the northern Helan Mountains (-13 to 0° C) are the coldest regi<strong>on</strong>s. When radiometrically<br />
correcting winter scenes it has to be taken into account that negative temperature values may occur<br />
and therefore the data has to be handled as “signed” 8 bit instead of “unsigned” 8 bit data.<br />
Figure 5-14: Subset of the thermal daytime scene from 12.02.2003; left: false color infrared image, right: DNs<br />
transferred to temperature in ° C. Light: high temperatures, dark: lower temperatures (atmospherically<br />
corrected with ATCOR-3), center locati<strong>on</strong>: 650695E, 4373295N, UTM, Z48N.<br />
- 101 -
6. C<strong>on</strong>ceptual Approach of Coal Fire Area Demarcati<strong>on</strong><br />
The following chapter presents the c<strong>on</strong>ceptual approach developed <strong>on</strong> how to demarcate currently<br />
active and future <str<strong>on</strong>g>coal</str<strong>on</strong>g> <str<strong>on</strong>g>fire</str<strong>on</strong>g> <str<strong>on</strong>g>risk</str<strong>on</strong>g> <str<strong>on</strong>g>areas</str<strong>on</strong>g>. The c<strong>on</strong>ceptual approach of <str<strong>on</strong>g>coal</str<strong>on</strong>g> <str<strong>on</strong>g>fire</str<strong>on</strong>g> area demarcati<strong>on</strong> is <str<strong>on</strong>g>based</str<strong>on</strong>g><br />
<strong>on</strong> observati<strong>on</strong>s made during the field campaigns in 2002 and 2003.<br />
Coal <str<strong>on</strong>g>fire</str<strong>on</strong>g> occurrence is not related to certain elevati<strong>on</strong> z<strong>on</strong>es or aspect and slope regimes –<br />
informati<strong>on</strong>, which could be derived from a DEM. Coal <str<strong>on</strong>g>fire</str<strong>on</strong>g>s are also not related to certain geologic<br />
land cover types, since the <str<strong>on</strong>g>coal</str<strong>on</strong>g> seams can be interbedded in str<strong>on</strong>gly differing bedrock layers of very<br />
different <strong>spectral</strong> behavior. Coal <str<strong>on</strong>g>fire</str<strong>on</strong>g>s can occur in densely settled as well as uninhabited and remote<br />
<str<strong>on</strong>g>areas</str<strong>on</strong>g>. They are also not restricted to a certain climate. The roughest demarcati<strong>on</strong> base for <str<strong>on</strong>g>coal</str<strong>on</strong>g> <str<strong>on</strong>g>fire</str<strong>on</strong>g>s in<br />
China is a vector data set representing <str<strong>on</strong>g>coal</str<strong>on</strong>g> bearing regi<strong>on</strong>s al<strong>on</strong>g the borders of former sedimentary<br />
basins. These are <str<strong>on</strong>g>areas</str<strong>on</strong>g>, where <str<strong>on</strong>g>coal</str<strong>on</strong>g>ificati<strong>on</strong> occurred. However, <str<strong>on</strong>g>coal</str<strong>on</strong>g> <str<strong>on</strong>g>fire</str<strong>on</strong>g>s can still occur outside this<br />
limited area in case of <str<strong>on</strong>g>coal</str<strong>on</strong>g> waste pile <str<strong>on</strong>g>fire</str<strong>on</strong>g>s or <str<strong>on</strong>g>coal</str<strong>on</strong>g> storage pile <str<strong>on</strong>g>fire</str<strong>on</strong>g>s.<br />
6.1. Extracti<strong>on</strong> of Coal Surfaces<br />
At <str<strong>on</strong>g>risk</str<strong>on</strong>g> for <str<strong>on</strong>g>coal</str<strong>on</strong>g> <str<strong>on</strong>g>fire</str<strong>on</strong>g>s are aband<strong>on</strong>ed and active mines, <str<strong>on</strong>g>coal</str<strong>on</strong>g> seams, <str<strong>on</strong>g>coal</str<strong>on</strong>g> waste piles, <str<strong>on</strong>g>coal</str<strong>on</strong>g> storage piles,<br />
<str<strong>on</strong>g>coal</str<strong>on</strong>g> washery discard and <str<strong>on</strong>g>coal</str<strong>on</strong>g> with overlaying material like shale or mudst<strong>on</strong>e, which provides<br />
extensive fuel resources and speeds up the self heating. Coal <str<strong>on</strong>g>fire</str<strong>on</strong>g>s can therefore <strong>on</strong>ly occur in the<br />
vicinity of outcropping <str<strong>on</strong>g>coal</str<strong>on</strong>g> seams, <str<strong>on</strong>g>coal</str<strong>on</strong>g> waste- or <str<strong>on</strong>g>coal</str<strong>on</strong>g> storage piles and related <str<strong>on</strong>g>coal</str<strong>on</strong>g> accumulati<strong>on</strong>s<br />
(PRAKASH et al. 2001, KUENZER et al.2004a). Thus, the detecti<strong>on</strong> of the signature “<str<strong>on</strong>g>coal</str<strong>on</strong>g>” and<br />
knowledge of the distributi<strong>on</strong> of <str<strong>on</strong>g>coal</str<strong>on</strong>g> is crucial for m<strong>on</strong>itoring purposes in the regi<strong>on</strong> and the<br />
demarcati<strong>on</strong> of possible <str<strong>on</strong>g>coal</str<strong>on</strong>g> <str<strong>on</strong>g>fire</str<strong>on</strong>g>- and <str<strong>on</strong>g>coal</str<strong>on</strong>g> <str<strong>on</strong>g>fire</str<strong>on</strong>g> <str<strong>on</strong>g>risk</str<strong>on</strong>g> <str<strong>on</strong>g>areas</str<strong>on</strong>g>.<br />
buffer<br />
cracks<br />
+/- 150m<br />
Even though <str<strong>on</strong>g>coal</str<strong>on</strong>g> <str<strong>on</strong>g>fire</str<strong>on</strong>g>s occur underground<br />
and the surface thermal anomalies may not<br />
be located directly related to a <str<strong>on</strong>g>coal</str<strong>on</strong>g><br />
Surface (e.g. a sandst<strong>on</strong>e layer, which is<br />
overlaying a burning <str<strong>on</strong>g>coal</str<strong>on</strong>g> seam) <str<strong>on</strong>g>coal</str<strong>on</strong>g> <str<strong>on</strong>g>fire</str<strong>on</strong>g>s<br />
are restricted to a certain depth. In general,<br />
<str<strong>on</strong>g>coal</str<strong>on</strong>g> <str<strong>on</strong>g>fire</str<strong>on</strong>g>s in China occur no deeper than<br />
±150 m underground. Deeper <str<strong>on</strong>g>coal</str<strong>on</strong>g> <str<strong>on</strong>g>fire</str<strong>on</strong>g>s<br />
would not be sufficiently supplied with<br />
oxygen (JIA 2002, SUN 2003).<br />
Figure 6-1: C<strong>on</strong>cept of <str<strong>on</strong>g>demarcating</str<strong>on</strong>g> the area, in which <str<strong>on</strong>g>coal</str<strong>on</strong>g> <str<strong>on</strong>g>fire</str<strong>on</strong>g> related thermal anomalies with regard to the<br />
outcropping <str<strong>on</strong>g>coal</str<strong>on</strong>g> seam can be expected.<br />
Provided, that the dip angle of a <str<strong>on</strong>g>coal</str<strong>on</strong>g> seam is known, a z<strong>on</strong>e around the detected <str<strong>on</strong>g>coal</str<strong>on</strong>g> surface can be<br />
delineated, <str<strong>on</strong>g>demarcating</str<strong>on</strong>g> the area, where <str<strong>on</strong>g>coal</str<strong>on</strong>g> <str<strong>on</strong>g>fire</str<strong>on</strong>g>s can occur. The farthest horiz<strong>on</strong>tal distance of a<br />
possible underground <str<strong>on</strong>g>coal</str<strong>on</strong>g> <str<strong>on</strong>g>fire</str<strong>on</strong>g> (or thermal anomaly) relative to the locati<strong>on</strong>, where the corresp<strong>on</strong>ding<br />
<str<strong>on</strong>g>coal</str<strong>on</strong>g> seam crops out at the surface can therefore be calculated with:<br />
Dp max [m] = Bf [m] × tan γ da (6.1.)<br />
- 102 -
where Dp max is the maximal <str<strong>on</strong>g>coal</str<strong>on</strong>g> <str<strong>on</strong>g>fire</str<strong>on</strong>g> depth in meters (c<strong>on</strong>stant), Bf is the delineati<strong>on</strong> radius in meters<br />
and γ da is the dip angle of the seam. The tangent of a 3° dip angle is 0.05, that of 30° 0.57 and that of<br />
45° is 1. This would lead to a delineati<strong>on</strong> radius of 2862 meters, 259 meters and 150 meters<br />
respectively. Since dip angles shallower than 3° are extremely rare a buffer of 3.0 km will be broad<br />
enough to demarcate all <str<strong>on</strong>g>areas</str<strong>on</strong>g>, where underground <str<strong>on</strong>g>coal</str<strong>on</strong>g> <str<strong>on</strong>g>fire</str<strong>on</strong>g>s can possibly occur and lead to thermal<br />
surface expressi<strong>on</strong>s.<br />
If a <str<strong>on</strong>g>coal</str<strong>on</strong>g> seam is dipping with e.g. 30° westwards into the ground a <str<strong>on</strong>g>coal</str<strong>on</strong>g> <str<strong>on</strong>g>fire</str<strong>on</strong>g> related thermal anomaly<br />
<strong>on</strong> the surface should <strong>on</strong>ly occur directly above or west of the outcropping <str<strong>on</strong>g>coal</str<strong>on</strong>g> seam. Therefore, the<br />
delineati<strong>on</strong> buffer around a detected <str<strong>on</strong>g>coal</str<strong>on</strong>g> seam should <strong>on</strong>ly extend in the directi<strong>on</strong> of dip. However,<br />
two circumstances are hampering this approach. Firstly, a remote sensing image <strong>on</strong>ly shows the <str<strong>on</strong>g>coal</str<strong>on</strong>g><br />
<strong>on</strong> the surface. Even if a perfectly linear <str<strong>on</strong>g>coal</str<strong>on</strong>g> seam is cropping out no informati<strong>on</strong> of the strike<br />
directi<strong>on</strong> and dip angle can be retrieved. Many <str<strong>on</strong>g>coal</str<strong>on</strong>g> surfaces are furthermore not outcropping seams<br />
but anthropogenic moved material in the vicinity of the seams. Vector data sets c<strong>on</strong>taining strike and<br />
dip angle do not even exist for the Wuda or Ruqigou area, nor for the rest of China. Sec<strong>on</strong>dly, <str<strong>on</strong>g>coal</str<strong>on</strong>g> <str<strong>on</strong>g>fire</str<strong>on</strong>g><br />
related thermal anomalies can also occur with no <str<strong>on</strong>g>coal</str<strong>on</strong>g> present below the thermal anomaly. PRAKASH et<br />
al. (1999) and ZHANG, J. (2004) dem<strong>on</strong>strated, that the thermal pattern in thermal remote sensing data<br />
acquired over <str<strong>on</strong>g>coal</str<strong>on</strong>g> <str<strong>on</strong>g>fire</str<strong>on</strong>g> <str<strong>on</strong>g>areas</str<strong>on</strong>g> actually is the pattern of cracks. The str<strong>on</strong>gly heated exhaust gasses travel<br />
through cracks and vents in the bedrock and can also exhaust in opposite dip directi<strong>on</strong>.<br />
For a transferable large scale approach it is necessary to develop a method to detect <str<strong>on</strong>g>coal</str<strong>on</strong>g> surfaces in<br />
satellite imagery automatically, without manual surface classificati<strong>on</strong> procedures like training sample<br />
selecti<strong>on</strong> being needed.<br />
6.2. Analysis of Vegetati<strong>on</strong> Density<br />
Furthermore, during the field campaigns in 2002, 2003 and 2004 it could be observed, that<br />
underground <str<strong>on</strong>g>coal</str<strong>on</strong>g> <str<strong>on</strong>g>fire</str<strong>on</strong>g>s do have an influence <strong>on</strong> the vegetati<strong>on</strong> occurring <strong>on</strong> the surface above the <str<strong>on</strong>g>fire</str<strong>on</strong>g>s.<br />
Elevated temperatures and especially the highly toxic fumes resulting from the <str<strong>on</strong>g>coal</str<strong>on</strong>g> <str<strong>on</strong>g>fire</str<strong>on</strong>g>s and exhaling<br />
through fractures and cracks lead to the deteriorati<strong>on</strong> of plants.<br />
To quantify these observati<strong>on</strong>s vegetati<strong>on</strong> density was mapped in the field in 2002 and 2003 above<br />
three <str<strong>on</strong>g>coal</str<strong>on</strong>g> <str<strong>on</strong>g>fire</str<strong>on</strong>g>s (#6, #8, #12) and their unaffected surroundings within the Wuda syncline. This<br />
mapping was part of the mixture grid mapping presented in chapter 4. The assessment of vegetati<strong>on</strong><br />
density was undertaken in three grids located above the <str<strong>on</strong>g>fire</str<strong>on</strong>g>s with 50 meter cells extending for several<br />
hundreds of meters in North-South- and East-West directi<strong>on</strong>, respectively. Furthermore, four grids<br />
outside the <str<strong>on</strong>g>coal</str<strong>on</strong>g> <str<strong>on</strong>g>fire</str<strong>on</strong>g> <str<strong>on</strong>g>areas</str<strong>on</strong>g> were mapped. For each grid cell the vegetati<strong>on</strong> density was estimated by<br />
three pers<strong>on</strong>s individually, quantifying the percentage of each 50 meter raster cell covered with<br />
vegetati<strong>on</strong>. The three different estimates did not vary substantially. If estimates differed for more than<br />
5 % an average was taken as the vegetati<strong>on</strong> density percentage for the specific grid cell. Furthermore 5<br />
randomly located 200 m line intersects were mapped in each of the three grids (15 intersects) and<br />
vegetati<strong>on</strong> density was estimated in 10 m × 10 m subplots to compare them to the broader raster<br />
estimati<strong>on</strong>s. In additi<strong>on</strong>, the vegetati<strong>on</strong> density grid estimates of late September 2003 were compared<br />
to the vegetati<strong>on</strong> density pattern observable in the early October 2003 high resoluti<strong>on</strong> Quickbird data<br />
(60 cm panchromatic channel), where each single shrub can be identified. This data showed a good<br />
visual coincidence with field measurements. However, it is known, that estimati<strong>on</strong>s – be it from high<br />
- 103 -
13 cm<br />
13 cm<br />
a<br />
b<br />
Possible former <str<strong>on</strong>g>fire</str<strong>on</strong>g><br />
fr<strong>on</strong>t<br />
Spreading directi<strong>on</strong><br />
of the <str<strong>on</strong>g>coal</str<strong>on</strong>g> <str<strong>on</strong>g>fire</str<strong>on</strong>g><br />
1 m<br />
c<br />
d<br />
Figure 6-2, a-d: a, b: dead vegetati<strong>on</strong> above <str<strong>on</strong>g>coal</str<strong>on</strong>g> <str<strong>on</strong>g>fire</str<strong>on</strong>g> # 8, Wuda syncline. c: heavy smoke, vegetati<strong>on</strong> density<br />
0%, d: slowly degrading vegetati<strong>on</strong> al<strong>on</strong>g a new <str<strong>on</strong>g>fire</str<strong>on</strong>g> fr<strong>on</strong>t. Photos: C. Kuenzer, 09/2003<br />
spatial resoluti<strong>on</strong> remote sensing data or from field mappings – will always c<strong>on</strong>tain analyst influence<br />
and may to some degree c<strong>on</strong>tain estimati<strong>on</strong> error (SMITH et al. 1990).<br />
For reas<strong>on</strong>s of better visualizati<strong>on</strong> of natural phenomena, which are more suitably represented in a<br />
c<strong>on</strong>tinuous map with “floating” boundaries than in a strict raster, the estimated vegetati<strong>on</strong> density<br />
values were assigned to the center of the raster cells and an ordinary kriging interpolati<strong>on</strong> was applied.<br />
Thus, kriged vegetati<strong>on</strong> density maps were generated for the three <str<strong>on</strong>g>fire</str<strong>on</strong>g> <str<strong>on</strong>g>areas</str<strong>on</strong>g> and their surrounding as<br />
presented in figure 6-3. The locati<strong>on</strong>s of thermally anomalous <str<strong>on</strong>g>areas</str<strong>on</strong>g> within the <strong>test</strong> grids mapped were<br />
located by GPS and are superimposed <strong>on</strong> the maps. They represent deep cracks or vents, which show<br />
temperatures str<strong>on</strong>gly differing from the background and exhalating toxic fumes.<br />
Since it was announced by the <str<strong>on</strong>g>fire</str<strong>on</strong>g> fighting team and mining engineers in Wuda in September 2003,<br />
that <str<strong>on</strong>g>fire</str<strong>on</strong>g> # 8 had extended to the North between September 2002 and September 2003, the vegetati<strong>on</strong><br />
grid above <str<strong>on</strong>g>fire</str<strong>on</strong>g> # 8 was remapped in September 2003. Already during the mapping process it could be<br />
visually observed, that the area with dead and degraded vegetati<strong>on</strong> had also extended to the North. No<br />
active <str<strong>on</strong>g>fire</str<strong>on</strong>g> z<strong>on</strong>e of all 16 <str<strong>on</strong>g>fire</str<strong>on</strong>g>s in the Wuda <str<strong>on</strong>g>coal</str<strong>on</strong>g> mining syncline showed any substantial vegetati<strong>on</strong><br />
density <strong>on</strong> the bedrock surface of the underground <str<strong>on</strong>g>fire</str<strong>on</strong>g>s. The absence of vegetati<strong>on</strong> is of course not an<br />
indicator for a <str<strong>on</strong>g>coal</str<strong>on</strong>g> <str<strong>on</strong>g>fire</str<strong>on</strong>g>. Low vegetati<strong>on</strong> densities occur as well in settled <str<strong>on</strong>g>areas</str<strong>on</strong>g>, <strong>on</strong> bare bedrock or in<br />
deserts. However, dense vegetati<strong>on</strong> will not be found above active <str<strong>on</strong>g>coal</str<strong>on</strong>g> <str<strong>on</strong>g>fire</str<strong>on</strong>g>s.<br />
- 104 -
SuhaiTu<br />
Wuhushan<br />
36-40 %<br />
31-35 %<br />
26-30 %<br />
21-25 %<br />
16-20 %<br />
11-15 %<br />
6-10 %<br />
N<br />
1-5 %<br />
0 %<br />
Wuhushan south<br />
N<br />
N<br />
Figure 6-3: Kriged vegetati<strong>on</strong> density maps over the three<br />
<str<strong>on</strong>g>coal</str<strong>on</strong>g> <str<strong>on</strong>g>fire</str<strong>on</strong>g>s #6, #8 and #12 as mapped in 2002. From dark<br />
green to light green: decreasing vegetati<strong>on</strong> density. Reddish<br />
triangles: locati<strong>on</strong>s of cracks with very high temperatures and<br />
exhaling toxic gasses.600<br />
6.3. Pyrometamorphic Rocks<br />
As presented in chapter 2 <str<strong>on</strong>g>coal</str<strong>on</strong>g> <str<strong>on</strong>g>fire</str<strong>on</strong>g>s lead to the generati<strong>on</strong> of fumarolic minerals and pyrometamorphic<br />
rocks. Fumarolic minerals are newly generated minerals through <str<strong>on</strong>g>coal</str<strong>on</strong>g> <str<strong>on</strong>g>fire</str<strong>on</strong>g> influence. Minerals from the<br />
original bedrock layers are dissociated by the heat and transfer al<strong>on</strong>g the cracks to the surface, where<br />
they re-crystallize around the crack. Compared to burned rocks fumarolic minerals occur in such small<br />
spatial expressi<strong>on</strong>s that they can not be detected in remote sensing data.<br />
Pyrometamorphic rocks are rocks metamorphosed at different stages through the heat of the nearby<br />
<str<strong>on</strong>g>coal</str<strong>on</strong>g> <str<strong>on</strong>g>fire</str<strong>on</strong>g>. In literature these rocks are classified into three categories. Firstly baked rocks are described,<br />
which have been heated to a relatively low temperature of 300-800°C and which still keep their<br />
original texture but show changes in color due to dehydrati<strong>on</strong> and oxidati<strong>on</strong>. Sec<strong>on</strong>dly, porcelanitelike<br />
rocks exist, which have been heated between 600-1400° C and therefore have hardened. They<br />
show a ceramic texture and color has been changed greatly. Thirdly, molten rocks are generated when<br />
- 105 -
the <str<strong>on</strong>g>coal</str<strong>on</strong>g> <str<strong>on</strong>g>fire</str<strong>on</strong>g> adjacent bedrock is heated to 1500-2000° C. Molten rocks comm<strong>on</strong>ly occur very close to<br />
the burning centre of the <str<strong>on</strong>g>coal</str<strong>on</strong>g> seam. The granulated minerals in the rocks melt and form a lava-like<br />
black rock (ZHANG, J. 1996). Pyrometamorphic rocks found in the field are mainly of red or yellowish<br />
color and can visually clearly be distinguished from n<strong>on</strong> affected samples.<br />
Large <str<strong>on</strong>g>areas</str<strong>on</strong>g> of burned rock in the Ruqigou / Gulaben area are clearly visible in multi<strong>spectral</strong> Quickbird<br />
data, acquired <strong>on</strong> September 22 nd 2003. These surfaces clearly depict the present- or former occurrence<br />
of <str<strong>on</strong>g>coal</str<strong>on</strong>g> <str<strong>on</strong>g>fire</str<strong>on</strong>g>s. It needs to be stated though that burned rock can be decades old and the <str<strong>on</strong>g>coal</str<strong>on</strong>g> <str<strong>on</strong>g>fire</str<strong>on</strong>g> may not<br />
burning anymore. However, a remote sensing <str<strong>on</strong>g>based</str<strong>on</strong>g> detecti<strong>on</strong> of burned rock from Landsat or Aster<br />
data can support differentiati<strong>on</strong> within the delineated <str<strong>on</strong>g>coal</str<strong>on</strong>g> <str<strong>on</strong>g>fire</str<strong>on</strong>g> <str<strong>on</strong>g>risk</str<strong>on</strong>g> <str<strong>on</strong>g>areas</str<strong>on</strong>g>. ROSEMA et al. (1999)<br />
investigated possible methods to find the most suitable satellite bands for classificati<strong>on</strong> of rock into<br />
burnt and n<strong>on</strong>-burned species using band ratioing and supervised and unsupervised classificati<strong>on</strong>.<br />
They questi<strong>on</strong> the large scale detectability in 30 m Landsat-TM data, since the features dividing<br />
burned and n<strong>on</strong>-burned rock are not deterministic. A large overlap exists, when plotting spectra of<br />
burned and n<strong>on</strong> burned rock at low <strong>spectral</strong> resoluti<strong>on</strong> against each other. Furthermore, the<br />
stratigraphy in the Ruqigou area investigated c<strong>on</strong>sists of banded shale and sandst<strong>on</strong>e layers with a<br />
thickness of <strong>on</strong>ly a few meters, hampering the detecti<strong>on</strong> of burned rock in a 30 m pixel. The area of<br />
burned rock might <strong>on</strong>ly cover a subpixel fracti<strong>on</strong>. Nevertheless, it shall be investigated, if burned<br />
rocks can be extracted from strictly calibrated data with the help of extensive ground truth and<br />
representative field- and laboratory spectra.<br />
Figure 6-4: Pyrometamorphic rocks exposed to the surface in Baijigou <str<strong>on</strong>g>coal</str<strong>on</strong>g> mining area. Photos: C. Kuenzer,<br />
September 2003, Locati<strong>on</strong>: 595837E, 4322295N<br />
6.4. Automati<strong>on</strong> of the Demarcati<strong>on</strong> Scheme<br />
In brief, <str<strong>on</strong>g>coal</str<strong>on</strong>g> <str<strong>on</strong>g>fire</str<strong>on</strong>g> area demarcati<strong>on</strong> can be pursued with the following steps. Firstly, <str<strong>on</strong>g>coal</str<strong>on</strong>g> has to be<br />
automatically extracted from remote sensing satellite data. Sec<strong>on</strong>dly, an area around the extracted <str<strong>on</strong>g>coal</str<strong>on</strong>g><br />
surfaces is delineated automatically <str<strong>on</strong>g>based</str<strong>on</strong>g> <strong>on</strong> a certain radius. The radius is defined by the average dip<br />
angle of the <str<strong>on</strong>g>coal</str<strong>on</strong>g> seams in the area or a large enough general distance is chosen. Thirdly, within the<br />
demarcated area, where <str<strong>on</strong>g>coal</str<strong>on</strong>g> <str<strong>on</strong>g>fire</str<strong>on</strong>g> related thermal anomalies are likely to occur, densely vegetated <str<strong>on</strong>g>areas</str<strong>on</strong>g><br />
can be excluded. This includes the exclusi<strong>on</strong> of forests, dense agricultural <str<strong>on</strong>g>areas</str<strong>on</strong>g> or natural vegetati<strong>on</strong>,<br />
which would not exist, if a <str<strong>on</strong>g>coal</str<strong>on</strong>g> <str<strong>on</strong>g>fire</str<strong>on</strong>g> was burning underneath. Therefore, <str<strong>on</strong>g>areas</str<strong>on</strong>g> of dense vegetati<strong>on</strong><br />
- 106 -
have to be extracted automatically from remote sensing data. In a fourth step, pyrometamorphic rock<br />
should be detected in the multi<strong>spectral</strong> data. Areas of pyrometamorphic rock occurrence give an<br />
indicati<strong>on</strong> that a <str<strong>on</strong>g>coal</str<strong>on</strong>g> <str<strong>on</strong>g>fire</str<strong>on</strong>g> is existing or has been burning in former times. The regi<strong>on</strong>s can be<br />
highlighted within the demarcated <str<strong>on</strong>g>coal</str<strong>on</strong>g> <str<strong>on</strong>g>fire</str<strong>on</strong>g> (<str<strong>on</strong>g>risk</str<strong>on</strong>g>) <str<strong>on</strong>g>areas</str<strong>on</strong>g>.<br />
CIHLAR et al. (1998) state, that visual image interpretati<strong>on</strong> and classificati<strong>on</strong> to date is still the most<br />
successful classificati<strong>on</strong> methodology, since the human eye and brain efficiently incorporate color,<br />
shape, texture, pattern, shadows, height and other informati<strong>on</strong> simultaneously, even if the full <strong>spectral</strong><br />
feature space cannot be recognized. Manual supervised classificati<strong>on</strong>s benefit from this fact through a<br />
lot of manual fine tuning processes, which are applied to the data.<br />
However, the goal of this study is to provide an algorithm for <str<strong>on</strong>g>coal</str<strong>on</strong>g> <str<strong>on</strong>g>fire</str<strong>on</strong>g> area demarcati<strong>on</strong>, which is<br />
applicable <strong>on</strong> a large spatial scale, can be applied to multi-sensor remote sensing data and minimizes<br />
analyst interacti<strong>on</strong>. Coal surfaces, <str<strong>on</strong>g>areas</str<strong>on</strong>g> with high vegetati<strong>on</strong> density as well as pixels c<strong>on</strong>taining<br />
pyrometamorphic rock need to be extracted from remote sensing data without analyst interacti<strong>on</strong>.<br />
Therefore, from the classificati<strong>on</strong> and feature extracti<strong>on</strong> methods presented in chapter 3 a combinati<strong>on</strong><br />
of existing approaches needs to be selected, which can meet this demand.<br />
Great advantages of automated data processing and analyses include the following aspects:<br />
• Standardized producti<strong>on</strong> and products<br />
• Objectiveness of results<br />
• Mass throughput, large <str<strong>on</strong>g>areas</str<strong>on</strong>g> processable<br />
• Operati<strong>on</strong>al data interpretati<strong>on</strong><br />
• Increased complexity of products (the time savings due to automati<strong>on</strong> gives room for further<br />
research in other fields)<br />
• Low cost of producti<strong>on</strong><br />
For the two approaches presented in this thesis, it was decided not to change the dimensi<strong>on</strong>ality of the<br />
multi<strong>spectral</strong> data space. All possible input channels for feature extracti<strong>on</strong> except the – if present –<br />
panchromatic channels as in ETM+ or Aster imagery were kept. In case of Landat-7 these are 7 bands<br />
(1, 2, 3, 4, 5, 7, 6), where the latter is the thermal channel, additi<strong>on</strong>ally useful for surface<br />
discriminati<strong>on</strong>. Feature space reducti<strong>on</strong> produces synthetic DNs, which can <strong>on</strong>ly with difficulty be<br />
related to their actual surface features as in the case of PCA or MNF. Since <strong>on</strong>e approach aimed at is<br />
to use the field and laboratory spectra of <str<strong>on</strong>g>coal</str<strong>on</strong>g>, vegetati<strong>on</strong> and burned rock for a <strong>spectral</strong> comparis<strong>on</strong>,<br />
synthetic features would not be helpful. Therefore, the approaches of PCA or MNF rotati<strong>on</strong>s were<br />
excluded from possible transformati<strong>on</strong> opti<strong>on</strong>s for the automated mapping of surfaces. Although in<br />
many cases the redundancies in multi<strong>spectral</strong> data of the visible channels are a disturbing factor and<br />
two of the three visible bands are often deleted, these three to four channels are of higher relevance<br />
here due to the excepti<strong>on</strong>al albedo of <str<strong>on</strong>g>coal</str<strong>on</strong>g> in this EM range. Here the reflectance values for blue, green<br />
and red are expected to be nearly identical. Furthermore these channels are of relevance for the<br />
exclusi<strong>on</strong> of shadowed <str<strong>on</strong>g>areas</str<strong>on</strong>g>.<br />
The input data into the two algorithms developed is therefore a geometrically, radiometrically as well<br />
as atmospherically corrected reflectance image. An antecedent orthorectificati<strong>on</strong> is preferred for an<br />
optimum radiometric result in <str<strong>on</strong>g>areas</str<strong>on</strong>g> with str<strong>on</strong>g relief. A high-quality illuminati<strong>on</strong> correcti<strong>on</strong> as<br />
- 107 -
presented in chapter 5 can <strong>on</strong>ly be applied if the spatial match between the satellite image and a DEM<br />
is guaranteed.<br />
A challenge in the extracti<strong>on</strong> of the surface class “<str<strong>on</strong>g>coal</str<strong>on</strong>g>” is the fact that this surface usually occupies<br />
<strong>on</strong>ly an extremely small fracti<strong>on</strong> of the image and its multidimensi<strong>on</strong>al feature space. The same<br />
applies for signatures of pyrometamorphic rock, which is expected to occur <strong>on</strong>ly in a few pixels<br />
spanning far less than 0.00001% of the scene. An unsupervised approach could therefore not be<br />
chosen. Since UCA strive for an overall optimum spanning of the entire data set specific details that<br />
are relevant, are missed out easily. This has already been discussed in detail in chapter 3. Furthermore,<br />
UCA would classify the image into<br />
several classes without the ability to<br />
specify the classes “<str<strong>on</strong>g>coal</str<strong>on</strong>g>”, “vegetati<strong>on</strong>”<br />
or “burned rock” without user<br />
interacti<strong>on</strong>. Unsupervised classes are<br />
also too inaccurate due to the random<br />
locati<strong>on</strong> of cluster centers within the<br />
initial cluster generati<strong>on</strong>. In pre-studies<br />
UCA were applied to classify the image<br />
data resulting in classificati<strong>on</strong> accuracies<br />
well below 40% with <str<strong>on</strong>g>coal</str<strong>on</strong>g>, shadow and<br />
water classes often being mixed and<br />
c<strong>on</strong>fused. This is shown in figure 6-5.<br />
An unsupervised approach is therefore<br />
not employed for the feature extracti<strong>on</strong><br />
aimed at here.<br />
Figure 6-5: Unsupervised classificati<strong>on</strong> into 20 classes, the first (“darkest”) class is colored in orange <strong>on</strong><br />
superimposed <strong>on</strong> the grey scale classificati<strong>on</strong> result. Coal, shadow, deep water, water of the Yellow River and<br />
even dense agricultural vegetati<strong>on</strong> are all assigned to <strong>on</strong>e class. Center coordinate: 650705E, 4373287N<br />
Standard supervised approaches all need the input of training data, which is often not available or – if<br />
ground truth exists - has to be generated in a tedious, time-c<strong>on</strong>suming, interactive process. Therefore,<br />
also comm<strong>on</strong> supervised classificati<strong>on</strong> like training <str<strong>on</strong>g>based</str<strong>on</strong>g> maximum likelihood algorithms do not<br />
fulfill the requirements for an automated algorithm. Very detailed supervised classificati<strong>on</strong>s of Wuda<br />
and Ruqigou were performed in a change detecti<strong>on</strong> study of Wuda and Ruqigou between the time span<br />
of 1987 until 2002. The maximum likelihood <str<strong>on</strong>g>based</str<strong>on</strong>g> classificati<strong>on</strong> was accompanied by additi<strong>on</strong>al<br />
decisi<strong>on</strong> rules derived from a DEM and a priory knowledge. 15 classes were extracted in the Ruqigou<br />
subset, while 25 classes could be differentiated for the Wuda area. Overall classificati<strong>on</strong> accuracies for<br />
the 2002 scenes exceeded 85% in both cases. Details <strong>on</strong> this supervised change detecti<strong>on</strong> study can be<br />
found in KUENZER et al. 2004a and KUENZER et al. 2004b.<br />
Object oriented analysis is still a highly interactive procedure with many decisi<strong>on</strong>s to be taken. This<br />
makes results hardly reproducible. Furthermore, for most <str<strong>on</strong>g>areas</str<strong>on</strong>g>, where the algorithm shall be applied,<br />
no knowledge base exists or can be generated. To generate a complex system of fuzzy knowledge<br />
<str<strong>on</strong>g>based</str<strong>on</strong>g> classificati<strong>on</strong> a large amount of additi<strong>on</strong>al informati<strong>on</strong> is necessary. For the surfaces and regi<strong>on</strong>s<br />
investigated here class membership functi<strong>on</strong>s are hard to obtain. The surface “<str<strong>on</strong>g>coal</str<strong>on</strong>g>” is <strong>on</strong>ly weakly<br />
- 108 -
defined through parameters other than the <strong>spectral</strong> signal. From the field campaigns it is known that<br />
<str<strong>on</strong>g>coal</str<strong>on</strong>g> can occur in the neighborhood to every pixel (all geologic surfaces, settlement, all vegetati<strong>on</strong><br />
types, <strong>on</strong> the banks of rivers or lakes, etc.) and is – due to its natural occurrence in outcropping <str<strong>on</strong>g>coal</str<strong>on</strong>g><br />
seams – also not limited to certain elevati<strong>on</strong> or slope and aspect regimes. Furthermore the texture of<br />
<str<strong>on</strong>g>coal</str<strong>on</strong>g> surfaces – the class inherent variance of reflectances – is not unique. Coal can be mixed with<br />
other surfaces, may c<strong>on</strong>tain impurities, is accumulated in different layering densities and covers <str<strong>on</strong>g>areas</str<strong>on</strong>g><br />
of different size.<br />
Neural Network classifiers are due to their “black-box” character resulting from the processes within<br />
the internal neur<strong>on</strong>e layers often hard to understand. Repetitive- or learning processes of the network<br />
are often highly complex. The drawbacks of ANNs are presented in chapter 3. Furthermore, no<br />
experiences with ANNs were made before; therefore the technique of neural network programming<br />
was not c<strong>on</strong>sidered any further.<br />
Linear <strong>spectral</strong> unmixing to a set of endmembers also hampers automatic surface extracti<strong>on</strong> for<br />
datasets covering several different regi<strong>on</strong>s. The algorithm aimed at here shall focuses <strong>on</strong> the extracti<strong>on</strong><br />
of the surface <str<strong>on</strong>g>coal</str<strong>on</strong>g>, dense vegetati<strong>on</strong> and burned rock independent of other surface comp<strong>on</strong>ents.<br />
Especially pyrometamorphic rock is not assumed to be a typical endmember. A <strong>spectral</strong> unmixing<br />
approach would require the availability of typical endmember spectra for larger <str<strong>on</strong>g>areas</str<strong>on</strong>g> of China<br />
including Ruqigou / Gulaben, the transfer <strong>test</strong> site in Baotou and the transfer regi<strong>on</strong>s in India and<br />
Australia. Especially the spatial transferability of the algorithm would not be guaranteed using SMA,<br />
since for each scene a <strong>spectral</strong> mixture model would have to be defined. The assumpti<strong>on</strong> that a large<br />
part of the <strong>spectral</strong> variance within a scene can be computed with <strong>on</strong>ly a few mixtures is – in many<br />
cases – not appropriate (HOSTERT 2001).<br />
Spectral feature fitting (SFF) and binary encoding are techniques <strong>on</strong>ly applicable to hyper<strong>spectral</strong> data.<br />
Such data is not used within the course of this thesis. Therefore these approaches are not given further<br />
c<strong>on</strong>siderati<strong>on</strong>. However, to apply automated surface extracti<strong>on</strong> to hyper<strong>spectral</strong> images, SFF is an<br />
approach, which allows for automati<strong>on</strong> and could be integrated in an automated algorithm.<br />
The above menti<strong>on</strong>ed approaches such as UCA, SCA, OOC, or ANN, can produce highly accurate<br />
classificati<strong>on</strong> results when interactive data handling is not a limitati<strong>on</strong>. However, for a fast, automated<br />
and not to complex algorithm, which shall firstly fulfill the goal to define <str<strong>on</strong>g>coal</str<strong>on</strong>g> <str<strong>on</strong>g>fire</str<strong>on</strong>g> <str<strong>on</strong>g>risk</str<strong>on</strong>g> <str<strong>on</strong>g>areas</str<strong>on</strong>g>, sec<strong>on</strong>dly<br />
the needs of the project (mass data throughput and transferability) and thirdly grant the compatibility<br />
with the thermal algorithm developed by ZHANG, J. (2004), these methods seem not sufficient.<br />
In pre-studies and <strong>test</strong>s with numerous scenes two approaches were developed, which differ clearly in<br />
their theoretic background to extract a <strong>spectral</strong> signature. Therefore the two approaches will be<br />
presented in the separate chapters 8 and 9. Beforehand a detailed signature analysis of the surfaces<br />
existing in the <str<strong>on</strong>g>areas</str<strong>on</strong>g> (in short) and the surfaces of interest (in detail) is given in chapter 7.<br />
- 109 -
7. Signature Analysis<br />
In this chapter the general chemical and physical influences <strong>on</strong> surface reflectance spectra are briefly<br />
introduced (7.1.) before the spectra of <str<strong>on</strong>g>coal</str<strong>on</strong>g> (7.2.), vegetati<strong>on</strong> (7.3.), pyrometamorphic rocks (7.4.) and<br />
the other surfaces (7.5.) sampled in the study <str<strong>on</strong>g>areas</str<strong>on</strong>g> and measured under field and laboratory c<strong>on</strong>diti<strong>on</strong>s<br />
are analyzed. Here, the focus lies <strong>on</strong> the <strong>spectral</strong> difference of the surfaces of interest as defined in<br />
chapter 6. Finally, the temporal and spatial variability of <strong>spectral</strong> signatures as occurring in the<br />
numerous Landsat scenes investigated is presented in 7.6.<br />
7.1. Fundamentals of Spectral Surface Properties<br />
When phot<strong>on</strong>s are incident <strong>on</strong> a surface they interact with the electr<strong>on</strong>s of the material. The absorpti<strong>on</strong><br />
of a phot<strong>on</strong> of a specific energy may cause the transiti<strong>on</strong> of an electr<strong>on</strong> to a higher state resulting in<br />
absorpti<strong>on</strong> features within the reflectance spectra. The absorpti<strong>on</strong> of electromagnetic waves by an<br />
object depends <strong>on</strong> the frequency of the waves and the energy level of the object (HUNT et al. 1971).<br />
Absorpti<strong>on</strong> features can be produced by electr<strong>on</strong>ic and vibrati<strong>on</strong>al processes. Electr<strong>on</strong> transiti<strong>on</strong> can<br />
occur as molecular orbital transiti<strong>on</strong>s, charge transfers, crystal field absorpti<strong>on</strong>s, color centers and<br />
c<strong>on</strong>ducti<strong>on</strong> bands while vibrati<strong>on</strong>al transiti<strong>on</strong>s occur as fundamental bands, overt<strong>on</strong>es and combinati<strong>on</strong><br />
t<strong>on</strong>es, effects of phase changes and isotope effects (GAFFEY et al. 1993). Electr<strong>on</strong> transiti<strong>on</strong>s produce<br />
bands, which are very broad and occur mostly in the UV and the VIS but rarely in the IR. Between 1.3<br />
µm and 2.5 µm vibrati<strong>on</strong>al transiti<strong>on</strong>s play the major role in the interacti<strong>on</strong> of EMR with the object.<br />
For the surface classes in the study <str<strong>on</strong>g>areas</str<strong>on</strong>g> (rocks, soil, vegetati<strong>on</strong>) the absorpti<strong>on</strong> features of the spectra<br />
are mainly characterized by vibrati<strong>on</strong>al processes, which are overt<strong>on</strong>e combinati<strong>on</strong>s of water<br />
molecules (H 2 O), hydroxyl i<strong>on</strong>s (OH - ), carb<strong>on</strong>ate i<strong>on</strong>s (CO 3 2- ) and ir<strong>on</strong> oxides (Fe 2 O 3 ) producing<br />
relatively sharp features (HUNT & SALISBURY 1970, HUNT & SALISBURY 1971, HUNT et al. 1971).<br />
Within the range of the used satellite sensors and the GER the reflectance of water is very low. Wet<br />
samples therefore have a lower reflectance than dry samples. This was also dem<strong>on</strong>strated by ZHANG,<br />
J. (1996) comparing spectra of similar rocks of differing water c<strong>on</strong>tents. Very characteristic water<br />
related bands occur near 1.4 µm and 1.9 µm. An indicati<strong>on</strong> for a hydroxyl band is given, if a band near<br />
1.4 µm but n<strong>on</strong>e at 1.9 µm exists. Also sulfuric minerals can produce bands at 1.4 µm and 1.9 µm<br />
respectively due to OH - and H 2 O vibrati<strong>on</strong>s. The OH - i<strong>on</strong> furthermore produces bands at 0.95 µm, 1.4<br />
µm - 1.5 µm and 2.2 µm - 2.3 µm, with the sec<strong>on</strong>d occurring if the hydroxyl i<strong>on</strong> is attached to<br />
Aluminum (Al-OH), while the latter indicates a combinati<strong>on</strong> with Manganese (Mg-OH). The frequent<br />
occurrence at 1.4 µm results from OH - being present in many materials as well as due to the OH -<br />
stretching mode whenever water is present in a molecule. Influences of ferric comp<strong>on</strong>ents are given at<br />
0.6 µm - 0.7 µm and 1.8µm (ferric i<strong>on</strong>), 0.8-0.9µm and 1.0-1.1 µm (trivalent ferrous), while carb<strong>on</strong>ate<br />
related CO 3 combinati<strong>on</strong>s and overt<strong>on</strong>es occur at 1.85 µm - 1.87 µm, 1.97-2.0 µm, 2.12 µm - 2.16 µm,<br />
2.30 µm - 2.35 µm and 2.50 µm - 2.55 µm.<br />
The original chemical compositi<strong>on</strong> of a sample is often altered by the degree of weathering, which is a<br />
complex process. Spectral changes depend <strong>on</strong> the influence of hydrolysis and oxidati<strong>on</strong> or reducti<strong>on</strong><br />
within the sample. Depending <strong>on</strong> the bedrock type weathering can increase or decrease the overall<br />
reflectance over all wavelengths. Furthermore, the reflectance curves also depend <strong>on</strong> the grain size of<br />
the sample (surface roughness, BRDF), time, slope and azimuth (light-source – sensor - object<br />
- 110 -
geometry, normalized by illuminati<strong>on</strong> correcti<strong>on</strong>). For laboratory <strong>spectral</strong> measurements these<br />
influences were eliminated as far as possible (see chapter 4). However, in satellite data they influence<br />
the reflectance spectrum of a pixel. A detailed review of the processes relevant in reflectance<br />
spectroscopy is given in HUNT et al (1971), HUNT & SALISBURY (1970) and HUNT & SALISBURY<br />
(1971) and VAN DER MEER & DE JONG (2001), with the first three being classics in that field.<br />
A comm<strong>on</strong> technique for the analysis and differentiati<strong>on</strong> of spectra is the investigati<strong>on</strong> of c<strong>on</strong>tinuum<br />
removed spectra as explained in chapter 3.10. The c<strong>on</strong>tinuum removed spectra can be used for the<br />
characterizati<strong>on</strong> of absorpti<strong>on</strong> features with regard to their wavelength positi<strong>on</strong>, depth, width,<br />
asymmetry, slope of the upper c<strong>on</strong>vex hull and area. The positi<strong>on</strong> of the absorpti<strong>on</strong> band, λ, is the<br />
minimum reflectance value over the entire wavelength range of the absorpti<strong>on</strong> feature. The depth, D,<br />
of an absorpti<strong>on</strong> feature is the reflectance value at the absorpti<strong>on</strong> feature’s shoulders minus the<br />
reflectance value at the absorpti<strong>on</strong> band minimum. The width, W, symmetry, S, and slope of the upper<br />
hull, Φ, are defined by<br />
W = A all / 2 D, S = 2 (A left / A all ) – 1, Φ = tan -1 (R e – R s ) / (λ e – λ s ) (7.1)<br />
where A all is the integral left and right of the absorpti<strong>on</strong> band minimum (A left + A right ), which form the<br />
total area under the c<strong>on</strong>vex hull. The symmetry, S, ranges from –1 to 1 with an S of 0 indicating a<br />
completely symmetric absorpti<strong>on</strong> feature. To calculate the slope of the upper hull, Φ, a ratio of R s and<br />
R e (the reflectance) and λ s and λ s , which are the wavelength at the starting and the ending point of the<br />
absorpti<strong>on</strong> feature is calculated. Resulting from waveform characterizati<strong>on</strong> five images (positi<strong>on</strong>,<br />
depth, width, symmetry and slope of the upper hull) can be generated supporting the similarity<br />
analysis between a reference spectrum (e.g. laboratory spectrum) and the pixel spectra of images (VAN<br />
DER MEER & DE JONG 2001, MARACCI 1992, URL 3-1). However, for Landsat- and Aster data studied<br />
here absorpti<strong>on</strong> features are not accentuated enough to compare these images. This technique is of<br />
course of great benefit when <str<strong>on</strong>g>coal</str<strong>on</strong>g> <str<strong>on</strong>g>fire</str<strong>on</strong>g> area demarcati<strong>on</strong> <str<strong>on</strong>g>based</str<strong>on</strong>g> <strong>on</strong> automated surface detecti<strong>on</strong> would be<br />
transferred to hyper<strong>spectral</strong> data.<br />
7.2. Signature Analysis of Coal Based <strong>on</strong> Chemical and Physical Properties<br />
Coal is defined as a type of bedrock developed from organic matter, where the carb<strong>on</strong> c<strong>on</strong>tent exceeds<br />
50% weight wise or 70% volume wise. The organic compounds of <str<strong>on</strong>g>coal</str<strong>on</strong>g> are called macerals. These are<br />
microscopic pieces, which can be classified depending <strong>on</strong> their form, morphology, reflectance- and<br />
fluorescence behavior into Vitrinites, Liptinites and Inertinites with their specific subgroups. Since<br />
different plant species and mixtures of plant compounds (leaves, stems, roots etc.) lead to the genesis<br />
of different maceral compositi<strong>on</strong>s with knowledge about these <strong>on</strong>e can differentiate different types of<br />
<str<strong>on</strong>g>coal</str<strong>on</strong>g>. Next to macerals <str<strong>on</strong>g>coal</str<strong>on</strong>g> also c<strong>on</strong>tains variable amounts of water, different gasses and minerals, like<br />
clay-minerals, sulphur-minerals, carb<strong>on</strong>ates, phosphates, sulfates, silicates, ir<strong>on</strong> disulphides and salts<br />
(YANG 1995). Coal can furthermore be classified into different ranks depending <strong>on</strong> the strength of<br />
metamorphosis and - depending <strong>on</strong> the <str<strong>on</strong>g>coal</str<strong>on</strong>g>’s purity and homogeneity – into different grades. The<br />
genesis of <str<strong>on</strong>g>coal</str<strong>on</strong>g> occurs in several steps. Alive or deteriorating plant material, which is cut off from O 2 ,<br />
is decomposed by anaerobic bacteria. This process leads to a relative accumulati<strong>on</strong> of carb<strong>on</strong> since<br />
other comp<strong>on</strong>ents are being split up and recycled. The process of anaerobic rotting leads to a change<br />
of soil-color towards darker blackish t<strong>on</strong>es. In moors a similar process proceed under water; the<br />
- 111 -
elative enrichment of carb<strong>on</strong> leads to the darkening of the moor and the steady growth of its layers. If<br />
the moor is furthermore covered and experiences str<strong>on</strong>g pressure from above, temperatures rise. This<br />
leads to an accelerati<strong>on</strong> of the <str<strong>on</strong>g>coal</str<strong>on</strong>g>ificati<strong>on</strong> process (LENZ & WIEDERSICH 1993). The following<br />
chemical equati<strong>on</strong> describes this process:<br />
n C 6 H 12 O 6 → n C 18 H 12 O 2 + n CH 4 + n CO 2 + n H 2 O (7.2)<br />
Simplified, cellulose is broken down to <str<strong>on</strong>g>coal</str<strong>on</strong>g>, methane, carb<strong>on</strong>-dioxide and water. The strength of<br />
<str<strong>on</strong>g>coal</str<strong>on</strong>g>ificati<strong>on</strong> determines the rank of the <str<strong>on</strong>g>coal</str<strong>on</strong>g> ranging from anthracite (highest) via average mineral <str<strong>on</strong>g>coal</str<strong>on</strong>g><br />
to brown <str<strong>on</strong>g>coal</str<strong>on</strong>g> (lowest). 24% of all <str<strong>on</strong>g>coal</str<strong>on</strong>g> stems from Carb<strong>on</strong>ic times, 17% from Permian times, 4% from<br />
Jurassic times and some smaller percentages from Cretaceous and Triassic times. Therefore, <str<strong>on</strong>g>coal</str<strong>on</strong>g><br />
varies in age between 345 and 65 Mio. years. The majority of mineral <str<strong>on</strong>g>coal</str<strong>on</strong>g>s is around 280 Mi. years<br />
old. In Tertiary times 54% of the overall world’s <str<strong>on</strong>g>coal</str<strong>on</strong>g> was accumulated as brown <str<strong>on</strong>g>coal</str<strong>on</strong>g> (lignite)<br />
indicating an age of 65 Mio. years and younger (LENZ & WIEDERSICH 1993, SCHRÖTER et al. 1992).<br />
Physical and chemical <str<strong>on</strong>g>coal</str<strong>on</strong>g> properties like rank, density, moisture c<strong>on</strong>tent and many others are major<br />
influencing factors for the process of sp<strong>on</strong>taneous combusti<strong>on</strong>, leading to <str<strong>on</strong>g>coal</str<strong>on</strong>g> <str<strong>on</strong>g>fire</str<strong>on</strong>g>s worldwide.<br />
Laboratory <strong>test</strong>s for example have indicated that Lignites have self heating temperatures (SHTs) of 35-<br />
36°C, medium- to low volatile bituminous <str<strong>on</strong>g>coal</str<strong>on</strong>g> between 110-135°C and anthracite above 140°C<br />
(SMITH & LAZZARA, 1987). The self heating <str<strong>on</strong>g>risk</str<strong>on</strong>g> therefore decreases with increasing <str<strong>on</strong>g>coal</str<strong>on</strong>g> rank<br />
(BANERJEE, 1985). Next to physical <str<strong>on</strong>g>coal</str<strong>on</strong>g> properties also the geological setting of the <str<strong>on</strong>g>coal</str<strong>on</strong>g> seams, the<br />
dip angle of the <str<strong>on</strong>g>coal</str<strong>on</strong>g> seam, the neighborhood to other seams, the amount of overburden, the speed of<br />
<str<strong>on</strong>g>coal</str<strong>on</strong>g> mining, air pressure gradients, aerati<strong>on</strong>, moisture c<strong>on</strong>tent and oxygen supply as well as tect<strong>on</strong>ic<br />
movements play a major role (YANG 1995). Due to all these interfering factors, the predicti<strong>on</strong> of self<br />
heating and sp<strong>on</strong>taneous combusti<strong>on</strong> in <str<strong>on</strong>g>coal</str<strong>on</strong>g> mining <str<strong>on</strong>g>areas</str<strong>on</strong>g> is very complex and sometimes not even<br />
possible. In the field it could be observed that slack, <str<strong>on</strong>g>coal</str<strong>on</strong>g> waste and <str<strong>on</strong>g>coal</str<strong>on</strong>g> dust are the most likely<br />
materials for sp<strong>on</strong>taneous combusti<strong>on</strong> especially when exposed to sun and sufficient aerati<strong>on</strong>. Very<br />
dense <str<strong>on</strong>g>coal</str<strong>on</strong>g> is not so likely to catch <str<strong>on</strong>g>fire</str<strong>on</strong>g> (ROSEMA et al. 1999). Detailed discussi<strong>on</strong>s <strong>on</strong> the pr<strong>on</strong>eness of<br />
different <str<strong>on</strong>g>coal</str<strong>on</strong>g> types for self heating or sp<strong>on</strong>taneous combusti<strong>on</strong> can be found am<strong>on</strong>gst others in<br />
BANERJEE (1982, 1985), BANERJEE et al. (1972), COWARD (1957), BYLO (1960), MUENZER (1975)<br />
and PENG (1983).<br />
Coal from the Wuda <str<strong>on</strong>g>coal</str<strong>on</strong>g> field is mainly used as cooking <str<strong>on</strong>g>coal</str<strong>on</strong>g>. Most seams within the syncline are<br />
dominated by Vitrinite macerals, c<strong>on</strong>tain a high amount of clay minerals, show a high sulphur c<strong>on</strong>tent<br />
stemming from former sea water sulfates and low Liptinite c<strong>on</strong>tents (DAI et al. 2002). The energyc<strong>on</strong>tent<br />
also referred to as heating value of Wuda <str<strong>on</strong>g>coal</str<strong>on</strong>g> varies between 5000 and 7000 kcal/kg (where<br />
1kcal/kg equals 4,1868 KJ/kg). This defines the energy amount released when burning the <str<strong>on</strong>g>coal</str<strong>on</strong>g> in an<br />
adiabatic calorie-meter. This heating value characterizes a “flame”-or “gas-flame” <str<strong>on</strong>g>coal</str<strong>on</strong>g>, which – with<br />
regard to the standardized ASTM-ranking – indicates a "high volatile bituminous <str<strong>on</strong>g>coal</str<strong>on</strong>g>" (BANDELOW,<br />
2003). The density of <str<strong>on</strong>g>coal</str<strong>on</strong>g> for the Ruqigou area varies between 950 and 1550 kg /m³. In this area<br />
Vitrinites and Inertinites dominate the macerals. Liptinites were not found (ROSEMA et al. 1999). Coal<br />
in Ruqigou and Gulaben is high rank anthracite <str<strong>on</strong>g>coal</str<strong>on</strong>g>, which shows an extremely small probability for<br />
sp<strong>on</strong>taneous combusti<strong>on</strong>. The heating value of Ruqigou / Gulaben <str<strong>on</strong>g>coal</str<strong>on</strong>g> varies between ca. 6950 and<br />
8050 kcal/kg. Detailed studies <strong>on</strong> the physical and chemical properties of Ruqigou / Gulaben <str<strong>on</strong>g>coal</str<strong>on</strong>g> can<br />
be found in ROSEMA et al. (1999) and were undertaken just recently by the German „Bundesanstalt<br />
fuer Materialforschung“ (BAM), Berlin. Their analysis results are presented in table 7-2.<br />
- 112 -
Table 7-1: Physical and chemical properties of <str<strong>on</strong>g>coal</str<strong>on</strong>g>s from the study <str<strong>on</strong>g>areas</str<strong>on</strong>g><br />
Chemical and Physical Properties Wuda Ruqigou Gulaben<br />
C in % 53.818 ± 1.810 74.972 ± 4.586 85.720 ± 2.414<br />
H in % 3.611 ± 0.088 2.904 ± 0.045 3.242 ± 0.042<br />
N in % 0.897 ± 0.054 0.653 ± 0.033 0.683 ± 0.052<br />
Water c<strong>on</strong>tent in % of mass 1.57 ± 0.015 2.62 ± 0.11 0.97 ± 0.02<br />
Ash c<strong>on</strong>tent in % of mass 38.56 13.73 6.19<br />
Calorific value in kJ/kg 21063 29226 33661<br />
Density in kg/m³ 1551 1563 1486<br />
Source: data provided by M. Schmidt of BAM, 02/2004<br />
Figure 7-1 <strong>on</strong> the next page shows typical <str<strong>on</strong>g>coal</str<strong>on</strong>g> spectra measured in field as well as in the laboratory<br />
and their c<strong>on</strong>tinuum removed equivalents. Comm<strong>on</strong> for all <str<strong>on</strong>g>coal</str<strong>on</strong>g> samples is a very low reflectance in<br />
the VIS and NIR regi<strong>on</strong> of the EMS. This results from an overall low albedo since most <str<strong>on</strong>g>coal</str<strong>on</strong>g> absorbs<br />
the different wavelengths in even quantities. The str<strong>on</strong>g absorpti<strong>on</strong> of <str<strong>on</strong>g>coal</str<strong>on</strong>g> (and hydrocarb<strong>on</strong>s) in the<br />
VIS and NIR occurs due to electr<strong>on</strong>ic transiti<strong>on</strong>s in molecular orbitals. Mature organic compounds<br />
with a high carb<strong>on</strong> c<strong>on</strong>tent dem<strong>on</strong>strate c<strong>on</strong>jugate structures and c<strong>on</strong>jugate ring structures. Electr<strong>on</strong><br />
transiti<strong>on</strong>s in these systems occur at lower energies, shifting the maximum of absorpti<strong>on</strong> into the NIR<br />
and VIS. Furthermore, C-C charge transfer can occur in molecules and band gap transiti<strong>on</strong>s also play a<br />
major role. These band gap transiti<strong>on</strong>s occur especially in high grade <str<strong>on</strong>g>coal</str<strong>on</strong>g>s with numerous c<strong>on</strong>jugated<br />
double b<strong>on</strong>ds. Here the electr<strong>on</strong>s in the b<strong>on</strong>ding orbitals are so mobile that they behave like free<br />
electr<strong>on</strong>s in semi-c<strong>on</strong>ductors (GAFFEY et al. 1993). Furthermore, all spectra are relatively featureless,<br />
especially, when compared with other surface spectra.<br />
Differences in the slope between VIS and NIR as well as the general reflectance level result from<br />
different carb<strong>on</strong> c<strong>on</strong>tents, particle sizes and impurities. Overall, reflectance decreases with increasing<br />
carb<strong>on</strong> c<strong>on</strong>tent and the depth of water related features decreases as well. This can be noted in figure 7-<br />
1 c, which shows 5 different <str<strong>on</strong>g>coal</str<strong>on</strong>g> samples. While the top spectrum represents a lower quality <str<strong>on</strong>g>coal</str<strong>on</strong>g><br />
from the Wuda <str<strong>on</strong>g>coal</str<strong>on</strong>g> field the spectrum with the lowest overall reflectance is a high rank anthracite<br />
<str<strong>on</strong>g>coal</str<strong>on</strong>g> from Gulaben of extremely high carb<strong>on</strong> c<strong>on</strong>tent (see table 7-1). The slight features at 1.4 µm and<br />
1.9 µm of the laboratory spectra presented in figure 7-1 c and -d result from a vibrati<strong>on</strong>al H 2 O and OH<br />
overt<strong>on</strong>es and sulfuric comp<strong>on</strong>ents present within the samples. Features around 1.5µm and 1.8µm<br />
result from sulphate in the samples.<br />
In figure 7-1 d <str<strong>on</strong>g>coal</str<strong>on</strong>g> waste laboratory spectra of different origin are presented. While reflectance<br />
spectra with the highest overall reflectance presents <str<strong>on</strong>g>coal</str<strong>on</strong>g> waste mixed with shale impurities and ash<br />
from the Wuda <str<strong>on</strong>g>coal</str<strong>on</strong>g> field the lowest reflectance spectra presents a <str<strong>on</strong>g>coal</str<strong>on</strong>g> waste sample from an<br />
anthracite mine in Ruqigou (see table 7-1). A further influence important for <str<strong>on</strong>g>coal</str<strong>on</strong>g> spectra is particle<br />
size. In str<strong>on</strong>g absorbing materials the depth of penetrati<strong>on</strong> is small and the regular part of reflecti<strong>on</strong><br />
causes reflectivity to decrease with decreasing particle size. Coal of the same origin and chemical<br />
c<strong>on</strong>stituti<strong>on</strong> may therefore differ in the overall reflectance level. This can explain the difference of the<br />
lowest and the middle spectrum in figure 7-1 d, where the middle spectrum was also collected in<br />
Ruqigou, but c<strong>on</strong>sists of a medium grounded <str<strong>on</strong>g>coal</str<strong>on</strong>g> powder.<br />
- 113 -
a<br />
a'<br />
b<br />
b'<br />
c<br />
c'<br />
d<br />
d'<br />
Figure 7-1 a-d: a: field spectra and +/- standard deviati<strong>on</strong> (green and red) of pure <str<strong>on</strong>g>coal</str<strong>on</strong>g> (a) and of <str<strong>on</strong>g>coal</str<strong>on</strong>g> waste<br />
(b); c: 5 different <str<strong>on</strong>g>coal</str<strong>on</strong>g> laboratory spectra; d: 3 different <str<strong>on</strong>g>coal</str<strong>on</strong>g> waste laboratory spectra (highest spectrum mixed<br />
with <str<strong>on</strong>g>coal</str<strong>on</strong>g> waste dust); a’-d’: c<strong>on</strong>tinuum removed spectra of a,b,c and d.<br />
- 114 -
7.3. Signature Analysis of Vegetati<strong>on</strong><br />
Since <str<strong>on</strong>g>coal</str<strong>on</strong>g> is the major surface of interest in this study the signature analysis of vegetati<strong>on</strong>, burned<br />
rock and the other surfaces is presented shorter and focuses <strong>on</strong> the separability with <str<strong>on</strong>g>coal</str<strong>on</strong>g> spectra. Most<br />
surfaces related to the occurrence of <str<strong>on</strong>g>coal</str<strong>on</strong>g> are <strong>spectral</strong>ly clearly distinguishable from the reflectance<br />
pattern of <str<strong>on</strong>g>coal</str<strong>on</strong>g> itself. Due to the geologic time scale, <str<strong>on</strong>g>coal</str<strong>on</strong>g> occurrences are mainly associated with<br />
Permian, Carb<strong>on</strong>iferous or Jurassic bedrocks, mainly sandst<strong>on</strong>es, shale and limest<strong>on</strong>es, recently<br />
deflated desert sands and weathered mixtures of the above. Vegetati<strong>on</strong>, water and anthropogenic<br />
surfaces may occur as well.<br />
Figure 7-2 depicts the spectra of three typical desert shrubs occurring in the two <str<strong>on</strong>g>coal</str<strong>on</strong>g> mining <str<strong>on</strong>g>areas</str<strong>on</strong>g>.<br />
Characteristic features here are the – compared to <str<strong>on</strong>g>coal</str<strong>on</strong>g> – varying reflectance in the VIS, a slight peak<br />
in the green band, the high reflectance in the NIR and a steady decline in the MIR range. While in the<br />
blue and red range leaf pigments absorb most of the EMR for charge transfer processes in chlorophyll,<br />
green light is - relatively seen - reflected more str<strong>on</strong>gly. Overall, reflecti<strong>on</strong> is weak in the VIS (0.4 µm<br />
- 0.7 µm) and very high in the NIR (0.7 µm - 1.3 µm). Here the refractive index disc<strong>on</strong>tinuity between<br />
air and the leaf cells leads to the str<strong>on</strong>g reflectance. Reflecti<strong>on</strong> decreases again past 1.3 µm with local<br />
maxima around 1.6 µm - 1.7 µm and 2.2 µm, where mainly the water c<strong>on</strong>tent of the plant influences<br />
the degree of absorpti<strong>on</strong> (SCHARDT 1990). The absorpti<strong>on</strong> features at 0.66 µm - 0.68 µm result from<br />
chlorophyll-a and -b and carotinoids, while atmospheric- and plant water results in features at 1.4 µm-<br />
1.45 µm and plant- and atmospheric water is resp<strong>on</strong>sible for the feature at 1.9 µm. Cellulose<br />
(mesophyll) is usually resp<strong>on</strong>sible for features at 1.22 µm, 1.48 µm, 1.93 µm, 2.28 µm, 2.34 µm and<br />
2.48 µm of which the sec<strong>on</strong>d and third can be noted, while the others are hardly differentiable from<br />
noise in the MIR. Lignin results in features at 1.45 µm, 1.93 µm, 2.05 µm - 2.14 µm, 2.27 µm,<br />
2.33 µm, 2.38 µm and 2.5 µm. The latter are located within the more noisy MIR range. The most<br />
comm<strong>on</strong> leaf protein usually results in features at 1.5 µm, 1.68 µm, 1.74 µm, 1.94 µm, 2.05 µm,<br />
2.17 µm, 2.29 µm and 2.47 µm, of which <strong>on</strong>ly the last four can be guessed, while dry plant materials<br />
lead to diagnostic ligno-cellulose absorpti<strong>on</strong> features at 2.1 µm and 2.3µm. Overall, the field spectra<br />
past 2.0 µm are too noisy to allow for hard statements. Variability of the three spectra results from<br />
differences in chlorophyll c<strong>on</strong>tent, mesophyll structure and water c<strong>on</strong>tent. However, like for all<br />
surfaces, reflecti<strong>on</strong> differences are not <strong>on</strong>ly a result of different chemical c<strong>on</strong>stituents but may also<br />
occur due to morphological differences of leaf surfaces (surface roughness) and leaf geometry. Spectra<br />
of vegetati<strong>on</strong> mixed with their underlying bedrock or soil material are presented in figure 7-2 b. The<br />
higher reflectance in the VIS of the underlying material becomes apparent and the peak in the green<br />
disappears. The reflectance in the NIR is reduced and the 1.4 µm absorpti<strong>on</strong> band is slightly less<br />
accentuated due to a lower overall water c<strong>on</strong>tent. The MIR reflectance is increased due to an<br />
increasing soil influence.<br />
7.4. Signature Analysis of Pyrometamorphic Rock<br />
The spectra of pyrometamorphic rock are presented in figure 7-3 d. When a rock is heated by a <str<strong>on</strong>g>coal</str<strong>on</strong>g><br />
<str<strong>on</strong>g>fire</str<strong>on</strong>g> it undergoes dehydrati<strong>on</strong> and oxidati<strong>on</strong>. Dehydrati<strong>on</strong> of free water occurs between 45°C and<br />
200°C, for bound water above 100°C and for c<strong>on</strong>stituti<strong>on</strong>al water between 500-700°C. With increased<br />
heating (>500°C) organic compounds turn to gas. Ferrous compounds like ir<strong>on</strong>-sulphide oxidize to<br />
Fe 2 O 3 . For pyrometamorphic rocks exposed to higher temperatures overall <strong>spectral</strong> reflectance<br />
decreases with increasing temperature exposure.<br />
- 115 -
a<br />
a'<br />
b<br />
b'<br />
c<br />
c'<br />
d<br />
d'<br />
Figure 7-2 a-d: a: field spectra of three main desert shrub types, pure; b: field spectra of the three desert shrubs<br />
with soil influence; c: three different sandst<strong>on</strong>e samples of different locati<strong>on</strong>s measured in the <strong>spectral</strong><br />
laboratory; (from highest to lowest: grey, yellow, light grey) and a dark red siltst<strong>on</strong>e sample; d: four different<br />
desert sand samples of different locati<strong>on</strong>s measured in the <strong>spectral</strong> laboratory; a’-d’: c<strong>on</strong>tinuum removed<br />
spectra of a-d.<br />
- 116 -
a<br />
a'<br />
b<br />
b'<br />
c<br />
c'<br />
d<br />
d'<br />
Figure 7-3 a-d: a: laboratory spectra of four different grey limest<strong>on</strong>es; b: laboratory spectra of a light and a<br />
dark magmatic and metamorphic rock; c: laboratory spectra of four different yellowish to dark brown shalesandst<strong>on</strong>e<br />
mixes, the lowest is a shale with very high organic c<strong>on</strong>tent; d: four laboratory spectra of four yellow<br />
to dark red pyrometamorphic rocks; a’-d’: c<strong>on</strong>tinuum removed spectra of a-d.<br />
- 117 -
The final stage of a pyrometamorphic rock is a molten rock in which all minerals are remolten and<br />
solidified, including a high c<strong>on</strong>tent of magnetic minerals. The str<strong>on</strong>ger the pyrometamorphosis, the<br />
weaker accentuated are the H 2 O and OH related bands at 1.4 µm and 1.9 µm (ZHANG, J. 1996). The<br />
four rock samples show an overall reflectance exceeding 15 % for all samples. The sample of yelloworange<br />
burned rock shows a very high overall reflectance, ferrous features around 0.9 µm resulting<br />
from Goethit and Hematite and H 2 O influence of water within the probes at 1.4 µm and 1.9 µm. From<br />
the rock’s inner structure <strong>on</strong>e can c<strong>on</strong>clude that before pyrometamporphosis the sample was a clay<br />
bearing siltst<strong>on</strong>e. The 1.4 µm band decreases in depth with decreasing overall <strong>spectral</strong> reflectance as<br />
does the 1.9 µm feature in the three red pyrometamorphic rocks. It is assumed that the dark red sample<br />
with the lowest reflectance underwent the str<strong>on</strong>gest pyrometamorphosis, since it shows the least<br />
absorpti<strong>on</strong> features and the lowest overall reflectance. Hematite dominates this sample’s absorpti<strong>on</strong><br />
behavior around 0.9µm. While the yellow-orange sample was collected at a relatively new active<br />
underground <str<strong>on</strong>g>coal</str<strong>on</strong>g> <str<strong>on</strong>g>fire</str<strong>on</strong>g> in Ruqigou, the red samples were collected at an old very large <str<strong>on</strong>g>fire</str<strong>on</strong>g> already<br />
surrounded by inactive parts and cooled pyrometamorphic rock.<br />
7.5. Signature Analysis and Spectral Properties of Other Surfaces<br />
The <strong>spectral</strong> properties of sandst<strong>on</strong>e (figure 7-3c) differ clearly from the <strong>spectral</strong> characteristics of<br />
<str<strong>on</strong>g>coal</str<strong>on</strong>g>. All four laboratory samples exhibit a very high overall reflectance and display str<strong>on</strong>g absorpti<strong>on</strong><br />
bands at 1.4 µm and 1.9 µm resulting from liquid water in microscopic fluid inclusi<strong>on</strong>s in the samples.<br />
The “dent” in the yellow sandst<strong>on</strong>e spectrum at around 0.8 µm - 0.9 µm results from ferrous oxides<br />
(Goethite) present in the sample, while the grey sandst<strong>on</strong>e gives a slight indicati<strong>on</strong> for a carb<strong>on</strong>atic<br />
influence between 2.3 µm and 2.4 µm. Features at 2.2 µm indicate the influence of clay minerals<br />
involving Al-OH vibrati<strong>on</strong>s.<br />
Figure 7-3 c also dem<strong>on</strong>strates the effect, that rock surfaces of lower surface roughness show overall<br />
lower reflectances over all wavelengths than very smooth surfaces. Though the grey and light grey<br />
sandst<strong>on</strong>e samples do not differ substantially in color, the grey sample c<strong>on</strong>sists of much smaller grains<br />
and has a smoother surface. It also c<strong>on</strong>tains glimmer and feldspar particles. This phenomen<strong>on</strong> was<br />
dem<strong>on</strong>strated by ZHANG, J. (1996), who compared spectra of polished and original surfaces of the<br />
same bedrock. Differences result from the phenomen<strong>on</strong> that the number of phot<strong>on</strong>s scattered out of a<br />
sample is reduced when surface roughness increases (HUNT et al. 1971). The light grey sandst<strong>on</strong>e<br />
sample exhibits no ir<strong>on</strong> related absorpti<strong>on</strong> features. The red siltst<strong>on</strong>e sample has a very different<br />
<strong>spectral</strong> behavior. It was collected 50 km east of Ruqigou, where wine red sandst<strong>on</strong>e and siltst<strong>on</strong>e<br />
bands of steep dipping angle exist. A slight ferric (Hematite) influence occurs around 0.9 µm.<br />
Compared to the sandst<strong>on</strong>e the overall reflectance is much lower. Except for the light grey sample all<br />
samples indicate this ferric influence noticeable around 0.9 µm. For sandst<strong>on</strong>es the <strong>spectral</strong> expressi<strong>on</strong><br />
of the degree of weathering is not as accentuated as for shale or mudst<strong>on</strong>es. Weathering usually lowers<br />
the overall reflectance slightly, while absorpti<strong>on</strong> features remain similar.<br />
Desert sand (figure 7-2d) has very high overall reflectances between 1.0 µm and 2.5 µm due to the<br />
high quartzite c<strong>on</strong>tent. Influences of crystal water and OH vibrati<strong>on</strong>al modes at 1.4 and 1.9 µm.<br />
Features past 2.2 µm may results from noise but could also indicate impurities induced through Al-OH<br />
vibrati<strong>on</strong>s from clay mineral influences. Spectra do not vary substantially even though the samples<br />
were collected at four different locati<strong>on</strong>s.<br />
- 118 -
The limest<strong>on</strong>e spectra presented in figure 7-3 a show an O 2 band near 0.67 µm. One sample shows<br />
ferrous influences (Siderite) between 0.85 and 1.1 µm (black solid line), while all samples indicate<br />
H 2 O and OH vibrati<strong>on</strong>al modes at 1.4 and 1.9 µm and the typical carb<strong>on</strong>ate bands between 2.2 µm and<br />
2.4 µm. The ir<strong>on</strong> bearing sample furthermore c<strong>on</strong>tains very small Bitumen minerals. While features at<br />
2.31 µm indicate dolomitic dominance, features at 2.34 indicate calcitic influences (LONGHI et al.<br />
2001). The overall reflectance is much higher than that of <str<strong>on</strong>g>coal</str<strong>on</strong>g> and c<strong>on</strong>fusi<strong>on</strong> is unlikely. The same<br />
applies for vegetati<strong>on</strong>.<br />
Spectra of magmatic and metamorphic rocks (figure 7-3b) are characterized by str<strong>on</strong>g ferric influences<br />
(chlorite) between 0.85 µm - and 1.1 µm, which occur as a broad “dent” before an increase around<br />
1.35 µm. H 2 O and OH induced absorpti<strong>on</strong> bands at 1.4 µm and 1.9 µm and an overall higher average<br />
reflectance than that of <str<strong>on</strong>g>coal</str<strong>on</strong>g> occur. Compared to sandst<strong>on</strong>e or limest<strong>on</strong>e a distinct <strong>spectral</strong> transiti<strong>on</strong><br />
between the VIS, NIR and MIR induced by a str<strong>on</strong>g ferric influence characterize these samples. The<br />
lower spectrum represents a gneiss, which could have been a granodiorite, while the overall ligther<br />
sample is a str<strong>on</strong>gly weathered granite with high quartz and chlorite c<strong>on</strong>tent. Past 2.2 µm Al-OH and<br />
Fe-OH vibrati<strong>on</strong>al modes occur. The finest grained light sample shows an overall higher reflectance<br />
and str<strong>on</strong>ger accentuated features.<br />
The four spectra of shale-sandst<strong>on</strong>e mixes and pure shale in figure 7-3 c display very distinct features.<br />
The spectrum with the lowest overall reflectance (black, dash-dots) is nearly identical to a <str<strong>on</strong>g>coal</str<strong>on</strong>g><br />
spectrum. While the features before 0.4 µm result from noise of the GER the features at 1.4 and 1.9<br />
µm indicate fluid water inclusi<strong>on</strong>s, OH vibrati<strong>on</strong>al modes and sulphuric comp<strong>on</strong>ents in the samples.<br />
The feature between 0.6 µm and 0.7 µm, visible in the solid brown- and the dashed brown shalesandst<strong>on</strong>e<br />
mix spectra, may result from an influence of Goethit. The str<strong>on</strong>g feature in all except the<br />
lowest spectrum at 1.35 µm may result from Kaolinit. Ferrous oxides yield a band at 2.1 µm for the<br />
lower two samples and an Illit influence can be guessed past 2.2 µm, while the str<strong>on</strong>g band at 2.2 µm<br />
is induced by OH (LONGHI et al. 2001).<br />
7.6. Separability of Surface Spectra and Temporal Spectral Variability<br />
Resulting from signature analysis of the field and laboratory samples, spectra, which are harder to<br />
differentiate from <str<strong>on</strong>g>coal</str<strong>on</strong>g>, are dark shale with high organic c<strong>on</strong>tents as presented in figure 7-3c. These<br />
surfaces show similar <strong>spectral</strong> properties to those of <str<strong>on</strong>g>coal</str<strong>on</strong>g> in the VIS as well as the NIR and MIR<br />
wavelength range. The boundary between <str<strong>on</strong>g>coal</str<strong>on</strong>g> and shale with high organic c<strong>on</strong>tent is <strong>spectral</strong>ly and<br />
mineralogically not sharp. Therefore, it is possible, that these shales will be extracted as <str<strong>on</strong>g>coal</str<strong>on</strong>g> and vice<br />
versa. However, this type of shale was not found in larger surface outcrops. It usually occurs in slim<br />
bands associated with a <str<strong>on</strong>g>coal</str<strong>on</strong>g> seam. With a high organic c<strong>on</strong>tent shale also has the potential to ignite<br />
sp<strong>on</strong>taneously. The same <strong>spectral</strong> c<strong>on</strong>fusi<strong>on</strong> could occur with very dark completely molten<br />
pyrometamorphic rock. However, such rock could not be found in relevant quantities in the study area.<br />
In the satellite imagery (image spectra) additi<strong>on</strong>al surfaces exist, which will be hard to differentiate<br />
from the surface <str<strong>on</strong>g>coal</str<strong>on</strong>g>. Firstly, surfaces which are covered by thick <str<strong>on</strong>g>coal</str<strong>on</strong>g> dust will be extracted as <str<strong>on</strong>g>coal</str<strong>on</strong>g>,<br />
since <strong>spectral</strong> informati<strong>on</strong> does not enable to differentiate thematic classes. Coal, which will be<br />
denoted can be <str<strong>on</strong>g>coal</str<strong>on</strong>g> seams, <str<strong>on</strong>g>coal</str<strong>on</strong>g> waste piles, <str<strong>on</strong>g>coal</str<strong>on</strong>g> storage piles, mine works and <str<strong>on</strong>g>areas</str<strong>on</strong>g>, where a surface<br />
is covered and therefore masked by thick <str<strong>on</strong>g>coal</str<strong>on</strong>g> dust. Except for the last phenomen<strong>on</strong> – often found<br />
al<strong>on</strong>g roads leading to mines – all other <str<strong>on</strong>g>areas</str<strong>on</strong>g> may experience <str<strong>on</strong>g>coal</str<strong>on</strong>g> <str<strong>on</strong>g>fire</str<strong>on</strong>g>s.<br />
- 119 -
Sec<strong>on</strong>dly, difficulties may also arise from water bodies, which are rare in the study <str<strong>on</strong>g>areas</str<strong>on</strong>g> but occur in<br />
the chosen transfer <str<strong>on</strong>g>areas</str<strong>on</strong>g> (India, Australia). It can be seen in figure 7-4 that water bodies with a lack of<br />
sediment and suspended material show very low reflectances in the VIS as well as the NIR and<br />
MIR.Thirdly, the same applies for str<strong>on</strong>gly shadowed <str<strong>on</strong>g>areas</str<strong>on</strong>g> of deeply incised valleys and shadowed<br />
mountain ridges, where even illuminati<strong>on</strong> correcti<strong>on</strong> could not resolve the <strong>spectral</strong> signal to a clear<br />
surface spectrum. Such shadowed <str<strong>on</strong>g>areas</str<strong>on</strong>g> show little reflecti<strong>on</strong> in the VIS, NIR and MIR as<br />
dem<strong>on</strong>strated in figure 7-4. Other surfaces like limest<strong>on</strong>e, sandst<strong>on</strong>e or desert sand (all dashed) should<br />
not play a major role in class c<strong>on</strong>fusi<strong>on</strong> with <str<strong>on</strong>g>coal</str<strong>on</strong>g> surfaces and vegetati<strong>on</strong>.<br />
Figure 7-4: Radiometrically corrected Landsat-7<br />
ETM+ spectra for different surfaces. 6=MIR, 7=TIR.<br />
The image spectra of <str<strong>on</strong>g>coal</str<strong>on</strong>g> (black diam<strong>on</strong>ds) and<br />
shadow (black squares) run nearly parallel and can<br />
<strong>on</strong>ly be differentiated by temperature differences.<br />
Water (grey diam<strong>on</strong>ds) shows a similar <strong>spectral</strong><br />
behavior in the first four bands but differs in the far<br />
NIR and MIR. The separability of <str<strong>on</strong>g>coal</str<strong>on</strong>g>, vegetati<strong>on</strong>,<br />
or geologic surfaces, like sandst<strong>on</strong>e, limest<strong>on</strong>e and<br />
desert sand (upper three signatures) is high.<br />
The separabilities of the main surface classes can also be quantitatively analyzed calculating the<br />
Euclidean distance (D E ) as specified in chapter 3, equati<strong>on</strong> 3.5. The following tables (7-2, a & b) show<br />
these separabilities as calculated for the main 15 <strong>spectral</strong> classes occurring in the Wuda regi<strong>on</strong> for<br />
Landsat-7 ETM+ data. In the first case <strong>on</strong>ly channels 1, 2, 3, 4, 5 and 7 are included, while in the<br />
sec<strong>on</strong>d separability calculati<strong>on</strong> the thermal band is included also. To calculate D E s identical regi<strong>on</strong>s of<br />
interest were generated for each land cover class. They are <str<strong>on</strong>g>based</str<strong>on</strong>g> <strong>on</strong> existing ground truth and spectra<br />
within the area were averaged. Class distances for these mean vectors were calculated for the 6-bandand<br />
the 7-band image respectively. The size of the regi<strong>on</strong>s of interest (exceeding 20 pixels each)<br />
granted a representative number of pure image-derived surface spectra to be incorporated for each<br />
class’ calculati<strong>on</strong>. These 20 or more pixels were located within ground truth polyg<strong>on</strong>s mapped during<br />
the 2002 field campaign. Therefore, the distance measure was calculated <str<strong>on</strong>g>based</str<strong>on</strong>g> <strong>on</strong> the scene of<br />
September 2002. Compared to D E the Mahalanobis distance would also take class variance into<br />
account, while the D E <strong>on</strong>ly refers to the center vector of the class. Except for the “water” and the<br />
“calcite” class Mahalanobis distances were similar to the Euclidean distance presented in tables 7-2.<br />
Within the two tables orange cells mark Euclidean distances lower than 15, while green cells indicate<br />
Euclidean distances above 50. In table 7-2 a the thermal band is not included in the calculati<strong>on</strong>s, while<br />
table 7-3 b shows the separabilities calculated from all Landsat-7 input channels. Blue fields indicate<br />
D E ’s which were below 15 and increased with the thermal channel included, while light blue fields<br />
indicate, where D E’ ’s ranged between 15 and 50 and increased as well. What is illustrated in figure 7-4<br />
can also be quantitatively seen in table 7-2. Lake water, shadowed regi<strong>on</strong>s and <str<strong>on</strong>g>coal</str<strong>on</strong>g> related material<br />
are most likely to be c<strong>on</strong>fused with <str<strong>on</strong>g>coal</str<strong>on</strong>g>. Classes, which can be differentiated easily, are sandst<strong>on</strong>e,<br />
desert sand and calcite. Especially the latter surface, which <strong>on</strong>ly occurs in <strong>on</strong>e place within the broader<br />
Wuda regi<strong>on</strong> shows great D E s compared to all other classes. All three problematic classes (lake water,<br />
shadow and <str<strong>on</strong>g>coal</str<strong>on</strong>g> related material) can be differentiated more easily when the thermal band is included<br />
into the analysis. Especially shadow can be separated <str<strong>on</strong>g>based</str<strong>on</strong>g> <strong>on</strong> the temperature difference to <str<strong>on</strong>g>coal</str<strong>on</strong>g>.<br />
- 120 -
Note, that in 7-2a the dimensi<strong>on</strong> is reflectance [%] while in 7-2b another unit [°C] is included. This<br />
results in the fact that the inter class separabilities can not be compared unit wise but <strong>on</strong>ly relative,<br />
which is sufficient for the proof aimed at here. Depending <strong>on</strong> surface temperatures, cases may occur,<br />
where <str<strong>on</strong>g>coal</str<strong>on</strong>g>, water and shadow can not be separated in untransformed data. This can occur if they have<br />
a very similar temperature and <strong>spectral</strong> signature at the same time. Nevertheless, comparing table 7-2a<br />
and 7-2b it is illustrated that for most classes the incorporati<strong>on</strong> of the thermal band improves the inter<br />
class separability. Hence, the thermal band will be included into the approaches for automated surface<br />
extracti<strong>on</strong>.<br />
Table 7-2 a: Separabilities (D E ) for the most comm<strong>on</strong> surface classes in Wuda (no thermal band included)<br />
Coal<br />
Veg., dense<br />
Veg., med<br />
Veg., sparse<br />
Water, river<br />
Water, lake<br />
Limest<strong>on</strong>e<br />
Sandst<strong>on</strong>e<br />
Metamorphic<br />
Shadow<br />
Desert sand<br />
Calcite<br />
Settlement<br />
Weathered<br />
Coal related<br />
Coal 27 22 36 23 11 40 52 29 11 56 82 20 40 15<br />
Veg., dense 15 28 28 26 34 43 24 34 47 72 22 32 20<br />
Veg., med 16 28 22 22 34 12 33 37 66 9 21 9<br />
Veg., sparse 39 34 7 19 9 47 20 53 16 6 21<br />
Water, river 15 42 50 31 27 57 74 26 41 24<br />
Water, lake 37 48 25 18 53 75 18 37 15<br />
Limest<strong>on</strong>e 13 13 52 16 47 20 2 25<br />
Sandst<strong>on</strong>e 24 63 12 35 32 14 37<br />
Metamorphic 40 28 56 9 12 13<br />
Shadow 67 93 31 51 27<br />
Desert sand 42 36 16 40<br />
Calcite 64 48 68<br />
Settlement 20 5<br />
Weathered 25<br />
Table 7-2 b: Separabilities (D E ) for the most comm<strong>on</strong> surface classes in Wuda (thermal band included)<br />
Coal<br />
Veg., dense<br />
Veg., med<br />
Veg., sparse<br />
Water, river<br />
Water, lake<br />
Limest<strong>on</strong>e<br />
Sandst<strong>on</strong>e<br />
Metamorphic<br />
Shadow<br />
Desert sand<br />
Calcite<br />
Settlement<br />
Weathered mix<br />
Coal related<br />
Coal 29 23 36 25 12 41 52 29 17 56 82 21 40 16<br />
Veg., dense 15 29 28 26 34 44 25 34 48 72 22 33 23<br />
Veg., med 17 29 22 23 34 12 33 37 66 9 22 12<br />
Veg., sparse 40 34 7 19 10 49 21 53 16 6 21<br />
Water, river 16 43 51 32 28 58 74 27 42 27<br />
Water, lake 37 48 25 20 53 75 19 37 17<br />
Limest<strong>on</strong>e 13 13 53 16 47 20 2 26<br />
Sandst<strong>on</strong>e 24 64 12 35 32 14 37<br />
Metamorphic 41 29 56 9 12 14<br />
Shadow 68 93 33 52 31<br />
Desert sand 42 36 16 41<br />
Calcite 64 48 69<br />
Settlement 20 8<br />
Weathered mix 25<br />
Only in Ruqigou does burned rock occur in large enough quantities to occur in the satellite image.<br />
However, after visual analysis and compared with ground truth it is assumed that even in the most<br />
recent Landsat image from May 2003 not more than 10 pixels in a 6- to 7-D feature space of more<br />
than 50 Milli<strong>on</strong> pixels are <strong>spectral</strong>ly mainly influenced by pyrometamorphic rock. However, D E s of<br />
- 121 -
pyrometamorphic pixels to <str<strong>on</strong>g>coal</str<strong>on</strong>g>, slightly vegetated surfaces, agriculturally used surfaces, water,<br />
weathered bedrock mix, sandst<strong>on</strong>e and shade were calculated as presented in table 7-3. The same color<br />
scheme as for table 7-2 a and b applies.<br />
Table 7-3 a: Separabilities (D E ) for the most comm<strong>on</strong> surface classes in Ruqigou (thermal band not included)<br />
Pyro. rock<br />
Coal<br />
Veg. sparse<br />
Pyro. rock 52 9 42 55 14 11 54<br />
Coal 51 24 8 41 56 3<br />
Veg. sparse 38 54 14 12 53<br />
Agricultural 28 34 46 25<br />
Water (lake) 43 58 9<br />
Weathered mix 15 43<br />
Sandst<strong>on</strong>e 58<br />
Agricultural<br />
Water (lake)<br />
Weathered mix<br />
Sandst<strong>on</strong>e<br />
Shadow<br />
As for the separabilities calculated<br />
for the regi<strong>on</strong> of Wuda, the D E of<br />
<str<strong>on</strong>g>coal</str<strong>on</strong>g>, water and shadow are very<br />
small. C<strong>on</strong>fusi<strong>on</strong> is expected from<br />
pyrometamorphic rock with sparsely<br />
vegetated <str<strong>on</strong>g>areas</str<strong>on</strong>g>, weathered surfaces<br />
and sandst<strong>on</strong>e. Good separabilities<br />
have sandst<strong>on</strong>e against water, <str<strong>on</strong>g>coal</str<strong>on</strong>g><br />
or shadow and pyrometamorphic<br />
rock against <str<strong>on</strong>g>coal</str<strong>on</strong>g> and water.<br />
Table 7-3 b: Separabilities (D E ) for the most comm<strong>on</strong> surface classes in Ruqigou (thermal band included)<br />
Pyro. rock<br />
Coal<br />
Veg. sparse<br />
Pyro. rock 55 11 46 59 17 11 58<br />
Coal 51 25 8 41 56 10<br />
Veg. sparse 38 54 14 12 53<br />
Agricultural 28 35 47 25<br />
Water (lake) 43 58 10<br />
Weathered mix 15 45<br />
Sandst<strong>on</strong>e 59<br />
Agricultural<br />
Water (lake)<br />
Weathered mix<br />
Sandst<strong>on</strong>e<br />
Shadow<br />
When the thermal band is included<br />
the degree of differentiati<strong>on</strong> for <str<strong>on</strong>g>coal</str<strong>on</strong>g>,<br />
shadow and water from each other<br />
increases slightly. Furthermore, the<br />
separability of pyrometamorphic material<br />
from sparsely vegetated <str<strong>on</strong>g>areas</str<strong>on</strong>g><br />
and weathered mix increases. The<br />
same applies for agricultural <str<strong>on</strong>g>areas</str<strong>on</strong>g>,<br />
weathered- and sandst<strong>on</strong>e surfaces.<br />
The weak separability of pyrometamorphic rock from sparse vegetati<strong>on</strong> or weathered- and sandst<strong>on</strong>e<br />
surfaces presented in table 7-3 a can be explained through the fact that the <strong>spectral</strong> signal – especially<br />
when the pyrometamorphic rock is “young” or did not experience extreme temperatures – does not<br />
differ very significantly from the original rock spectrum. This could also be observed in figure 7-3.<br />
Pyrometamorphic rocks in the first stage react with a slight reflectance increase in the NIR, which is<br />
why slightly vegetated <str<strong>on</strong>g>areas</str<strong>on</strong>g> lead to c<strong>on</strong>fusi<strong>on</strong>. Pyrometamorphic rocks of the third stage were not<br />
found in larger quantities and could not be detected in the image – if they would exist in larger <str<strong>on</strong>g>areas</str<strong>on</strong>g> to<br />
influence a 30×30 m pixel signature, c<strong>on</strong>fusi<strong>on</strong> with <str<strong>on</strong>g>coal</str<strong>on</strong>g> or dark shale would be likely.<br />
The extreme low separability of <str<strong>on</strong>g>coal</str<strong>on</strong>g> and shadow (table 7-3 a) improves when the TIR informati<strong>on</strong> is<br />
included. Euclidean distances of <str<strong>on</strong>g>coal</str<strong>on</strong>g> and water stay the same. This is due to the fact that water and<br />
<str<strong>on</strong>g>coal</str<strong>on</strong>g> in the image chosen for separability analysis show similar temperatures. Therefore, the additi<strong>on</strong>al<br />
thermal informati<strong>on</strong> can not raise differentiability here. The <strong>spectral</strong> distance between<br />
pyrometamorphic rock and sparse vegetati<strong>on</strong> as well as weathered surfaces increases slightly due to an<br />
overall higher temperature of burned rock surfaces compared to vegetated surfaces. Good separati<strong>on</strong> is<br />
expected from pyrometamorph material with <str<strong>on</strong>g>coal</str<strong>on</strong>g>, water, shadow and densely vegetated <str<strong>on</strong>g>areas</str<strong>on</strong>g> in<br />
agricultural regi<strong>on</strong>s. This will support <str<strong>on</strong>g>coal</str<strong>on</strong>g> <str<strong>on</strong>g>fire</str<strong>on</strong>g> area demarcati<strong>on</strong> in that respect that <str<strong>on</strong>g>coal</str<strong>on</strong>g> signatures,<br />
vegetati<strong>on</strong> signatures and pyrometamorph signatures will not interfere with each other.<br />
- 122 -
Dafeng open pit mine<br />
Shadow profile<br />
Figure 7-5 shows part of the Ruqigou<br />
<str<strong>on</strong>g>coal</str<strong>on</strong>g> mining area. The right subset<br />
displays a deeply incised valley southeast<br />
of the Ruqigou syncline. The right<br />
subset shows the Dafeng open pit <str<strong>on</strong>g>coal</str<strong>on</strong>g><br />
mine northeast of Ruqigou.<br />
Coal profile<br />
Deeply incised valley<br />
Figure 7-5: Spectral profiles over seven<br />
ETM+ bands for two spatial profiles:<br />
shadow (right, center locati<strong>on</strong>: 4321784N,<br />
605360E), <str<strong>on</strong>g>coal</str<strong>on</strong>g> (left, center locati<strong>on</strong>:<br />
4323488N, 595692E, UTM, Z 48N).<br />
Both spatial profiles cover an extent of 600 meters. Al<strong>on</strong>g this profile line spectra of each pixel in all<br />
wavelengths were plotted, which is illustrated in figure 7-6 <strong>on</strong> the next page. The left profile runs from<br />
a very slightly vegetated sandst<strong>on</strong>e surface in the Southeast over the dark ca. 300 meter wide valley<br />
and covers part of a vegetated sandst<strong>on</strong>e surface <strong>on</strong> the northern side of the valley. The right profile<br />
covering the Dafeng <str<strong>on</strong>g>coal</str<strong>on</strong>g> mine starts in a vegetated waste pile area of former covering bedrocks and<br />
gravel, proceeds from North to South over the whole extend of the open <str<strong>on</strong>g>coal</str<strong>on</strong>g> pit and ends <strong>on</strong> a slightly<br />
vegetated bedrock waste pile in the South.<br />
Figure 7-6 illustrates the typical <strong>spectral</strong> behavior of the individual spatial profiles. For the valley<br />
profile the following observati<strong>on</strong>s can be made. The <strong>spectral</strong> signals (left column in figure 7-6) of the<br />
slightly vegetated sandst<strong>on</strong>e surface in the South <strong>spectral</strong>ly “behaves” like a mixture of a pure bedrock<br />
spectrum with a slight vegetati<strong>on</strong> influence as seen in LS-7 band 4. Here the reflectance in the NIR<br />
reaches nearly 34 %. However, the sandst<strong>on</strong>e influence is the dominant <strong>spectral</strong> influence within the<br />
pixels, which is clearly seen in the VIS profile. Here an increase in reflectance from blue to green and<br />
red is observed. No distinct peak in the green occurs. Furthermore, overall VIS reflectances are very<br />
high. On the northern side of the valley the vegetati<strong>on</strong> influence is str<strong>on</strong>ger. Here the NIR reflectances<br />
are higher. The valley itself shows no reflectance in the VIS and a neglectable reflectance in the NIR.<br />
It is a fully shadowed regi<strong>on</strong>, which – even with the support of illuminati<strong>on</strong> correcti<strong>on</strong> – could not be<br />
<strong>spectral</strong>ly resolved to a surface signal. The slight reflectance in the MIR is almost negligible.<br />
Nevertheless, it is of importance that the valley has a thermal emissi<strong>on</strong> (see ETM+ band 6), which<br />
reaches the sensor unhindered by the shading- and scattering processes occurring in the optical range.<br />
The temperature of the shaded valley, ranging between 7°C – 30°C, is clearly lower than the<br />
surrounding sandst<strong>on</strong>e temperature, which ranges around 35°C-40°C. The “inner” part of the valley,<br />
which shows no <strong>spectral</strong> signal in the VIS (within the dashed orange margins in figure 7-6) ranges<br />
between 7°C-15°C, while the “valley margin” ranges between 10°C-30°C. This is an important<br />
observati<strong>on</strong>. Based <strong>on</strong> tables 7-2 and 7-3 it is assumed, that the thermal band will increase the<br />
separability of <str<strong>on</strong>g>coal</str<strong>on</strong>g> and shadow. However, shadow has to be differentiated into the “inner shadow” or<br />
shadow regi<strong>on</strong> and the “shadow margin”. These shadow margin <str<strong>on</strong>g>areas</str<strong>on</strong>g> run parallel to the valley edge<br />
and have a great potential for the c<strong>on</strong>fusi<strong>on</strong> with <str<strong>on</strong>g>coal</str<strong>on</strong>g>. Their VIS-, NIR- and MIR expressi<strong>on</strong> mimics<br />
the <strong>on</strong>e of <str<strong>on</strong>g>coal</str<strong>on</strong>g>. Temperatures reach values <strong>on</strong>ly slightly below <str<strong>on</strong>g>coal</str<strong>on</strong>g> temperatures (see right column in<br />
figure 7-6). In cases, where these shadow margin <str<strong>on</strong>g>areas</str<strong>on</strong>g> show temperatures which overlap with <str<strong>on</strong>g>coal</str<strong>on</strong>g><br />
temperature standard deviati<strong>on</strong> a spectra-<str<strong>on</strong>g>based</str<strong>on</strong>g> separati<strong>on</strong> in n<strong>on</strong> transformed data will not be possible.<br />
- 123 -
LS-7 band 1 LS-7 band 1<br />
LS-7 band 2 LS-7 band 2<br />
LS-7 band 3<br />
LS-7 band 3<br />
LS-7 band 4 LS-7 band 4<br />
LS-7 band 5 LS-7 band 5<br />
LS-7 band 7 LS-7 band 7<br />
LS-7 band 6 LS-7 band 6<br />
Figure 7-6: Spectral profiles over seven Landsat-7 ETM+ bands for two spatial profiles: shadow (left), <str<strong>on</strong>g>coal</str<strong>on</strong>g><br />
(right), band 6 is the thermal TIR band and therefore is displayed behind channel 7, which represents the MIR.<br />
- 124 -
The right column of figure 7-6 shows the <strong>spectral</strong> behavior of the surfaces covered by the profile, over<br />
all bands. While the reflectance of the Dafeng <str<strong>on</strong>g>coal</str<strong>on</strong>g> in the VIS and NIR is very low, reflectance values<br />
increase in the far NIR and MIR averaging slightly over 10%. Opposite to the shadowed area, where<br />
temperature decreases, a clear temperature increase against the surrounding <str<strong>on</strong>g>areas</str<strong>on</strong>g> of former cover<br />
bedrock waste piles can be noted.<br />
Figure 7-7 and 7-8 illustrate the temporal <strong>spectral</strong> variability of the surfaces <str<strong>on</strong>g>coal</str<strong>on</strong>g>, shadow and shadow<br />
margin for Ruqigou and Wuda, for all the scenes processed and analyzed. For Wuda, the Yellow River<br />
is included as a reference for a surface with a low daily and medium yearly temperature amplitude.<br />
The thermal band is displayed as band 7, since this <strong>spectral</strong> regi<strong>on</strong> represents the l<strong>on</strong>gest wavelengths.<br />
Coal Shadow margin Shadow<br />
Figure 7-7: Temporal <strong>spectral</strong> variability of three surfaces for eight time steps in Ruqigou mining area<br />
- 125 -
From each scene for the three and four surface classes respectively, signature clusters were collected,<br />
exceeding 20 pixels to grant representativity. For shadow and shadow margin these signature clusters<br />
were distributed evenly over the image. They could be defined <str<strong>on</strong>g>based</str<strong>on</strong>g> <strong>on</strong> analyst knowledge with the<br />
support of an illuminati<strong>on</strong> file. This file was created with the DEM and the appropriate sun angle<br />
depending <strong>on</strong> the date of the scene. Water from the Yellow River could be identified in the time series<br />
from 1987 until today without necessary ground truth polyg<strong>on</strong>s. The definiti<strong>on</strong> of clear <str<strong>on</strong>g>coal</str<strong>on</strong>g> signature<br />
clusters was supported by ground mappings of 2002 and 2003 for the datasets of September,<br />
December, February and May and by old mining informati<strong>on</strong> available from the Wuda mines and from<br />
former projects (ROSEMA et al. 1999). The mean of the signature clusters as well as the standard<br />
deviati<strong>on</strong> of the surface class was calculated for each ETM+ band as shown in the diagrams.<br />
Coal Shadow margin Shadow Yellow River<br />
Figure 7-8: Temporal <strong>spectral</strong> variability of four surfaces for eight time steps in Wuda area<br />
- 126 -
Figure 7-7 displays the averaged mean spectra of the three surfaces of interest including the surface<br />
specific error bars (+/- <strong>on</strong>e standard deviati<strong>on</strong>) for Ruqigou. The following statements are made:<br />
1. Over all wavelengths and during all times do reflectance and emittance spectra of shadow<br />
margin exceed the mean values of shadow in the VIS, the MIR and the TIR.<br />
2. Spectra of <str<strong>on</strong>g>coal</str<strong>on</strong>g> in band 1, 2 and 3 have in all but the 1987 scene a slightly higher reflectance<br />
than shadow margin and shadow. They are never zero.<br />
3. Coal reflectances (taking standard deviati<strong>on</strong>s into account) do not exceed 8% reflectance for<br />
bands 1, 2 and 3 – except for the scene from 09/2002<br />
4. Coal reflectances (taking standard deviati<strong>on</strong>s into account) do not exceed 10% reflectance for<br />
band 4 – except for the scene from 09/2002<br />
5. In all images but the 1999 scene do <str<strong>on</strong>g>coal</str<strong>on</strong>g> surfaces reflect more radiati<strong>on</strong> in band 5 and 6<br />
(actually official Landsat-7 ETM+ band 7) than shadow and shadow margin.<br />
6. For all scenes and during all times do mean <str<strong>on</strong>g>coal</str<strong>on</strong>g> signatures show over 7% reflectance in bands<br />
5 and 6. When the standard error is taken into c<strong>on</strong>siderati<strong>on</strong>, all <str<strong>on</strong>g>coal</str<strong>on</strong>g> surfaces exceed 5%<br />
reflectance – except in the scene from 09/2002<br />
7. Coal surfaces show the highest temperatures in all scenes and at any time. Negative<br />
temperatures do not occur. Mean temperatures exceed 15 degrees in all scenes.<br />
8. Shaded surfaces in winter have negative temperatures at 10:30 satellite overpass time. Shade<br />
margins exhibit mean negative temperatures, but a much higher temperature variance.<br />
9. The positive and negative standard deviati<strong>on</strong> for <str<strong>on</strong>g>coal</str<strong>on</strong>g> and shadow margin in the thermal band<br />
overlap in two (09/2002, 05/2003) out of eight scenes.<br />
10. The positive and negative standard deviati<strong>on</strong> for <str<strong>on</strong>g>coal</str<strong>on</strong>g> and shadow in the thermal band overlap<br />
in <strong>on</strong>e (05/2003) out of eight scenes.<br />
11. The <strong>spectral</strong> variance within all bands for the scene of September 2002 is extraordinarily high<br />
for all surfaces. This scene has outlier characteristics.<br />
Figure 7-8 displays the averaged mean spectra of the four surfaces of interest including the specific<br />
error bars (+/- <strong>on</strong>e standard deviati<strong>on</strong>) for Wuda. Interpretati<strong>on</strong> allows the following statements:<br />
1. Statements 1, 2, 3, 6 and 8 for the scenes of Ruqigou fully apply for the scenes of Wuda.<br />
2. Statement 4 for the scenes of Ruqigou fully applies for all scenes of Wuda, where <strong>spectral</strong><br />
reflectances of <str<strong>on</strong>g>coal</str<strong>on</strong>g> never exceeds 10% in band 4.<br />
3. Statement 5 for Ruqigou applies for the Wuda regi<strong>on</strong> as well, except when the standard<br />
deviati<strong>on</strong> is taken into c<strong>on</strong>siderati<strong>on</strong>. Under these circumstances <str<strong>on</strong>g>coal</str<strong>on</strong>g> surfaces do not reflect<br />
more EMR in band 5 and 6 than shadow and shadow margin for the scenes from 1987, 1999<br />
and 09/2002.<br />
4. C<strong>on</strong>cerning statement 9 for Ruqigou it needs to be noted that in Wuda the positive and<br />
negative standard deviati<strong>on</strong> for <str<strong>on</strong>g>coal</str<strong>on</strong>g> and shadow margin in the thermal band overlap in no<br />
scene.<br />
5. Unlike for the regi<strong>on</strong> of Ruqigou there seems to be no outlier in the scenes of Wuda. This is<br />
expected, since radiometric calibrati<strong>on</strong> and correcti<strong>on</strong> could be undertaken with higher<br />
accuracy. More <strong>spectral</strong> ground samplings were available for Wuda. Furthermore, the terrain<br />
in Wuda is less challenging for scene radiometric normalizati<strong>on</strong>.<br />
- 127 -
Coal<br />
Shadow margin<br />
Shadow<br />
Rivers<br />
Deep lakes<br />
Shallow lakes<br />
Figure 7-9: Spatial <strong>spectral</strong> variability of 3 to 6 surfaces in the transfer regi<strong>on</strong>s Baotou in China, Jharia in<br />
India, and Leigh Creek <str<strong>on</strong>g>coal</str<strong>on</strong>g> mining area in Australia<br />
6. The Yellow River exhibits reflectances in band 1, 2, 3 and 4, which always exceed reflectance<br />
values of <str<strong>on</strong>g>coal</str<strong>on</strong>g>, shadow and shadow margin. In band 5 and 6 the Yellow River exhibits lower<br />
reflectances than <str<strong>on</strong>g>coal</str<strong>on</strong>g>, shadow and shadow margin for all 8 time steps.<br />
7. Temperatures of the Yellow River are in all scenes close to those of shadow and shadow<br />
margin. This does not apply for the winter scenes, where temperatures of the river are higher.<br />
One excepti<strong>on</strong> is the scene from February 2003, where the Yellow River is frozen and<br />
negative temperatures occur. The frozen surface also explains the extremely high variability of<br />
the reflectance in the VIS and NIR (bands 1-4) in this scene.<br />
8. Except for the phenomen<strong>on</strong> menti<strong>on</strong>ed under statement 7, spectra of the Yellow River present<br />
very low standard deviati<strong>on</strong>s of reflectances in all bands.<br />
Figure 7-9 displays the averaged mean spectra of up to six surfaces of interest including the specific<br />
error bars (+/- <strong>on</strong>e standard deviati<strong>on</strong>) for the Leigh Creek in Australia, the Baotou area in China and<br />
the Jharia area in India. The following statements can be made:<br />
1. Statements 1, 2, 3, 4, 6, 7, 9, 10, 12 and 13 c<strong>on</strong>cluded for the 8 time steps of Ruqigou fully<br />
apply for the three scenes of the transfer <str<strong>on</strong>g>areas</str<strong>on</strong>g>, which were acquired over regi<strong>on</strong>s far away<br />
from the study <str<strong>on</strong>g>areas</str<strong>on</strong>g>. No excepti<strong>on</strong>s occur.<br />
2. Statement 6 and 8 made for Wuda also apply for the scene of Baotou, which includes the<br />
northern part of the Yellow River.<br />
3. Statement 2 c<strong>on</strong>cluded from the Ruqigou regi<strong>on</strong> and applicable for the Wuda regi<strong>on</strong> does not<br />
apply in the transfer <str<strong>on</strong>g>areas</str<strong>on</strong>g>. The reflectance of <str<strong>on</strong>g>coal</str<strong>on</strong>g> in bands 1, 2 and 3 is <strong>on</strong>ly in the scene of<br />
Baotou higher than the reflectances for shadow and shadow margin. For the scenes of India<br />
and Australia <str<strong>on</strong>g>coal</str<strong>on</strong>g> exhibits lower <strong>spectral</strong> values in these three bands.<br />
The insights and understandings gained from the signature analysis will support the automated surface<br />
extracti<strong>on</strong> as presented in the following two chapters 8 and 9.<br />
- 128 -
8. Knowledge Based Surface Extracti<strong>on</strong><br />
8.1. Set Up of the Knowledge Based Test Sequence<br />
Based <strong>on</strong> the analysis results of the multitemporal and multispatial signature analysis presented in<br />
chapter 7 a sequential knowledge <str<strong>on</strong>g>based</str<strong>on</strong>g> approach for the extracti<strong>on</strong> of <str<strong>on</strong>g>coal</str<strong>on</strong>g>, vegetati<strong>on</strong> and burned<br />
rock has been developed. The <strong>test</strong> sequence developed here bases <strong>on</strong> the principles of knowledge<br />
<str<strong>on</strong>g>based</str<strong>on</strong>g> classificati<strong>on</strong> or decisi<strong>on</strong> tree classificati<strong>on</strong> as presented in chapter 3.5. In this subchapter (3.5.)<br />
examples for other decisi<strong>on</strong> trees or <strong>test</strong> <strong>sequences</strong> in literature are given. The sequence designed here<br />
incorporates informati<strong>on</strong> <strong>on</strong> the <strong>spectral</strong> signature over all bands, single band thresholds, synthetic<br />
bands, informati<strong>on</strong> from the digital elevati<strong>on</strong> model and land surface temperature (LST) informati<strong>on</strong>.<br />
Threshold c<strong>on</strong>diti<strong>on</strong>s defining yes-no nodes were defined supported by the signature analysis in such<br />
way as to yield the best results for each scene without adapting thresholds specifically. Therefore,<br />
many empirical <strong>test</strong>s were performed <strong>on</strong> over numerous Landsat and Aster data sets. The knowledge<br />
<str<strong>on</strong>g>based</str<strong>on</strong>g> sequence can therefore run <strong>on</strong> multilayer Landsat-5 TM, Landsat-7 ETM+ and Aster data<br />
including all channels except the panchromatic band. This band was excluded due to its large file size<br />
(equivalent to 4 multi<strong>spectral</strong> bands) and the “smearing” of wavelength informati<strong>on</strong> due to the large<br />
bandwidth. The <strong>test</strong> <strong>sequences</strong> act as filters defining boundary c<strong>on</strong>diti<strong>on</strong>s to determine, if a pixel will<br />
be counted to the class “<str<strong>on</strong>g>coal</str<strong>on</strong>g>” or “no <str<strong>on</strong>g>coal</str<strong>on</strong>g>”, “dense vegetati<strong>on</strong>” or “no dense vegetati<strong>on</strong>”,<br />
“pyrometamorphic rock” or “no pyrometamorphic rock”. Though n<strong>on</strong>e of the threshold <strong>test</strong>s al<strong>on</strong>e is<br />
sufficient to clearly demarcate the specified <str<strong>on</strong>g>areas</str<strong>on</strong>g> the combinati<strong>on</strong> of the criteria gives good results for<br />
the automated extracti<strong>on</strong>. In the following, the designed <strong>test</strong> <strong>sequences</strong> for the three surface classes are<br />
presented.<br />
8.1.1. Automated Extracti<strong>on</strong> of Coal Surfaces<br />
Test 1: Synthetic <strong>spectral</strong> mean <strong>test</strong> SMP 123457<br />
From all input bands except the thermal channel a synthetic band is calculated, c<strong>on</strong>taining the <strong>spectral</strong><br />
mean (SPM) of each pixel over all bands. This mean channel gives an indicati<strong>on</strong> of the albedo of a<br />
surface over the whole covered wavelength regi<strong>on</strong>. Surface classes like <str<strong>on</strong>g>coal</str<strong>on</strong>g>, water or shadow have<br />
low <strong>spectral</strong> mean values due to their overall low reflectance in the VIS, NIR and MIR.<br />
a<br />
N<br />
b<br />
N<br />
Figure 8-1 a-b: Synthetic <strong>spectral</strong> mean channel over bands 1, 2, 3, 4, 5 and 7 (a); result after the first <strong>test</strong>:<br />
pixels, which passed the <strong>test</strong> are presented in white and include <str<strong>on</strong>g>coal</str<strong>on</strong>g>, shadow and very dark water pixels (b).<br />
Center coordinate: 650705E, 4373287N, UTM, Z48 N.<br />
- 129 -
In the strict sense of course shadow will yield now <strong>spectral</strong> signal. However, the principle of shadow<br />
and shadow margin has already been introduced in chapter 7 and is of importance for the separati<strong>on</strong> of<br />
surface classes. This c<strong>on</strong>cept is also presented in the <strong>spectral</strong> mean figures 8-2 and 8-3.<br />
ρ [%] SPM 123457 ≥ 1 and ρ [%] SPM 123457 ≤ 10 (8.1)<br />
For the synthetic mean channel of bands 1, 2, 3, 4, 5 and 7 a lower threshold was defined at an average<br />
reflectance of 1 % and an upper threshold was defined at 10 % reflectance as dem<strong>on</strong>strated by<br />
equati<strong>on</strong> (relati<strong>on</strong>) 8.1.<br />
Coal Shadow margin Shadow<br />
Figure 8-2: Spectral mean for bands 123457 and bands 123 for eight time steps for the Ruqigou area. Presented<br />
are the surface types <str<strong>on</strong>g>coal</str<strong>on</strong>g>, shadow margin and shadow.<br />
- 130 -
As it could already be noted in the signature analysis diagrams representing signature mean and<br />
variance in chapter 7 the effect of radiometric differences becomes also apparent in figure 8-2. If all<br />
scenes would have a perfectly adjusted radiometry variati<strong>on</strong> in SPM mean and variance should not<br />
occur or should <strong>on</strong>ly occur within a very slim range. However, it can be noted that even after a very<br />
thorough preprocessing radiometric inter scene variati<strong>on</strong>s still remain. They may result from changes<br />
in the material, different illuminati<strong>on</strong> c<strong>on</strong>diti<strong>on</strong>s and different atmospheric c<strong>on</strong>diti<strong>on</strong>s as well as sensor<br />
instabilities. Much time was spent for the calibrati<strong>on</strong> of the time series and it is assumed that the time<br />
series correcti<strong>on</strong> results can hardly be improved. This shows the limits of quantitative remote sensing,<br />
where even ground reflectances or land surface temperatures always underly a certain error range.<br />
Test 2: Synthetic <strong>spectral</strong> mean <strong>test</strong> SMP 123<br />
Additi<strong>on</strong>ally, a SPM was calculated over the visible bands 1, 2 and 3. For the synthetic mean channel<br />
of bands 1, 2, and 3 a lower threshold was defined at an average reflectance of 1 % and an upper<br />
threshold was defined at 7 % reflectance.<br />
ρ [%] SPM 123 ≥ 1 and ρ [%] SPM 123 ≤ 7 (8.2)<br />
These first two thresholds help to demarcate <str<strong>on</strong>g>coal</str<strong>on</strong>g> surfaces from other geologic surfaces. Shadow,<br />
shadow margin, deep water and some outlier pixels like e.g. very few pixels of the Yellow River can<br />
not be excluded or separated yet.<br />
The thresholds were defined <str<strong>on</strong>g>based</str<strong>on</strong>g> <strong>on</strong> the analyses of the <strong>spectral</strong> mean characteristics of <str<strong>on</strong>g>coal</str<strong>on</strong>g>, shadow<br />
and shadow margin as presented in figure 8-2 for Ruqigou and figure 8-3 for Wuda. For Ruqigou the<br />
SPM 123457 ranges between 3 % and 8 % not taking the standard deviati<strong>on</strong> (SD) into account. Including<br />
the SD it ranges between 2 % and 9 %, including the outlier scene of 09/2002 between 1 and 10 %.<br />
For the <strong>spectral</strong> mean of <str<strong>on</strong>g>coal</str<strong>on</strong>g> for bands 1, 2 and 3 reflectance varies between 1% and 5%, including<br />
the SD and the outlier scene between 0% and 7%. The lower margin is not defined at 0% due to <strong>test</strong> 3.<br />
For Wuda the SPM 123457 ranges between 4% and 8% not taking the SD into account. Including the SD<br />
it ranges between 3 % and 9 %. For the <strong>spectral</strong> mean of <str<strong>on</strong>g>coal</str<strong>on</strong>g> for bands 1, 2 and 3 reflectance varies<br />
between 2 % and 4 %; including the SD between 0% and 5%. Pixels of the Yellow River usually do<br />
not interfere with the thresholds defined – however, in figure 3-8 it can be seen that for the scene of<br />
1987 the river reaches a very low SPM 123457 . It lies within the error range of <str<strong>on</strong>g>coal</str<strong>on</strong>g>.<br />
Coal Shadow margin Shadow Yellow River<br />
Figure 8-3: Spectral mean for bands 123457 and bands 123 for eight time steps for the Wuda area<br />
- 131 -
Coal Shadow margin Shadow Yellow River<br />
Figure 8-3 c<strong>on</strong>t’d: Spectral mean for bands 123457 and bands 123 for eight time steps for the Wuda area<br />
Test 3: Shadowed area <strong>test</strong>s<br />
As discussed in chapter 7, c<strong>on</strong>flict situati<strong>on</strong>s may occur, where it will be difficult to separate <str<strong>on</strong>g>coal</str<strong>on</strong>g> from<br />
deep clear water or shadow in radiometrically corrected but n<strong>on</strong> transformed images. This is also<br />
obvious in figure 8.1., where some shadowed <str<strong>on</strong>g>areas</str<strong>on</strong>g> were extracted east of the Yellow River, in the<br />
central limest<strong>on</strong>e complex and to a slight extend in the southwestern metamorphic complex. These<br />
pixels also passed the two <strong>spectral</strong> mean <strong>test</strong>s. They can be further reduced with the following <strong>test</strong>s:<br />
- 132 -<br />
Shadow file from ATCOR = 0 (8.3.)<br />
ρ [%] SPM 123457 = 0 (8.4.)<br />
ρ [%] SPM 123 = 0 (8.5.)<br />
ρ [%] band 1 = 0 (8.6.)<br />
ρ [%] band 2 = 0 (8.7.)<br />
ρ [%] band 3 = 0 (8.8.)<br />
The first <strong>test</strong> includes the shadow-file, which is created during illuminati<strong>on</strong> correcti<strong>on</strong> in ATCOR (see<br />
chapter 5). This <strong>test</strong> is similar to the retrieval and exclusi<strong>on</strong> of shadowed <str<strong>on</strong>g>areas</str<strong>on</strong>g> out of a DEM-derived<br />
illuminati<strong>on</strong> file directly. This calculati<strong>on</strong> does not have to be repeated, since this file already exists.
Fully shadowed regi<strong>on</strong>s (shadow file = 0) are defined as <str<strong>on</strong>g>areas</str<strong>on</strong>g>, where the pixel c<strong>on</strong>sists purely of<br />
shade and the geometry between the pixel (relief), sun and satellite does not allow for a return signal<br />
in these wavelengths. In c<strong>on</strong>trast, other shadowed pixels may <strong>on</strong>ly c<strong>on</strong>tain part of a shadow (e.g.<br />
shadow margin) and therefore allow for a weakened <strong>spectral</strong> signal. Such shadowed <str<strong>on</strong>g>areas</str<strong>on</strong>g>, which are<br />
not excluded in the shadow file can fulfill all or some of the equati<strong>on</strong>s 8.4 to 8.8. They can therefore<br />
be excluded and will not be interpreted as <str<strong>on</strong>g>coal</str<strong>on</strong>g> surfaces. Only pixels not fulfilling any of the equati<strong>on</strong>s<br />
will c<strong>on</strong>tinue in the <strong>test</strong> sequence.<br />
a<br />
N<br />
b<br />
N<br />
Figure 8-4 a-b: Visible band displayed in gray scale mode (a) and shadowed <str<strong>on</strong>g>areas</str<strong>on</strong>g> extracted by <strong>test</strong> 3 supported<br />
by available illuminati<strong>on</strong> data derived from a DEM. Here presented for the str<strong>on</strong>gly shadowed area of Ruqigou.<br />
Center coordinate: 607794E, 4336506N, UTM, Z48N<br />
Figure 8-5 <strong>on</strong> the next page dem<strong>on</strong>strates the relati<strong>on</strong>ship between the extent of the shadowed area<br />
excluded with the <strong>test</strong>s presented above in relati<strong>on</strong> to the acquisiti<strong>on</strong> date of the satellite scene. It can<br />
be noted that the scene acquired in summer (high sun elevati<strong>on</strong> angle) yields a smaller proporti<strong>on</strong> of<br />
shadowed <str<strong>on</strong>g>areas</str<strong>on</strong>g> than the scene from fall. The fall scene again yields a smaller proporti<strong>on</strong> of shadowed<br />
<str<strong>on</strong>g>areas</str<strong>on</strong>g> than the scene acquired at very low sun angles in winter.<br />
Figure 8-5: Relati<strong>on</strong>ship between number of excluded<br />
shadow pixels and scene acquisiti<strong>on</strong> date; calculated for<br />
three scenes of the Ruqigou area for the m<strong>on</strong>ths of<br />
August, October and December. As expected, the area<br />
eliminated by <strong>test</strong> 3 (pixels do not undergo further<br />
<strong>test</strong>ing for “<str<strong>on</strong>g>coal</str<strong>on</strong>g>”) increases with decreasing sun angles.<br />
Test 4: NIR <strong>test</strong><br />
This <strong>test</strong> excludes pixels, which’ reflectance is too high in the NIR band 4 to bel<strong>on</strong>g to the class <str<strong>on</strong>g>coal</str<strong>on</strong>g>.<br />
Pixels, which pass this <strong>test</strong> c<strong>on</strong>tinue in the <strong>test</strong>ing sequence, pixels, which do not pass the <strong>test</strong> are<br />
excluded for further analysis. See chapter 7 for signature analysis of band 4.<br />
ρ [%] band 4 ≤ 10 (8.9.)<br />
- 133 -
Test 5: Test for water surface exclusi<strong>on</strong><br />
This <strong>test</strong> supports the exclusi<strong>on</strong> of water surfaces, which might still be left within the remaining pixels,<br />
which passed <strong>test</strong>s 1 and 2 and 4 and were not excluded by <strong>test</strong> 3. Water surfaces often have low<br />
overall albedo and therefore may pass <strong>test</strong> 1 and 2. Their differentiati<strong>on</strong> criteri<strong>on</strong> to <str<strong>on</strong>g>coal</str<strong>on</strong>g> is that they<br />
usually exhibit lower reflectances in band 5 and band 6. Here, the spectrum of water has decreasing<br />
reflectances from blue to the MIR. (The Yellow River is a special case due to its high sediment and<br />
algae c<strong>on</strong>tent and is usually already excluded by <strong>test</strong> 2 and 4).<br />
ρ [%] band 5 ≥ 5 (8.10.)<br />
ρ [%] band 6 ≥ 5 (8.11.)<br />
ρ [%]bands 4, 5, 7 > 0 (8.12)<br />
Pixels, which do pass this <strong>test</strong> c<strong>on</strong>tinue in the <strong>test</strong> sequence, pixels which do not fulfill the criteria of<br />
inequalities 8.10. and 8.11. are assumed to be water surfaces. If inequality 8.12. is fulfilled these are<br />
either shadow surfaces (which were already excluded by <strong>test</strong> 3, equati<strong>on</strong> 8.4), or water surfaces of<br />
extremely low reflectance. See chapter 7 for signature analysis in the above menti<strong>on</strong>ed bands.<br />
Test 6: Temperature <strong>test</strong><br />
As menti<strong>on</strong>ed in chapter 7 the inclusi<strong>on</strong> of the thermal band can improve the separability of classes.<br />
The thermal band (calibrated and radiometrically corrected to LST as presented in chapter 5) is<br />
included in the threshold sequence to exclude all pixels, which passed <strong>test</strong> 1 and <strong>test</strong> 2, did not pass<br />
<strong>test</strong> 3 and passed <strong>test</strong>s 4 and 5, but which have temperatures not suitable for <str<strong>on</strong>g>coal</str<strong>on</strong>g> surfaces.<br />
Problematic about this <strong>test</strong> is that the temperature behavior of a surface changes over the year. Daily<br />
and annual amplitudes of a surface are not <strong>on</strong>ly a functi<strong>on</strong> of the surface’s thermal inertia but also of<br />
l<strong>on</strong>gitude and latitude, elevati<strong>on</strong>, microclimatic locati<strong>on</strong> and str<strong>on</strong>gly depend <strong>on</strong> the seas<strong>on</strong>s climate,<br />
shading, wind, snow cover etc. It is not possible to define a fixed absolute temperature threshold<br />
applicable for several regi<strong>on</strong>s and multi date imagery. Even though for each scene an adjusted<br />
temperature threshold can be defined, which yields – judged <strong>on</strong> the basis of visual validati<strong>on</strong> – an<br />
optimal <str<strong>on</strong>g>coal</str<strong>on</strong>g> extracti<strong>on</strong> for each scene, such individual thresholds are not applicable for a transferable<br />
algorithm. Therefore – next to an absolute threshold fitting all scenes – a relative temperature <strong>test</strong> was<br />
defined. This relative approach is transferable from scene to scene. It might not yield as exact results<br />
as an absolute threshold but allows for multi scene processing.<br />
ρ [°C] band 6 ≥ 16 (8.13.)<br />
ρ [°C] > Global mean band 6 [°C] (8.14.)<br />
Here ρ is emissi<strong>on</strong> of thermal radiati<strong>on</strong>, which may not be c<strong>on</strong>fused with emissivity. With c<strong>on</strong>diti<strong>on</strong><br />
8.14. it is <strong>test</strong>ed, if the pixel under investigati<strong>on</strong> has a temperature exceeding the global mean of the<br />
thermal band. This is <str<strong>on</strong>g>based</str<strong>on</strong>g> <strong>on</strong> the finding that shaded pixels (cooler) are located left of the global<br />
mean of band 6, whereas <str<strong>on</strong>g>coal</str<strong>on</strong>g> pixels are located right (warmer) of the global temperature mean. See<br />
chapter 7 for temperature behavior of the surfaces for the individual scenes.<br />
- 134 -
a<br />
N<br />
b<br />
N<br />
Figure 8-6 a-b: Pixels which passed <strong>test</strong>s 1, 2, 4 and 5 and were not excluded by <strong>test</strong> 3 (white) in the left image<br />
(a), result after the final relative temperature <strong>test</strong> 6 (b), Center coordinate: 650705E, 4373287N, UTM, Z48 N<br />
Pixels, which pass <strong>test</strong> 1, 2, 4, 5 and 6 and which do not pass <strong>test</strong> 3 are defined as <str<strong>on</strong>g>coal</str<strong>on</strong>g> pixels. This<br />
final result of the knowledge <str<strong>on</strong>g>based</str<strong>on</strong>g> <str<strong>on</strong>g>coal</str<strong>on</strong>g> extracti<strong>on</strong> developed undergoes a majority filtering with a 3 ×<br />
3 matrix. This statistical filter excludes single scattered pixels, which are likely to be false alarms.<br />
Though these are small in number they would lead to the definiti<strong>on</strong> of larger <str<strong>on</strong>g>coal</str<strong>on</strong>g> <str<strong>on</strong>g>fire</str<strong>on</strong>g> <str<strong>on</strong>g>risk</str<strong>on</strong>g> <str<strong>on</strong>g>areas</str<strong>on</strong>g> when<br />
a single pixel is surrounded with a delineati<strong>on</strong> z<strong>on</strong>e. Following this filter applicati<strong>on</strong>, a delineati<strong>on</strong><br />
area with 500 meter radius is calculated around the <str<strong>on</strong>g>areas</str<strong>on</strong>g> designated as <str<strong>on</strong>g>coal</str<strong>on</strong>g>.<br />
8.1.2. Automated Extracti<strong>on</strong> of Densely Vegetated Areas<br />
It is impossible to map vegetati<strong>on</strong> density in such a disturbed and undulating terrain over a larger area<br />
without the help of color air photographs and highly interactive interpretati<strong>on</strong>- and analyzing<br />
techniques. Therefore, the questi<strong>on</strong> arose, how the observati<strong>on</strong> in the field (zero or <strong>on</strong>ly dead and<br />
degraded vegetati<strong>on</strong> above active <str<strong>on</strong>g>coal</str<strong>on</strong>g> <str<strong>on</strong>g>fire</str<strong>on</strong>g>s) could be incorporated into the <str<strong>on</strong>g>coal</str<strong>on</strong>g> <str<strong>on</strong>g>fire</str<strong>on</strong>g> area demarcati<strong>on</strong><br />
scheme without the need for ground vegetati<strong>on</strong> mapping and additi<strong>on</strong>al data. Therefore, a vegetati<strong>on</strong><br />
index – a comm<strong>on</strong>ly used measure for vegetati<strong>on</strong> density and vigor – (CRIPPEN, 1990) is derived from<br />
the preprocessed satellite data. The use of <strong>spectral</strong> indices is straightforward and computati<strong>on</strong>ally easy.<br />
Nevertheless, the drawbacks are that their performance for senescent vegetati<strong>on</strong> is not satisfactory and<br />
that the impact of the soil background <strong>on</strong> <strong>spectral</strong> indices is often significant. In case of the most<br />
comm<strong>on</strong>ly used Normalized Differential Vegetati<strong>on</strong> Index (NDVI), 20% of the variati<strong>on</strong> can be<br />
explained by soil color background (VAN DER MEER & DE JONG 2001, KUEMMERLE 2003). Therefore<br />
many studies focused <strong>on</strong> SMA to map vegetati<strong>on</strong> quantitatively. However, within this knowledge<br />
<str<strong>on</strong>g>based</str<strong>on</strong>g> <strong>test</strong> sequence it is not the goal to map vegetati<strong>on</strong> <strong>on</strong> a quantitative basis, but to roughly<br />
differentiate low, medium and high vegetati<strong>on</strong> density in the satellite data. The NDVI is defined as :<br />
NDVI = (ρ NIR – ρ Red ) / (ρ NIR + ρ Red ) (8.15)<br />
where ρ NIR is the reflectance in the NIR and ρ Red is the reflectance in the red channel; in the case of<br />
Landsat-7 NDVI = (band 4 – band 3) / (band 4 + band 3). The NDVI is extensively used to m<strong>on</strong>itor<br />
vegetati<strong>on</strong> <strong>on</strong> country-wide, c<strong>on</strong>tinental or global scales. However, it is a less reliable indicator of<br />
vegetati<strong>on</strong> biomass if the ground cover is low, as it is the case in arid and semi-arid regi<strong>on</strong>s<br />
- 135 -
(SCHOWENGERDT 1997, CRIPPEN 1990). Here, the Soil Adjusted Vegetati<strong>on</strong> Index (SAVI) is more<br />
efficient in estimating vegetati<strong>on</strong> density:<br />
SAVI = (ρ NIR – ρ Red ) / (ρ NIR + ρ Red + L) (1 + L) (8.16)<br />
where L is a c<strong>on</strong>stant between zero and <strong>on</strong>e, which is empirically determined to minimize the<br />
sensitivity of the vegetati<strong>on</strong> index to soil background reflectance variati<strong>on</strong>. When L is zero, the SAVI<br />
equals the NDVI. For intermediate vegetati<strong>on</strong> cover the SAVI ranges around 0.5. This value proved<br />
useful <str<strong>on</strong>g>based</str<strong>on</strong>g> <strong>on</strong> the results of other projects in<br />
similar <str<strong>on</strong>g>areas</str<strong>on</strong>g> and was applied here also. Due to<br />
the mainly arid study <str<strong>on</strong>g>areas</str<strong>on</strong>g> as well as semi-arid<br />
Coal <str<strong>on</strong>g>fire</str<strong>on</strong>g><br />
syncline<br />
Artemisia<br />
shrubs<br />
N<br />
transfer <str<strong>on</strong>g>areas</str<strong>on</strong>g> (two out of three), the SAVI was<br />
preferred to the NDVI and was used for further<br />
analysis. In figure 8-7 the relati<strong>on</strong>ship between<br />
vegetati<strong>on</strong> density and the SAVI distributi<strong>on</strong><br />
becomes apparent. Lowest SAVI values can be<br />
found in the area covered by the Yellow River.<br />
Very high SAVI values occur within the<br />
agricultural <str<strong>on</strong>g>areas</str<strong>on</strong>g> al<strong>on</strong>gside the river. The lighter<br />
part in the central South is an alluvial fan<br />
densely covered with Artemisia shrubs.<br />
Figure 8-7: SAVI image of Wuda area <strong>on</strong> 21.09.2002.<br />
To quantitatively prove the relati<strong>on</strong>ship between <str<strong>on</strong>g>coal</str<strong>on</strong>g> <str<strong>on</strong>g>fire</str<strong>on</strong>g> existence and very low vegetati<strong>on</strong> density in<br />
these <str<strong>on</strong>g>areas</str<strong>on</strong>g> the following calculati<strong>on</strong>s were undertaken. The SAVI image was scaled from originally -<br />
1.5 to 1.5 (float) to 0-150. To analyze the behavior of the SAVI in relati<strong>on</strong> to the 16 <str<strong>on</strong>g>coal</str<strong>on</strong>g> <str<strong>on</strong>g>fire</str<strong>on</strong>g>s located<br />
within the Wuda syncline statistical parameters were investigated with respect to the <str<strong>on</strong>g>coal</str<strong>on</strong>g> <str<strong>on</strong>g>fire</str<strong>on</strong>g> <str<strong>on</strong>g>areas</str<strong>on</strong>g><br />
mapped in 2002 and 2003. Therefore an algorithm was developed, which calculates the minimum,<br />
maximum and mean of the SAVI data<br />
within the 16 <str<strong>on</strong>g>coal</str<strong>on</strong>g> <str<strong>on</strong>g>fire</str<strong>on</strong>g> polyg<strong>on</strong>s.<br />
50<br />
Following, these statistic parameters<br />
of SAVI were calculated separately<br />
40<br />
within the <str<strong>on</strong>g>fire</str<strong>on</strong>g> z<strong>on</strong>e and four buffer<br />
z<strong>on</strong>es of equal size in increasing<br />
30<br />
distance to the mapped <str<strong>on</strong>g>coal</str<strong>on</strong>g> <str<strong>on</strong>g>fire</str<strong>on</strong>g><br />
20<br />
polyg<strong>on</strong>. Resulting, a regi<strong>on</strong>al<br />
increase of the SAVI with growing<br />
10<br />
distance from the <str<strong>on</strong>g>coal</str<strong>on</strong>g> <str<strong>on</strong>g>fire</str<strong>on</strong>g> polyg<strong>on</strong><br />
could be detected as presented in<br />
0<br />
1 2 3 4 5<br />
figure 8-8.<br />
SAVI (0-150)<br />
1=<str<strong>on</strong>g>coal</str<strong>on</strong>g> <str<strong>on</strong>g>fire</str<strong>on</strong>g> polyg<strong>on</strong>, 2=0-150m, 3=150-300m, 4=300-450m, 5=450-600m<br />
Figure 8-8: Spatial pattern of the average SAVI in buffer z<strong>on</strong>es around the active <str<strong>on</strong>g>coal</str<strong>on</strong>g> <str<strong>on</strong>g>fire</str<strong>on</strong>g>s #6, #7, #8 and #11<br />
of Wuda syncline.<br />
- 136 -
There is no positive relati<strong>on</strong>ship stating that a low NDVI or SAVI gives any distinct indicati<strong>on</strong> <strong>on</strong> the<br />
occurrence of a <str<strong>on</strong>g>coal</str<strong>on</strong>g> <str<strong>on</strong>g>fire</str<strong>on</strong>g> area. Regi<strong>on</strong>s of extremely little to no vegetati<strong>on</strong> cover also exist e.g. in<br />
settled <str<strong>on</strong>g>areas</str<strong>on</strong>g>, al<strong>on</strong>g infrastructure and industry or in n<strong>on</strong> vegetated parts of the desert. However, above<br />
active <str<strong>on</strong>g>coal</str<strong>on</strong>g> <str<strong>on</strong>g>fire</str<strong>on</strong>g>s no dense vegetati<strong>on</strong> will exist. The goal of vegetati<strong>on</strong> extracti<strong>on</strong> within the knowledge<br />
<str<strong>on</strong>g>based</str<strong>on</strong>g> <strong>test</strong> sequence must therefore be to automatically extract <str<strong>on</strong>g>areas</str<strong>on</strong>g> of high vegetati<strong>on</strong> density. These<br />
can be excluded as a currently active <str<strong>on</strong>g>coal</str<strong>on</strong>g> <str<strong>on</strong>g>fire</str<strong>on</strong>g> area.<br />
Test 1: Test for densely vegetated <str<strong>on</strong>g>areas</str<strong>on</strong>g><br />
To extract <str<strong>on</strong>g>areas</str<strong>on</strong>g>, which are agriculturally used as well as <str<strong>on</strong>g>areas</str<strong>on</strong>g>, which are covered by a higher density<br />
of semiarid shrub coverage, the following two inequalities prove to be a transferable and reliable<br />
combinati<strong>on</strong>. The thresholds were found via empirical <strong>test</strong>s with all scenes.<br />
SAVI xy > 0.4 (8.17)<br />
SPM 123457 > 10 (8.18).<br />
N<br />
Figure 8-9: Result of the vegetati<strong>on</strong> <strong>test</strong> for Wuda area,<br />
white: dense vegetati<strong>on</strong>, black <str<strong>on</strong>g>areas</str<strong>on</strong>g> below the SAVI<br />
threshold. Center coordinate: 650705E, 4373287N,<br />
UTM, Z48 N<br />
The first c<strong>on</strong>diti<strong>on</strong> yields all pixels, whose<br />
SAVI is higher than 0.4. The threshold could<br />
not be set in a relative way (e.g. > Global<br />
Mean) because the SAVI is a data<br />
independent index. In a scene, where land<br />
cover classes are evenly distributed (from<br />
bare ground to densely vegetated <str<strong>on</strong>g>areas</str<strong>on</strong>g> all<br />
surface cover types available) the SAVI<br />
usually ranges between -1.5 and 1.5, with the<br />
mean ranging around 0. In subsets created<br />
with no vegetati<strong>on</strong> present (pure desert sand)<br />
the SAVI ranges between -0.2 and 0.2. In<br />
subsets created c<strong>on</strong>taining agricultural fields<br />
exclusively the SAVI ranges between 0.5 and<br />
1.2. Based <strong>on</strong> numerous empirical studies it<br />
was therefore c<strong>on</strong>cluded to set the threshold<br />
at +0.4. Pixels passing this <strong>test</strong> will be<br />
excluded from delineated <str<strong>on</strong>g>risk</str<strong>on</strong>g> <str<strong>on</strong>g>areas</str<strong>on</strong>g>.<br />
8.1.3. Automated Extracti<strong>on</strong> of Pyrometamorphic Rock<br />
The extracti<strong>on</strong> of burned rock from satellite data can <strong>on</strong>ly be applied for the regi<strong>on</strong> of Ruqigou. The<br />
largest area of pyrometamorphic rock observed in the field in the Wuda regi<strong>on</strong> was not of sufficient<br />
size to fill the <strong>spectral</strong> signal of a Landsat pixel. For the Ruqigou area the situati<strong>on</strong> is comparable but<br />
not as unfavorable. Here, mapped ground truth of sufficient size for the years 2002 (from mapped<br />
polyg<strong>on</strong>s) and the year 2003 (from mapped polyg<strong>on</strong>s and Quickbird data) exist and approximately 4-5<br />
Landsat pixels in the Ruqigou <str<strong>on</strong>g>coal</str<strong>on</strong>g> <str<strong>on</strong>g>fire</str<strong>on</strong>g> area can be visually observed in the data. These might be<br />
sufficiently influenced by the <strong>spectral</strong> signal of pyrometamorphic rock. However, the algorithm will<br />
have to search for 4-5 pixels within several milli<strong>on</strong> pixels. The burned rock detecti<strong>on</strong> is <strong>on</strong>ly applied<br />
- 137 -
for the Ruqigou scenes of September 2002 and May 2003, since for the other dates no ground truth is<br />
available. The visual retrieval from older date satellite data is not possible for such a complex surface.<br />
a<br />
N<br />
b<br />
N<br />
Figure 8-10: Coal mining area Ruqigou, Landsat image (a), Quickbird image (b). Center coordinate of both<br />
displayed subsets: 59443 E, 4322273 N, UTM Z48N, WGS84. Both images are displayed in real color<br />
combinati<strong>on</strong>: bands 1,2,3 = BGR. The pyrometamorphically changed rocks of reddish color are clearly visible<br />
in the Quickbird image. Only a few pixel in the Landsat image experience a str<strong>on</strong>g enough <strong>spectral</strong> signal to be<br />
c<strong>on</strong>sidered as a 30 × 30 m pixel representing pyrometamorph rock.<br />
Test 1: Test for <strong>spectral</strong> characteristics of burned rock<br />
This <strong>test</strong> is purely <str<strong>on</strong>g>based</str<strong>on</strong>g> <strong>on</strong> the <strong>spectral</strong> observati<strong>on</strong>s of the 4 pixels (figure 8-10a), which coincide<br />
with the locati<strong>on</strong>s of pyrometamorphic rock mapped during the field campaigns. The <strong>test</strong> analyses all<br />
<strong>spectral</strong> channels including the SPM bands as well as the thermal band for the fulfillment of the<br />
following relati<strong>on</strong>s:<br />
ρ [%] band 1 > 10 < 20 (8.19.)<br />
ρ [%] band 2 > 15 35 ≤ 50 (8.23.)<br />
ρ [%]bands 7 > 35 ≤ 50 (8.24.)<br />
ρ [%] band 6 thm ≥ 20 ≤ 25 (8.25.)<br />
ρ [%] SPM 123457 > 25 ≤ 35 (8.26.)<br />
ρ [%] SPM 123 ≥ 20 ≤ 25 (8.27.)<br />
Test 2: Test for the size of clusters extracted in <strong>test</strong> 1<br />
Signature analysis and empirical <strong>test</strong>s with the two scenes of Ruqigou revealed that the <strong>spectral</strong><br />
behavior of the pyrometamorphic rock pixels visually identified are very similar to those of pure<br />
desert sand, not covered by vegetati<strong>on</strong>. This is the case due to the age of pyrometamorphic rocks<br />
exposed in Ruqigou. Pyrometamorphic rocks of the final stage with a very low featureless spectrum<br />
are not abundant in the regi<strong>on</strong> (yet). The pyrometamorphic rocks present are characterized by a very<br />
- 138 -
high overall reflectance, little absorpti<strong>on</strong> features and can easily be mimicked by a pure desert sand<br />
pixel not influenced by vegetati<strong>on</strong>. Therefore the extracti<strong>on</strong> results <str<strong>on</strong>g>based</str<strong>on</strong>g> <strong>on</strong> <strong>test</strong> 1 yield large desert<br />
sand regi<strong>on</strong>s also. The following assumpti<strong>on</strong> can help to further decrease the area extracted:<br />
pyrometamorphic rocks will not be found in clusters exceeding 5 Landsat pixels.<br />
Area Cluster xy ≤ 5 pixels = 4500 m² (8.28)<br />
For no area in the world do <str<strong>on</strong>g>coal</str<strong>on</strong>g> <str<strong>on</strong>g>fire</str<strong>on</strong>g> related publicati<strong>on</strong>s report of pyrometamorphic <str<strong>on</strong>g>areas</str<strong>on</strong>g> of larger<br />
extent. Even the very well known large occurrences in the Kelazha area in northwestern China<br />
(Xinjiang Aut<strong>on</strong>omous Regi<strong>on</strong>, 50 km southwest of Xinjiang’s capitol Urumqi) which were studied<br />
<str<strong>on</strong>g>based</str<strong>on</strong>g> <strong>on</strong> airborne data by ZHANG, J. (1996) do not cover an area larger than 4500 m². Therefore, a<br />
clustering followed by a “sieving” procedure supports the eliminati<strong>on</strong> of some of the surfaces, which<br />
were wr<strong>on</strong>gly extracted. The pixels which passed pyrometamorphic <strong>test</strong> 1 are clustered <str<strong>on</strong>g>based</str<strong>on</strong>g> <strong>on</strong> an<br />
eight pixel neighborhood. Clusters which exceed the size of 5 pixels will not pass the sec<strong>on</strong>d <strong>test</strong> and<br />
are not c<strong>on</strong>sidered to be pyrometamorphic pixels.<br />
Figure 8-11 dem<strong>on</strong>strates the single steps and calculati<strong>on</strong>s of the algorithm. A ETM+ or Aster stack of<br />
surface reflectance data undergoes the <strong>test</strong>ing for the three surfaces of interest as described above.<br />
SPM 123457<br />
SPM<br />
123457<br />
LS 5/7<br />
123457<br />
thermal<br />
SPM 123<br />
SPM<br />
123<br />
Stacking<br />
all 10<br />
bands<br />
SAVI<br />
SAVI<br />
Test 1<br />
SPM<br />
Test 1<br />
SAVI, SPM<br />
Reflect.<br />
DEM<br />
Shd.<br />
file<br />
illuminati<strong>on</strong><br />
illu.<br />
file<br />
threshold<br />
Shd.<br />
file<br />
Test 2<br />
SPM<br />
Test 3<br />
Shd.<br />
Test 4<br />
NIR<br />
Veg.<br />
dense<br />
Cluster<br />
Sieve<br />
Pyro.<br />
rock<br />
Test 5<br />
MIR<br />
intersect<br />
2nd<br />
<str<strong>on</strong>g>risk</str<strong>on</strong>g><br />
area<br />
overlay<br />
result<br />
image<br />
Test 6<br />
Temp.<br />
<str<strong>on</strong>g>coal</str<strong>on</strong>g><br />
3x3 maj.<br />
filter<br />
<str<strong>on</strong>g>coal</str<strong>on</strong>g><br />
filt.<br />
buffering<br />
1st<br />
<str<strong>on</strong>g>risk</str<strong>on</strong>g><br />
area<br />
Figure 8-11: Summarized workflow of the knowledge <str<strong>on</strong>g>based</str<strong>on</strong>g> <strong>test</strong> sequence (not every temporary output file is<br />
shown). After the SPM channels and the SAVI data is generated 16 equati<strong>on</strong>s and inequalities are <strong>test</strong>ed for the<br />
automated extracti<strong>on</strong> of <str<strong>on</strong>g>coal</str<strong>on</strong>g>, 2 equati<strong>on</strong>s are <strong>test</strong>ed for the extracti<strong>on</strong> of dense vegetati<strong>on</strong> and 9 relati<strong>on</strong>ships<br />
need to be fulfilled for a pixel to be assigned to the class of pyrometamorphic rock.<br />
- 139 -
8.1.4. Transfer of the <strong>test</strong> sequence to the Aster Sensor<br />
The above <strong>test</strong> sequence presented the boundary c<strong>on</strong>diti<strong>on</strong>s and thresholds for the automatic extracti<strong>on</strong><br />
from Landsat TM-5 and ETM+ data. The following <strong>test</strong>s present the same approach for Aster data.<br />
Since Aster has more multi<strong>spectral</strong> and thermal bands than Landsat and center wavelengths and<br />
bandwidths do not exactly overlap, the sequence had to be adjusted to this sensor. The fundamentals<br />
and assumpti<strong>on</strong>s for the applied filters are the same. Thus, <strong>on</strong>ly the equati<strong>on</strong>s and inequalities for the<br />
single <strong>test</strong>s are presented.<br />
Test 1: Synthetic <strong>spectral</strong> mean <strong>test</strong> SMP 12345789<br />
ρ [%] SPM 12345789 ≥ 1 and ρ [%] SPM 12345789 ≤ 11 (8.30)<br />
Test 2: Synthetic <strong>spectral</strong> mean <strong>test</strong> SMP 12<br />
ρ [%] SPM 12 ≥ 1 and ρ [%] SPM 12 ≤ 7 (8.31)<br />
Test 3: Shadowed area <strong>test</strong>s<br />
Shadow file from ATCOR = 0 (8.32.)<br />
ρ [%] SPM 123457 = 0 (8.33.)<br />
ρ [%] SPM 123 = 0 (8.34.)<br />
ρ [%] band 1 = 0 (8.35.)<br />
ρ [%] band 2 = 0 (8.36.)<br />
ρ [%] band 3 = 0 (8.37.)<br />
Test 4: NIR <strong>test</strong><br />
ρ [%] band 4 ≤ 8 (8.38.)<br />
Test 5: Exclusi<strong>on</strong> of water surfaces<br />
ρ [%] band 5 ≥ 7 (8.39.)<br />
ρ [%] band 6 ≥ 5 (8.40.)<br />
ρ [%]bands 3, 4, 5, 6, 7, 8, 8 > 0 (8.41)<br />
Test 6: Temperature <strong>test</strong><br />
ρ [°C] band 6 ≥ 16 (8.42.)<br />
ρ [°C] > Global mean band 6 [°C] (8.43.)<br />
Test 1: Test for densely vegetated <str<strong>on</strong>g>areas</str<strong>on</strong>g><br />
SAVI xy > 0.4 (8.44.)<br />
SPM 123457 > 10 (8.45.)<br />
Test 1: Test for <strong>spectral</strong> characteristics of burned rock<br />
ρ [%] band 1 > 15 < 25 (8.46.)<br />
ρ [%] band 2 > 18 < 30 (8.47.)<br />
ρ [%]bands 3 ≥ 20 ≤ 35 (8.48.)<br />
ρ [%] band 4 ≥ 22 ≤ 35 (8.49.)<br />
ρ [%] band 5 > 19 ≤ 30 (8.50.)<br />
ρ [%] band 6 > 17 ≤ 30 (8.51.)<br />
- 140 -
ρ [%]bands 7 > 20 ≤ 30 (8.52.)<br />
ρ [%]bands 8 > 20 ≤ 35 (8.53.)<br />
ρ [%]bands 9 > 20 ≤ 30 (8.54.)<br />
ρ [%] band 13 thm ≥ 20 ≤ 30 (8.55.)<br />
ρ [%] SPM 12345789 > 20 ≤ 32 (8.56.)<br />
ρ [%] SPM 12 ≥ 16 ≤ 28 (8.57.)<br />
Test 2: Test for the size of clusters extracted in <strong>test</strong> 1<br />
Area Cluster xy ≤ 5 pixels = 4500m² (8.55.)<br />
8.2. Results of the Knowledge Based Test Sequence<br />
8.2.1. Results for the Main Study Areas<br />
8.2.1.1. Wuda<br />
For the Wuda area eight time steps were processed as presented in figure 8-12. Most prominent <str<strong>on</strong>g>areas</str<strong>on</strong>g><br />
of <str<strong>on</strong>g>coal</str<strong>on</strong>g> occurrence are the well known syncline in the central West, the north-south stretching band of<br />
mainly wild and private mining in the East and industry related accumulati<strong>on</strong>s in the southern center,<br />
the northern center and the Southeast. The pixels extracted as <str<strong>on</strong>g>coal</str<strong>on</strong>g> include hardly any shadow pixels.<br />
Only very few are recognizable in the winter scene of December 2002 acquired during a very low sun<br />
angle. Pixels of the Yellow River or a small lake existing <strong>on</strong> the western side of the Yellow River,<br />
northeast of the syncline were not extracted. Furthermore, already visually a clear increase from 1987<br />
to 1999 and from 1999 to September 2002 can be noted. The temporal development was quantitatively<br />
analyzed and is presented in figure 8-13. Extracti<strong>on</strong> accuracies in comparis<strong>on</strong> with ground truth will<br />
be presented in chapter 8.3., where a quantificati<strong>on</strong> of the results and error analysis are included.<br />
First visual comparis<strong>on</strong>s of the original imagery and the extracted pixels support the observati<strong>on</strong> that<br />
the algorithm tends to slightly underestimate the area covered by <str<strong>on</strong>g>coal</str<strong>on</strong>g>. This is a logical c<strong>on</strong>sequence of<br />
the algorithm design, which is <str<strong>on</strong>g>based</str<strong>on</strong>g> <strong>on</strong> thresholds mainly derived from class inherent standard<br />
deviati<strong>on</strong>s for a certain <strong>spectral</strong> band. For each surface class pixels exist, which have a <strong>spectral</strong><br />
reflectance in <strong>on</strong>e or the other band not located within the margins of the SD. However, thresholds had<br />
to be set to keep inter class c<strong>on</strong>fusi<strong>on</strong>s as low as possible and to minimize the extracti<strong>on</strong> of false<br />
alarms. Therefore, it was expected that the <str<strong>on</strong>g>coal</str<strong>on</strong>g> area is more likely to be under- than overestimated.<br />
Another limitati<strong>on</strong> for the definiti<strong>on</strong> of the <strong>test</strong> sequence was the need for a large spatially and time<br />
independent applicability. Each natural phenomen<strong>on</strong> or process has its defined measurement scale.<br />
Hence, it is clear that an algorithm aimed at the applicability in China and Australia, in spring and in<br />
summer, in str<strong>on</strong>gly alpine as well as flat terrain will have a higher tolerance level c<strong>on</strong>cerning<br />
extracti<strong>on</strong> accuracy when focusing <strong>on</strong> single pixels. It can be c<strong>on</strong>cluded that <strong>on</strong>ly very pure <str<strong>on</strong>g>coal</str<strong>on</strong>g> pixels<br />
are extracted by the knowledge <str<strong>on</strong>g>based</str<strong>on</strong>g> <strong>test</strong> sequence. Mixed pixels in the surrounding of a mine, which<br />
are heavily influenced by <str<strong>on</strong>g>coal</str<strong>on</strong>g> dust are not extracted if they are not located within the SD margins.<br />
This explains why industrial accumulati<strong>on</strong>s with clear boundaries are – visually interpreted – extracted<br />
with a higher accuracy than some pixels al<strong>on</strong>g the border of wild <str<strong>on</strong>g>coal</str<strong>on</strong>g> waste piles with fluent<br />
transiti<strong>on</strong>s to the surrounding bedrock or material. Figure 5-12 <strong>on</strong> the next page visualizes all<br />
extracti<strong>on</strong> results for the Wuda area. The central coordinate of the presented subset is 650705E,<br />
4373287N, UTM, Z48 N. An industrial storage pile south of Wuda is highlighted.<br />
- 141 -
1987-09 1999-08<br />
N<br />
N<br />
N<br />
2000-10 2001-10<br />
N<br />
N<br />
2002-09 2002-12<br />
N<br />
N<br />
2003-02 2003-05<br />
N<br />
Figure 8-12: Pixels automatically extracted as <str<strong>on</strong>g>coal</str<strong>on</strong>g> (white) for 8 time steps for the broader Wuda area (filtered).<br />
- 142 -
Figure 8-13 presents the number of <str<strong>on</strong>g>coal</str<strong>on</strong>g> pixels extracted with the knowledge <str<strong>on</strong>g>based</str<strong>on</strong>g> algorithm. Light<br />
grey columns represent unfiltered results, whereas dark columns represent the final majority filtered<br />
result. With the winter scenes included in the time series the trend of the time series is described by the<br />
equati<strong>on</strong> presented in figure 8-13 (left). The strength of the relati<strong>on</strong>ship between an increase of <str<strong>on</strong>g>coal</str<strong>on</strong>g><br />
surfaces over time is described by an R² of 0.84 (stability index r is 0.91). The level of significance, α,<br />
is with 0.1% very high. When winter scenes are excluded the trend of the time series is described by<br />
the equati<strong>on</strong> presented in figure 8-13 (right). The strength of the relati<strong>on</strong>ship between an increasing<br />
area covered by <str<strong>on</strong>g>coal</str<strong>on</strong>g> detectable in the Wuda area with progressing time is represented with an R² of<br />
0.94 (stability index r is 0.96). The level of significance, α, is 0.1%. Both significance levels were<br />
retrieved calculating the critical value, t, from equati<strong>on</strong> 8-29 (where n is the number of samples) and<br />
following comparis<strong>on</strong> with the critical values of the Student t-distributi<strong>on</strong> for differing significance<br />
levels and degrees of freedom (BAHRENBERG et al. 1990). The gap of lacking data between 1987 and<br />
1999 was c<strong>on</strong>sidered in the calculati<strong>on</strong>. Also the fact that for the years 1999, 2000 and 2001 <strong>on</strong>ly <strong>on</strong>e<br />
scene exists, whereas 2002 and 2003 are represented by 2 scenes was taken into account.<br />
r n − 2<br />
t = > t n-2, α/2 (8.29)<br />
1−<br />
R²<br />
A reas<strong>on</strong> why the winter scenes can be opti<strong>on</strong>ally excluded for the investigati<strong>on</strong> of the development of<br />
<str<strong>on</strong>g>coal</str<strong>on</strong>g> <str<strong>on</strong>g>areas</str<strong>on</strong>g> in Wuda over time is the fact that <str<strong>on</strong>g>coal</str<strong>on</strong>g> is heavily used in winter. Therefore storage piles<br />
decrease in area, as dem<strong>on</strong>strated in figure 8-14. This aggravates the quantitative comparis<strong>on</strong> of the<br />
<str<strong>on</strong>g>coal</str<strong>on</strong>g> extracti<strong>on</strong> results of winter scenes relative to the other scenes, which were acquired during times<br />
when <str<strong>on</strong>g>coal</str<strong>on</strong>g> is less heavily used.<br />
unfiltered results<br />
3×3 majority filtered results<br />
Figure 8-13: Development of the number of <str<strong>on</strong>g>coal</str<strong>on</strong>g> pixels extracted from 1987 until 2003 for the Wuda area<br />
including all scenes processed (a), and excluding the winter scenes (b). The trend was calculated for the filtered<br />
results.<br />
Opposite to Ruqigou, radiometrically and c<strong>on</strong>cerning thresholds the winter scenes did not cause<br />
problems for <str<strong>on</strong>g>coal</str<strong>on</strong>g> extracti<strong>on</strong>. The scenes were neither snow covered, nor are <str<strong>on</strong>g>coal</str<strong>on</strong>g> <str<strong>on</strong>g>areas</str<strong>on</strong>g> in Wuda<br />
located within deeply incised valleys supporting the masking of <str<strong>on</strong>g>coal</str<strong>on</strong>g> by shadow at low sun angle<br />
acquisiti<strong>on</strong> dates. The reflectance and temperature patterns for the scene from February 2003 have<br />
acceptable c<strong>on</strong>diti<strong>on</strong>s for <str<strong>on</strong>g>coal</str<strong>on</strong>g> extracti<strong>on</strong>. In the Wuda part of scene 129/33 from 12.02.2003 the<br />
Yellow River is nearly completely frozen. Temperatures of the frozen river range between -1 and 1°C.<br />
The thawed southern part ranges around 4°C. Coal surfaces range <strong>on</strong> average between 16 and 22°C,<br />
- 143 -
and <str<strong>on</strong>g>coal</str<strong>on</strong>g> <str<strong>on</strong>g>fire</str<strong>on</strong>g> related pixels reach 25 to 36°C. The average background temperature (histogram mean)<br />
is 13.4 °C. Shadowed <str<strong>on</strong>g>areas</str<strong>on</strong>g> range between 0 and -11°C depending <strong>on</strong> locati<strong>on</strong> and elevati<strong>on</strong>. The<br />
deeply incised valleys east of the Yellow River are <strong>on</strong> average cooler (-8 to -11°C) than the shadowed<br />
<str<strong>on</strong>g>areas</str<strong>on</strong>g> of the central limest<strong>on</strong>e complex closer to the river or the northern foothill <str<strong>on</strong>g>areas</str<strong>on</strong>g> of the Helan<br />
Shan. Since <str<strong>on</strong>g>coal</str<strong>on</strong>g> is not located in shadowed <str<strong>on</strong>g>areas</str<strong>on</strong>g>, a <strong>spectral</strong>- and a temperature threshold are<br />
sufficient to differentiate <str<strong>on</strong>g>coal</str<strong>on</strong>g> from shadow and extract the <str<strong>on</strong>g>coal</str<strong>on</strong>g> surfaces with high accuracy.<br />
It is not within the scope of this work to discuss every individual scene. A good impressi<strong>on</strong> <strong>on</strong> the<br />
<strong>spectral</strong> reflectance and temperature patterns of each scene is given with the figures representing the<br />
results of the signature analyses (chapter 7).<br />
09’02 09’02 09’02 09’02<br />
02’03<br />
02’03<br />
02’03<br />
02’03<br />
Figure 8-14: Difference between <str<strong>on</strong>g>coal</str<strong>on</strong>g> accumulati<strong>on</strong> comparing September 2002 and February 2003. The<br />
summer/fall scenes acquired present a stable linear increase in <str<strong>on</strong>g>coal</str<strong>on</strong>g> surfaces over the past years The two winter<br />
scenes of December 2002 and February 2003 act as outliers. This can be explained with the heavy <str<strong>on</strong>g>coal</str<strong>on</strong>g> use<br />
during the winter m<strong>on</strong>th. It is obvious that <str<strong>on</strong>g>coal</str<strong>on</strong>g> storage and <str<strong>on</strong>g>coal</str<strong>on</strong>g> waste piles and the piles around the mine<br />
portals shrink in size during times when <str<strong>on</strong>g>coal</str<strong>on</strong>g> is increasingly used for heating and electricity producti<strong>on</strong>.<br />
The extracti<strong>on</strong> of dense vegetati<strong>on</strong> <str<strong>on</strong>g>based</str<strong>on</strong>g> <strong>on</strong> the SAVI image threshold <strong>test</strong>s yielded eight binary<br />
images as presented in figure 8-9. Unless for the surface of <str<strong>on</strong>g>coal</str<strong>on</strong>g> it is impossible to use this extracted<br />
data for a time series comparis<strong>on</strong> since the scenes are not all from the same m<strong>on</strong>ths. Furthermore, the<br />
time series is too incomplete to draw hard c<strong>on</strong>clusi<strong>on</strong>s <strong>on</strong> vegetati<strong>on</strong> trends (like degradati<strong>on</strong>,<br />
desertificati<strong>on</strong> or the like). Coal exposure is mainly related to human activity and the time scale to<br />
m<strong>on</strong>itor changes lies in the range of m<strong>on</strong>ths to years. Vegetati<strong>on</strong> distributi<strong>on</strong> is dependent <strong>on</strong> the<br />
macro climate, the specific micro climate of a locati<strong>on</strong>, the present weather situati<strong>on</strong>, human impacts,<br />
grazing impacts etc. and the time scale to m<strong>on</strong>itor changes is in the order of years to decades.<br />
Especially in desert envir<strong>on</strong>ments a few days of rain can lead to a rapid “awakening” and growth of<br />
desert shrubs hampering temporal comparis<strong>on</strong>. Even comparing scenes of the same m<strong>on</strong>th will not<br />
allow the derivati<strong>on</strong> of trends unless the time series c<strong>on</strong>sists of sufficient samples (at least 10 scenes of<br />
the same m<strong>on</strong>th) (HOSTERT 2001). However, the topic of degradati<strong>on</strong> is of high relevance especially<br />
for the broader surrounding of the study area of Wuda and will be tackled in the future of the project<br />
when further Landsat archive scenes are available.<br />
- 144 -
Table 8-1 presents, how many <str<strong>on</strong>g>coal</str<strong>on</strong>g> pixels (filtered) were extracted for each time step and how many<br />
pixels are included in the delineated area. In additi<strong>on</strong> it is presented how many pixels within this area<br />
can be subtracted again, due to high vegetati<strong>on</strong> density. Final remaining pixels indicate probable <str<strong>on</strong>g>coal</str<strong>on</strong>g><br />
<str<strong>on</strong>g>fire</str<strong>on</strong>g>- or <str<strong>on</strong>g>coal</str<strong>on</strong>g> <str<strong>on</strong>g>fire</str<strong>on</strong>g> <str<strong>on</strong>g>risk</str<strong>on</strong>g> <str<strong>on</strong>g>areas</str<strong>on</strong>g>. Furthermore the areal percentage of this <str<strong>on</strong>g>risk</str<strong>on</strong>g> area in relati<strong>on</strong> to the overall<br />
scene size is calculated. Tests for the extracti<strong>on</strong> of burned rock were not undertaken in the Wuda study<br />
area, since these surfaces do not exist with sufficient spatial extent. The delineati<strong>on</strong> radius for all <str<strong>on</strong>g>areas</str<strong>on</strong>g><br />
was set to 500 m. This represents an average dip angle of approximately 15°. In Wuda and Ruqigou<br />
most seams dip with a steeper angle. Hence, a smaller buffer would be needed. However, the<br />
delineati<strong>on</strong> radius was purposely selected larger to account for lower dip angles and to account for the<br />
fact that exact informati<strong>on</strong> <strong>on</strong> dip angles for the transfer regi<strong>on</strong>s is not available.<br />
Table 8-1 indicates that for all eight time steps the original area of the input data (1605 km²) is reduced<br />
to less than 13 %, which can be c<strong>on</strong>sidered as a <str<strong>on</strong>g>coal</str<strong>on</strong>g> <str<strong>on</strong>g>fire</str<strong>on</strong>g> <str<strong>on</strong>g>risk</str<strong>on</strong>g> area. Coal extracti<strong>on</strong> yields remaining<br />
regi<strong>on</strong>s, which – for all time steps – remain below 0.82% of the original input data size. The <str<strong>on</strong>g>coal</str<strong>on</strong>g><br />
covered area as well as the buffer regi<strong>on</strong> is increasing over time. Though the number of <str<strong>on</strong>g>coal</str<strong>on</strong>g> pixels<br />
extracted in the two winter scenes is lower than of the preceding and following years, the buffer area<br />
for these two scenes is very large. This results from the fact that for the winter scenes more single<br />
scattered (shadow related or outlier) pixels were extracted. These are not eliminated by the majority<br />
filter and with a 500 m buffer generati<strong>on</strong> lead to a disproporti<strong>on</strong>ally larger delineated area.<br />
Dense vegetati<strong>on</strong> exclusi<strong>on</strong> within the buffer z<strong>on</strong>e minimizes this regi<strong>on</strong> for 1.8 % <strong>on</strong> average. The<br />
final remaining area – for no scene larger than 12.71 % of the original input data extent – can now be<br />
used to investigate thermal anomaly occurrence c<strong>on</strong>cerning their plausibility to be <str<strong>on</strong>g>coal</str<strong>on</strong>g> <str<strong>on</strong>g>fire</str<strong>on</strong>g> related<br />
anomalies. Complete <str<strong>on</strong>g>coal</str<strong>on</strong>g> <str<strong>on</strong>g>fire</str<strong>on</strong>g> <str<strong>on</strong>g>risk</str<strong>on</strong>g> maps will be presented in chapter 10.<br />
Table 8-1: Reducti<strong>on</strong> of the full scene <str<strong>on</strong>g>areas</str<strong>on</strong>g> to <str<strong>on</strong>g>coal</str<strong>on</strong>g> <str<strong>on</strong>g>fire</str<strong>on</strong>g> <str<strong>on</strong>g>risk</str<strong>on</strong>g> <str<strong>on</strong>g>areas</str<strong>on</strong>g> <str<strong>on</strong>g>based</str<strong>on</strong>g> <strong>on</strong> the automated extracti<strong>on</strong> of <str<strong>on</strong>g>coal</str<strong>on</strong>g>, a<br />
delineati<strong>on</strong> <str<strong>on</strong>g>based</str<strong>on</strong>g> <strong>on</strong> this area and the exclusi<strong>on</strong> of densely vegetated <str<strong>on</strong>g>areas</str<strong>on</strong>g> within this z<strong>on</strong>e for the Wuda regi<strong>on</strong><br />
Date<br />
Overall<br />
pixels<br />
Extracted <str<strong>on</strong>g>coal</str<strong>on</strong>g><br />
pixels, [km²]<br />
Buffer regi<strong>on</strong><br />
pixels, [km²]<br />
Veg. exclusi<strong>on</strong>,<br />
pixels [km²]<br />
Area [km²]<br />
remaining<br />
% of<br />
scene<br />
1987-09 1783397 4409 (03.96) 123362 (111.02) 1970 (1.77) 109.25 6.80<br />
1999-08 1783397 8776 (07.89) 169210 (152.28) 2557 (2.30) 149.98 9.34<br />
2000-10 1783397 11464 (10.31) 203208 (182,88) 643 (0.57) 182.31 11.35<br />
2001-10 1783397 13764 (12.38) 209463 (188.51) 2410 (2.16) 186.35 11.61<br />
2002-09 1783397 13784 (12.40) 207871 (187.08) 6932 (6.23) 180.85 11.26<br />
2002-12 1783397 11496 (10.34) 227150 (204.43) 342 (0.30) 204.13 12.71<br />
2003-02 1783397 12210 (10.98) 199412 (179.47) 129 (0.11) 179.36 11.17<br />
2003-05 1783397 14790 (13.31) 202824 (182.54) 1182 (1.06) 181.41 11.30<br />
Figure 8-15 <strong>on</strong> the next page presents an image calculated for the Wuda area indicating, how often for<br />
the eight time steps processed a pixel was counted as a <str<strong>on</strong>g>coal</str<strong>on</strong>g> surface. The black area indicates regi<strong>on</strong>s,<br />
where <str<strong>on</strong>g>coal</str<strong>on</strong>g> was never detected. The colored regi<strong>on</strong>s present <str<strong>on</strong>g>areas</str<strong>on</strong>g>, where <str<strong>on</strong>g>coal</str<strong>on</strong>g> was detected between<br />
<strong>on</strong>e and eight times. It can be noted in the two zooms that the central <str<strong>on</strong>g>areas</str<strong>on</strong>g> of <str<strong>on</strong>g>coal</str<strong>on</strong>g> waste and <str<strong>on</strong>g>coal</str<strong>on</strong>g><br />
storage piles are stable over time and appear as <str<strong>on</strong>g>coal</str<strong>on</strong>g> surfaces in all images. The <str<strong>on</strong>g>coal</str<strong>on</strong>g> storage pile of<br />
Wuda’s biggest <str<strong>on</strong>g>coal</str<strong>on</strong>g> processing plant in the North of the image experiences an increase of the area<br />
covered by <str<strong>on</strong>g>coal</str<strong>on</strong>g> reminding of c<strong>on</strong>centric circles. The steady growth of this pile is hereby<br />
dem<strong>on</strong>strated.<br />
- 145 -
N<br />
Figure 8-15: Pixels automatically extracted as <str<strong>on</strong>g>coal</str<strong>on</strong>g> for 8 time steps for the broader Wuda area (filtered). The<br />
color scheme represents how often a pixel was c<strong>on</strong>sidered as a <str<strong>on</strong>g>coal</str<strong>on</strong>g> surface.<br />
area never extracted as a <str<strong>on</strong>g>coal</str<strong>on</strong>g> surface<br />
area <strong>on</strong>e time extracted as a <str<strong>on</strong>g>coal</str<strong>on</strong>g> surface<br />
area two times extracted as a <str<strong>on</strong>g>coal</str<strong>on</strong>g> surface<br />
area three times extracted as a <str<strong>on</strong>g>coal</str<strong>on</strong>g> surface<br />
area four times extracted as a <str<strong>on</strong>g>coal</str<strong>on</strong>g> surface<br />
area five times extracted as a <str<strong>on</strong>g>coal</str<strong>on</strong>g> surface<br />
area six times extracted as a <str<strong>on</strong>g>coal</str<strong>on</strong>g> surface<br />
area seven times extracted as a <str<strong>on</strong>g>coal</str<strong>on</strong>g> surface<br />
area eight times extracted as a <str<strong>on</strong>g>coal</str<strong>on</strong>g> surface<br />
8.2.1.2. Ruqigou<br />
For Ruqigou <str<strong>on</strong>g>coal</str<strong>on</strong>g> extracti<strong>on</strong> results are presented in figure 8-16. The central coordinate of the<br />
presented subset is 667794 E, 4336506 N, UTM, Z48N, WGS84. Except for the two winter scenes –<br />
<str<strong>on</strong>g>based</str<strong>on</strong>g> <strong>on</strong> a first visual impressi<strong>on</strong> – results look very good. This applies although the alpine terrain is<br />
highly complex. The challenge to extract a surface <strong>on</strong>ly occurring at very limited quantities and the<br />
pr<strong>on</strong>eness of <str<strong>on</strong>g>coal</str<strong>on</strong>g> spectra to be easily mimicked by shadow is overcome. Especially for the scenes of<br />
1999, 2000 and 2001 hardly any shadow pixels were extracted and a clear increase in the <str<strong>on</strong>g>coal</str<strong>on</strong>g> covered<br />
area can be noted. Also a large increase from 1987 to 1999 is recognizable. The two parallel running<br />
northeast to southwest stretching valleys of Hulusitai and Shitanjing were not yet developed in 1987.<br />
Furthermore, the northeastern part of the Ruqigou syncline has been developed str<strong>on</strong>gly over time.<br />
Coal accumulati<strong>on</strong>s in the very Southeast of the displayed area are <str<strong>on</strong>g>coal</str<strong>on</strong>g> storage piles closely located to<br />
settled <str<strong>on</strong>g>areas</str<strong>on</strong>g>. Visual comparis<strong>on</strong>s of the extracted area with the small Landsat image presented look<br />
very good. Only for the scene from December 2002, where a thin snow layer covers the <str<strong>on</strong>g>coal</str<strong>on</strong>g> piles, no<br />
pixels were extracted. Compared to 1999, 2000 and 2001 in 1987 and 2002 some random shadow<br />
pixels are extracted, which will influence <str<strong>on</strong>g>risk</str<strong>on</strong>g> area definiti<strong>on</strong>. The winter scenes of 2002 and 2003 do<br />
not fit the visual trend of an overall increase of <str<strong>on</strong>g>coal</str<strong>on</strong>g> accumulati<strong>on</strong>s <strong>on</strong> the surface. The reas<strong>on</strong> for this<br />
is explained in the following paragraphs.<br />
- 146 -
1987-09 1999-08<br />
N<br />
N<br />
2000-10<br />
2001-10<br />
N<br />
N<br />
2002-09 2002-12<br />
N<br />
N<br />
2003-02 2003-05<br />
N<br />
N<br />
Figure 8-16: Pixels automatically extracted as <str<strong>on</strong>g>coal</str<strong>on</strong>g> (white) for 8 time steps for the Ruqigou area (filtered),<br />
- 147 -
Figure 8-16 presents the <str<strong>on</strong>g>coal</str<strong>on</strong>g> pixels extracted with the knowledge <str<strong>on</strong>g>based</str<strong>on</strong>g> algorithm. Again, light<br />
columns represent unfiltered results. These are meaningless, due to a high number of single scattered<br />
pixels extracted al<strong>on</strong>g shadow margin <str<strong>on</strong>g>areas</str<strong>on</strong>g>. Dark columns represent the final majority filtered result.<br />
With the winter scenes included in the time series, the trend for the development of <str<strong>on</strong>g>coal</str<strong>on</strong>g> surfaces over<br />
time is described by the equati<strong>on</strong> presented in figure 8-16 (left). The strength of the relati<strong>on</strong>ship<br />
between the spatial development of <str<strong>on</strong>g>coal</str<strong>on</strong>g> surfaces and progressing time is represented by an R² of less<br />
then 0.15 (stability index, r, is 0.38). This is by no means significant (significance level, α, is >10%).<br />
When winter scenes are excluded the trend of increasing <str<strong>on</strong>g>coal</str<strong>on</strong>g> surfaces detectable in the Ruqigou area<br />
with progressing time is described by the equati<strong>on</strong> in figure 8-16 (right). The strength of the trend is<br />
represented by an R² of 0.72 (stability index, r, is 0.85). This result is of high significance, represented<br />
by a level of significance, α, slightly above 1%. The gap of lacking data between 1987 and 1999 was<br />
c<strong>on</strong>sidered in the calculati<strong>on</strong>, as well as the fact that for the years 1999, 2000 and 2001 <strong>on</strong>ly <strong>on</strong>e scene<br />
exists, whereas 2002 and 2003 are represented by 2 scenes.<br />
Ruqigou winter scenes – c<strong>on</strong>trary to Wuda – definitely had to be excluded for a realistic<br />
approximati<strong>on</strong> of the development of <str<strong>on</strong>g>coal</str<strong>on</strong>g> <str<strong>on</strong>g>areas</str<strong>on</strong>g> over time. This was not so much due to the – not<br />
necessarily c<strong>on</strong>siderable – fact that <str<strong>on</strong>g>coal</str<strong>on</strong>g> is heavily used in winter and therefore piles decrease in size.<br />
The scene of February 2003 is to approximately 40% snow covered. This hinders the quantitative<br />
comparis<strong>on</strong> of the <str<strong>on</strong>g>coal</str<strong>on</strong>g> extracti<strong>on</strong> result relative to the other scenes. The scene from December 2002 is<br />
also not representative. Due to the low sun angle shaded <str<strong>on</strong>g>areas</str<strong>on</strong>g> are very large. Even illuminati<strong>on</strong><br />
correcti<strong>on</strong> could not “light up” most of the shaded valleys. In this scene the “worst case scenario”<br />
occurs, where a lot of <str<strong>on</strong>g>coal</str<strong>on</strong>g> surfaces are located in fully shadowed regi<strong>on</strong>s. Therefore, <str<strong>on</strong>g>coal</str<strong>on</strong>g> extracti<strong>on</strong><br />
of sufficient comparability to the other scenes is not possible. This finding however was expected and<br />
it is assumed that no knowledgeable image analyst would order low sun angle winter data (also<br />
including a high chance of snow cover) for land cover studies, which are seas<strong>on</strong>ally independent.<br />
The phenomen<strong>on</strong> of decreasing <str<strong>on</strong>g>coal</str<strong>on</strong>g> pile sizes in winter as observed for the Wuda area could visually<br />
not be detected for the Ruqigou area. Several reas<strong>on</strong>s can explain this observati<strong>on</strong>. Compared to<br />
Wuda, which is surrounded by urban sprawl and which can be c<strong>on</strong>sidered a larger agglomerati<strong>on</strong>,<br />
Ruqigou is a mountain village with much less inhabitants. The <str<strong>on</strong>g>coal</str<strong>on</strong>g> demand for households and<br />
heating will therefore be c<strong>on</strong>siderably smaller. Furthermore, Ruqigou <str<strong>on</strong>g>coal</str<strong>on</strong>g> is mainly mined for<br />
nati<strong>on</strong>al and internati<strong>on</strong>al export. Mining is much more industrialized and private wild mining like in<br />
Wuda east of the Yellow River – undergoing str<strong>on</strong>g fluctuati<strong>on</strong>s – is not as apparent.<br />
unfiltered results 3×3 majority filtered results<br />
Figure 8-17: Development of the number of <str<strong>on</strong>g>coal</str<strong>on</strong>g> pixels extracted from 1987 until 2003 for the Ruqigou area<br />
including all scenes processed (a), excluding the winter scenes (b). The trend was calculated for the filtered<br />
results.<br />
- 148 -
Based <strong>on</strong> first visual comparis<strong>on</strong>s in Ruqigou the <str<strong>on</strong>g>coal</str<strong>on</strong>g> covered area is not underestimated, but<br />
extracted with high accuracy. This is the result of a compromise, which had to be undertaken<br />
c<strong>on</strong>cerning the transferability of the algorithm. The filtering of the output result for the Wuda area<br />
leads to a decrease in extracted surfaces. In Wuda shadowed regi<strong>on</strong>s are less accentuated than in<br />
Ruqigou and deeply incised valleys leading to bigger shadowed <str<strong>on</strong>g>areas</str<strong>on</strong>g> are large in size and spatially<br />
limited (mainly east of the river). From visual analysis it could be c<strong>on</strong>cluded that for the Wuda regi<strong>on</strong><br />
the unfiltered results actually were closer to the real outline of <str<strong>on</strong>g>coal</str<strong>on</strong>g> surfaces than the filtered results.<br />
However, in Ruqigou unfiltered results were not acceptable due to a lot of small shadow margin<br />
clusters extracted all over the Helan Shan mountain range. Therefore, the compromise was taken to<br />
decide for very good results in Ruqigou and still good results in Wuda and take the slight<br />
underestimati<strong>on</strong> in the Wuda regi<strong>on</strong> into account. In additi<strong>on</strong> the phenomen<strong>on</strong> of mixed pixels is less<br />
accentuated in Ruqigou. Here the terrain limits the spatial extent of <str<strong>on</strong>g>coal</str<strong>on</strong>g> accumulati<strong>on</strong>s.<br />
Table 8-2 indicates that for all eight time steps the original area of the input data (1852 km²) is reduced<br />
to an area of less than 18 % of the input data. This remaining area can be c<strong>on</strong>sidered as a <str<strong>on</strong>g>coal</str<strong>on</strong>g> <str<strong>on</strong>g>fire</str<strong>on</strong>g><br />
(<str<strong>on</strong>g>risk</str<strong>on</strong>g>) area. For all scenes an average of 12.2 % remains. Coal extracti<strong>on</strong> al<strong>on</strong>e yields an area, which –<br />
for all time steps – remains below 0.78 % of the original input data size. Unless for Wuda, the larger<br />
delineated regi<strong>on</strong> is not c<strong>on</strong>sistently increasing over time, even when winter scenes are not included.<br />
In the alpine terrain of Ruqigou the size of the delineati<strong>on</strong> radius largely depends <strong>on</strong> the quality of the<br />
output result of <strong>test</strong> 3 from the <str<strong>on</strong>g>coal</str<strong>on</strong>g> extracti<strong>on</strong> <strong>test</strong> sequence (removal of shadow). In case the<br />
reflectance or temperature behavior of shadow and shadow margin are unfavorable, a lot of scattered<br />
pixels will be extracted. If not excluded by the majority filter, these pixels will lead to a<br />
disproporti<strong>on</strong>ally larger overall delineati<strong>on</strong> area. The delineati<strong>on</strong> z<strong>on</strong>e development in Ruqigou over<br />
time therefore does not allow for any statement <strong>on</strong> the spatial development of <str<strong>on</strong>g>coal</str<strong>on</strong>g> <str<strong>on</strong>g>fire</str<strong>on</strong>g> <str<strong>on</strong>g>risk</str<strong>on</strong>g> <str<strong>on</strong>g>areas</str<strong>on</strong>g>.<br />
Dense vegetati<strong>on</strong> exclusi<strong>on</strong> within the delineated z<strong>on</strong>e reduces the demarcated <str<strong>on</strong>g>coal</str<strong>on</strong>g> <str<strong>on</strong>g>fire</str<strong>on</strong>g> <str<strong>on</strong>g>risk</str<strong>on</strong>g> area of<br />
Ruqigou for 7.82 km² <strong>on</strong> average. The final remaining area is for no scene larger than 17.98 % of the<br />
original data input. This demarcated area can now be investigated for thermal anomalies detected by<br />
the algorithm developed by ZHANG, J. (2004).<br />
For the Ruqigou scene of September 2002 4441 pixels of pyrometamorph rock were extracted<br />
(3.9 km²). When this result is intersected with the delineati<strong>on</strong> area – (since it is assumed that<br />
pyrometamorphic rock does not occur outside the delineati<strong>on</strong> z<strong>on</strong>e) – 181 pixels (= 0.16 km²) remain.<br />
Since <strong>on</strong>ly 4 of these 181 pixels can be validated and for many pixels no ground truth in the form of<br />
mapped polyg<strong>on</strong>s or high resoluti<strong>on</strong> data is available, this number can not be interpreted. It is assumed<br />
though that this result still c<strong>on</strong>tains some desert sand pixels, which occurred in small enough clusters<br />
to pass the pyrometamorphic rock <strong>test</strong> 2 and which are located within the margin of the demarcated<br />
<str<strong>on</strong>g>risk</str<strong>on</strong>g> area.<br />
For the Ruqigou area in May 2003 all in all 8341 pixels indicating pyrometamorphic rock were<br />
extracted. When this result is intersected with the delineated area 706 pixels (= 0.63 km²) remain. This<br />
result is expected to be highly exceeding the realistic dimensi<strong>on</strong>s, since an increase in the exposure of<br />
pyrometamorphic rocks for about 0.5 km² within <strong>on</strong>ly half a year is c<strong>on</strong>sidered very high.<br />
Detailed <str<strong>on</strong>g>coal</str<strong>on</strong>g> <str<strong>on</strong>g>fire</str<strong>on</strong>g> <str<strong>on</strong>g>risk</str<strong>on</strong>g> maps will be presented in chapter 10.<br />
- 149 -
Table 8-2: Reducti<strong>on</strong> of the full scene <str<strong>on</strong>g>areas</str<strong>on</strong>g> to <str<strong>on</strong>g>coal</str<strong>on</strong>g> <str<strong>on</strong>g>fire</str<strong>on</strong>g> <str<strong>on</strong>g>risk</str<strong>on</strong>g> <str<strong>on</strong>g>areas</str<strong>on</strong>g> <str<strong>on</strong>g>based</str<strong>on</strong>g> <strong>on</strong> the automated extracti<strong>on</strong> of <str<strong>on</strong>g>coal</str<strong>on</strong>g>, a<br />
delineati<strong>on</strong> <str<strong>on</strong>g>based</str<strong>on</strong>g> <strong>on</strong> this area and exclusi<strong>on</strong> of densely vegetated <str<strong>on</strong>g>areas</str<strong>on</strong>g> within this z<strong>on</strong>e for the Ruqigou regi<strong>on</strong><br />
Date<br />
Overall<br />
pixels<br />
Extracted <str<strong>on</strong>g>coal</str<strong>on</strong>g><br />
pixels, [km²]<br />
Delineated regi<strong>on</strong><br />
pixels, [km²]<br />
Veg. exclusi<strong>on</strong>,<br />
pixels [km²]<br />
Area [km²]<br />
remaining<br />
% of<br />
scene<br />
1987-09 2058820 6438 (5.79) 318681 (286.81) 14150 (12.73) 274.08 14.79<br />
1999-08 2058820 8093 (7.28) 160863 (144.77) 8022 (7.21) 137.56 7.42<br />
2000-10 2058820 9515 (8.56) 259066 (233.15) 3156 (2.84) 230.31 12.42<br />
2001-10 2058820 11662 (10.49) 196747 (177.07) 5769 (5.19) 171.88 9.27<br />
2002-09 2058820 16205 (14.58) 326470 (293.82) 18017 (16.21) 277.61 14.98<br />
2002-12 2058820 6527 (5.87) 371670 (334.50) 1426 (1.28) 333.22 17.98<br />
2003-02 2058820 5459 (4.91) 116001 (104.40) 247 (0.22) 104.18 5.62<br />
2003-05 2058820 15241 (13.71) 330037 (297.03) 18763 (16.88) 280.15 15.11<br />
The algorithm was also applied to the whole ETM+ scene 129/33 from September 2002, which is the<br />
most recent scene available for the area. The scene from May 2003 is unfortunately cloud covered for<br />
the regi<strong>on</strong> south of the study <str<strong>on</strong>g>areas</str<strong>on</strong>g>. The September scene covers an area of 52439.65 km². 43.49 km²<br />
could be extracted as <str<strong>on</strong>g>coal</str<strong>on</strong>g>, the delineated area includes 890 km² before- and 827 km² after vegetati<strong>on</strong><br />
exclusi<strong>on</strong>. The remaining area is equal to 1.5 % of the input data set.<br />
N<br />
area never extracted as a <str<strong>on</strong>g>coal</str<strong>on</strong>g> surface<br />
area <strong>on</strong>e time extracted as a <str<strong>on</strong>g>coal</str<strong>on</strong>g> surface<br />
area two times extracted as a <str<strong>on</strong>g>coal</str<strong>on</strong>g> surface<br />
area three times extracted as a <str<strong>on</strong>g>coal</str<strong>on</strong>g> surface<br />
area four times extracted as a <str<strong>on</strong>g>coal</str<strong>on</strong>g> surface<br />
area five times extracted as a <str<strong>on</strong>g>coal</str<strong>on</strong>g> surface<br />
area six times extracted as a <str<strong>on</strong>g>coal</str<strong>on</strong>g> surface<br />
area seven times extracted as a <str<strong>on</strong>g>coal</str<strong>on</strong>g> surface<br />
area eight times extracted as a <str<strong>on</strong>g>coal</str<strong>on</strong>g> surface<br />
Figure 8-18: Pixels automatically extracted as <str<strong>on</strong>g>coal</str<strong>on</strong>g> for 8 time steps for the broader Ruqigou area (filtered). The<br />
color scheme represents, how often a pixel was c<strong>on</strong>sidered as a <str<strong>on</strong>g>coal</str<strong>on</strong>g> surface. Center coordinate of main subset:<br />
607794E, 4336506N, UTM, Z48N<br />
- 150 -
8.2.2. Results for the Transfer Regi<strong>on</strong>s<br />
To dem<strong>on</strong>strate the large scale transferability of the developed knowledge <str<strong>on</strong>g>based</str<strong>on</strong>g> sequence the<br />
algorithm was applied to three totally different locati<strong>on</strong>s outside the study <str<strong>on</strong>g>areas</str<strong>on</strong>g>. These are represented<br />
by Landsat-7 ETM+ scene 140 / 044 located in India as listed in chapter 4 and a scene (098 / 081)<br />
from the southern hemisphere in Australia. For both <str<strong>on</strong>g>areas</str<strong>on</strong>g> – the Jharia mining regi<strong>on</strong> (western India)<br />
and the Flinders Mountains (southeast Australia) all channels were available and the data was<br />
preprocessed as presented in chapter 5. Furthermore, a scene outside the comm<strong>on</strong> <strong>test</strong> <str<strong>on</strong>g>areas</str<strong>on</strong>g> in China<br />
was processed. It covers the northernmost part of the Yellow River, including the city of Baotou in<br />
Inner M<strong>on</strong>golia (scene 128 / 032).<br />
Coal<br />
Shadow margin<br />
Shadow<br />
Rivers<br />
Deep lakes<br />
Shallow lakes<br />
Figure 8-19: Spectral mean for bands 123457 and bands 123 for the three transfer <str<strong>on</strong>g>areas</str<strong>on</strong>g><br />
As presented in figure 8-11 synthetic <strong>spectral</strong> mean bands were also calculated for the transfer <str<strong>on</strong>g>areas</str<strong>on</strong>g>.<br />
The mean and SD of SMP 123457 and SPM 123 are presented in figure 8-19. The same threshold filters<br />
were applied as for the ETM+ scenes of Wuda and Ruqigou.<br />
Figure 8-20: Number of extracted <str<strong>on</strong>g>coal</str<strong>on</strong>g> pixels for the<br />
Leigh Creek area, Australia, the Baotou area in<br />
northern China and the Jahria <str<strong>on</strong>g>coal</str<strong>on</strong>g> mining regi<strong>on</strong> in<br />
India. An excepti<strong>on</strong>al high amount of single scattered<br />
pixels is extracted in the scene from India. This scene<br />
has much larger <str<strong>on</strong>g>coal</str<strong>on</strong>g> occurrences than the regi<strong>on</strong>s of<br />
Baotou and Leigh Creek area, Australia.<br />
unfiltered results<br />
3×3 majority filtered results<br />
- 151 -
8.2.2.1. Flinders Ranges, Leigh Creek, Australia<br />
The Flinders Ranges in Australia are about 400 km l<strong>on</strong>g and bel<strong>on</strong>g to the few elevated land masses of<br />
the c<strong>on</strong>tinent. Due to the semi-arid to arid envir<strong>on</strong>ment they are <strong>on</strong>ly sparsely covered with vegetati<strong>on</strong>.<br />
They offer a good insight in their geologic structure, when observed<br />
from satellite. The <str<strong>on</strong>g>coal</str<strong>on</strong>g> mining area present in the Landsat-7 scene is the<br />
Leigh Creek open pit <str<strong>on</strong>g>coal</str<strong>on</strong>g> mine, which is located at the southwestern<br />
foothills of the Flinders Range. Here, Triassic <str<strong>on</strong>g>coal</str<strong>on</strong>g> was discovered in<br />
1888 and <str<strong>on</strong>g>coal</str<strong>on</strong>g> mining started in 1943. Leigh Creek is South Australia’s<br />
<strong>on</strong>ly <str<strong>on</strong>g>coal</str<strong>on</strong>g> mine and supplies <str<strong>on</strong>g>coal</str<strong>on</strong>g> to the power stati<strong>on</strong> at Port Augusta.<br />
Here it is used as fuel to produce 40% of Adelaide’s electricity.<br />
Currently 2.7 Mt/year of <str<strong>on</strong>g>coal</str<strong>on</strong>g> are w<strong>on</strong> by open-cut methods (URL 8-1).<br />
Figure 8-21: Locati<strong>on</strong> of the transfer ETM+ scene from Australia<br />
For the scene from Australia the visual impressi<strong>on</strong> of <str<strong>on</strong>g>coal</str<strong>on</strong>g> extracti<strong>on</strong> looks very good. 6786 pixels<br />
were extracted as <str<strong>on</strong>g>coal</str<strong>on</strong>g> from the large ETM+ subset processed c<strong>on</strong>taining over 3.7 Mio. Pixels. The<br />
extracti<strong>on</strong> result therefore c<strong>on</strong>tains less than 1.46 % of all pixels within the scene. The clear deep<br />
(dark) water reservoirs south of Leigh Creek <str<strong>on</strong>g>coal</str<strong>on</strong>g> mining area (highlighted in white framed boxes,<br />
figure 8-22 left) were not extracted. Dense vegetati<strong>on</strong> in this scene <strong>on</strong>ly exists in very low covering<br />
densities. An excepti<strong>on</strong> are the vicinities of riverbeds dissecting the image as well as the shores of two<br />
artificial lakes. The inclusi<strong>on</strong> of the thresholded SAVI result could decrease the <str<strong>on</strong>g>coal</str<strong>on</strong>g> <str<strong>on</strong>g>fire</str<strong>on</strong>g> <str<strong>on</strong>g>risk</str<strong>on</strong>g> area<br />
from 50.05 to 49.91 km² (see table 8-3).<br />
Pyrometamorphic rock could not be detected in the area. Though no detailed informati<strong>on</strong> <strong>on</strong> this<br />
subject was available, it is assumed that this type of rock does not exist. No larger l<strong>on</strong>g burning <str<strong>on</strong>g>coal</str<strong>on</strong>g><br />
<str<strong>on</strong>g>fire</str<strong>on</strong>g>s are reported for the Leigh Creek <str<strong>on</strong>g>coal</str<strong>on</strong>g> field. Furthermore the <str<strong>on</strong>g>coal</str<strong>on</strong>g> is mined with open pit mining<br />
and the ventilati<strong>on</strong> – cooling the exothermal reacti<strong>on</strong> of carb<strong>on</strong> and oxygen – is c<strong>on</strong>sidered good. The<br />
<str<strong>on</strong>g>coal</str<strong>on</strong>g> is furthermore mined with heavily industrialized methods and under frequent supervisi<strong>on</strong>. If a<br />
<str<strong>on</strong>g>coal</str<strong>on</strong>g> <str<strong>on</strong>g>fire</str<strong>on</strong>g> would occur at all it is assumed to be extinguished fast. Therefore, no favorable envir<strong>on</strong>ment<br />
for the genesis of pyrometamorphic rock exists. A <str<strong>on</strong>g>coal</str<strong>on</strong>g> <str<strong>on</strong>g>fire</str<strong>on</strong>g> area <str<strong>on</strong>g>risk</str<strong>on</strong>g> map is presented in chapter 10.<br />
a<br />
N<br />
b<br />
N<br />
Figure 8-22: The Leigh Creek <str<strong>on</strong>g>coal</str<strong>on</strong>g> mining area (a), <str<strong>on</strong>g>coal</str<strong>on</strong>g> pixels extracted for the scene (b), this subset displays<br />
<strong>on</strong>ly 1/15 th of the full scene. Center coordinate of subset: 6626009 S; 252463 E, UTM, Z54 S, WGS 84.<br />
- 152 -
Table 8-3: Reducti<strong>on</strong> of the full scene <str<strong>on</strong>g>areas</str<strong>on</strong>g> to <str<strong>on</strong>g>coal</str<strong>on</strong>g> <str<strong>on</strong>g>fire</str<strong>on</strong>g> <str<strong>on</strong>g>risk</str<strong>on</strong>g> <str<strong>on</strong>g>areas</str<strong>on</strong>g> <str<strong>on</strong>g>based</str<strong>on</strong>g> <strong>on</strong> the automated extracti<strong>on</strong> of <str<strong>on</strong>g>coal</str<strong>on</strong>g>, a<br />
delineati<strong>on</strong> <str<strong>on</strong>g>based</str<strong>on</strong>g> <strong>on</strong> this area, exclusi<strong>on</strong> of densely vegetated <str<strong>on</strong>g>areas</str<strong>on</strong>g> within this z<strong>on</strong>e for the Leigh Creek regi<strong>on</strong><br />
Date<br />
Overall<br />
pixels<br />
Extracted <str<strong>on</strong>g>coal</str<strong>on</strong>g><br />
pixels, [km²]<br />
Deli. regi<strong>on</strong><br />
pixels, [km²]<br />
Veg. exclusi<strong>on</strong>,<br />
pixels [km²]<br />
Area [km²]<br />
remaining<br />
% of<br />
scene<br />
2002-11 3788996 6786 (6.10) 55621(50.05) 164 (0.14) 49.91 1.46<br />
8.2.2.2. Jharia <str<strong>on</strong>g>coal</str<strong>on</strong>g> mining regi<strong>on</strong>, India<br />
The Jharia area in India has an extremely high industrial density. It hosts a well known <str<strong>on</strong>g>coal</str<strong>on</strong>g> field,<br />
formerly researched intensively in the c<strong>on</strong>text of <str<strong>on</strong>g>coal</str<strong>on</strong>g> <str<strong>on</strong>g>fire</str<strong>on</strong>g>s by BHATTACHARYA & REDDY (1994),<br />
SARAF et al. (1995) and PRAKASH & GUPTA (1998, 1999). Jharia is the<br />
largest <str<strong>on</strong>g>coal</str<strong>on</strong>g> field in India located about 250 km northwest of Calcutta<br />
and 1150 km southeast of Dehli. To the South the <str<strong>on</strong>g>coal</str<strong>on</strong>g> fields are<br />
bordered by the Damodar River. More than 90 surface- and subsurface<br />
<str<strong>on</strong>g>coal</str<strong>on</strong>g> <str<strong>on</strong>g>fire</str<strong>on</strong>g>s were reported in this regi<strong>on</strong>. Located 100 km southwest of<br />
Jharia the Rāy <str<strong>on</strong>g>coal</str<strong>on</strong>g> field can be found. The envir<strong>on</strong>ment has a very high<br />
average vegetati<strong>on</strong> density. Tropical m<strong>on</strong>so<strong>on</strong> forest still exists in close<br />
vicinity of the <str<strong>on</strong>g>coal</str<strong>on</strong>g> fields. M<strong>on</strong>thly average temperatures exceed 18°C.<br />
Figure 8-23: Locati<strong>on</strong> of the ETM+ transfer scene from India<br />
As illustrated in table 8-4 77665 <str<strong>on</strong>g>coal</str<strong>on</strong>g> pixels were extracted from the scene available for India. This<br />
compares to an area of 0.13 % of the whole scene. Already after visual investigati<strong>on</strong> it could be noted<br />
that <str<strong>on</strong>g>coal</str<strong>on</strong>g> extracti<strong>on</strong> for India worked not as well as for the Chinese <str<strong>on</strong>g>areas</str<strong>on</strong>g> or the Australian transfer<br />
regi<strong>on</strong>. The problem is not so much that the existing <str<strong>on</strong>g>coal</str<strong>on</strong>g> <str<strong>on</strong>g>areas</str<strong>on</strong>g> were not demarcated properly by the<br />
algorithm. Other <str<strong>on</strong>g>areas</str<strong>on</strong>g> not representing <str<strong>on</strong>g>coal</str<strong>on</strong>g> were extracted also. These are for the most parts water<br />
bodies like rivers and lakes as it can already be seen in figure 8-24 (upper right). From chapter 7 as<br />
well as figure 8-19 it was already clear that in this tropical envir<strong>on</strong>ment <str<strong>on</strong>g>coal</str<strong>on</strong>g> and the surfaces similar<br />
to <str<strong>on</strong>g>coal</str<strong>on</strong>g> have a different <strong>spectral</strong> pattern. For all surfaces and in all wavelengths bands as well as the<br />
SPM channel did the surfaces <str<strong>on</strong>g>coal</str<strong>on</strong>g>, river water, deep lake water and shallow lake water have very high<br />
SDs, complicating differentiati<strong>on</strong>. This results in many scattered “<str<strong>on</strong>g>coal</str<strong>on</strong>g>” pixels, which are actually false<br />
alarms and lead to an inappropriate increase of the delineated area.<br />
Dense vegetati<strong>on</strong> is abundant in the regi<strong>on</strong>. Areas, which can be excluded from the demarcated z<strong>on</strong>e<br />
are therefore very large. Vegetati<strong>on</strong> exclusi<strong>on</strong> reduces the delineated z<strong>on</strong>e from 3178 to 778 km². The<br />
remaining area c<strong>on</strong>sidered as a <str<strong>on</strong>g>coal</str<strong>on</strong>g> <str<strong>on</strong>g>fire</str<strong>on</strong>g> <str<strong>on</strong>g>risk</str<strong>on</strong>g> area c<strong>on</strong>tains <strong>on</strong>ly 1.48 % of the whole scene input into<br />
the knowledge <str<strong>on</strong>g>based</str<strong>on</strong>g> <strong>test</strong> sequence.<br />
Pyrometamorphic rock does exist in very small quantities in the Jharia area. The outcrops are not large<br />
enough though, to be picked up in a 30 × 30 m pixel (pers<strong>on</strong>al communicati<strong>on</strong> with A. PRAKASH, July<br />
2004).<br />
- 153 -
a<br />
N<br />
b<br />
N<br />
c<br />
N<br />
c<br />
N<br />
N<br />
Figure 8-24: Coal pixels extracted for the scene of India. The two subsets display <strong>on</strong>ly parts of the full scene.<br />
The upper two images (a, b) present the Jharia <str<strong>on</strong>g>coal</str<strong>on</strong>g> field. The lower two subsets (c, d) present a <str<strong>on</strong>g>coal</str<strong>on</strong>g> field<br />
approximately 100 km west of Jharia close to the small town of Rāy. Center coordinate of upper subset:<br />
428060E, 2624047N, UTM, Z45 N, WGS 84. Center coordinate of lower subset: 307711 E, 2621553 N, UTM,<br />
Z45 N, WGS84.<br />
Table 8-4: Reducti<strong>on</strong> of the full scene <str<strong>on</strong>g>areas</str<strong>on</strong>g> to <str<strong>on</strong>g>coal</str<strong>on</strong>g> <str<strong>on</strong>g>fire</str<strong>on</strong>g> <str<strong>on</strong>g>risk</str<strong>on</strong>g> <str<strong>on</strong>g>areas</str<strong>on</strong>g> <str<strong>on</strong>g>based</str<strong>on</strong>g> <strong>on</strong> the automated extracti<strong>on</strong> of <str<strong>on</strong>g>coal</str<strong>on</strong>g>, a<br />
delineati<strong>on</strong> <str<strong>on</strong>g>based</str<strong>on</strong>g> <strong>on</strong> this area and exclusi<strong>on</strong> of densely vegetated <str<strong>on</strong>g>areas</str<strong>on</strong>g> within this z<strong>on</strong>e for the Jharia regi<strong>on</strong><br />
Date<br />
Overall<br />
pixels<br />
Extracted <str<strong>on</strong>g>coal</str<strong>on</strong>g><br />
pixels, [km²]<br />
Buffer regi<strong>on</strong><br />
pixels, [km²]<br />
Veg. exclusi<strong>on</strong>,<br />
pixels [km²]<br />
Area [km²]<br />
remaining<br />
% of<br />
scene<br />
2001-11 58440921 77665 (69.89) 3532214<br />
(3178.9)<br />
2667462<br />
(2400.7)<br />
864752<br />
(778.27)<br />
1.48<br />
It can be noted that the delineated regi<strong>on</strong> for the broader Jharia area is very large, which results from<br />
the err<strong>on</strong>eously extracted <str<strong>on</strong>g>areas</str<strong>on</strong>g>. Every little lake or surface, which was extracted as <str<strong>on</strong>g>coal</str<strong>on</strong>g>, is delineated<br />
with a 500 m radius delineati<strong>on</strong>. At the same time, dense vegetati<strong>on</strong> exclusi<strong>on</strong> reduces this delineated<br />
area substantially. It plays a much larger role c<strong>on</strong>cerning the final remaining <str<strong>on</strong>g>coal</str<strong>on</strong>g> <str<strong>on</strong>g>fire</str<strong>on</strong>g> (<str<strong>on</strong>g>risk</str<strong>on</strong>g>) area than<br />
for the study <str<strong>on</strong>g>areas</str<strong>on</strong>g>. Even though next to the extracti<strong>on</strong> of real <str<strong>on</strong>g>coal</str<strong>on</strong>g> a lot of other surfaces were<br />
extracted, the final area sums up to less than 1.48% of the spatial extent of the original data input. The<br />
surface extracti<strong>on</strong> accuracies are presented in subchapter 8.3.. The transferability of the algorithm for<br />
such a different envir<strong>on</strong>ment as for tropical India is discussed in subchapter 8.4..<br />
- 154 -
8.2.2.3. Baotou, China<br />
Baotou in Inner M<strong>on</strong>golia, China, is located approximately 320 km northeast of Wuda. The city has<br />
approximately 1.8 Mio inhabitants, located 15 km north of the Yellow River’s northernmost outreach.<br />
Further east the river turns South to flow towards the northeast Chinese<br />
lowland. North of Baotou the Yin Shan mountain range rises. However,<br />
the broader Baotou area and the area to the South is flat. The climate is a<br />
semi-arid to arid half desert climate comparable to Wuda and<br />
surrounding. Fertile flood plains al<strong>on</strong>g the Yellow River are used for<br />
irrigated agriculture. Coal mined in the Baotou area is used for ir<strong>on</strong> and<br />
steel processing <str<strong>on</strong>g>based</str<strong>on</strong>g> <strong>on</strong> ir<strong>on</strong> ore, which is mined in Baiyunebo, about<br />
150 km north of Baotou.<br />
Figure 8-25: Locati<strong>on</strong> of the ETM+ transfer scene from northern China<br />
a<br />
N<br />
b<br />
N<br />
Figure 8-26: Original data (a) and <str<strong>on</strong>g>coal</str<strong>on</strong>g> pixels extracted for the scene of Baotou, northern China (b). The subset<br />
displays <strong>on</strong>ly part of the full scene. Center coordinate: 404361E, 4502452N, UTM, Z49 N, WGS 84.<br />
Few <str<strong>on</strong>g>coal</str<strong>on</strong>g> pixels were extracted from the scene of Baotou. C<strong>on</strong>fusi<strong>on</strong> with water did not occur, <strong>on</strong>ly a<br />
few shadow margin <str<strong>on</strong>g>areas</str<strong>on</strong>g> were extracted as <str<strong>on</strong>g>coal</str<strong>on</strong>g> also. A DEM or shadow file did not exist for the area.<br />
Therefore the shadow removal was not 100 %. However, visual interpretati<strong>on</strong> indicates that all <str<strong>on</strong>g>coal</str<strong>on</strong>g><br />
<str<strong>on</strong>g>areas</str<strong>on</strong>g> were extracted with high accuracy. Table 8-5 presents the detailed numbers for the full scene.<br />
Extracted <str<strong>on</strong>g>coal</str<strong>on</strong>g> pixels make less than 0.016 % of the full feature space, the delineated area covers 0.9<br />
% of the whole scene before- and 0.59 % after dense vegetati<strong>on</strong> exclusi<strong>on</strong>. Finally, less than 0.59 % of<br />
the scene remain as a <str<strong>on</strong>g>coal</str<strong>on</strong>g> <str<strong>on</strong>g>fire</str<strong>on</strong>g> <str<strong>on</strong>g>risk</str<strong>on</strong>g> area. The algorithm could not detect pyrometamorphic rock in the<br />
area. It is not known that pyrometamorphic rock exists. A detailed <str<strong>on</strong>g>coal</str<strong>on</strong>g> <str<strong>on</strong>g>fire</str<strong>on</strong>g> <str<strong>on</strong>g>risk</str<strong>on</strong>g> map for the scene of<br />
Baotou is presented in chapter 10.<br />
Table 8-5: Reducti<strong>on</strong> of the full scene <str<strong>on</strong>g>areas</str<strong>on</strong>g> to <str<strong>on</strong>g>coal</str<strong>on</strong>g> <str<strong>on</strong>g>fire</str<strong>on</strong>g> <str<strong>on</strong>g>risk</str<strong>on</strong>g> <str<strong>on</strong>g>areas</str<strong>on</strong>g> <str<strong>on</strong>g>based</str<strong>on</strong>g> <strong>on</strong> the automated extracti<strong>on</strong> of <str<strong>on</strong>g>coal</str<strong>on</strong>g>, a<br />
delineati<strong>on</strong> around this area and exclusi<strong>on</strong> of densely vegetated <str<strong>on</strong>g>areas</str<strong>on</strong>g> within this z<strong>on</strong>e for the Baotou regi<strong>on</strong><br />
Date<br />
Overall<br />
pixels<br />
Extracted <str<strong>on</strong>g>coal</str<strong>on</strong>g><br />
pixels, [km²]<br />
Buffer regi<strong>on</strong><br />
pixels, [km²]<br />
Veg. exclusi<strong>on</strong>,<br />
pixels [km²]<br />
Area [km²]<br />
remaining<br />
% of<br />
scene<br />
2002-08 61731741 10388 (9.34) 557669<br />
(501.90)<br />
189140 (170.22) 368529<br />
(331.67)<br />
0.59<br />
- 155 -
8.3. Quantificati<strong>on</strong> and Error Analysis of the Test Sequence Results<br />
8.3.1. Quantificati<strong>on</strong> and Error Analysis for the Main Study Areas<br />
Figure 8-27 a to d illustrate the performance of the algorithm for <str<strong>on</strong>g>coal</str<strong>on</strong>g> extracti<strong>on</strong> for three times steps<br />
for the Ruqigou and the Wuda area. The pixel numbers refer to the pixels remaining after <strong>test</strong> 1 until<br />
after <strong>test</strong> 6 and after the filtering of the result. The starting point (number of pixels of the original input<br />
data set) is not included in figure 8-27 a and b for better visualizati<strong>on</strong>. See figure 8-27 c to d for the<br />
performance of the full <str<strong>on</strong>g>coal</str<strong>on</strong>g> <str<strong>on</strong>g>fire</str<strong>on</strong>g> <str<strong>on</strong>g>risk</str<strong>on</strong>g> area demarcati<strong>on</strong> scheme. The quantitative extracti<strong>on</strong> results<br />
enable the investigati<strong>on</strong> of the influence and importance of the different <strong>test</strong>s (filters) for spatial<br />
reducti<strong>on</strong>.<br />
a<br />
b<br />
c<br />
d<br />
Figure 8-27: Areal reducti<strong>on</strong> with progressi<strong>on</strong> of the knowledge <str<strong>on</strong>g>based</str<strong>on</strong>g> <str<strong>on</strong>g>coal</str<strong>on</strong>g> extracti<strong>on</strong> <strong>test</strong> sequence (a, b) and<br />
for the overall <strong>test</strong> sequence (c, d) for the broader Wuda and Ruqigou area. Exemplarily visualized for three<br />
time steps 2000, 2001 and 2002-09.<br />
In tables 8-6 and 8-7 the impacts of the different <strong>test</strong>s are presented <strong>on</strong> a quantitative basis via the<br />
number of pixels, which are left after each <strong>test</strong>. Furthermore, the percentage of the area excluded by<br />
each <strong>test</strong> compared to the result of the antecedent <strong>test</strong> is calculated. In both tables the last column<br />
represents the mean of this percentage over the three time steps investigated. As presented in table 8-6<br />
for the Wuda study area <strong>test</strong> 1 already reduces the data for further <strong>test</strong>ing to an average of 4.17% of<br />
the input data set size. As stated in subchapter 8.2. this <strong>test</strong> already enables the exclusi<strong>on</strong> of all<br />
surfaces but <str<strong>on</strong>g>coal</str<strong>on</strong>g>, shadow, shadow margin and water. Therefore it has a significant influence. Tests 2,<br />
3, 4 and 5 reduce the area of their previous <strong>test</strong> result between 18- and 25 % respectively. Test 6 leads<br />
to a clear reducti<strong>on</strong> of the result of <strong>test</strong> 5 for about 52 %. Therefore, the SPM <strong>test</strong> 1 as well as the<br />
relative temperature <strong>test</strong> 6 can be c<strong>on</strong>sidered two very stable and important <strong>test</strong>s for <str<strong>on</strong>g>coal</str<strong>on</strong>g> extracti<strong>on</strong> in<br />
Wuda. The situati<strong>on</strong> for Ruqigou is similar. An areal reducti<strong>on</strong> of over 87 % after <strong>test</strong> 1, a more or less<br />
equal influence of <strong>test</strong> 2, 3 and 5 reducing the area for further 5- to 15 % and an areal reducti<strong>on</strong> by <strong>test</strong><br />
4, reduces the spatial outcome of <strong>test</strong> 3 for even 42 %. As for Wuda, <strong>test</strong> 6 yields a very dominant<br />
- 156 -
areal reducti<strong>on</strong> exceeding 75% of the <strong>test</strong> 5 result. The majority filtering procedure after <strong>test</strong> 6<br />
furthermore filters about 18% of the pixels for the Wuda area and eliminates over 40% of the pixels<br />
for the Ruqigou area. The reas<strong>on</strong> for a str<strong>on</strong>ger effect of the final filter in the Ruqigou regi<strong>on</strong> can be<br />
explained with the alpine terrain, including a larger spatial coverage with shadow- and shadow margin<br />
regi<strong>on</strong>s. More single scattered pixels remain after the six <str<strong>on</strong>g>coal</str<strong>on</strong>g> extracti<strong>on</strong> <strong>test</strong>s. For both <str<strong>on</strong>g>areas</str<strong>on</strong>g><br />
delineating an area around the extracted <str<strong>on</strong>g>coal</str<strong>on</strong>g> surfaces defines an area for further investigati<strong>on</strong>. The<br />
resulting spatial increase is for Ruqigou larger than for Wuda. More single clusters are distributed in<br />
Ruqigou. Vegetati<strong>on</strong> exclusi<strong>on</strong> in the two semiarid to arid regi<strong>on</strong>s diminishes the final <str<strong>on</strong>g>risk</str<strong>on</strong>g> area for<br />
<strong>on</strong>ly 2-3%.<br />
Table 8-6: Relevance of the single <strong>test</strong>s, filters and delineati<strong>on</strong> for the areal reducti<strong>on</strong> of the input data set for<br />
three exemplary time steps for the broader Wuda study area<br />
2000-10<br />
Pixels<br />
% of<br />
previous<br />
2001-10<br />
Pixels<br />
% of<br />
previous<br />
2002-09<br />
Pixels<br />
% of<br />
previous<br />
Mean %<br />
previous<br />
Original size 1783397 1783397 1783397<br />
After <strong>test</strong> 1 69320 3.89 90929 5.10 62737 3.52 4.17<br />
After <strong>test</strong> 2 54812 79.07 63930 70.31 48161 76.77 75.38<br />
After <strong>test</strong> 3 51679 94.28 59035 92.34 43433 90.18 92.27<br />
After <strong>test</strong> 4 46113 89.23 39457 66.84 28769 66.24 74.10<br />
After <strong>test</strong> 5 37554 81.44 36165 91.66 28228 98.12 90.41<br />
After <strong>test</strong> 6 14962 39.84 16008 44.26 16318 57.81 47.30<br />
After filtering 11464 76.62 13764 85.98 13784 84.47 82.36<br />
After delineati<strong>on</strong> 203208 1772.58 209463 1521.82 207871 1508.06 1600.82<br />
After veg. exclusi<strong>on</strong> 202565 99.68 207053 98.85 200939 96.67 98.40<br />
Table 8-7: Relevance of the single <strong>test</strong>s, filters and buffers for the areal reducti<strong>on</strong> of the input data set for three<br />
exemplary time steps for the broader Ruqigou study area<br />
2000-10<br />
Pixels<br />
% of<br />
previous<br />
2001-10<br />
Pixels<br />
% of<br />
previous<br />
2002-09<br />
Pixels<br />
% of<br />
previous<br />
Mean %<br />
previous<br />
Original size 2058820 2058820 2058820<br />
After <strong>test</strong> 1 207788 10.09 275779 13.40 268383 13.04 12.17<br />
After <strong>test</strong> 2 167788 80.75 242706 88.01 230047 85.72 84.82<br />
After <strong>test</strong> 3 163088 97.20 230709 95.06 214740 93.35 95.20<br />
After <strong>test</strong> 4 132894 81.49 128726 55.80 80882 37.67 58.32<br />
After <strong>test</strong> 5 95797 72.09 111833 86.88 78232 96.72 85.23<br />
After <strong>test</strong> 6 20245 21.13 16794 15.02 25565 32.68 22.94<br />
After filtering 9515 47.00 11662 69.44 16205 63.39 59.94<br />
After delineati<strong>on</strong> 259066 2722.71 196747 1687.08 326470 2014.63 2141.47<br />
After veg. exclusi<strong>on</strong> 255850 98.76 190978 97.07 308453 94.48 96.77<br />
Tables 8-8 and 8-9 present the accuracy assessment for the extracti<strong>on</strong> of <str<strong>on</strong>g>coal</str<strong>on</strong>g> and dense vegetati<strong>on</strong><br />
<str<strong>on</strong>g>based</str<strong>on</strong>g> <strong>on</strong> the equati<strong>on</strong>s presented in the theory of accuracy assessment illustrated in chapter 3. Tables<br />
8-10 and 8-11 illustrate the accuracy of the demarcated <str<strong>on</strong>g>coal</str<strong>on</strong>g> <str<strong>on</strong>g>fire</str<strong>on</strong>g> <str<strong>on</strong>g>risk</str<strong>on</strong>g> area <strong>on</strong> the basis of the <str<strong>on</strong>g>coal</str<strong>on</strong>g> <str<strong>on</strong>g>fire</str<strong>on</strong>g><br />
field mappings from the year 2002 for Wuda and for Ruqigou.<br />
- 157 -
As seen in table 8-8 for the extracti<strong>on</strong> results from 1987 and 1999 no ground truth is available. For<br />
2000 a small map subset including the industrial <str<strong>on</strong>g>coal</str<strong>on</strong>g> storage piles within the mine was available. For<br />
2002 and 2003 map data as well as ground truth mappings and for the latter high resoluti<strong>on</strong> Quickbird<br />
data was used.<br />
Table 8-8: Accuracy of the extracted <str<strong>on</strong>g>coal</str<strong>on</strong>g> (filtered) and dense vegetati<strong>on</strong> pixels for Wuda<br />
Date Prod. accuracy, <str<strong>on</strong>g>coal</str<strong>on</strong>g> Prod. accuracy, dense vegetati<strong>on</strong><br />
1987-09 not available not available<br />
1999-08 not available not available<br />
2000-10 93.21% (Wuda mine) not available<br />
2001-10 not available not available<br />
2002-09 92.10% (mapping) 95.04% (mapping)<br />
2002-12 90.34% (mapping) not available, winter<br />
2003-02 92.79% (mapping) not available, winter<br />
2003-05 93.89% (Quickbird & mapping) 96.32% (Quickbird & mapping)<br />
The mixture grids presented in chapter 4, which were mapped during the field work in 2002 could be<br />
used here for validati<strong>on</strong> of the <str<strong>on</strong>g>coal</str<strong>on</strong>g> extracted for the scene of Wuda from September 2002. Within the<br />
three grids 15 50m cells were mapped exceeding 90% <str<strong>on</strong>g>coal</str<strong>on</strong>g> influence and can be regarded as pure <str<strong>on</strong>g>coal</str<strong>on</strong>g>.<br />
All but four of these cells are located within <str<strong>on</strong>g>coal</str<strong>on</strong>g> surfaces extracted for the scene from September.<br />
In Ruqigou (table 8-9) for 1987 no ground truth was available. For 1999 digital data from a former<br />
Sino-Dutch project could be used for the producer accuracy calculati<strong>on</strong>. For the year 2000 Ik<strong>on</strong>os data<br />
provided by ARSC (Aerophotogrammetry and Remote Sensing China, Xi’An) was available. For 2002<br />
and 2003 field mappings and for the later year high resoluti<strong>on</strong> Quickbird data was available.<br />
Pyrometamorphic rock was mapped in the field in 2002 as well as <strong>on</strong> the basis of the Quickbird data<br />
from 2003 and was <strong>on</strong>ly extracted for these two years. It needs to be pointed out that no user’s<br />
accuracy could be calculated. The producer’s accuracy for the extracti<strong>on</strong> of burned rock is 100% for<br />
2002 and 2003 and 93.64% for 2000. Although this indicates that the area mapped in the field is<br />
extracted as a pyrometamoprhic area by the algorithm, the probability that a pixel, extracted as<br />
pyrometamorphic rock really bel<strong>on</strong>gs to this class probably very low.<br />
Table 8-9: Accuracy of the extracted <str<strong>on</strong>g>coal</str<strong>on</strong>g> (filtered), dense vegetati<strong>on</strong> and burned rock pixels for Ruqigou<br />
Date Prod. accuracy, <str<strong>on</strong>g>coal</str<strong>on</strong>g> Prod. accuracy, dense veg. Prod. accuracy, pyro. rock<br />
1987-09 not available not available not available<br />
1999-08 95.98% (ITC project data) not available not available<br />
2000-10 94.11% (Ik<strong>on</strong>os) Not available not available<br />
2001-10 not available not available not available<br />
2002-09 95.65% (mapping) 94.45% (mapping) 100% (mapping)<br />
2002-12 94.24% (mapping) not available, winter not available<br />
2003-02 93.45% (mapping) not available, winter not available<br />
2003-05 95.96% (QB & mapping) 93.62% (QB & mapping) 100% (mapping)<br />
Table 8-10 and figure 8-28 present how much of the <str<strong>on</strong>g>coal</str<strong>on</strong>g> <str<strong>on</strong>g>fire</str<strong>on</strong>g> polyg<strong>on</strong>s mapped for Wuda in 2000 is<br />
located within the automatically demarcated <str<strong>on</strong>g>coal</str<strong>on</strong>g> <str<strong>on</strong>g>fire</str<strong>on</strong>g> <str<strong>on</strong>g>areas</str<strong>on</strong>g>. Both field mappings were intersected with<br />
the <str<strong>on</strong>g>risk</str<strong>on</strong>g> <str<strong>on</strong>g>areas</str<strong>on</strong>g> derived from the 2002-09 data set. The same is presented in table 8-11 and figure 8-29.<br />
- 158 -
Table 8-10: Percentage of <str<strong>on</strong>g>fire</str<strong>on</strong>g> polyg<strong>on</strong>s mapped in the Wuda area during the field campaign in 2002 included in<br />
the delineated area from the 2002-09 scene for a 500m and a 1000 m buffer.<br />
Fire #<br />
Demarcati<strong>on</strong><br />
2002 (500 m)<br />
Demarcati<strong>on</strong><br />
2002 (1000m)<br />
Fire # 1 99.87 99.87<br />
Fire # 2 0.00 97.01<br />
Fire # 3 12.92 71.04<br />
Fire # 4 100.00 100.00<br />
Fire # 5 0.00 96.61<br />
Fire # 6 92.14 99.60<br />
Fire # 7 44.50 99.60<br />
Fire # 8 89.20 99.08<br />
Fire # 9 100.00 100.00<br />
Fire # 10 77.60 98.73<br />
Fire # 11 97.89 99.29<br />
Fire # 12 99.36 99.35<br />
Fire # 13 100.00 100.00<br />
Fire # 14 100.00 100.00<br />
Fire # 15 0.00 100.00<br />
Fire # 16 100.00 100.00<br />
Fire # 17 0.00 60.02<br />
a<br />
1 km<br />
b<br />
N<br />
Figure 8-28: a: Extracted <str<strong>on</strong>g>coal</str<strong>on</strong>g> surfaces (white) and<br />
superimposed <str<strong>on</strong>g>coal</str<strong>on</strong>g> <str<strong>on</strong>g>fire</str<strong>on</strong>g> polyg<strong>on</strong>s. b: Extracted <str<strong>on</strong>g>coal</str<strong>on</strong>g><br />
<str<strong>on</strong>g>fire</str<strong>on</strong>g> (<str<strong>on</strong>g>risk</str<strong>on</strong>g>) area (white) and mapped <str<strong>on</strong>g>coal</str<strong>on</strong>g> <str<strong>on</strong>g>fire</str<strong>on</strong>g> outlines<br />
for the year 2002-09 (red) for the broader area of<br />
Wuda. Center coordinate of the subset: 641952E,<br />
4376514N, UTM, Z48N, WGS84. The Wuda <str<strong>on</strong>g>coal</str<strong>on</strong>g><br />
<str<strong>on</strong>g>fire</str<strong>on</strong>g>s are numbered from 1-17<br />
10<br />
It can clearly be seen that a delineati<strong>on</strong> radius of<br />
8<br />
11<br />
500 m around <str<strong>on</strong>g>coal</str<strong>on</strong>g> surfaces for the Wuda area is<br />
12<br />
too small to cover all mapped <str<strong>on</strong>g>coal</str<strong>on</strong>g> <str<strong>on</strong>g>fire</str<strong>on</strong>g><br />
13<br />
polyg<strong>on</strong>s. Fires #2, #3, #5, #15 and #17 are not<br />
1 km<br />
included in the <str<strong>on</strong>g>coal</str<strong>on</strong>g> <str<strong>on</strong>g>fire</str<strong>on</strong>g> <str<strong>on</strong>g>risk</str<strong>on</strong>g> area. Even though<br />
these <str<strong>on</strong>g>fire</str<strong>on</strong>g>s are relatively “cold” and have<br />
14<br />
N<br />
negligible surface expressi<strong>on</strong>s, all underground <str<strong>on</strong>g>coal</str<strong>on</strong>g> <str<strong>on</strong>g>fire</str<strong>on</strong>g>s should be included in the demarcated area.<br />
Applying a 1 km demarcati<strong>on</strong> radius clearly improves the coverage of <str<strong>on</strong>g>coal</str<strong>on</strong>g> <str<strong>on</strong>g>fire</str<strong>on</strong>g>s. Except for <str<strong>on</strong>g>fire</str<strong>on</strong>g> #3 and<br />
<str<strong>on</strong>g>fire</str<strong>on</strong>g> #17 all <str<strong>on</strong>g>fire</str<strong>on</strong>g>s are covered sufficiently between 96.61% and 100%. Values slightly below 100%<br />
occur due to vegetati<strong>on</strong> extracti<strong>on</strong> and subtracti<strong>on</strong>.<br />
The weaker results from the 500 m delineati<strong>on</strong> result from two causes. Firstly, <str<strong>on</strong>g>coal</str<strong>on</strong>g> <str<strong>on</strong>g>fire</str<strong>on</strong>g> polyg<strong>on</strong>s in<br />
the field do not really represent the underground situati<strong>on</strong>. It is known that the <str<strong>on</strong>g>fire</str<strong>on</strong>g>s were mapped<br />
rather too big than too small. Furthermore, it has already been menti<strong>on</strong>ed that the <str<strong>on</strong>g>coal</str<strong>on</strong>g> extracti<strong>on</strong> for<br />
Wuda (after filtering) tends to underestimate the <str<strong>on</strong>g>coal</str<strong>on</strong>g> covered surfaces. For Ruqigou the <str<strong>on</strong>g>coal</str<strong>on</strong>g><br />
extracti<strong>on</strong> result has slightly higher accuracies. Here a 500 m radius for the delineati<strong>on</strong> of a <str<strong>on</strong>g>risk</str<strong>on</strong>g> area<br />
covers all <str<strong>on</strong>g>coal</str<strong>on</strong>g> <str<strong>on</strong>g>fire</str<strong>on</strong>g>s sufficiently.<br />
2<br />
16<br />
6<br />
9<br />
3<br />
5<br />
4<br />
15<br />
1<br />
7<br />
17<br />
- 159 -
Table 8-11: Percentage of <str<strong>on</strong>g>fire</str<strong>on</strong>g> polyg<strong>on</strong>s mapped in the Ruqigou during the field campaign in 2002 included in<br />
the demarcated <str<strong>on</strong>g>coal</str<strong>on</strong>g> <str<strong>on</strong>g>fire</str<strong>on</strong>g> (<str<strong>on</strong>g>risk</str<strong>on</strong>g>) area from the September 2002 scene.<br />
Fire # Demarcati<strong>on</strong> 2002<br />
(500 m)<br />
a<br />
Fire # 21 96.90 %<br />
Fire # 22 94.78 %<br />
Fire # 23 91.66 %<br />
Fire # 24 99.98 %<br />
Fire # 25 90.52 %<br />
Fire # 31 98.36 %<br />
Fire # 22 100 %<br />
Fire # 33 98.68 %<br />
Fire # 34 97.18 %<br />
Fire # 35 95.55 %<br />
Fire # 36 96.07 %<br />
Fire # 37 99.56 %<br />
Fire # 38 99.40 %<br />
Fire # 39 100 %<br />
Fire # 40 98.05 %<br />
Fire # 41 97.29 %<br />
Fire # 42 100.00 %<br />
Fire # 43 99.62 %<br />
Fire # 44 99.18 %<br />
Fire # 45 91.88 %<br />
1 km<br />
Figure 8-29: a: Extracted <str<strong>on</strong>g>coal</str<strong>on</strong>g> surfaces<br />
(white) and superimposed <str<strong>on</strong>g>coal</str<strong>on</strong>g> <str<strong>on</strong>g>fire</str<strong>on</strong>g><br />
polyg<strong>on</strong>s. b: Extracted <str<strong>on</strong>g>coal</str<strong>on</strong>g> <str<strong>on</strong>g>fire</str<strong>on</strong>g> (<str<strong>on</strong>g>risk</str<strong>on</strong>g>)<br />
area (white) and mapped <str<strong>on</strong>g>coal</str<strong>on</strong>g> <str<strong>on</strong>g>fire</str<strong>on</strong>g><br />
outlines for the year 2002 (red) for the<br />
broader area of Ruqigou. Center<br />
coordinate of the subset: 595800E,<br />
4325705 N, UTM, Z48N, WGS 84. The<br />
Gulaben <str<strong>on</strong>g>coal</str<strong>on</strong>g> <str<strong>on</strong>g>fire</str<strong>on</strong>g>s are numbered from<br />
1 km<br />
21-25, the Ruqigou <str<strong>on</strong>g>coal</str<strong>on</strong>g> <str<strong>on</strong>g>fire</str<strong>on</strong>g>s are<br />
numbered from 31-45. All together the<br />
mapped <str<strong>on</strong>g>coal</str<strong>on</strong>g> <str<strong>on</strong>g>fire</str<strong>on</strong>g> area (red polyg<strong>on</strong>s) covers 6,11 km².<br />
b<br />
23<br />
22<br />
21<br />
24<br />
25<br />
31<br />
24 34<br />
36<br />
35<br />
38<br />
39<br />
40<br />
43<br />
44<br />
42<br />
41<br />
45<br />
32<br />
33<br />
N<br />
N<br />
It is important to rather overestimate the delineati<strong>on</strong> radius to grant the coverage of all possible <str<strong>on</strong>g>coal</str<strong>on</strong>g><br />
<str<strong>on</strong>g>fire</str<strong>on</strong>g> <str<strong>on</strong>g>risk</str<strong>on</strong>g> <str<strong>on</strong>g>areas</str<strong>on</strong>g> than to choose the radius too small. An exclusi<strong>on</strong> of thermal anomalies extracted with<br />
the thermal algorithm of ZHANG, J. (2004), which might actually be <str<strong>on</strong>g>coal</str<strong>on</strong>g> <str<strong>on</strong>g>fire</str<strong>on</strong>g> related thermal<br />
anomalies has to be avoided. This phenomen<strong>on</strong> is also addressed when combining the results of<br />
automated <str<strong>on</strong>g>coal</str<strong>on</strong>g> <str<strong>on</strong>g>fire</str<strong>on</strong>g> area demarcati<strong>on</strong> with thermal analysis.<br />
- 160 -
8.3.2. Quantificati<strong>on</strong> and Error Analyses of the Transfer Regi<strong>on</strong>s<br />
Table 8-12 and figure 8-30 present the <strong>test</strong> sequence performance for Baotou, Australia and India. For<br />
Baotou <strong>test</strong>s 1 and 6 have a high impact as well as <strong>test</strong> 4 and 5, which filter for the <strong>spectral</strong> properties<br />
of <str<strong>on</strong>g>coal</str<strong>on</strong>g> in the NIR and exclude large <str<strong>on</strong>g>areas</str<strong>on</strong>g> covered by lakes or the Yellow River. Test 3 can exclude<br />
about 30% of the remaining pixels left after <strong>test</strong> 2, even though no DEM is available. These are<br />
shadowed pixels located within the mountain range stretching from West to East north of Baotou. Also<br />
vegetati<strong>on</strong> exclusi<strong>on</strong> plays a major role in the reducti<strong>on</strong> of the delineated <str<strong>on</strong>g>coal</str<strong>on</strong>g> <str<strong>on</strong>g>fire</str<strong>on</strong>g> <str<strong>on</strong>g>risk</str<strong>on</strong>g> area. It averages<br />
30%. For Australia the SPM and the temperature filter work very good for areal reducti<strong>on</strong>. The same<br />
applies for <strong>test</strong> 4, which can exclude nearly 70% of the resulting pixels from <strong>test</strong> 3. Test 3 itself has<br />
nearly no impact, which was expected, since there are hardly any shadowed <str<strong>on</strong>g>areas</str<strong>on</strong>g> in the scene. For the<br />
scene in India the average percentage exclusi<strong>on</strong> varies from the overall pattern recognizable for the<br />
scenes from the (semi-) arid regi<strong>on</strong>s. While the first <strong>test</strong> leads to a large reducti<strong>on</strong> and the sec<strong>on</strong>d is of<br />
similar influence as for the other scenes, <strong>test</strong> 3 can largely reduce the result of <strong>test</strong> 2. Here, all<br />
shadowed <str<strong>on</strong>g>areas</str<strong>on</strong>g> and a lot of very dark water surfaces, which may have 0% reflectance in <strong>on</strong>e of the<br />
channels are reduced. Furthermore, some topographic (shadow) influences can be excluded.<br />
a<br />
b<br />
c<br />
d<br />
e<br />
f<br />
Figure 8-30: Areal reducti<strong>on</strong> with progressi<strong>on</strong> of the knowledge <str<strong>on</strong>g>based</str<strong>on</strong>g> <str<strong>on</strong>g>coal</str<strong>on</strong>g> extracti<strong>on</strong> <strong>test</strong> sequence (a, b, c)<br />
and for the overall <strong>test</strong> sequence (d, e, f) for three transfer <str<strong>on</strong>g>areas</str<strong>on</strong>g>, Baotou in northern China, Leigh Creek in<br />
Australia and Jharia in India.<br />
- 161 -
Test 6 <strong>on</strong>ly yields a reducti<strong>on</strong> of 24% of the <strong>test</strong> 5 result. Temperatures of water, shadow and <str<strong>on</strong>g>coal</str<strong>on</strong>g> are<br />
within the upper range of the thermal histogram. The temperature <str<strong>on</strong>g>based</str<strong>on</strong>g> differentiati<strong>on</strong> of the three in<br />
this tropical envir<strong>on</strong>ment works not as well. Shadow and some water surfaces, which have identical<br />
temperatures to <str<strong>on</strong>g>coal</str<strong>on</strong>g> cannot be differentiated.<br />
Very obvious is the str<strong>on</strong>g areal reducti<strong>on</strong> of the demarcated probable <str<strong>on</strong>g>coal</str<strong>on</strong>g> <str<strong>on</strong>g>fire</str<strong>on</strong>g> <str<strong>on</strong>g>risk</str<strong>on</strong>g> area <str<strong>on</strong>g>based</str<strong>on</strong>g> <strong>on</strong> the<br />
exclusi<strong>on</strong> of dense vegetati<strong>on</strong>. In the tropical envir<strong>on</strong>ment densely vegetated <str<strong>on</strong>g>areas</str<strong>on</strong>g> or agricultural land<br />
reach close to the <str<strong>on</strong>g>coal</str<strong>on</strong>g> mining <str<strong>on</strong>g>areas</str<strong>on</strong>g> and basically the whole scene is str<strong>on</strong>gly covered with vegetati<strong>on</strong>.<br />
Table 8-12: Relevance of the single <strong>test</strong>s, filters and delineati<strong>on</strong> for the areal reducti<strong>on</strong> of the input data set for<br />
three exemplary time steps for the three transfer <str<strong>on</strong>g>areas</str<strong>on</strong>g><br />
Australia<br />
Pixels<br />
% of<br />
previous<br />
Baotou<br />
Pixels<br />
% of<br />
previous<br />
India<br />
Pixels<br />
% of<br />
previous<br />
Original size 3788996 61731741 58440921<br />
After <strong>test</strong> 1 102501 2.71 991319 1.61 3652999 6.25<br />
After <strong>test</strong> 2 78803 76.88 722701 72.90 3197152 87.52<br />
After <strong>test</strong> 3 78193 99.23 504798 69.85 369950 11.57<br />
After <strong>test</strong> 4 25425 32.52 123039 24.37 224567 60.70<br />
After <strong>test</strong> 5 24735 97.29 31456 25.57 206789 92.08<br />
After <strong>test</strong> 6 7840 31.70 28616 90.97 155820 75.35<br />
After filtering 6786 86.56 10388 36.30 77665 49.84<br />
After delineati<strong>on</strong> 55621 819.64 557669 5368.40 3532214 4548.01<br />
After veg. exclusi<strong>on</strong> 55457 99.71 368529 66.08 864752 24.48<br />
Table 8-13 presents the overall mean of the single <strong>test</strong> results calculated from the average means of<br />
Wuda and Ruqigou as well as the mean of Baotou, Australia and India. Test 2, 3 and 5 dem<strong>on</strong>strate an<br />
equal influence around 20-25 % areal reducti<strong>on</strong> compared to the antecedent <strong>test</strong> result, while <strong>test</strong> 4 and<br />
<strong>test</strong> 6 lead to a clear reducti<strong>on</strong> around 50%. The final majority filter excludes 37 % of the leftover<br />
pixels. Delineati<strong>on</strong> with a 500 m radius increases the remaining area for nearly the 50-fold. Following<br />
vegetati<strong>on</strong> exclusi<strong>on</strong> does not play an as important role, as presented in this table. The str<strong>on</strong>g decrease<br />
of nearly 28% results from the influence of the overproporti<strong>on</strong>al influence of the scene from India.<br />
Table 8-13: Relevance of the single <strong>test</strong>s, filters and delineati<strong>on</strong> for the<br />
reducti<strong>on</strong> of the input data. Averaged % reducti<strong>on</strong> in comparis<strong>on</strong> with<br />
the previous <strong>test</strong> sequence result calculated for all five <str<strong>on</strong>g>areas</str<strong>on</strong>g><br />
Sequential step<br />
Mean % of previous for all<br />
input data sets<br />
After <strong>test</strong> 1 5.38<br />
After <strong>test</strong> 2 79.50<br />
After <strong>test</strong> 3 73.62<br />
After <strong>test</strong> 4 50.00<br />
After <strong>test</strong> 5 78.11<br />
After <strong>test</strong> 6 53.65<br />
After filtering 63.00<br />
After delineati<strong>on</strong> 2895.67<br />
After veg. exclusi<strong>on</strong> 77.09<br />
- 162 -
Tables 8-14 to 8-16 show the producer accuracy for the surfaces extracted in the transfer regi<strong>on</strong>s.<br />
Unlike for Wuda or Ruqigou ground truth had to be collected from publicly available data of former<br />
projects, the internet and data received via pers<strong>on</strong>al c<strong>on</strong>tacts. Quantitative statements <strong>on</strong> mapping<br />
methods or geometric precisi<strong>on</strong> of this ground truth data can not be made.<br />
Table 8-14: Accuracy of the extracted <str<strong>on</strong>g>coal</str<strong>on</strong>g> (filtered) and dense vegetati<strong>on</strong> pixels for Australia<br />
Date Prod. accuracy, <str<strong>on</strong>g>coal</str<strong>on</strong>g> Prod. accuracy, dense vegetati<strong>on</strong><br />
15.11.2002 98.03% (geol. & geomorph map) not available<br />
For the scene in Australia 98% of the area of the 4 polyg<strong>on</strong>s representing <str<strong>on</strong>g>coal</str<strong>on</strong>g> surfaces, which were<br />
available from the geologic and geomorphologic maps, were filled with <str<strong>on</strong>g>coal</str<strong>on</strong>g> pixels extracted. This is a<br />
very good result. Coal in Leigh Creek area is clearly distinguishable from the surrounding bedrock and<br />
due to the arid climate and industrialized mining methods land surface class borders are very distinct.<br />
However, it has to be menti<strong>on</strong>ed that ground truth polyg<strong>on</strong>s for other land cover classes did not exist<br />
and no user accuracy could be calculated. The probability of a pixel extracted to be <str<strong>on</strong>g>coal</str<strong>on</strong>g> can therefore<br />
<strong>on</strong>ly be assessed <strong>on</strong> a visual basis. Since – next to the <str<strong>on</strong>g>coal</str<strong>on</strong>g> mining regi<strong>on</strong> – hardly any (except very<br />
few shade) pixels were extracted, the user’s accuracy must also be very good. Vegetati<strong>on</strong> extracti<strong>on</strong><br />
did not play a major role in the further areal decrease of the <str<strong>on</strong>g>coal</str<strong>on</strong>g> <str<strong>on</strong>g>fire</str<strong>on</strong>g> (<str<strong>on</strong>g>risk</str<strong>on</strong>g>) area regi<strong>on</strong>.<br />
Table 8-15: Accuracy of the extracted <str<strong>on</strong>g>coal</str<strong>on</strong>g> (filtered) and dense vegetati<strong>on</strong> pixels for India<br />
Date Prod. accuracy, <str<strong>on</strong>g>coal</str<strong>on</strong>g> Prod. accuracy, dense vegetati<strong>on</strong><br />
02.11.2001 87.51% 99%<br />
For the scene from India 5 polyg<strong>on</strong>s derived from former maps and classificati<strong>on</strong>s processed for the<br />
Jharia area were available for <str<strong>on</strong>g>coal</str<strong>on</strong>g> and for agriculturally used fields respectively. The producer<br />
accuracy of <str<strong>on</strong>g>coal</str<strong>on</strong>g> is with 87% good. However, the extracti<strong>on</strong> result is weaker than for the other scenes.<br />
Two possible reas<strong>on</strong>s can explain this phenomen<strong>on</strong>. Firstly, for Australia real maps with ground truth<br />
were available. Even though the scene from Australia was not orthorectified, the locati<strong>on</strong> of geologic /<br />
geomorphologic units could easily be transferred to the satellite data, granting that no shift between<br />
ground truth and satellite data exists. Sec<strong>on</strong>dly, in India <strong>on</strong>ly projected ground truth polyg<strong>on</strong>s were<br />
available and the geometry had to be trusted. A slight mismatch between the polyg<strong>on</strong>s and the satellite<br />
data therefore might be possible. Furthermore, in India <str<strong>on</strong>g>coal</str<strong>on</strong>g> has a less distinct signal. The SD in the<br />
individual wavelength regi<strong>on</strong>s is very high and borders between pure <str<strong>on</strong>g>coal</str<strong>on</strong>g> and the surrounding <str<strong>on</strong>g>areas</str<strong>on</strong>g><br />
are fluent.<br />
Just as for Australia no producer accuracy could be calculated. However, opposite to Australia it is<br />
assumed that the user accuracy is much lower. A lot of pixels, which do not represent <str<strong>on</strong>g>coal</str<strong>on</strong>g> surfaces<br />
were extracted by the algorithm. These are mainly small clear lakes with a high water temperature and<br />
mixed pixels c<strong>on</strong>taining <str<strong>on</strong>g>coal</str<strong>on</strong>g> dust or similar material.<br />
Table 8-16: Accuracy of the extracted <str<strong>on</strong>g>coal</str<strong>on</strong>g> (filtered) and dense vegetati<strong>on</strong> pixels for Baotou<br />
Date Prod. accuracy, <str<strong>on</strong>g>coal</str<strong>on</strong>g> Prod. accuracy, dense vegetati<strong>on</strong><br />
29.08.2002 92.22% 96.64%<br />
- 163 -
For the Baotou area the extracti<strong>on</strong> accuracy for <str<strong>on</strong>g>coal</str<strong>on</strong>g> is 92%. A producer accuracy of 96% for the dense<br />
vegetati<strong>on</strong> extracti<strong>on</strong> <str<strong>on</strong>g>based</str<strong>on</strong>g> <strong>on</strong> SAVI thresholding analysis is reached. This is c<strong>on</strong>sidered a very good<br />
result. Ground truthing was possible <str<strong>on</strong>g>based</str<strong>on</strong>g> <strong>on</strong> pers<strong>on</strong>al informati<strong>on</strong>. Users accuracy could not be<br />
assessed. However, <strong>on</strong>ly few shadow pixels were extracted as <str<strong>on</strong>g>coal</str<strong>on</strong>g> in the mountain range north of<br />
Baotou. Since no DEM for the area was available, an illuminati<strong>on</strong> correcti<strong>on</strong> could not be performed<br />
and a shadow file did not exist. If a DEM would exist the users accuracy – <strong>on</strong>ly assessable <strong>on</strong> a visual<br />
basis – would increase.<br />
8.4. Discussi<strong>on</strong><br />
Disadvantages of a knowledge <str<strong>on</strong>g>based</str<strong>on</strong>g> approach are the necessity of a very detailed empirical study of<br />
the <strong>spectral</strong> and thermal behavior of the surfaces of interest. These analyses are scientifically<br />
interesting and definitely help to understand the physical processes involved, as well as to point out<br />
the geophysical parameters of biggest impact. However, the thresholds defined will to some degree<br />
always be influenced by the decisi<strong>on</strong> of the analyst. This applies even if their span for specific classes<br />
is <str<strong>on</strong>g>based</str<strong>on</strong>g> <strong>on</strong> statistical parameters like mean and standard deviati<strong>on</strong> in certain wavelength regi<strong>on</strong>s.<br />
Furthermore, knowledge <str<strong>on</strong>g>based</str<strong>on</strong>g> approaches, as developed here, <strong>on</strong>ly allow the hard classificati<strong>on</strong> of<br />
pixels. Either the pixel is assigned to a class or not. A fuzzy classificati<strong>on</strong> is not implemented. This<br />
again leads to the discussi<strong>on</strong> introduced in chapter 3, where object oriented fuzzy approaches are<br />
presented in 3.4 and the nature of materials occurring as mixtures is presented in 3.8. The knowledge<br />
<str<strong>on</strong>g>based</str<strong>on</strong>g> <strong>test</strong> sequence applied does not allow for the descripti<strong>on</strong> of the sub-pixel c<strong>on</strong>stituents or the<br />
fracti<strong>on</strong> proporti<strong>on</strong>s of the mixture. Time series of data – when fed into a knowledge <str<strong>on</strong>g>based</str<strong>on</strong>g> <strong>test</strong><br />
sequence – have to be preprocessed extremely accurately to grant inter date comparability of <strong>on</strong>e and<br />
the same spatial subset. This task can be very challenging – especially if spectrometer measurements<br />
of pseudo-invariant objects like deep clear water surfaces, bare bedrock or stable artificial surfaces like<br />
c<strong>on</strong>crete or asphalt etc. are not present within a scene (HOSTERT 2001).<br />
Clear advantages of the knowledge <str<strong>on</strong>g>based</str<strong>on</strong>g> method are the high extracti<strong>on</strong> accuracy, which can be<br />
reached compared with ground truth data as presented in 8.3. as well as the adaptati<strong>on</strong> of the method<br />
to local or regi<strong>on</strong>al surface characteristics. Compared to standard MLC classificati<strong>on</strong>s <strong>test</strong>ed the<br />
knowledge <str<strong>on</strong>g>based</str<strong>on</strong>g> approach delivers results of higher accuracy. This observati<strong>on</strong> is <strong>on</strong>ly <str<strong>on</strong>g>based</str<strong>on</strong>g> <strong>on</strong> <strong>on</strong>e<br />
maximum likelihood classificati<strong>on</strong> result available for the area though. Nevertheless, the knowledge<br />
<str<strong>on</strong>g>based</str<strong>on</strong>g> sequence avoids error sources occurring in supervised maximum likelihood approaches where<br />
already the improper selecti<strong>on</strong> of a training area may have a negative impact <strong>on</strong> a result. The<br />
differentiati<strong>on</strong> in <strong>on</strong>ly two classes (<str<strong>on</strong>g>coal</str<strong>on</strong>g>, no <str<strong>on</strong>g>coal</str<strong>on</strong>g> or similar) furthermore avoids c<strong>on</strong>fusi<strong>on</strong> with a larger<br />
number of other classes. Once thresholds are defined decisi<strong>on</strong> trees or <strong>test</strong> <strong>sequences</strong> are easy to<br />
implement in comm<strong>on</strong> programming languages (e.g. IDL) <str<strong>on</strong>g>based</str<strong>on</strong>g> <strong>on</strong> queries, intersecti<strong>on</strong>s and<br />
masking. Computing time is even for 10 band datasets (see figure 8-11) of over 50 Mio. pixels very<br />
fast. Furthermore, the output results are easy to interpret, since no gray scale outputs exist. Binary<br />
images are generated, either indicating <str<strong>on</strong>g>areas</str<strong>on</strong>g> which passed or did not pass a certain <strong>test</strong> within the <strong>test</strong><br />
sequence.<br />
In additi<strong>on</strong>, the implementati<strong>on</strong> of a knowledge <str<strong>on</strong>g>based</str<strong>on</strong>g> approach is very valuable for projects, where a<br />
certain area will be m<strong>on</strong>itored over the course of many years. Once the thresholds are known and<br />
prove to be stable the algorithm can be applied to the scenes <strong>on</strong> a yearly basis. A certain surface can be<br />
- 164 -
extracted without any further modificati<strong>on</strong>s necessary. The advantage is then that the results are<br />
reproducible by every image analyst starting the sequence. Provided that the thresholds are not<br />
modified, results will always be stable. They are also comparable <strong>on</strong> a temporal scale as presented in<br />
chapter 8.2., since all surfaces extracted in different years were extracted with exactly the same<br />
thresholds. Therefore, pixels of similar <strong>spectral</strong> and thermal behavior are extracted and compared.<br />
Further advantages of <strong>test</strong> sequence approaches are a very fast computing time, a realizati<strong>on</strong> opti<strong>on</strong> in<br />
most image processing envir<strong>on</strong>ments and the easily apprehendable algorithm background.<br />
C<strong>on</strong>cerning the set up of the <strong>test</strong> sequence many alternative scenarios for the design could be thought<br />
of. For the cases presented here, slightly better results could be reached, when individual thresholds<br />
for each scene were <strong>test</strong>ed. However, it was tried to develop a scheme applicable for a larger area and<br />
over several time steps. Therefore, the relevance of very good individual scene extracti<strong>on</strong> accuracy<br />
was given a lower priority than the goal, to retrieve good results for a larger group of data sets. This is<br />
a comm<strong>on</strong> trade off between interactive very precise analysis and mass data throughput.<br />
Coal extracti<strong>on</strong> results and <str<strong>on</strong>g>coal</str<strong>on</strong>g> <str<strong>on</strong>g>fire</str<strong>on</strong>g> area demarcati<strong>on</strong> for the scenes of Wuda and Ruqigou is for all<br />
scenes very good – except fort the two winter scenes in Ruqigou. It is a clear c<strong>on</strong>sequence and<br />
unavoidable that snow cover will disturb the comparis<strong>on</strong> of time series data. The weak extracti<strong>on</strong><br />
results in the Ruqigou winter scene in relati<strong>on</strong> to the other scenes is not a weakness of the algorithm<br />
itself. This is indicated by good extracti<strong>on</strong> accuracies, since the ground truth polyg<strong>on</strong>s mapped<br />
happened to be in <str<strong>on</strong>g>areas</str<strong>on</strong>g> not snow covered. Also the scene of September 2002 yielded good results,<br />
though this scene was c<strong>on</strong>sidered to be an outlier after signature analysis. It is assumed that the high<br />
SDs of the surfaces for this scene resulted from improper selecti<strong>on</strong> of pure <str<strong>on</strong>g>areas</str<strong>on</strong>g> for signature analysis.<br />
Therefore, the elevated SDs were <strong>on</strong>ly seemingly elevated and did not influence the extracti<strong>on</strong> result<br />
in a negative way. Since the result for the September 2002 scene was very good, signature analysis for<br />
this scene was not repeated. The fact that <str<strong>on</strong>g>coal</str<strong>on</strong>g> extracti<strong>on</strong> accuracies for Ruqigou (except the<br />
menti<strong>on</strong>ed winter scenes) are slightly higher than for Wuda results from the slight underestimati<strong>on</strong> of<br />
<str<strong>on</strong>g>coal</str<strong>on</strong>g> for the Wuda regi<strong>on</strong>. Extracti<strong>on</strong> accuracies for Wuda range between 90.34% and 96.32% and for<br />
Ruqigou producer’s accuracies range between 93.45% and 95.98%. This result of <str<strong>on</strong>g>coal</str<strong>on</strong>g> extracti<strong>on</strong> is<br />
c<strong>on</strong>sidered very good.<br />
Coal extracti<strong>on</strong> accuracies for the transfer regi<strong>on</strong>s are also very good. The same applies for the SAVI<br />
thresholded <str<strong>on</strong>g>areas</str<strong>on</strong>g> of dense vegetati<strong>on</strong> mapped in densely vegetated <str<strong>on</strong>g>areas</str<strong>on</strong>g>. One excepti<strong>on</strong> is the <str<strong>on</strong>g>coal</str<strong>on</strong>g><br />
extracti<strong>on</strong> for the Indian transfer regi<strong>on</strong>, which “<strong>on</strong>ly” reaches 87% (this can actually still be<br />
c<strong>on</strong>sidered a good result). This stems from two influences. Firstly, the geometry of the <str<strong>on</strong>g>coal</str<strong>on</strong>g> polyg<strong>on</strong>s<br />
used for ground truthing available was not created by the author and a sufficient registrati<strong>on</strong> between<br />
the polyg<strong>on</strong>s and the satellite data had to be trusted. Furthermore, the <str<strong>on</strong>g>coal</str<strong>on</strong>g> surfaces in India have a<br />
much higher SD than the <str<strong>on</strong>g>coal</str<strong>on</strong>g> surfaces in the semiarid regi<strong>on</strong>s. Here, exposed <str<strong>on</strong>g>coal</str<strong>on</strong>g> experiences the<br />
influence of a humid subtropical atmosphere, m<strong>on</strong>so<strong>on</strong>al rains and resulting extensive chemical<br />
weathering and vegetati<strong>on</strong> growth. The c<strong>on</strong><strong>sequences</strong> of this phenomen<strong>on</strong> can be noted in figure 8-25,<br />
where <str<strong>on</strong>g>coal</str<strong>on</strong>g> surfaces occur substantially lighter in color than for the other regi<strong>on</strong>s. Boundaries to<br />
surrounding rock, soil and vegetati<strong>on</strong> appear smeared and fuzzy. It was tried to adapt the algorithm to<br />
yield better results for India (different processing scenarios with adaptati<strong>on</strong>s of the temperature <strong>test</strong><br />
and <strong>test</strong>s regarding the reflectance behavior of <str<strong>on</strong>g>coal</str<strong>on</strong>g>) without lowering extracti<strong>on</strong> results for the semiarid<br />
to arid regi<strong>on</strong>s. This could not be achieved.<br />
- 165 -
Additi<strong>on</strong>ally the vegetati<strong>on</strong> exclusi<strong>on</strong> approach applied for this densely vegetated regi<strong>on</strong> diminishes<br />
almost the whole delineated area created after <str<strong>on</strong>g>coal</str<strong>on</strong>g> extracti<strong>on</strong>. For tropical or densely vegetated<br />
envir<strong>on</strong>ments vegetati<strong>on</strong> exclusi<strong>on</strong> is of higher relevance, than for sparsely vegetated arid and semiarid<br />
regi<strong>on</strong>s. Though no field work in the study area was undertaken pers<strong>on</strong>ally, communicati<strong>on</strong>s with<br />
A. PRAKASH (2004-08) revealed that the <str<strong>on</strong>g>coal</str<strong>on</strong>g>field is primarily covered and surrounded by shrubby<br />
vegetati<strong>on</strong>. Most of the few trees in the Jharia <str<strong>on</strong>g>coal</str<strong>on</strong>g>field are not natural forests but are replanted by the<br />
mining authorities. Thus it is very unlikely to find subsurface <str<strong>on</strong>g>coal</str<strong>on</strong>g> <str<strong>on</strong>g>fire</str<strong>on</strong>g>s under dense vegetati<strong>on</strong> in this<br />
area.<br />
The <str<strong>on</strong>g>areas</str<strong>on</strong>g> from the ETM+ scenes of Australia and Baotou are – like the main study <str<strong>on</strong>g>areas</str<strong>on</strong>g> - set in a<br />
semiarid to arid envir<strong>on</strong>ment. Therefore, geologic surfaces can be identified very clearly. Physical<br />
weathering outweighs chemical weathering and the morphosis of surfaces due to the influence of<br />
water (weathering, plant growth, moss, coatings etc.) is less accentuated than in India. Thus, the<br />
<strong>spectral</strong> properties of <str<strong>on</strong>g>coal</str<strong>on</strong>g> in Australia and Baotou are better comparable to the <strong>on</strong>es investigated in the<br />
main study <str<strong>on</strong>g>areas</str<strong>on</strong>g>.<br />
The good temporal and spatial transferability of the algorithm could be proven <strong>on</strong> a number of scenes.<br />
Not <strong>on</strong>ly did the <strong>test</strong> sequence yield good results for very different seas<strong>on</strong>s and years within the study<br />
<str<strong>on</strong>g>areas</str<strong>on</strong>g>. The extracti<strong>on</strong> for three regi<strong>on</strong>s not related to the study <str<strong>on</strong>g>areas</str<strong>on</strong>g> yielded good results as well. This<br />
applied even though the three transfer scenes where radiometrically not adjusted to the study area data<br />
sets. The transfer to regi<strong>on</strong>s outside of China and in different climatic regimes gives reas<strong>on</strong> to the<br />
assumpti<strong>on</strong> that the <strong>test</strong> sequence will be able to extract <str<strong>on</strong>g>coal</str<strong>on</strong>g> and <str<strong>on</strong>g>coal</str<strong>on</strong>g> <str<strong>on</strong>g>fire</str<strong>on</strong>g> <str<strong>on</strong>g>risk</str<strong>on</strong>g> <str<strong>on</strong>g>areas</str<strong>on</strong>g> for large regi<strong>on</strong>s.<br />
C<strong>on</strong>cerning <str<strong>on</strong>g>coal</str<strong>on</strong>g> <str<strong>on</strong>g>fire</str<strong>on</strong>g> area demarcati<strong>on</strong> and support of the thermal algorithm the knowledge <str<strong>on</strong>g>based</str<strong>on</strong>g><br />
algorithm can clearly reduce the area, which has to be taken into account when investigating thermal<br />
anomalies. For the broader Wuda regi<strong>on</strong>, the area to be investigated could be reduced to an average of<br />
down to 10.6 % of the input data size over all eight time steps. For Ruqigou an areal reducti<strong>on</strong> down to<br />
12.1 % <strong>on</strong> average over all eight time steps could be achieved. Including the full Landsat scene 129 /<br />
33 <strong>on</strong>ly 1.5 % of the scene is remaining as a probable <str<strong>on</strong>g>coal</str<strong>on</strong>g> <str<strong>on</strong>g>fire</str<strong>on</strong>g> <str<strong>on</strong>g>risk</str<strong>on</strong>g> area.<br />
In the transfer regi<strong>on</strong>s, for the broader area of Leigh Creek the remaining <str<strong>on</strong>g>coal</str<strong>on</strong>g> <str<strong>on</strong>g>fire</str<strong>on</strong>g> <str<strong>on</strong>g>risk</str<strong>on</strong>g> area sums to<br />
1.4% of the original data input. For the Indian- and the Baotou regi<strong>on</strong> 1.48 % and 0.59 % of the<br />
original input data size remain respectively.<br />
Hence, the developed knowledge <str<strong>on</strong>g>based</str<strong>on</strong>g> <strong>test</strong> sequence for <str<strong>on</strong>g>coal</str<strong>on</strong>g> <str<strong>on</strong>g>fire</str<strong>on</strong>g> area demarcati<strong>on</strong> can minimize the<br />
area for thermal investigati<strong>on</strong> substantially and eliminate all false alarm thermal anomalies located<br />
outside the demarcated <str<strong>on</strong>g>coal</str<strong>on</strong>g> <str<strong>on</strong>g>fire</str<strong>on</strong>g> (<str<strong>on</strong>g>risk</str<strong>on</strong>g>) <str<strong>on</strong>g>areas</str<strong>on</strong>g>.<br />
Furthermore, the <strong>test</strong> sequence was transferred to run <strong>on</strong> Aster satellite data as well. Only few <strong>test</strong>s<br />
had to be slightly modified to automatically extract the three surfaces of interest (see 8.1.4.). Two<br />
Aster scenes presented in chapter 4 were processed and the <strong>test</strong> sequence was applied to both scenes.<br />
Although Aster has more <strong>spectral</strong> bands than ETM+ it could not be found that the sensor has<br />
advantages for the extracti<strong>on</strong> of <str<strong>on</strong>g>coal</str<strong>on</strong>g> or dense vegetati<strong>on</strong>. Extracti<strong>on</strong> accuracies varied between<br />
91.59% and 93.21% and 93.01% to 96.88% for both classes respectively. However, pyrometamorphic<br />
rocks could be extracted with 100% producers accuracy (as for ETM+) but less additi<strong>on</strong>al pixels<br />
resulted from the <strong>test</strong> sequence. The users accuracy is thus higher than for ETM+data.<br />
- 166 -
9. Quantitative Surface Extracti<strong>on</strong> applying Partial Unmixing<br />
9.1. Method<br />
9.1.1. C<strong>on</strong>cept and Mathematical Background<br />
To implement an algorithm realizing feature extracti<strong>on</strong> in a n<strong>on</strong>-knowledge <str<strong>on</strong>g>based</str<strong>on</strong>g> approach a sec<strong>on</strong>d<br />
method to automatically derive <str<strong>on</strong>g>coal</str<strong>on</strong>g>-, vegetati<strong>on</strong>- and pyrometamorph surfaces from image data is<br />
applied. This approach employs the spectra collected during the field campaigns and from laboratory<br />
measurements. Is is <str<strong>on</strong>g>based</str<strong>on</strong>g> <strong>on</strong> the fundamentals of Spectral Mixture Analysis (SMA) presented in<br />
chapter 3.8. Unmixing applicati<strong>on</strong>s and neighboring applicati<strong>on</strong>s offer the great advantage of<br />
quantitatively mapping a material within a pixel. They account for the fact that most materials in the<br />
real world are mixed and that <strong>on</strong>ly few regi<strong>on</strong>s exist, where 100% <strong>spectral</strong>ly pure pixels can be found.<br />
The method applied here is a so called partial unmixing approach (partial mixture analysis, PMA),<br />
since the unmixing equati<strong>on</strong> will <strong>on</strong>ly be solved partially. This is an especially useful approach when<br />
the research focus is not to solve a complex mixture model but to assess, if a target signature is present<br />
in a scene or how much of the target material is present in a pixel. Therefore, the scene can be<br />
described by the target endmember and a composite endmember of all other scene materials. This<br />
basically reduces the problem to a two comp<strong>on</strong>ent mixing algorithm (BOARDMAN et al. 1993, KRUSE<br />
et al. 2000). Unlike in SMA <strong>on</strong>ly the abundances of <strong>on</strong>e known endmember against an unknown<br />
background are calculated. This is <str<strong>on</strong>g>based</str<strong>on</strong>g> <strong>on</strong> the principle that the signal of the desired spectrum (being<br />
available as a library spectrum) is maximized, while the variance of the background image spectra is<br />
suppressed. This technique known from radio signal processing is also referred to as matched filtering.<br />
Several methods exist to enhance a requested target signature against a suppressed background or to<br />
estimate the fracti<strong>on</strong>al c<strong>on</strong>tributi<strong>on</strong> of a given pixel to the reflectance spectrum of this pixel.<br />
Correlati<strong>on</strong> analysis can be employed to enhance a requested target signature. Furthermore, DRAKE et<br />
al. (1999) employ a distance functi<strong>on</strong>, which substracts the to 1 normalized sum of the distances of the<br />
endmember signal from the pixel signal over all bands. Also orthog<strong>on</strong>al subspace projecti<strong>on</strong> or<br />
c<strong>on</strong>strained energy minimizati<strong>on</strong> have been applied for this purpose.<br />
In a geometric sense partial unmixing finds a projecti<strong>on</strong> of the n-dimensi<strong>on</strong>al <strong>spectral</strong> space which<br />
stretches the full range of the requested target spectrum but hides the variability of the background.<br />
Since the spectra, which span the background, are unknown in most cases, the algorithm uses<br />
statistical methods to derive the composite background spectrum from the image data itself. Thus for<br />
A · X = R and X = A -1 · R (9.1)<br />
Known from chapter 3, where:<br />
A: m × n-matrix of <strong>spectral</strong> endmembers (<strong>spectral</strong> library) in n <strong>spectral</strong> bands<br />
X: vector of unknown abundances of the endmembers<br />
R: measured reflecti<strong>on</strong> of the image pixel<br />
m × n-matrix A is composed of the requested material spectrum (<str<strong>on</strong>g>coal</str<strong>on</strong>g>) and the background spectrum<br />
of the image.<br />
- 167 -
The algorithm compares the prototype spectra supplied for the matrix calculati<strong>on</strong>s with the unknown<br />
pixel spectrum and maximizes the desired material within the unknown spectrum. The result of partial<br />
unmixing applying a single prototype spectrum is a gray scale image representing the relative degree<br />
of match of the image spectrum to the reference spectrum, where 1.0 is a perfect match (=100%).<br />
Linear mixing required the fracti<strong>on</strong> images thus can also be regarded as images, representing the<br />
c<strong>on</strong>tributi<strong>on</strong> of the input material to the overall <strong>spectral</strong> signal of the pixel in percent.<br />
Figure 9-1 shows the result of partial unmixing to the supplied material (represented by a given pattern<br />
spectrum) <str<strong>on</strong>g>coal</str<strong>on</strong>g>. Very bright <str<strong>on</strong>g>areas</str<strong>on</strong>g> indicate high matches, while dark pixels c<strong>on</strong>tain hardly any or no<br />
<str<strong>on</strong>g>coal</str<strong>on</strong>g>. Every pixel above a certain threshold can now be defined as a pure <str<strong>on</strong>g>coal</str<strong>on</strong>g> pixel, which is used as a<br />
kernel for areal delineati<strong>on</strong>. It can be seen that all <str<strong>on</strong>g>areas</str<strong>on</strong>g> within the subset for the broader Wuda area,<br />
which c<strong>on</strong>tain <str<strong>on</strong>g>coal</str<strong>on</strong>g> are represented by very bright DNs. Areas like the desert in the Northwest or the<br />
northern foot hills of the Helan Shan, where no <str<strong>on</strong>g>coal</str<strong>on</strong>g> occurs, are represented by very dark pixel values.<br />
However, also some <str<strong>on</strong>g>areas</str<strong>on</strong>g> with intermediate grey level pixel values indicate the c<strong>on</strong>tributi<strong>on</strong> of <str<strong>on</strong>g>coal</str<strong>on</strong>g> to<br />
the pixel signal, even though no <str<strong>on</strong>g>coal</str<strong>on</strong>g> is present in this area. This phenomen<strong>on</strong> occurs due to the<br />
maximizati<strong>on</strong> of the desired surface spectrum within the unknown pixel spectrum leading to an<br />
overestimati<strong>on</strong> of the target surface within all pixels. This phenomen<strong>on</strong> and methods to account for<br />
this overestimati<strong>on</strong> are discussed in 9.3.. Furthermore, next to <str<strong>on</strong>g>coal</str<strong>on</strong>g> surfaces also shadowed regi<strong>on</strong>s<br />
show high fracti<strong>on</strong> values, though no <str<strong>on</strong>g>coal</str<strong>on</strong>g> is present within the pixels. This <strong>spectral</strong> mimicking of<br />
shadow and <str<strong>on</strong>g>coal</str<strong>on</strong>g> in n<strong>on</strong>-transformed data can <strong>on</strong>ly be solved by a masking of shadowed <str<strong>on</strong>g>areas</str<strong>on</strong>g>, applied<br />
to the partial unmixing result.<br />
N<br />
100%<br />
0%<br />
The partial unmixing sequence<br />
presented here is independently run<br />
<strong>on</strong> all images to extract <str<strong>on</strong>g>areas</str<strong>on</strong>g> of<br />
high <str<strong>on</strong>g>coal</str<strong>on</strong>g> fracti<strong>on</strong>s within a pixel. It<br />
is also applied for the endmember<br />
of vegetati<strong>on</strong>, to later exclude <str<strong>on</strong>g>areas</str<strong>on</strong>g><br />
of a high vegetati<strong>on</strong> density. For the<br />
spectrum of burned rock the partial<br />
unmixing is applied to the 2002-09<br />
and 2003-05 scenes of Ruqigou<br />
exclusively.<br />
Figure 9-1: Results of partial unmixing to <str<strong>on</strong>g>coal</str<strong>on</strong>g> for the broader Wuda area, image from 1999. Bright pixel values<br />
indicate a high sub-pixel <str<strong>on</strong>g>coal</str<strong>on</strong>g> fracti<strong>on</strong>, dark <str<strong>on</strong>g>areas</str<strong>on</strong>g> have lower sub-pixel fracti<strong>on</strong>s. Center coordinate: 650705E,<br />
4373287N, UTM, Z48 N, 43km×36km<br />
PMA is often applied to MNF transformed and inverted data. MNF transformati<strong>on</strong> has been<br />
introduced in chapter 3.1. MNF transformati<strong>on</strong> not <strong>on</strong>ly orders the data according to the noise c<strong>on</strong>tent<br />
of the transformed comp<strong>on</strong>ents, but also allows for the better differentiati<strong>on</strong> of classes. As for PCA,<br />
MNF leads to a better representati<strong>on</strong> of the data space. For the Landsat scenes presented here, MNF<br />
transformed images allow for a better differentiati<strong>on</strong> of e.g. <str<strong>on</strong>g>coal</str<strong>on</strong>g> and shadow. The problem is that a<br />
PMA analysis <strong>on</strong> MNF transformed data has to be performed with MNF transformed spectra also. The<br />
transformati<strong>on</strong> parameters applied to the individual scene have to be applied to the spectra to grant the<br />
comparability of synthetic pixel spectra with the defined reference spectra. This means that an<br />
- 168 -
individual set of MNF transformed prototype spectra would have to be generated for each individual<br />
scene. Original input prototype spectra could not be transferred from scene to scene as it is the case for<br />
n<strong>on</strong>-transformed data. This clearly limits the suitability of MNF transformed data for automati<strong>on</strong>.<br />
9.1.2. Design of Prototype Spectra and Spectral Interpolati<strong>on</strong><br />
A representative <strong>spectral</strong> library, generated from the field- and the laboratory spectra presented in<br />
chapter 4 was generated as an input library for the partial unmixing process. So called “prototype<br />
spectra” were artificially generated (see figure 9-2). They are representative for <str<strong>on</strong>g>coal</str<strong>on</strong>g>, vegetati<strong>on</strong> and<br />
burned rock. Therefore, all mean <str<strong>on</strong>g>coal</str<strong>on</strong>g>-, vegetati<strong>on</strong>- and pyrometamorph spectra of the different<br />
samples were used to calculate an overall mean. These spectra were visually compared to typical<br />
image spectra of homogeneous regi<strong>on</strong>s in the input data sets. The plausibility of these spectra was<br />
furthermore quantitatively <strong>test</strong>ed <str<strong>on</strong>g>based</str<strong>on</strong>g> <strong>on</strong> SAM analysis presented in 3.9 and 9.1.3..<br />
The prototype spectra were interpolated to the bandwidths of Landsat-5 TM, Landsat-7 ETM+, and<br />
Aster. Depending <strong>on</strong> the input image type the equivalent spectra are used for partial unmixing.<br />
Advantage of this interpolati<strong>on</strong> is an improvement of the signal to noise ratio due to the averaging of<br />
the higher resoluti<strong>on</strong> spectrum to broader bandwidths. Spectral simulati<strong>on</strong> is possible, when the source<br />
sensor has a spatial and <strong>spectral</strong> resoluti<strong>on</strong> finer than the target simulated sensor (as applicable in the<br />
case of the GER). Simulati<strong>on</strong> of a spectrum includes estimating the Gaussian <strong>spectral</strong> resp<strong>on</strong>se<br />
functi<strong>on</strong> (SRF) of each channel using the band center and width (full-width-half-maximum, FWHM)<br />
with:<br />
1 −0.5(<br />
λ −μ<br />
)² / σ ²<br />
R i<br />
( λ)<br />
= e<br />
(9.2)<br />
σ 2π<br />
where µ is the band center, σ is the standard deviati<strong>on</strong> (equivalent to the FWHM) of the channel and λ<br />
is the wavelength relative to µ and R i (λ) the <strong>spectral</strong> resp<strong>on</strong>se. The integral over the SRF is 1.<br />
The channels of the higher resoluti<strong>on</strong> imaging spectrometer GER, which are within the wavelength<br />
range of the selected ETM+ or Aster channels are integrated by dividing them into the derived SRF. It<br />
is assumed that the initial SRF of the input data channels are a single bright source (c<strong>on</strong>tinuous input<br />
spectrum) using:<br />
λ<br />
2<br />
∫<br />
ρ(<br />
λ)<br />
Ri<br />
( λ)<br />
dλ<br />
λ1<br />
ρres<br />
( λi<br />
) =<br />
λ2<br />
R ( λ)<br />
dλ<br />
∫<br />
λ<br />
1<br />
i<br />
(9.3)<br />
where ρ res (λ i ) is the resampled spectrum using the c<strong>on</strong>tinuous spectrum ρ(λ) and the SRF R i (λ) (VAN<br />
DER MEER & DE JONG 2001). The c<strong>on</strong>voluti<strong>on</strong> is achieved integrating between the lower (λ 1 ) and<br />
upper (λ 2 ) wavelength limit of the designated image channel. Since the <strong>spectral</strong> resoluti<strong>on</strong> of the image<br />
data to be simulated is lower than that of the image data, band matching has to be applied. Here the<br />
bands, which positi<strong>on</strong> in terms of wavelength of the band center is closest to the channel to be<br />
simulated, are used for the simulati<strong>on</strong> (VAN DER MEER & DE JONG 2001, ABRAMS & HOOK, 1995).<br />
Opposite to the <str<strong>on</strong>g>coal</str<strong>on</strong>g> spectrum, for the vegetati<strong>on</strong> spectrum it was not of utmost importance to be of<br />
high representativity for a certain type of plant or plant architecture. The goal of vegetati<strong>on</strong> extracti<strong>on</strong><br />
- 169 -
LS-7 ETM+<br />
LS-5 TM<br />
ASTER<br />
Coal, GER<br />
Figure 9-2: left: prototype spectrum of <str<strong>on</strong>g>coal</str<strong>on</strong>g> derived by creating a mean of all averaged input spectra<br />
measurements. The black spectra represent the mean spectra of 8 <str<strong>on</strong>g>coal</str<strong>on</strong>g> samples. Each was measured 20 times.<br />
Right: overall mean spectrum of <str<strong>on</strong>g>coal</str<strong>on</strong>g> interpolated to the SRF of Aster (blue), Landsat-5 TM (turquoise) and<br />
Landsat-7 ETM+ (violet); the resampled spectra are stacked with offset for better visualizati<strong>on</strong>.<br />
is simply to exclude <str<strong>on</strong>g>areas</str<strong>on</strong>g> of high vegetati<strong>on</strong> density and the vegetati<strong>on</strong> spectrum shall support the<br />
detecti<strong>on</strong> of highly vegetated <str<strong>on</strong>g>areas</str<strong>on</strong>g> (dense agricultural <str<strong>on</strong>g>areas</str<strong>on</strong>g> or <str<strong>on</strong>g>areas</str<strong>on</strong>g> of very dense desert vegetati<strong>on</strong>).<br />
Therefore, it is assumed that a pure spectrum of the desert shrub Artemisia (exclusively leafs, 8 layers,<br />
no soil reflecti<strong>on</strong>) will also support the extracti<strong>on</strong> of all other vegetati<strong>on</strong> types. Already KEMPER<br />
(2003) states that most land cover studies have to c<strong>on</strong>sider the <strong>spectral</strong> reflectance of vegetati<strong>on</strong>, even<br />
if this is not the focus of the study, since vegetati<strong>on</strong> is omnipresent <strong>on</strong> the land surface. A rough<br />
prototype spectrum is sufficient for the approach pursued here. Even though the overall reflectance<br />
level of vegetati<strong>on</strong> may vary the shape of reflectance curves for green leaves is similar for most<br />
species.<br />
The spectra of pyrometamorphic rocks vary str<strong>on</strong>gly as presented in the signature analysis chapter 7.<br />
Therefore, next to an overall mean prototype spectra the average sample spectra of the different types<br />
of pyrometamorphic rock were also available as an input to the partial unmixing.<br />
9.1.3. Analysis of Extreme Pixels<br />
In this subchapter an endmember modeling is presented, supporting the selecti<strong>on</strong> of the endmember<br />
“<str<strong>on</strong>g>coal</str<strong>on</strong>g>” not <strong>on</strong>ly as an input to partial unmixing, but also as a candidate for a high quality <strong>spectral</strong><br />
mixture model. Two major types of endmembers (EM) exist. Firstly, EM can be “derived” EM,<br />
extracted from the images itself (the purest pixels). This has the advantage that all EMs reflect under<br />
similar atmospheric c<strong>on</strong>diti<strong>on</strong>s. However, such EM are hardly transferable. Sec<strong>on</strong>dly, “known” EM<br />
stem from <strong>spectral</strong> libraries or own ground- and laboratory <strong>spectral</strong> measurements. EM fed into SMA<br />
need to fulfill the c<strong>on</strong>diti<strong>on</strong>s of physical and statistical purity. This is <strong>on</strong>ly given for materials, which<br />
characterize the limiting vectors of feature space and ideally explain all other <strong>spectral</strong> signatures<br />
enclosed by such a polyhedr<strong>on</strong> (HOSTERT 2001). The objective pre-selecti<strong>on</strong> of EM into a mixing<br />
model – afterwards c<strong>on</strong>trolled by the analyst – is an approach, which tries to minimize possible errors<br />
during the set up of the model. Also for partial unmixing it is of advantage when materials or surfaces<br />
requested to extract are located at extreme positi<strong>on</strong>s in the n-D feature space. Even if the actual EM<br />
requested and available as a spectrum (reference EM) is already known, it can be <strong>test</strong>ed, if the material<br />
(e.g. <str<strong>on</strong>g>coal</str<strong>on</strong>g>) bel<strong>on</strong>gs to a cluster in an extreme positi<strong>on</strong> defining <strong>on</strong>e axis of the thematic mixture space.<br />
- 170 -
The data was therefore analyzed for the best <strong>spectral</strong> EM inherent in the image data. Therefore,<br />
principal comp<strong>on</strong>ent analysis (BATESON & CURTISS 1996), neural networks (GARCIÁ-HARO et al.<br />
1999) or the pixel purity index (PPI) are often used methods (KRUSE et al. 2000, HOSTERT 2001). The<br />
PPI is a means of finding the most <strong>spectral</strong>ly pure or extreme pixels in multi- or hyper<strong>spectral</strong> imagery<br />
and can be applied <strong>on</strong> original calibrated data or <strong>on</strong> MNF transformed data. It is computed by<br />
repeatedly projecting n-dimensi<strong>on</strong>al scatter plots (the data cluster) <strong>on</strong>to a random unit vector. The<br />
extreme pixels of each projecti<strong>on</strong> are recorded and the total number of times each pixel is marked as<br />
extreme is noted. After a larger number of iterati<strong>on</strong>s (comm<strong>on</strong>ly several thousands) a PPI image is<br />
created. In this image the DN of each pixel corresp<strong>on</strong>ds to the number of times the pixel was recorded<br />
as extreme (VAN DER MEER 1999a, KRUSE et al. 2000). Figure 9-3 shows the result of a PPI<br />
calculati<strong>on</strong> for the scene 129/33 from 17.10.2000 performed with 10,000 iterati<strong>on</strong>s. This grants a high<br />
representativity of the extracted pixels.<br />
1<br />
1<br />
4<br />
Figure 9-3: Results of<br />
a PPI calculati<strong>on</strong> (10k<br />
iterati<strong>on</strong>s) superimposed<br />
<strong>on</strong> band <strong>on</strong>e (blue)<br />
of ETM+ 129/33 from<br />
17.10.2000. Center coordinate<br />
of left subset:<br />
650705E, 4373287N,<br />
UTM, Z48 N,<br />
43km×36km<br />
2<br />
5<br />
4<br />
2<br />
5<br />
3<br />
6<br />
3 6<br />
N<br />
According to this result (purest pixels) the ideal endmembers for a complete unmixing would be pure<br />
<str<strong>on</strong>g>coal</str<strong>on</strong>g>, pure uncovered desert sand, dense agricultural vegetati<strong>on</strong>, Yellow River water and shadow. The<br />
PPI also leads to the extracti<strong>on</strong> of EMs, which are <strong>spectral</strong>ly extreme, but are not relevant for the<br />
compositi<strong>on</strong> of the scene or the phenomena under investigati<strong>on</strong>. One example is the storage pile of the<br />
calcite factories east of the Yellow River (white box in subset 5) – a very bright and extreme surface,<br />
which <strong>on</strong>ly occurs close to very few factories. These surfaces would not be included in a mixture<br />
model. Furthermore, the water of the Yellow River is not assumed to really be an extreme EM, since it<br />
c<strong>on</strong>sists of a mixture of several pure comp<strong>on</strong>ents (water, sediment, algae etc.). The results of PPI<br />
therefore need to be interpreted by an analyst applying n-D visualizati<strong>on</strong> (HOSTERT 2001). However,<br />
here the PPI was calculated to compare image derived pure spectra with the input reference spectra<br />
(<str<strong>on</strong>g>coal</str<strong>on</strong>g> and vegetati<strong>on</strong>) for partial unmixing. The similarity of image spectra resulting from PPI analysis<br />
and reference spectra of the same locati<strong>on</strong>s was calculated via a <strong>spectral</strong> angle mapping approach as<br />
presented in chapter 3.9. Interpolated laboratory spectra of <str<strong>on</strong>g>coal</str<strong>on</strong>g> and desert sand yielded <strong>spectral</strong> angles<br />
close to zero when compared with the pixel spectra of the marked extreme pixels. Resampled field<br />
vegetati<strong>on</strong> spectra differed slightly str<strong>on</strong>ger, when compared with dense agricultural vegetati<strong>on</strong> pixels.<br />
This can be neglected in the present case. Also for Ruqigou a 10,000 iterati<strong>on</strong> PPI image was<br />
calculated, indicating the surfaces <str<strong>on</strong>g>coal</str<strong>on</strong>g> / shadow, dense vegetati<strong>on</strong>, calcite piles resulting from<br />
limest<strong>on</strong>e burning (not really an EM), some water covered irrigated surfaces and alluvial fans, which<br />
show a crusting, as EMs.<br />
- 171 -
9.2. Results of the Partial Unmixing Analyses<br />
9.2.1. Results for the Main Study Areas<br />
9.2.1.1. Wuda<br />
Figure 9-4 shows the partial unmixing results for the broader Wuda area for all 8 Landsat scenes. The<br />
extracti<strong>on</strong> results for 1987 and 2003 vary in that respect that here the Yellow River also yields very<br />
high fracti<strong>on</strong> percentages. Next to <str<strong>on</strong>g>coal</str<strong>on</strong>g>, in all scenes shadowed <str<strong>on</strong>g>areas</str<strong>on</strong>g> are also extracted with very high<br />
percentages. With partial unmixing al<strong>on</strong>e, applied to untransformed data, it is impossible to separate<br />
these two. Here a post-processing (e.g. <strong>test</strong> 6 of the knowledge <str<strong>on</strong>g>based</str<strong>on</strong>g> <strong>test</strong> sequence for <str<strong>on</strong>g>coal</str<strong>on</strong>g> extracti<strong>on</strong>)<br />
or a masking of shaded terrain can help to exclude these <str<strong>on</strong>g>areas</str<strong>on</strong>g>.<br />
1987-09 1999-08 2000-10<br />
2001-10 2002-09 2002-12<br />
2003-02 2003-05<br />
100%<br />
0%<br />
Figure 9-4: Partial unmixing results for the broader Wuda area for all 8 scenes. Light <str<strong>on</strong>g>areas</str<strong>on</strong>g> indicate a high<br />
spatial fracti<strong>on</strong> of the input prototype spectrum (<str<strong>on</strong>g>coal</str<strong>on</strong>g>), while dark <str<strong>on</strong>g>areas</str<strong>on</strong>g> represent pixels with a smaller fracti<strong>on</strong><br />
of this surface. Mimicking surfaces include shaded <str<strong>on</strong>g>areas</str<strong>on</strong>g> and partially water. Center coordinate: 650705E,<br />
4373287N, UTM, Z48 N, 43km×36km<br />
- 172 -
It furthermore strikes that the light area does not necessarily increase steadily over time, as <str<strong>on</strong>g>coal</str<strong>on</strong>g> does<br />
for the broader Wuda study area. This results from the high amount of shadow mapped also as well as<br />
from differences in scene calibrati<strong>on</strong>. Even though the scenes were synchr<strong>on</strong>ized as exact as possible,<br />
variati<strong>on</strong>s still occur. This has been presented in chapter 7. Unmixing approaches are much more<br />
sensitive to such variati<strong>on</strong>s than the knowledge <str<strong>on</strong>g>based</str<strong>on</strong>g> <strong>test</strong> <strong>sequences</strong>. The latter operates with broader<br />
threshold ranges than a <strong>spectral</strong> matching approach and includes arithmetic functi<strong>on</strong>s, inequalities and<br />
a combinati<strong>on</strong> of rules for the extracti<strong>on</strong>.<br />
For all scenes processed a cut off percentage of 85% yields best results in defining <str<strong>on</strong>g>areas</str<strong>on</strong>g> c<strong>on</strong>sidered as<br />
pure <str<strong>on</strong>g>coal</str<strong>on</strong>g>. This threshold was found <str<strong>on</strong>g>based</str<strong>on</strong>g> <strong>on</strong> numerous empirical <strong>test</strong>s. When thresholding the images<br />
at an 85% subpixel fracti<strong>on</strong>, not <strong>on</strong>ly <str<strong>on</strong>g>coal</str<strong>on</strong>g> is extracted but also shadow and water. Even after<br />
thresholding, scenes of different acquisiti<strong>on</strong> dates can hardly be compared. Figure 9-6 illustrates this<br />
inter scene variability as well as sun angle induced variati<strong>on</strong>s in shadow sizes. The diagram presents<br />
the percentage of the scene area, which would be c<strong>on</strong>sidered as <str<strong>on</strong>g>coal</str<strong>on</strong>g>, if the image was thresholded at a<br />
certain threshold. E.g. if the partial unmixing result of December 2002 is thresholded at the 90%<br />
fracti<strong>on</strong> (where all pixels including more than 90% of the fracti<strong>on</strong> “<str<strong>on</strong>g>coal</str<strong>on</strong>g>” would be c<strong>on</strong>sidered) these<br />
pixels would add up to 5.79 % of the scene area.<br />
If <strong>on</strong>ly the surface <str<strong>on</strong>g>coal</str<strong>on</strong>g> would influence this area, it would be expected that the curves of the different<br />
years increase in their offset. Furthermore, with progressing time the area extracted at a certain<br />
fracti<strong>on</strong> threshold should increase over time. Due to the above menti<strong>on</strong>ed reas<strong>on</strong>s this is not the case.<br />
Especially when investigating the winter scenes the shadow effect is obvious. Although the two winter<br />
scenes both have a lower overall area covered with <str<strong>on</strong>g>coal</str<strong>on</strong>g> compared to summer or fall scenes (see<br />
chapter 8), the two should have similar <str<strong>on</strong>g>areas</str<strong>on</strong>g> covered by <str<strong>on</strong>g>coal</str<strong>on</strong>g>. The knowledge <str<strong>on</strong>g>based</str<strong>on</strong>g> <strong>test</strong> sequence<br />
even indicated a slight increase from December to February. As visible in figure 9-5 the scene of<br />
February 2003 (pink) yields – especially within the lower fracti<strong>on</strong> thresholds – lower results, than the<br />
scene from December. This phenomen<strong>on</strong> occurs due to larger shadowed <str<strong>on</strong>g>areas</str<strong>on</strong>g> in December.<br />
Figure 9-5: Subpixel fracti<strong>on</strong> of the input<br />
prototype surface (<str<strong>on</strong>g>coal</str<strong>on</strong>g>) plotted against the<br />
percentage of the scene area, which would<br />
remain, if the partial unmixing result is<br />
thresholded for the pixels c<strong>on</strong>taining equal or<br />
above the percentage subpixel fracti<strong>on</strong>. All<br />
eight time steps were calculated and<br />
displayed.<br />
However, if the development between two scenes, acquired under completely similar illuminati<strong>on</strong><br />
c<strong>on</strong>diti<strong>on</strong>s is compared, the phenomen<strong>on</strong> of increasing <str<strong>on</strong>g>coal</str<strong>on</strong>g> surfaces over time can be dem<strong>on</strong>strated.<br />
Figure 9-6 presents the area in percent of the scene if the scene is thresholded at varying fracti<strong>on</strong><br />
thresholds for the scene from 20.09.1987 and 21.09.2002. If all pixels exceeding a partial unmixing<br />
result of 85 % fracti<strong>on</strong> of the input surface (<str<strong>on</strong>g>coal</str<strong>on</strong>g>) were thresholded, the “<str<strong>on</strong>g>coal</str<strong>on</strong>g>” covered area in the<br />
broader Wuda study area would occupy 1.76 % of the scene in 1987 and 4.58 % in 2002. This<br />
indicates an increase for 260 % from 1987 to 2002. This result coincides well with the result from the<br />
knowledge <str<strong>on</strong>g>based</str<strong>on</strong>g> <strong>test</strong> sequence, where from September 1987 to September 2002 an areal increase for<br />
about 300% is calculated (compare table 8-1, chapter 8).<br />
- 173 -
2002<br />
1987<br />
Figure 9-6: Subpixel fracti<strong>on</strong> of the input<br />
prototype surface (<str<strong>on</strong>g>coal</str<strong>on</strong>g>) plotted against the<br />
percentage of the scene area, which would<br />
remain, if the partial unmixing result is<br />
thresholded for the pixels c<strong>on</strong>taining equal or<br />
above the percentage subpixel fracti<strong>on</strong>.<br />
Presented for Wuda, 20.09.1987 and 21.09.<br />
2002 (River not included).<br />
Absolute numbers can not be compared, since it has already been stated that the knowledge <str<strong>on</strong>g>based</str<strong>on</strong>g> <strong>test</strong><br />
sequence tends to underestimate the <str<strong>on</strong>g>coal</str<strong>on</strong>g> area in Wuda. With the partial unmixing approach <str<strong>on</strong>g>coal</str<strong>on</strong>g> is<br />
overestimated, due to the phenomen<strong>on</strong> of “false positives”, explained in 9.3. Exclusi<strong>on</strong> of shadowed<br />
<str<strong>on</strong>g>areas</str<strong>on</strong>g> from the thresholded images is possible with a post filtering <str<strong>on</strong>g>based</str<strong>on</strong>g> <strong>on</strong> the rules developed for the<br />
knowledge <str<strong>on</strong>g>based</str<strong>on</strong>g> <strong>test</strong> sequence. Already the applicati<strong>on</strong> of the temperature <strong>test</strong> included in the <str<strong>on</strong>g>coal</str<strong>on</strong>g><br />
extracti<strong>on</strong> sequence yields good results. Additi<strong>on</strong>al majority filtering can furthermore smoothen the<br />
result, before a radius for the demarcati<strong>on</strong> of <str<strong>on</strong>g>coal</str<strong>on</strong>g> <str<strong>on</strong>g>fire</str<strong>on</strong>g> <str<strong>on</strong>g>risk</str<strong>on</strong>g> <str<strong>on</strong>g>areas</str<strong>on</strong>g> is defined.<br />
a<br />
b<br />
Figure 9-7: Subpixel fracti<strong>on</strong> of the input pattern surface (<str<strong>on</strong>g>coal</str<strong>on</strong>g>) plotted against the percentage of the scene area,<br />
which would remain, if the partial unmixing result is thresholded for the pixels c<strong>on</strong>taining equal or above the<br />
percentage subpixel fracti<strong>on</strong>. Here <strong>on</strong>ly flat regi<strong>on</strong>s were included in the calculati<strong>on</strong> to exclude shadow effects<br />
induced by differing sun angles, (a).(b) presents a zoom into (a) for better clarity.<br />
For figure 9-7 all shadowed <str<strong>on</strong>g>areas</str<strong>on</strong>g> in the Wuda study area were excluded <str<strong>on</strong>g>based</str<strong>on</strong>g> <strong>on</strong> an interactive<br />
masking of these <str<strong>on</strong>g>areas</str<strong>on</strong>g>. A clear increase from 1987 to 1999 can be noted. From 1999 to the following<br />
years the <str<strong>on</strong>g>coal</str<strong>on</strong>g> area increases further. This supports the results presented in chapter 8. However, no<br />
clear trend can be formulated for the years 2000 to 2002. The scene of 2003 even had to be excluded<br />
from the calculati<strong>on</strong>, since PMA thresholding lead – next to <str<strong>on</strong>g>coal</str<strong>on</strong>g> – to the extracti<strong>on</strong> of major parts of<br />
the Yellow River (see figure 9-4), thus tampering the time series.<br />
Figure 9-8- shows the results of the vegetati<strong>on</strong> fracti<strong>on</strong> computati<strong>on</strong> for the broader area of Wuda for<br />
the years 1987-09 and 2002-09. The densely vegetated agricultural <str<strong>on</strong>g>areas</str<strong>on</strong>g> al<strong>on</strong>g the Yellow River show<br />
very bright values, indicating a high subpixel vegetati<strong>on</strong> fracti<strong>on</strong>. In the southeastern quarter of the<br />
image some bright patches can be noted, which are smaller agricultural plantati<strong>on</strong>s adjacent to small<br />
villages and industrial <str<strong>on</strong>g>areas</str<strong>on</strong>g>. Low subpixel vegetati<strong>on</strong> density occurs in the Badain Jaran desert in the<br />
northwestern quarter of the image. Coal surfaces also show a low vegetati<strong>on</strong> density. In the remaining<br />
- 174 -
a<br />
N<br />
b<br />
N<br />
0% 100% 0% 100%<br />
Figure 9-8: Partial unmixing results for vegetati<strong>on</strong> for the broader Wuda area for 1987-09 (a) and 2002-09 (b).<br />
Light <str<strong>on</strong>g>areas</str<strong>on</strong>g> indicate a high spatial fracti<strong>on</strong> of the input prototype spectrum (pure Artemisia leaves), while dark<br />
<str<strong>on</strong>g>areas</str<strong>on</strong>g> represent pixels with a smaller fracti<strong>on</strong> of vegetati<strong>on</strong>. Center coordinate: 650705E, 4373287N, UTM, Z48<br />
N, 43km×36km.<br />
area vegetati<strong>on</strong> cover varies depending <strong>on</strong> geologic substrate, water accessibility, slope and aspect.<br />
Just like for SAVI results presented in chapter 8, the PMA result of subpixel vegetati<strong>on</strong> fracti<strong>on</strong><br />
estimati<strong>on</strong> can be thresholded to exclude densely vegetated <str<strong>on</strong>g>areas</str<strong>on</strong>g> from probable <str<strong>on</strong>g>coal</str<strong>on</strong>g> <str<strong>on</strong>g>fire</str<strong>on</strong>g> (<str<strong>on</strong>g>risk</str<strong>on</strong>g>) <str<strong>on</strong>g>areas</str<strong>on</strong>g>,<br />
which are delineated through <str<strong>on</strong>g>coal</str<strong>on</strong>g> extracti<strong>on</strong> and delineati<strong>on</strong>.<br />
The thresholding and intersecti<strong>on</strong> method is simple and has already been presented in chapter 8.<br />
Therefore intermediate results are not shown here. Detailed maps with demarcated <str<strong>on</strong>g>coal</str<strong>on</strong>g> <str<strong>on</strong>g>fire</str<strong>on</strong>g> <str<strong>on</strong>g>areas</str<strong>on</strong>g> are<br />
presented in chapter 10. The extracti<strong>on</strong> of pyrometamorphic rock was not pursued for the Wuda area.<br />
The quality assessment of the partial unmixing result can not <strong>on</strong>ly be assessed <str<strong>on</strong>g>based</str<strong>on</strong>g> <strong>on</strong> ground truth<br />
and mapped mixture grids. Also the result of a linear <strong>spectral</strong> unmixing can be used, to indirectly<br />
validate the partial unmixing result for a certain surface. Therefore, next to the partial unmixing, a<br />
linear mixing model was set up for the broader Wuda study area. SMA has been applied employing<br />
the four selected endmembers <str<strong>on</strong>g>coal</str<strong>on</strong>g>, pure desert sand, sandst<strong>on</strong>e (arcotic) and vegetati<strong>on</strong>. Linear<br />
<strong>spectral</strong> unmixing results are presented in figure 9-9. Fracti<strong>on</strong> images coincide very well with the<br />
ground knowledge available for the area. Figure 9-9a (<str<strong>on</strong>g>coal</str<strong>on</strong>g>) clearly presents the <str<strong>on</strong>g>coal</str<strong>on</strong>g> covered <str<strong>on</strong>g>areas</str<strong>on</strong>g><br />
within the syncline as well as <str<strong>on</strong>g>coal</str<strong>on</strong>g> covered roads and <str<strong>on</strong>g>coal</str<strong>on</strong>g> storage- and waste piles as brigh<strong>test</strong> pixels.<br />
In figure 9-9b (pure desert sand) the pixels in the area of the Badain Jaran desert in the Northwest are<br />
extracted with very high subpixel fracti<strong>on</strong>s. Only the lakes located within the desert appear as dark<br />
spots. It is unclear why pure desert sand is partly c<strong>on</strong>fused with vegetati<strong>on</strong>. In figure 9-9c (sandst<strong>on</strong>e)<br />
the sandst<strong>on</strong>e plateau within the Wuda syncline is clearly extracted. Furthermore sandst<strong>on</strong>e ridges in<br />
the southwestern corner (northern foot hills of the Helan Shan) can clearly be noted. As for <str<strong>on</strong>g>coal</str<strong>on</strong>g>, the<br />
visual impressi<strong>on</strong> of extracti<strong>on</strong> accuracy for this surface is very c<strong>on</strong>vincing. Figure 9-9 d shows the<br />
fracti<strong>on</strong> image for vegetati<strong>on</strong>. Agricultural fields west of the mining town Wuda are represented by<br />
very bright values. Overall, the linear unmixing result is very satisfying. Its use for quantificati<strong>on</strong> and<br />
error assessment will be presented in subchapter 9.3..<br />
- 175 -
a<br />
N<br />
b<br />
N<br />
c<br />
N<br />
d<br />
N<br />
Figure 9-9: Linear <strong>spectral</strong> unmixing result for the broader Wuda area for 2002-09. The selected endmembers<br />
are <str<strong>on</strong>g>coal</str<strong>on</strong>g> (a), quartzite desert sand (b), arcotic sandst<strong>on</strong>e (c) and Artemisia vegetati<strong>on</strong> (d). Light <str<strong>on</strong>g>areas</str<strong>on</strong>g> indicate<br />
high subpixel fracti<strong>on</strong>s, while dark <str<strong>on</strong>g>areas</str<strong>on</strong>g> represent pixels with a smaller fracti<strong>on</strong> of the endmember. Center<br />
coordinate: 640134E, 4377377N, UTM, Z48 N, 43km×36km<br />
a<br />
N<br />
b<br />
N<br />
Figure 9-10: RMSE image (a) and color coded unmixing result (b). Here the endmember <str<strong>on</strong>g>coal</str<strong>on</strong>g>, vegetati<strong>on</strong> and<br />
sandst<strong>on</strong>e are displayed in red, green and blue. The RMSE image shows high errors for the vegetated <str<strong>on</strong>g>areas</str<strong>on</strong>g>.<br />
This goes in line with the c<strong>on</strong>fusi<strong>on</strong> between desert sand and vegetati<strong>on</strong>. Center coordinate: 640134E,<br />
4377377N, UTM, Z48 N, 43km×36km<br />
- 176 -
9.2.1.2. Ruqigou<br />
Figure 9-11 presents the partial unmixing results for the broader Ruqigou area for all 8 ETM+ scenes.<br />
In all scenes the Ruqigou / Gulaben <str<strong>on</strong>g>coal</str<strong>on</strong>g>fields as well as the <str<strong>on</strong>g>coal</str<strong>on</strong>g> mining valleys of Hulusitai and<br />
Shitanjing in the Northeast were extracted. However, especially the winter scenes (2002-12 and 2003-<br />
02) yield visually insufficient results, since large shadowed <str<strong>on</strong>g>areas</str<strong>on</strong>g> were extracted. Visually good results<br />
were retrieved for the scenes of 1999, 2002-09 and 2003-05, where relief influence is minimized.<br />
1987-09 1999-08 2000-10<br />
2001-10 2002-09 2002-12<br />
2003-02 2003-05<br />
100%<br />
0%<br />
Figure 9-11: Partial unmixing results for the broader Ruqigou study area for all 8 scenes. Light <str<strong>on</strong>g>areas</str<strong>on</strong>g> indicate a<br />
high spatial fracti<strong>on</strong> of the input prototype spectrum, while dark <str<strong>on</strong>g>areas</str<strong>on</strong>g> represent pixels with a smaller fracti<strong>on</strong>s.<br />
Mimicking surfaces include shaded <str<strong>on</strong>g>areas</str<strong>on</strong>g>. Center coordinate: 606211E, 4334381N, UTM, Z48N, 33km×28km<br />
Figure 9-12 illustrates the inter scene variability as well as sun angle induced variati<strong>on</strong>s in shadow<br />
sizes. Again, multitemporal inter scene comparability for the evaluati<strong>on</strong> of temporal trends is not<br />
given. However, if the development of two scenes acquired under similar illuminati<strong>on</strong> c<strong>on</strong>diti<strong>on</strong>s is<br />
compared the increase of <str<strong>on</strong>g>coal</str<strong>on</strong>g> surfaces in the broader Ruqigou area becomes apparent.<br />
It has to be remembered that the Ruqigou area is located in extremely difficult terrain. Elevati<strong>on</strong> in the<br />
regi<strong>on</strong> processed varies between 950 and 2650m. Valleys are deeply incised. This compares to SMA<br />
applied in the central Alps. Such terrain limits analyses accuracies for most applicati<strong>on</strong>s.<br />
- 177 -
Figure 9-12: Subpixel fracti<strong>on</strong> of the input<br />
pattern surface (<str<strong>on</strong>g>coal</str<strong>on</strong>g>) plotted against the percentage<br />
of the scene area, which would<br />
remain, if the partial unmixing result is<br />
thresholded for the pixels c<strong>on</strong>taining equal or<br />
above the percentage subpixel fracti<strong>on</strong>. All<br />
eight time steps were calculated and<br />
displayed.<br />
With the 85 % threshold in 1987 1.35 % of the input area was extracted as <str<strong>on</strong>g>coal</str<strong>on</strong>g>. In 2002 the 85 %<br />
thresholded already covers 5.54 % percent of the input scene. This indicates an increase for nearly<br />
400 %, which is more than indicated by the knowledge <str<strong>on</strong>g>based</str<strong>on</strong>g> extracti<strong>on</strong>. Here an increase of 250 % is<br />
calculated (compare table 8-2, chapter 8).<br />
2002<br />
1987<br />
Figure 9-13: Subpixel fracti<strong>on</strong> of the input<br />
pattern surface (<str<strong>on</strong>g>coal</str<strong>on</strong>g>) plotted against the<br />
percentage of the scene area, which would<br />
remain, if the partial unmixing result is<br />
thresholded for the pixels c<strong>on</strong>taining equal or<br />
above the percentage subpixel fracti<strong>on</strong>.<br />
Presented for Ruqigou, 20.09.1987 and<br />
21.09.2002.<br />
It is important to note the fact that for Ruqigou a slightly smaller area was processed than with the<br />
knowledge <str<strong>on</strong>g>based</str<strong>on</strong>g> algorithm. This is a c<strong>on</strong>sequence of scene boarder effects, not influencing the <strong>test</strong><br />
sequence, but influencing the partial unmixing. Therefore, the results can <strong>on</strong>ly be compared <strong>on</strong> a<br />
relative basis. The subset input into partial unmixing for the Ruqigou area has a higher areal coverage<br />
of <str<strong>on</strong>g>coal</str<strong>on</strong>g> mining <str<strong>on</strong>g>areas</str<strong>on</strong>g> and therefore <str<strong>on</strong>g>coal</str<strong>on</strong>g> extracti<strong>on</strong> results are relatively seen higher and the increase<br />
appears str<strong>on</strong>ger. However, both results are c<strong>on</strong>sidered to lie in an adequate range to indicate the<br />
timely expansi<strong>on</strong>, ranging between 250% and less than 400% for the Ruqigou area.<br />
An advantage of the Ruqigou / Gulaben area is that no larger water surfaces (except a very small p<strong>on</strong>d<br />
in the far Southeast) exist. Therefore, PMA for <str<strong>on</strong>g>coal</str<strong>on</strong>g> will <strong>on</strong>ly extract <str<strong>on</strong>g>coal</str<strong>on</strong>g> and shadow surfaces, with<br />
the latter varying depending <strong>on</strong> sun angle. However, quantitative statements resulting from partial<br />
unmixing approaches and similar approaches still need to be handled with care. This is discussed in<br />
detail in chapter 9.4.<br />
Interactive shadowed area masking as presented in figure 9-7 for the Wuda study area was not<br />
performed for Ruqigou, since the terrain is too complex. However, it is obvious that without the<br />
influence of water, shadow and shadow margin the multitemporal comparis<strong>on</strong> of extracted <str<strong>on</strong>g>coal</str<strong>on</strong>g><br />
surfaces will show an overall increase over time.<br />
Figure 9-14 presents the PMA <str<strong>on</strong>g>coal</str<strong>on</strong>g> fracti<strong>on</strong> result of the Ruqigou area from 1999 thresholded with an<br />
85 % threshold (a), and 2002-09 (b) to extract <str<strong>on</strong>g>coal</str<strong>on</strong>g> surfaces exclusively. The tresholded images were<br />
- 178 -
a<br />
b<br />
N<br />
N<br />
Figure 9-14: Subpixel fracti<strong>on</strong> result image for <str<strong>on</strong>g>coal</str<strong>on</strong>g> intersected with a 85% threshold, to retrieve pure <str<strong>on</strong>g>coal</str<strong>on</strong>g><br />
surfaces; for the broader study area of Ruqigou, 1999 (a) and 2002-09 (b), Center coordinate: 606211E,<br />
4334381N, UTM, Z48N, 33km×28km<br />
furthermore majority filtered. The expansi<strong>on</strong> of mining operati<strong>on</strong>s in the valleys of Hulusitai and<br />
Shitanjing (white box in b) can be noted clearly.<br />
Figure 9-15 presents the result of PMA estimati<strong>on</strong> for the vegetati<strong>on</strong> fracti<strong>on</strong> for the broader Ruqigou<br />
area for the scenes of 1987-09 (a) and 2002-09 (b). Densely vegetated <str<strong>on</strong>g>areas</str<strong>on</strong>g> in the southeastern quarter<br />
of the subset can be observed. Further densely vegetated patches can be found in the small oasis in the<br />
northwestern quarter at the northern border of the subset. Also southwest of Ruqigou some denser<br />
mountainous vegetati<strong>on</strong> can be found. Coal surfaces are represented with very low values. In the other<br />
regi<strong>on</strong>s vegetati<strong>on</strong> density varies depending <strong>on</strong> geologic substrate and terrain. Thresholding,<br />
intersecti<strong>on</strong>s, delineati<strong>on</strong> and <str<strong>on</strong>g>coal</str<strong>on</strong>g> <str<strong>on</strong>g>fire</str<strong>on</strong>g> <str<strong>on</strong>g>risk</str<strong>on</strong>g> area reducti<strong>on</strong>, which can be achieved by dense vegetati<strong>on</strong><br />
exclusi<strong>on</strong>, are presented in chapter 10.<br />
a<br />
b<br />
N<br />
N<br />
0% 100% 0% 100%<br />
Figure 9-15: Partial unmixing results for vegetati<strong>on</strong> for the broader Ruqigou area for 1987-09 (a) and 2002-09<br />
(b). Light <str<strong>on</strong>g>areas</str<strong>on</strong>g> indicate a high fracti<strong>on</strong> (pure Artemisia leaves), while dark <str<strong>on</strong>g>areas</str<strong>on</strong>g> represent pixels with a<br />
smaller fracti<strong>on</strong> of vegetati<strong>on</strong>. Center coordinate: 610605E, 43327047N, UTM, Z48 N, 33km×28km.<br />
- 179 -
To extract pyrometamorphic rock, PMA was applied for the scenes of Ruqigou from September 2003<br />
and May 2003. The result shows lighter <str<strong>on</strong>g>areas</str<strong>on</strong>g> in the mining area of Ruqigou, but also large <str<strong>on</strong>g>areas</str<strong>on</strong>g><br />
covered with pure desert sand were extracted. This problem was already addressed in chapter 8. The<br />
overall PM result appears very blurred. Most pixels – except str<strong>on</strong>gly vegetated <str<strong>on</strong>g>areas</str<strong>on</strong>g> in the Southeast<br />
and an area covered by a thin cloud – show the c<strong>on</strong>tributi<strong>on</strong> of the input signal to at least some extent.<br />
a<br />
b<br />
100%<br />
N<br />
b’<br />
b<br />
N<br />
N<br />
0%<br />
Figure 9-16: Subpixel fracti<strong>on</strong> image for pyrometamorphic rock (averaged prototype spectrum) for the broader<br />
Ruqigou area calculated for the scene from 2002-09. Center coordinate of a: 607794E, 4336506N, b and b’:<br />
595287E, 4325273N, UTM, Z48N, 33km×28km.<br />
Though the pyrometamorphic <str<strong>on</strong>g>areas</str<strong>on</strong>g> within the structural syncline were extracted with clearly higher<br />
fracti<strong>on</strong>s, the result cannot be used for the automated mapping of pyrometamoprhic rock, unless some<br />
post filters are applied. Visual comparis<strong>on</strong> of thresholded fracti<strong>on</strong>s (>70%) and the original data<br />
dem<strong>on</strong>strated that the pyrometamorphic regi<strong>on</strong>s reached PMA scores exceeding the threshold<br />
(indicating a very good producer accuracy). However, too many pixels with surfaces unaffected by<br />
pyrometamorphosis show similar high scores. PMA was also calculated for the single<br />
pyrometamorphic spectra instead of the averaged prototype spectra to account for the high variability<br />
of these rocks (and spectra). Visual comparis<strong>on</strong>s yielded no improvement to the PMA result retrieved<br />
with the averaged prototype spectrum. One reas<strong>on</strong> for this weaker extracti<strong>on</strong> is the fact that<br />
pyrometamorphic pixels are not c<strong>on</strong>sidered extreme pixels. However, the general extracti<strong>on</strong> of the<br />
desired pixles was successful and pyrometamorphic regi<strong>on</strong>s can be extracted from the multi<strong>spectral</strong><br />
ETM+ data in a knowledge base <strong>test</strong> sequence,- as well as a PMA approach. Only for an automated<br />
mapping approach not influenced by analyst interpretati<strong>on</strong> do pyrometamorphic pixels not give<br />
sufficient indicati<strong>on</strong> for distinct <strong>spectral</strong> recogniti<strong>on</strong>.<br />
Linear unmixing with a multi EM model was not performed for the Ruqigou area. Only limited ground<br />
knowledge of this area exists and it is not sure, which endmembers (next to <str<strong>on</strong>g>coal</str<strong>on</strong>g> and vegetati<strong>on</strong>) would<br />
yield an unmixing result of high accuracy.<br />
- 180 -
9.2.2. Results for the Transfer Regi<strong>on</strong>s<br />
9.2.2.1. Flinders Ranges, Leigh Creek, Australia<br />
Figure 9-17 a represents the PMA result for the <str<strong>on</strong>g>coal</str<strong>on</strong>g> prototype spectrum for the Leigh Creek area,<br />
Australia. Next to <str<strong>on</strong>g>coal</str<strong>on</strong>g>, some deep lakes, shaded <str<strong>on</strong>g>areas</str<strong>on</strong>g> and also some geologic surfaces are represented<br />
by high subpixel fracti<strong>on</strong>s. The visual impressi<strong>on</strong> for the Leigh Creek area shows a good result of the<br />
fracti<strong>on</strong> image thresholding at 85% subpixel <str<strong>on</strong>g>coal</str<strong>on</strong>g> fracti<strong>on</strong>. Next to the <str<strong>on</strong>g>coal</str<strong>on</strong>g> mining area, which is<br />
clearly distinguishable, three deep dark artificial lakes south of the mining area as well as some<br />
shadowed <str<strong>on</strong>g>areas</str<strong>on</strong>g> were extracted. These can not be removed through the applicati<strong>on</strong> of a majority filter.<br />
However, the postprocessing – intersecting the 85% thresholded <str<strong>on</strong>g>coal</str<strong>on</strong>g> subpixel fracti<strong>on</strong> result with the<br />
temperature <strong>test</strong> of the knowledge <str<strong>on</strong>g>based</str<strong>on</strong>g> <strong>test</strong> sequence – can fully remove these <str<strong>on</strong>g>areas</str<strong>on</strong>g>. As outlined by<br />
figure 9-16 b dense vegetati<strong>on</strong> for the Leigh Creek regi<strong>on</strong> <strong>on</strong>ly occurs al<strong>on</strong>g seas<strong>on</strong>al river beds and<br />
small creeks as well as al<strong>on</strong>g the shores of the reservoirs. In the remaining area vegetati<strong>on</strong> density is<br />
clearly correlated with geology, where some strata shows a higher vegetati<strong>on</strong> density than other<br />
surfaces. A <str<strong>on</strong>g>coal</str<strong>on</strong>g> <str<strong>on</strong>g>fire</str<strong>on</strong>g> (<str<strong>on</strong>g>risk</str<strong>on</strong>g>) area map is presented in chapter 10.<br />
a<br />
b<br />
N<br />
N<br />
0% 100% 0% 100%<br />
Figure 9-17: Fracti<strong>on</strong> image of <str<strong>on</strong>g>coal</str<strong>on</strong>g> resulting from partial unmixing for the broader Leigh Creek area,<br />
Australia, (a) and fracti<strong>on</strong> image of vegetati<strong>on</strong> (b). Center coordinate: 6626009 S; 252463 E, UTM, Z54 S.<br />
b<br />
a<br />
N<br />
N<br />
Figure 9-18: Thresholded 85% subpixel <str<strong>on</strong>g>coal</str<strong>on</strong>g> fracti<strong>on</strong> image before (a) and after (b) the intersecti<strong>on</strong> with the<br />
temperature <strong>test</strong> (majority filtered). Center coordinate: 6626009 S; 252463 E, UTM, Z54 S, 60km×50km.<br />
- 181 -
9.2.2.2. Jharia and Ray <str<strong>on</strong>g>coal</str<strong>on</strong>g> mining regi<strong>on</strong>s, India<br />
The PMA result for the scene of India looks very good. It can be noted that the <str<strong>on</strong>g>coal</str<strong>on</strong>g> surfaces clearly<br />
visible within the multi<strong>spectral</strong> image are distinctly extracted in the PMA result. The result of PMA<br />
thresholding at the 85% fracti<strong>on</strong> yields the image shown in figure 9-19 c. However, it also can be<br />
noted in figure 9-19 b that not <strong>on</strong>ly <str<strong>on</strong>g>coal</str<strong>on</strong>g> surfaces, but also their affected surrounding (mixtures with<br />
<str<strong>on</strong>g>coal</str<strong>on</strong>g> dust etc.) are extracted as very bright subpixel fracti<strong>on</strong>s. Pure <str<strong>on</strong>g>coal</str<strong>on</strong>g> surfaces are therefore slightly<br />
overestimated. The same applies for the <str<strong>on</strong>g>coal</str<strong>on</strong>g> field close to the town Ray presented in Figure 9-20 a, b<br />
and c.<br />
a<br />
N<br />
b<br />
N<br />
0% 100%<br />
Figure 9-19: PMA result for the scene of India (<strong>on</strong>ly<br />
the Jharia area is presented). Original image (a),<br />
grey scale fracti<strong>on</strong> image (b) and result after<br />
thresholding at the 85% fracti<strong>on</strong> (majority filtered)<br />
(c). Center coordinate: 430324E; 2622931N, UTM,<br />
Z45N, 33km×25km<br />
c<br />
N<br />
Results will be quantified in the next chapter. It is well known that the Jharia <str<strong>on</strong>g>coal</str<strong>on</strong>g> fields are affected<br />
by several <str<strong>on</strong>g>coal</str<strong>on</strong>g> <str<strong>on</strong>g>fire</str<strong>on</strong>g>s. For the <str<strong>on</strong>g>coal</str<strong>on</strong>g> mining regi<strong>on</strong> close to the town Ray no informati<strong>on</strong> <strong>on</strong> <str<strong>on</strong>g>coal</str<strong>on</strong>g> <str<strong>on</strong>g>fire</str<strong>on</strong>g><br />
occurrence could be found in internati<strong>on</strong>al references. Also PRAKASH (2004, pers<strong>on</strong>al<br />
communicati<strong>on</strong>), who is very familiar with the Jharia area could not give detailed informati<strong>on</strong> <strong>on</strong> the<br />
Ray area 100 km west of Jharia. However, the <str<strong>on</strong>g>coal</str<strong>on</strong>g> outcrops in this regi<strong>on</strong> are very distinct and are the<br />
sec<strong>on</strong>d largest in the ETM+ scene acquired for India. Therefore, for this area <str<strong>on</strong>g>coal</str<strong>on</strong>g> <str<strong>on</strong>g>fire</str<strong>on</strong>g> are demarcati<strong>on</strong><br />
and <str<strong>on</strong>g>coal</str<strong>on</strong>g> <str<strong>on</strong>g>fire</str<strong>on</strong>g> <str<strong>on</strong>g>risk</str<strong>on</strong>g> maps will also be generated. Figure 9-20 presents the partial unmixing result to the<br />
prototype spectrum for this area.<br />
- 182 -
a<br />
N<br />
b<br />
N<br />
0% 100%<br />
Figure 9-20: PMA result for the scene of India (<strong>on</strong>ly<br />
the Ray area is presented). Original image (a), grey<br />
scale fracti<strong>on</strong> image (b) and result after thresholding<br />
at the 85% fracti<strong>on</strong> (c). Center coordinate: 301422E;<br />
2622092N, UTM, Z45N, 17km×13km.<br />
As for the Jharia area <str<strong>on</strong>g>coal</str<strong>on</strong>g> surfaces are slightly<br />
N overestimated. Furthermore some small very<br />
c<br />
dark lakes of similar <strong>spectral</strong> pattern were<br />
extracted also. These can be excluded with<br />
temperature <str<strong>on</strong>g>based</str<strong>on</strong>g> post processing as<br />
implemented in the knowledge <str<strong>on</strong>g>based</str<strong>on</strong>g> <strong>spectral</strong> <strong>test</strong> sequence presented. PMA vegetati<strong>on</strong> extracti<strong>on</strong><br />
posed not problem for the scene of India. Most of the scene is extracted with high subpixel fracti<strong>on</strong><br />
values. Only riverbeds, lakes, <str<strong>on</strong>g>coal</str<strong>on</strong>g> accumulati<strong>on</strong>s, settlements and bare fields indicate low subpixel<br />
fracti<strong>on</strong>s for the vegetati<strong>on</strong> endmember. Based <strong>on</strong> automated <str<strong>on</strong>g>coal</str<strong>on</strong>g> extracti<strong>on</strong>, a delineati<strong>on</strong> of this area<br />
with a 500 m delineati<strong>on</strong> radius and the exclusi<strong>on</strong> of densely vegetated <str<strong>on</strong>g>areas</str<strong>on</strong>g>, probable <str<strong>on</strong>g>coal</str<strong>on</strong>g> <str<strong>on</strong>g>fire</str<strong>on</strong>g> <str<strong>on</strong>g>areas</str<strong>on</strong>g><br />
were demarcated for the whole ETM+ scene of northeastern India. Demarcated <str<strong>on</strong>g>coal</str<strong>on</strong>g> <str<strong>on</strong>g>fire</str<strong>on</strong>g> <str<strong>on</strong>g>areas</str<strong>on</strong>g> and<br />
thermal anomalies retrieved from the applicati<strong>on</strong> of the thermal algorithm developed by ZHANG, J.<br />
(2004) are presented in chapter 10.<br />
9.2.2.3. Baotou, China<br />
Partial unmixing results for the Baotou area are presented in figure 9-22. All <str<strong>on</strong>g>coal</str<strong>on</strong>g> covered <str<strong>on</strong>g>areas</str<strong>on</strong>g> are<br />
represented by very bright pixels, indicating high <str<strong>on</strong>g>coal</str<strong>on</strong>g> fracti<strong>on</strong>s. However, many pixels were extracted<br />
with high subpixel prototype fracti<strong>on</strong>s, although no <str<strong>on</strong>g>coal</str<strong>on</strong>g> is present within these pixels. Even after a<br />
thresholding at 85 % subpixel fracti<strong>on</strong> a large percentage of pixels err<strong>on</strong>eously extracted as <str<strong>on</strong>g>coal</str<strong>on</strong>g><br />
remains. The whole scene of Baotou covers over 60 Mio. Pixels. 1.4 Mio pixels remain after a 85%<br />
fracti<strong>on</strong> thresholding. Next to <str<strong>on</strong>g>coal</str<strong>on</strong>g> especially the settled <str<strong>on</strong>g>areas</str<strong>on</strong>g> were recognized. C<strong>on</strong>fusi<strong>on</strong> between<br />
<str<strong>on</strong>g>coal</str<strong>on</strong>g> and dark asphalt occurs. Though these two surfaces show slightly differing <strong>spectral</strong> profiles, the<br />
maximizati<strong>on</strong> of the requested signal leads to the extracti<strong>on</strong> of similar surfaces also. This problem will<br />
be addressed in more detail in the discussi<strong>on</strong> (chapter 9.4.).<br />
- 183 -
a<br />
N<br />
b<br />
N<br />
0% 100%<br />
Figure 9-21: PMA result for the scene of Baotou<br />
(<strong>on</strong>ly a subset is presented). Original image (a), grey<br />
scale fracti<strong>on</strong> image (b) and result after thresholding<br />
at the 85% fracti<strong>on</strong> (c). Also a post processing<br />
temperature <strong>test</strong> applied cannot improve the result<br />
presented in c. Center coordinate: 375443E;<br />
4495960N, UTM, Z49N, 80km×60km.<br />
c<br />
N<br />
Majority filtering can slightly improve the result presented in 9-21 c. However, the PMA result for<br />
Baotou will lead to the derivati<strong>on</strong> of too large <str<strong>on</strong>g>coal</str<strong>on</strong>g> <str<strong>on</strong>g>fire</str<strong>on</strong>g> <str<strong>on</strong>g>risk</str<strong>on</strong>g> <str<strong>on</strong>g>areas</str<strong>on</strong>g>. Here the result of <str<strong>on</strong>g>coal</str<strong>on</strong>g> <str<strong>on</strong>g>fire</str<strong>on</strong>g> area<br />
demarcati<strong>on</strong> <str<strong>on</strong>g>based</str<strong>on</strong>g> <strong>on</strong> a <strong>spectral</strong> <strong>test</strong> sequence outperforms PMA analysis. A comparis<strong>on</strong> of accuracy,<br />
feasibility and demarcati<strong>on</strong> results for both algorithms applied will be presented in chapter 10.<br />
9.3. Quantificati<strong>on</strong> and Error Analysis of the Partial Unmixing Results<br />
9.3.1. Quantificati<strong>on</strong> and Error Analysis of the Main Study Areas<br />
Here <strong>on</strong>ly the producers accuracies for the two main study <str<strong>on</strong>g>areas</str<strong>on</strong>g> over all time steps for the individual<br />
surfaces are shown. This is to avoid redundancy with chapter 8. For informati<strong>on</strong> <strong>on</strong> the sources of<br />
ground data refer to chapter 8.<br />
Table 9-1: Accuracy assessment for the 85 % thresholded <str<strong>on</strong>g>coal</str<strong>on</strong>g> fracti<strong>on</strong>s and 85 % thresholded vegetati<strong>on</strong><br />
fracti<strong>on</strong>s for the Wuda study area<br />
Date Prod. accuracy, <str<strong>on</strong>g>coal</str<strong>on</strong>g> Prod. accuracy, dense vegetati<strong>on</strong><br />
1987-09 not available not available<br />
1999-08 not available not available<br />
2000-10 87.91 % (Wuda mine) not available<br />
2001-10 not available not available<br />
2002-09 89.65 % (mapping) 91.03 % (mapping)<br />
2002-12 54.02 % (mapping) not available, winter<br />
- 184 -
Table 9-1 c<strong>on</strong>t’d<br />
Date Prod. accuracy, <str<strong>on</strong>g>coal</str<strong>on</strong>g> Prod. accuracy, dense vegetati<strong>on</strong><br />
2003-02 61.72 % (mapping) not available, winter<br />
2003-05 76.47 % (Quickbird & mapping) 88.31 % (Quickbird & mapping)<br />
Table 9-2: Accuracy assessment for the 85 % thresholded <str<strong>on</strong>g>coal</str<strong>on</strong>g> fracti<strong>on</strong>s and 85 % thresholded vegetati<strong>on</strong><br />
fracti<strong>on</strong>s for the Ruqigou study area<br />
Date Prod. accuracy, <str<strong>on</strong>g>coal</str<strong>on</strong>g> Prod. accuracy, dense veg. Prod. accuracy, pyro. rock<br />
1987-09 not available not available not available<br />
1999-08 89.45 % (ITC project data) not available not available<br />
2000-10 89.98 % (Ik<strong>on</strong>os) not available not available<br />
2001-10 not available not available not available<br />
2002-09 91.42 % (mapping) 86.22 % (mapping) 100.00 % (mapping)<br />
2002-12 32.81 % (mapping) not available, winter not available<br />
2003-02 29.11 % (mapping) not available, winter not available<br />
2003-05 77.87 % (QB & mapping) 83.59 % (QB & mapping) 97.13 % (mapping)<br />
Suhai Tu<br />
Sandst<strong>on</strong>e plateau 1<br />
Sandst<strong>on</strong>e plateau 2<br />
Wuhushan<br />
Wuhushan south<br />
Extracti<strong>on</strong> accuracies accuracies for <str<strong>on</strong>g>coal</str<strong>on</strong>g> in Wuda<br />
range between 54.02 % and 89.65 %. Excluding the<br />
winter scenes 76.47 % to 89.65 % are reached.<br />
Similar good results for dense vegetati<strong>on</strong> between<br />
88.31 % and 91.03 % indicate the good suitability<br />
of PMA for the mapping of a single surface of<br />
interest. The same applies for the Ruqigou area,<br />
where producers accuracies for <str<strong>on</strong>g>coal</str<strong>on</strong>g> range between<br />
77.87 % and 91.42 % not taking winter scenes into<br />
account. Dense vegetati<strong>on</strong> was mapped with<br />
83.59 % to 86.22 % producer accuracy. The<br />
extremely good accuracy for the extracti<strong>on</strong> of<br />
pyrometamorphic rock mimics the fact that next to<br />
the ground truth <str<strong>on</strong>g>areas</str<strong>on</strong>g> also many other regi<strong>on</strong>s<br />
yielded very high subpixel scores.<br />
Alluvial fan 1<br />
Alluvial fan 2<br />
N<br />
Figure 9-22: Locati<strong>on</strong> of the seven mixture grids<br />
mapped during the field campaign in September 2002.<br />
Over 600 cells were mapped with regard to their<br />
percentage subcell fracti<strong>on</strong> of the occurring surface<br />
comp<strong>on</strong>ents. The grids are superimposed <strong>on</strong> an ETM+<br />
PMA result of 2002-09. Center coordinate of the<br />
presented subset 644123E, 4370610N, UTM, Z48N,<br />
23km×10km<br />
- 185 -
As shortly introduced in chapter 4, seven mixture grids were mapped during the 2002 field campaign.<br />
These grids can be used to assess the PMA result <strong>on</strong> a very detailed basis. The locati<strong>on</strong> of the seven<br />
grids is shown in figure 9-22. The grids Suhai Tu, Wuhushan and Wuhushan south are located above<br />
active <str<strong>on</strong>g>coal</str<strong>on</strong>g> <str<strong>on</strong>g>fire</str<strong>on</strong>g>s and their surrounding (<str<strong>on</strong>g>fire</str<strong>on</strong>g>s #6, #8 and # 13 respectively). While – next to other<br />
surface types – <str<strong>on</strong>g>coal</str<strong>on</strong>g> and vegetati<strong>on</strong> do occur in some of the cells of these three grids, the two grids <strong>on</strong><br />
the sandst<strong>on</strong>e plateau as well as the two grids mapped <strong>on</strong> the alluvial fan do not c<strong>on</strong>tain <str<strong>on</strong>g>coal</str<strong>on</strong>g>.<br />
However, the PMA result for <str<strong>on</strong>g>coal</str<strong>on</strong>g> indicates a <str<strong>on</strong>g>coal</str<strong>on</strong>g> fracti<strong>on</strong> in all of the cells of the “Sandst<strong>on</strong>e<br />
plateau 1” grid. The fracti<strong>on</strong> values for the 15 grid cells range between 21 % and 45 % <str<strong>on</strong>g>coal</str<strong>on</strong>g> fracti<strong>on</strong><br />
(n=15). The average <str<strong>on</strong>g>coal</str<strong>on</strong>g> fracti<strong>on</strong> value for the whole grid is 28 %. For the grid “Sandst<strong>on</strong>e plateau 2”<br />
fracti<strong>on</strong> values for <str<strong>on</strong>g>coal</str<strong>on</strong>g> – though no <str<strong>on</strong>g>coal</str<strong>on</strong>g> is present – range between 24% and 41%. The average is<br />
29 % (n=23). The two grids <strong>on</strong> the alluvial fan do not c<strong>on</strong>tain <str<strong>on</strong>g>coal</str<strong>on</strong>g> either. However, the average for<br />
“Alluvial fan 1” ranging between 26 % and 37 % is 31 % (n=11). For the large grid “Alluvial fan 2”<br />
(n=185) PMA <str<strong>on</strong>g>coal</str<strong>on</strong>g> fracti<strong>on</strong> values range between 29 % and 45 % with an average of 36 %.<br />
This phenomen<strong>on</strong> of fracti<strong>on</strong> overestimati<strong>on</strong> due to the maximizati<strong>on</strong> of the prototype spectrum is<br />
typical for partial unmixing approaches. Therefore fracti<strong>on</strong> estimates – especially in the lower fracti<strong>on</strong><br />
range – have to be interpreted with care. Figure 9-23 presents the mapping results for the subpixel <str<strong>on</strong>g>coal</str<strong>on</strong>g><br />
occurrence (as mapped in the field) next to the result of PMA. Orange boxes within the PMA results<br />
mark regi<strong>on</strong>s, which were not mapped. Here dangerous terrain limited the mapping.<br />
Figure 9-23: The three main grids mapped within Wuda syncline, Suhai Tu (left), Wuhushan (upper right) and<br />
Wuhushan south (lower right). The mapping result from the field in September 2002 (left side) as well as the<br />
PMA result for the partial unmixing to <str<strong>on</strong>g>coal</str<strong>on</strong>g> – also from a September 2002 scene - (right side) are shown.<br />
Orange boxes indicate <str<strong>on</strong>g>areas</str<strong>on</strong>g>, which were not mapped.<br />
- 186 -
For these grids regressi<strong>on</strong> analyses were undertaken to investigate the relati<strong>on</strong>ship between the<br />
subpixel field mapping and the partial unmixing result. Correlati<strong>on</strong> coefficients for the seven mapped<br />
grids for analyses between mapped <str<strong>on</strong>g>coal</str<strong>on</strong>g> and the PMA <str<strong>on</strong>g>coal</str<strong>on</strong>g> fracti<strong>on</strong> as well as between vegetati<strong>on</strong> and<br />
the PMA vegetati<strong>on</strong> fracti<strong>on</strong> are presented in table 9-3. They are not c<strong>on</strong>sidered of satisfying<br />
significance and indicate insufficient explanati<strong>on</strong>. Also cross correlati<strong>on</strong> analysis shifting the grids<br />
against each other as well as cross validati<strong>on</strong> excluding certain values or value ranges did not lead to<br />
an improvement of these coefficients. Even though this validati<strong>on</strong> is unpleasant it was decided to<br />
present it here. Most unmixing or partial unmixing analysis <strong>on</strong>ly validate results <str<strong>on</strong>g>based</str<strong>on</strong>g> <strong>on</strong> thresholding<br />
the fracti<strong>on</strong> images above a certain percentage and comparing the retrieved <str<strong>on</strong>g>areas</str<strong>on</strong>g> with ground truth<br />
polyg<strong>on</strong>s. This validati<strong>on</strong> method has also been applied to the PMA results as presented before.<br />
Results were very good. The applicati<strong>on</strong> of mapped mixture grids acquired during field campaigns is<br />
<strong>on</strong>ly presented in rare cases.<br />
KUEMMERLE (2003) plotted the results of a field mappings of woody vegetati<strong>on</strong> comp<strong>on</strong>ents and<br />
herbaceous vegetati<strong>on</strong> comp<strong>on</strong>ents against unmixing results of these fracti<strong>on</strong>s and yielded R²s of 0.71<br />
and 0.54 respectively. This result was achieved even though the ETM+ data set used was acquired two<br />
years after the field mapping. In his case <strong>on</strong>ly eleven pixels could be compared with ground truth. He<br />
found that SMA leads to an overestimati<strong>on</strong> of the vegetati<strong>on</strong> comp<strong>on</strong>ent when ground covering<br />
densities are low. This coincides with an overestimati<strong>on</strong> of vegetati<strong>on</strong> for about 20% in the two grids<br />
mapped (Sandst<strong>on</strong>e plateau 1 and Sandst<strong>on</strong>e plateau 2) where no vegetati<strong>on</strong> was present. Furthermore<br />
it is likely that PMA (due to the maximizati<strong>on</strong> approach) overestimates a surface of low overall<br />
c<strong>on</strong>tributi<strong>on</strong> much more, than SMA.<br />
Table 9-3: Regressi<strong>on</strong> analyses between mapped subpixel fracti<strong>on</strong>s and the PMA result<br />
R² for <str<strong>on</strong>g>coal</str<strong>on</strong>g> mapping versus <str<strong>on</strong>g>coal</str<strong>on</strong>g><br />
fracti<strong>on</strong> images<br />
R² for vegetati<strong>on</strong> mapping versus<br />
fracti<strong>on</strong> images<br />
Suhai Tu 0.35 0.46<br />
Wuhushan 0.18 0.23<br />
Wuhushan South 0.21 0.31<br />
Sandst<strong>on</strong>e plateau 1 no <str<strong>on</strong>g>coal</str<strong>on</strong>g> existing, offset of 28 % no vegetati<strong>on</strong> exists, offset of 20 %<br />
Sandst<strong>on</strong>e plateau 2 no <str<strong>on</strong>g>coal</str<strong>on</strong>g> existing, offset of 29 % no vegetati<strong>on</strong> exists, offset of 22 %<br />
Alluvial fan 1 no <str<strong>on</strong>g>coal</str<strong>on</strong>g> existing, offset of 31 % 0.42<br />
Alluvial fan 2 no <str<strong>on</strong>g>coal</str<strong>on</strong>g> existing, offset of 36 % 0.51<br />
Reas<strong>on</strong>s for the weak results between modelling and field data can be the co-registrati<strong>on</strong> of the data.<br />
However, shifts for the datasets were in the subpixel range and it was tried to compensate any<br />
unknown effect with cross correlati<strong>on</strong>. This did not improve the results. Therefore, the main problem<br />
is assumed to be the mapping method of the mixture grids in the field. A human analyst has a clearly<br />
different view <strong>on</strong>to a certain grid cell within the field than a nadir looking sensor system. While the<br />
sensor has an near orthometric view, the analyst’s fracti<strong>on</strong> estimati<strong>on</strong> will always be biased by a<br />
limited field of view. It is likely that the vegetati<strong>on</strong> fracti<strong>on</strong> is overestimated, while soil fracti<strong>on</strong>s are<br />
underestimated (KUEMMERLE 2003). Surfaces with high c<strong>on</strong>trasts to their surrounding might be<br />
mapped with a larger spatial subpixel proporti<strong>on</strong> than is actually covered. In additi<strong>on</strong>, for the surface<br />
“<str<strong>on</strong>g>coal</str<strong>on</strong>g>” mimicking effects with shadow lead to a phenomen<strong>on</strong>, which also needs to be menti<strong>on</strong>ed. A<br />
- 187 -
pixel can c<strong>on</strong>tain terrain induced shadow (e.g. shade from a mountain) and so called micro-shadow.<br />
These are shadow comp<strong>on</strong>ents included in a totally flat pixel, which are induced by vegetati<strong>on</strong> or<br />
surface roughness. This comp<strong>on</strong>ent will always mimic a slight porti<strong>on</strong> of “<str<strong>on</strong>g>coal</str<strong>on</strong>g>” to be available in each<br />
pixel. However, regarding the overall patterns in figure 9-23 presenting mapping and PMA results for<br />
the three largest grids the approximate distributi<strong>on</strong> of <str<strong>on</strong>g>areas</str<strong>on</strong>g> of higher <str<strong>on</strong>g>coal</str<strong>on</strong>g> occurrence can be noted.<br />
Though this statement is <str<strong>on</strong>g>based</str<strong>on</strong>g> <strong>on</strong> visual analysis exclusively, it is suggested that the overall patterns<br />
can be recognized in the field mapping results as well as in PMA results.<br />
Comparis<strong>on</strong>s of the PMA result of from 2002-09 (ETM+) with the SMA <str<strong>on</strong>g>coal</str<strong>on</strong>g> fracti<strong>on</strong> image of the<br />
same scene yielded an R² of 0.46, which is of some significance c<strong>on</strong>sidering that over 1 Mio pixels (n)<br />
are plotted against each other. However, when <strong>on</strong>ly the 85% thresholded fracti<strong>on</strong> score of both images<br />
are compared an overlap area of 73% indicates a good accordance of both results. The SMA result<br />
thresholded at 85% tends to slightly underestimate <str<strong>on</strong>g>coal</str<strong>on</strong>g> surfaces.<br />
9.3.2. Quantificati<strong>on</strong> and Error Analysis of the Transfer Regi<strong>on</strong>s<br />
To not create redundancy with chapter 8, here <strong>on</strong>ly the producer accuracies for the three transfer<br />
scenes and the individual surfaces are shown. For informati<strong>on</strong> <strong>on</strong> the sources of ground data as well as<br />
informati<strong>on</strong> <strong>on</strong> the transfer <str<strong>on</strong>g>areas</str<strong>on</strong>g> refer to chapter 8. The accuracy refers to subpixel fracti<strong>on</strong>s<br />
exceeding 85% for <str<strong>on</strong>g>coal</str<strong>on</strong>g>, which – <str<strong>on</strong>g>based</str<strong>on</strong>g> <strong>on</strong> visual analysis – was c<strong>on</strong>sidered to be pure <str<strong>on</strong>g>coal</str<strong>on</strong>g>.<br />
Vegetati<strong>on</strong> is thresholded at the 65 % fracti<strong>on</strong>. User accuracies could not be calculated since no<br />
ground truth for the numerous other land cover surfaces did exist.<br />
Table 9-4: Accuracy of the extracted <str<strong>on</strong>g>coal</str<strong>on</strong>g> for Australia<br />
Date Prod. accuracy, <str<strong>on</strong>g>coal</str<strong>on</strong>g> Prod. accuracy, dense vegetati<strong>on</strong><br />
15.11.2002 92.23 % not available<br />
Table 9-5: Accuracy of the extracted <str<strong>on</strong>g>coal</str<strong>on</strong>g> and dense vegetati<strong>on</strong> pixels for India<br />
Date Prod. accuracy, <str<strong>on</strong>g>coal</str<strong>on</strong>g> Prod. accuracy, dense vegetati<strong>on</strong><br />
02.11.2001 86.87 % 89.03 %<br />
Table 9-6: Accuracy of the extracted <str<strong>on</strong>g>coal</str<strong>on</strong>g> and dense vegetati<strong>on</strong> pixels for Baotou<br />
Date Prod. accuracy, <str<strong>on</strong>g>coal</str<strong>on</strong>g> Prod. accuracy, dense vegetati<strong>on</strong><br />
29.08.2002 91.55 % 67.33 %<br />
The results for the Leigh Creek area in Australia, where – according to ground truth – 92.23 % of the<br />
<str<strong>on</strong>g>coal</str<strong>on</strong>g> covered surfaces could be extracted is very good. Even though user’s accuracies can not be<br />
calculated, very few pixels outside the <str<strong>on</strong>g>coal</str<strong>on</strong>g> field were additi<strong>on</strong>ally extracted as <str<strong>on</strong>g>coal</str<strong>on</strong>g>. These can be<br />
eliminated <str<strong>on</strong>g>based</str<strong>on</strong>g> <strong>on</strong> post processing. The user’s accuracy is assumed to be high. The results for India<br />
are also sufficient. A producer accuracy of 86.87 % for <str<strong>on</strong>g>coal</str<strong>on</strong>g> and 89.03 % for dense vegetati<strong>on</strong> clearly<br />
indicates that PMA analysis employing a prototype spectrum is successful. Results are slightly weaker<br />
- 188 -
than for the other two transfer <str<strong>on</strong>g>areas</str<strong>on</strong>g>. The completely different envir<strong>on</strong>ment in a tropical climate z<strong>on</strong>e<br />
and very high standard deviati<strong>on</strong>s of most surfaces can be resp<strong>on</strong>sible for this observati<strong>on</strong>.<br />
PMA for the scene of Baotou yields good extracti<strong>on</strong> accuracies for <str<strong>on</strong>g>coal</str<strong>on</strong>g> and dense vegetati<strong>on</strong>.<br />
However, as presented in figure 9-21 a lot of additi<strong>on</strong>al pixels were extracted with high subpixel<br />
fracti<strong>on</strong> percentages, indicating a low user’s accuracy.<br />
9.4. Discussi<strong>on</strong><br />
General advantages of the partial unmixing approach compared to other methods are manifold. Most<br />
classificati<strong>on</strong> techniques like UCA, SCA, OOC; ANN, visual interactive delineati<strong>on</strong> of classes and<br />
also the knowledge <str<strong>on</strong>g>based</str<strong>on</strong>g> system presented in chapter 8 can <strong>on</strong>ly provide a qualitative measure of<br />
class membership. A pixel either bel<strong>on</strong>gs to a class or not – the c<strong>on</strong>clusi<strong>on</strong> drawn is a hard statement,<br />
which often <strong>on</strong>ly approximates real ground c<strong>on</strong>diti<strong>on</strong>s.<br />
In general, the quantitative sub-pixel informati<strong>on</strong> derived from a <strong>spectral</strong> unmixing or partial unmixing<br />
approach is c<strong>on</strong>sidered of much higher value – especially since the sub-pixel scale allows for fuzzy<br />
class transiti<strong>on</strong>s and c<strong>on</strong>tributes to the fact that most real materials occur in dimensi<strong>on</strong>s smaller than<br />
the pixel size (KUEMMERLE 2003, TOMPKINS et al. 1997). The partial unmixing approach presented<br />
here can c<strong>on</strong>tribute to the facts that land cover does not fit in square raster grid cells and that pixels are<br />
usually not homogeneous, no matter how small they are. The algorithm does not pretend the pixel to<br />
be a geographical object (FISHER 1997). Furthermore, fracti<strong>on</strong> images ranging between 0-100%<br />
c<strong>on</strong>tributi<strong>on</strong> of a material are easier to interpret than DNs (ADAMS et al. 1995). However, since the<br />
PMA results are thresholded for <str<strong>on</strong>g>coal</str<strong>on</strong>g> <str<strong>on</strong>g>fire</str<strong>on</strong>g> area demarcati<strong>on</strong>, the advantage of subpixel fracti<strong>on</strong><br />
percentages is not necessarily of advantage for <str<strong>on</strong>g>coal</str<strong>on</strong>g> <str<strong>on</strong>g>fire</str<strong>on</strong>g> area demarcati<strong>on</strong>. Nevertheless, the fracti<strong>on</strong><br />
images generated in the process of <str<strong>on</strong>g>risk</str<strong>on</strong>g> area demarcati<strong>on</strong> can be used for time series analysis with<br />
respect to increasing polluti<strong>on</strong> with <str<strong>on</strong>g>coal</str<strong>on</strong>g> dust and associated materials.<br />
General disadvantages of partial unmixing are the extracti<strong>on</strong> of false positives or the tendency of<br />
overestimating a materials abundance within a pixel. If all scene materials are accurately known, a<br />
complete SMA approach will yield better results than partial unmixing (KRUSE et al. 2000). However,<br />
it is often not reas<strong>on</strong>able that all endmembers are exactly known and this c<strong>on</strong>cept hinders the spatial<br />
transferability of the SMA approach – especially when aiming at the extracti<strong>on</strong> of a certain surface.<br />
This is the reas<strong>on</strong> that no full SMA approach was implemented for <str<strong>on</strong>g>coal</str<strong>on</strong>g> <str<strong>on</strong>g>fire</str<strong>on</strong>g> area delineati<strong>on</strong>, which<br />
needs to be applicable not <strong>on</strong>ly for the well known study regi<strong>on</strong>s.<br />
The slight disadvantage of PMA of maximizing the <strong>spectral</strong> resp<strong>on</strong>se, which may lead to the definiti<strong>on</strong><br />
of “false positives”, can be overcome applying a so called “infeasibility calculati<strong>on</strong>”. This calculati<strong>on</strong><br />
reduces the number of false positives found in partial unmixing results. Infeasibility images are in<br />
noise sigma units indicating the feasibility of the partial unmixing result. Pixels of high infeasibility<br />
are likely to be partially unmixed false positives, while correctly mapped pixels show a low<br />
infeasibility value and a PMA score above the background distributi<strong>on</strong> around zero. 2-D scatter<br />
plotting of the partial unmixing result against the infeasibility image can be used to identify pixels<br />
with low infeasibilities and high matching scores (KRUSE et al. 2000).<br />
- 189 -
Although, infeasibility image calculati<strong>on</strong> is included in the comm<strong>on</strong> software package ENVI, the<br />
calculati<strong>on</strong> of infeasibility images is not published and available. According to RSI the algorithm<br />
implemented is under closure, since it was developed for US defense related purposes (RSI, pers<strong>on</strong>al<br />
communicati<strong>on</strong>, 04-2004). Although output results look good and can improve extracti<strong>on</strong> accuracy<br />
substantially, the algorithm was <strong>on</strong>ly applied for <strong>test</strong>s with the data. It can not be included in<br />
the surface extracti<strong>on</strong> scheme, since the mathematical background is not fully clear. Discussi<strong>on</strong>s and<br />
c<strong>on</strong>tacts with several experts of hyper<strong>spectral</strong> image analysis (SETTLE, HOSTERT, VAN DER MEER,<br />
pers<strong>on</strong>al communicati<strong>on</strong> 04/05-2004) indicated that the infeasibility calculati<strong>on</strong> – though comm<strong>on</strong>ly<br />
applied and published – is hardly understood to its full extent. Emails to the programmer of the<br />
infeasibility measure (BOARDMAN) remained unanswered.<br />
Figures 9-24and 9-25 dem<strong>on</strong>strate the thematic principle of infeasibility calculati<strong>on</strong> and show the<br />
result of a partial unmixing additi<strong>on</strong>ally intersected with the result of infeasibility calculati<strong>on</strong>. It has to<br />
be noted that infeasibility calculati<strong>on</strong> is performed <strong>on</strong> MNF transformed data.<br />
For the combined approach the background statistics are used just as in PMA to define the variability<br />
of the unknown natural dominant endmembers. The known signature of the requested material is used<br />
for the definiti<strong>on</strong> of <strong>on</strong>e corner of the mixing simplex. This fixed point has a well known noise<br />
distributi<strong>on</strong>. The background covariance , equivalent to the eigenvectors and eigenvalues (see MNF in<br />
chapter 3) define the shape, size and orientati<strong>on</strong> of the <strong>spectral</strong> scatter (KRUSE et al. 2000).<br />
Subpixel fracti<strong>on</strong> of EM<br />
= PMA score<br />
100%<br />
z<br />
a<br />
85%<br />
50%<br />
b<br />
c<br />
y<br />
Infeasibility<br />
x<br />
PMA score<br />
Deviati<strong>on</strong> from prototype spectrum: 0δ ½δ 1δ<br />
Figure 9-24: Thematic principle of class- or material membership infeasibility. Deviati<strong>on</strong> from the prototype<br />
spectrum is given in noise δ units. The right part illustrates, where the desired pixels requested to be extracted<br />
are located. Pixels with a high PMA score and a low infeasibility (= high feasibility) are similar or tend to be<br />
close to the prototype input. DAMM, 2004, modified and extended.<br />
Simplified, the basic assumpti<strong>on</strong> is that after PMA each pixel c<strong>on</strong>sists of a <strong>spectral</strong> mixture of the<br />
demanded EM (e.g. <str<strong>on</strong>g>coal</str<strong>on</strong>g>) and a background spectrum summing to 100 %. If the EM is approximated<br />
to 100 % the pixel is a pure pixel. If the PMA score is 0 % the pixel can be each arbitrary pixel within<br />
- 190 -
the background. Through MNF transformati<strong>on</strong> all background pixels are arranged around a point with<br />
uniform Gaussian variance. The prototype spectrum is an extreme pixel in feature space. The resulting<br />
feature space is approximately c<strong>on</strong>e shaped. The extreme pixel is located at the peak of the c<strong>on</strong>e and<br />
the c<strong>on</strong>e-basis represents the distributi<strong>on</strong> of background pixels defined through a radius, which is<br />
equal to the variance δ of the background distributi<strong>on</strong>. The center point of the c<strong>on</strong>e basis equals a<br />
background spectrum with 0 % fracti<strong>on</strong> of the endmember (DAMM 2004, KRUSE et al. 2000). In figure<br />
9-24 the x- and y axis span the background covariance of the feature space, while the z axis defines the<br />
percentage of the PMA score, which defines the subpixel fracti<strong>on</strong> of the EM. Pixel “a” located in the<br />
synthetic space is equal to the requested endmember and matches the prototype spectrum to 100 %,<br />
while pixel “c” does not bel<strong>on</strong>g to the EM, shows a 50 % PMA score and ¼ δ deviati<strong>on</strong> from the<br />
prototype spectrum. Pixel “b” represents the prototype with a 0 % fracti<strong>on</strong> but 0 δ deviati<strong>on</strong> (DAMM<br />
2004).<br />
A combined PMA and infeasibility calculati<strong>on</strong> was computed for MNF transformed data for a<br />
“difficult” scene of the Wuda study area. PMA calculati<strong>on</strong>s of the scene of 2002-12 acquired during<br />
lowest sun angles yielded – next to <str<strong>on</strong>g>coal</str<strong>on</strong>g> – large shadowed <str<strong>on</strong>g>areas</str<strong>on</strong>g> as well as parts of the Yellow River as<br />
high PMA scores. These phenomena could be eliminated with a post processing applying a relative<br />
temperature <strong>test</strong>. However, it should be evaluated, how the PMA result can be improved if a combined<br />
PMA and infeasibility calculati<strong>on</strong> is applied. Figure 9-25 a shows the result of PMA for this scene,<br />
a<br />
N<br />
b<br />
N<br />
c<br />
N<br />
d<br />
N<br />
Figure 9-25: Partial unmixing result post processed with infeasibility informati<strong>on</strong>. a: PMA result for Wuda from<br />
2002-12, b: infeasibility calculati<strong>on</strong> for the prototype spectrum of <str<strong>on</strong>g>coal</str<strong>on</strong>g>, c: 85% subpixel fracti<strong>on</strong> thresholded<br />
image of the PMA score, d: intersected image of high PMA scores (>85 %) and low infeasibility scores (
while figure 9-25 b shows the infeasibility image for the PMA result. Dark values (low infeasibilities<br />
= high feasibilities) represent pixels with a high likeliness that a high PMA score represents the<br />
prototype spectrum. Lighter <str<strong>on</strong>g>areas</str<strong>on</strong>g> are unlikely to represent this spectrum. Visually, it can already be<br />
noted that some very bright <str<strong>on</strong>g>areas</str<strong>on</strong>g> in the PMA image (Yellow River, shadowed valleys in the center<br />
and East) show <strong>on</strong>ly high infeasibility scores. With an intersecti<strong>on</strong> of these results the requested<br />
surfaces (<str<strong>on</strong>g>coal</str<strong>on</strong>g>) can be extracted with higher accuracy. Figure 9-25 c illustrates the PMA score<br />
intersected at an 85% subpixel fracti<strong>on</strong> threshold. Some <str<strong>on</strong>g>areas</str<strong>on</strong>g> not representing <str<strong>on</strong>g>coal</str<strong>on</strong>g> are still included<br />
(which are usually eliminated with a knowledge <str<strong>on</strong>g>based</str<strong>on</strong>g> post processing). However, if the two images (a<br />
and b) are intersected and <strong>on</strong>ly pixels are extracted, which show an PMA result exceeding 85 % and<br />
an infeasibility score below 10 % <strong>on</strong>ly the surfaces presented in figure 9-25 d remain. Though some<br />
<str<strong>on</strong>g>coal</str<strong>on</strong>g> surfaces are lost also, the result is very appealing. The shadowed <str<strong>on</strong>g>areas</str<strong>on</strong>g> in the East could be<br />
separated from <str<strong>on</strong>g>coal</str<strong>on</strong>g>, since these two are better distinguishable in synthetic MNF transformed data.<br />
It is hoped that the mathematic basis for the calculati<strong>on</strong> of infeasibility images will be accessible in the<br />
future. Not <strong>on</strong>ly for <str<strong>on</strong>g>coal</str<strong>on</strong>g> <str<strong>on</strong>g>fire</str<strong>on</strong>g> area demarcati<strong>on</strong> but in the general c<strong>on</strong>text of PMA routines would this<br />
measure str<strong>on</strong>gly support spectra <str<strong>on</strong>g>based</str<strong>on</strong>g> surface extracti<strong>on</strong>.<br />
Apart from false positives, misclassificati<strong>on</strong>s in partial unmixing can occur when endmebers are<br />
mimicked by other spectra. ADAMS et al. (1995) report about soils, which are mimicking dry grasses<br />
not resolvable in TM data. This mimicking phenomen<strong>on</strong> also occurs for <str<strong>on</strong>g>coal</str<strong>on</strong>g> and shadow in n<strong>on</strong>transformed<br />
images. However, a temperature <str<strong>on</strong>g>based</str<strong>on</strong>g> post processing enabled to eliminate the shadow<br />
regi<strong>on</strong>s and therefore <strong>on</strong>ly “lose” <str<strong>on</strong>g>coal</str<strong>on</strong>g> surfaces, which are located directly in the shade.<br />
An additi<strong>on</strong>al fact, which influences the partial unmixing results and would also influence SMA<br />
results is that small amounts of a str<strong>on</strong>gly absorbing species dispersed in a weakly absorbing medium<br />
will have a disproporti<strong>on</strong>ably str<strong>on</strong>g effect <strong>on</strong> the spectrum of the mixture (GAFFEY et al. 1993). This<br />
applies for the material <str<strong>on</strong>g>coal</str<strong>on</strong>g>. This str<strong>on</strong>gly absorbing material will in all subpixel approaches be<br />
slightly overestimated. However, this problem does not have a str<strong>on</strong>g influence due to the threshold<br />
defined at 85% abundance. The validity of the assumpti<strong>on</strong> that <strong>spectral</strong> mixtures in a pixel are linear<br />
has already been discussed in chapter 3.8. Of course most processes in the real world are hardly ever<br />
linear and can <strong>on</strong>ly be approximated by linear or other defined mathematical (e.g. logarithmic, n-order<br />
polynomial etc.) assumpti<strong>on</strong>s. Also <strong>spectral</strong> mixtures in a pixel may better be approximated by n<strong>on</strong>linear<br />
processes. This makes the unmixing process very complex and would not allow for<br />
transferability. N<strong>on</strong> linear mixing is usually employed, when BRDF measurements are available, a<br />
small <strong>test</strong> site is investigated, or the distributi<strong>on</strong> of several materials existing within a pixel is stable<br />
over a larger area. N<strong>on</strong>-linear unmixing is by many authors c<strong>on</strong>sidered an approach not realistically<br />
applicable for larger <str<strong>on</strong>g>areas</str<strong>on</strong>g>, for transferable algorithms or for applicati<strong>on</strong>-oriented remote sensing<br />
projects. Furthermore, the cost benefit effect of increased processing and programming against the<br />
gain of subpixel unmixing accuracy is by many authors c<strong>on</strong>sidered too weak, to account for n<strong>on</strong>-linear<br />
EMR-surface interacti<strong>on</strong>s (see chapter 3.8.).<br />
With regard to the explicit results achieved here, it has to be questi<strong>on</strong>ed if the quantitative comparis<strong>on</strong><br />
of subpixel fracti<strong>on</strong> results and the thresholding of images to derive scene proporti<strong>on</strong>s <strong>on</strong> a<br />
multitemporal basis, is appropriate. Though the Landsat time series was radiometrically processed and<br />
adjusted with great care and spectra of pseudo-invariant objects were measured and available for a<br />
- 192 -
elative calibrati<strong>on</strong>, the scenes still showed n<strong>on</strong>-linear shifts within the different <strong>spectral</strong> bands. This<br />
could already be noticed in the results of signature analysis in chapter 7.<br />
In chapter 5 it was already dem<strong>on</strong>strated that even though radiometric correcti<strong>on</strong> was c<strong>on</strong>sidered good,<br />
illuminati<strong>on</strong> correcti<strong>on</strong> can not account for all shadowed <str<strong>on</strong>g>areas</str<strong>on</strong>g>. The quality of illuminati<strong>on</strong> correcti<strong>on</strong><br />
is not <strong>on</strong>ly dependent <strong>on</strong> the correcti<strong>on</strong> code applied, but also <strong>on</strong> the quality of the DEM,<br />
coregistrati<strong>on</strong> of scenes and other factors. Therefore, in satellite data of str<strong>on</strong>gly alpine terrain shaded<br />
<str<strong>on</strong>g>areas</str<strong>on</strong>g> will always remain. Especially for such str<strong>on</strong>gly alpine terrain like the Ruqigou / Gulaben area<br />
(>2500 m) the partial unmixing approach for a surface (<str<strong>on</strong>g>coal</str<strong>on</strong>g>) mimicking shadow cannot reach equal<br />
results as in flat terrain. Though producer’s accuracies for Wuda and Ruqigou do not differ<br />
substantially, it is assumed that users accuracies for Wuda are much higher. Even though the<br />
combinati<strong>on</strong> of partial unmixing and a temperature <str<strong>on</strong>g>based</str<strong>on</strong>g> post processing leads to sufficient results,<br />
the knowledge <str<strong>on</strong>g>based</str<strong>on</strong>g> approach seems to be the more applicable and robust method, also yielding<br />
results of higher accuracy. PMA implies a quantitative accuracy and stability of output (though<br />
subpixel fracti<strong>on</strong> compositi<strong>on</strong> is <strong>on</strong>ly computed in mixing space), which – in difficult terrain – has to<br />
be questi<strong>on</strong>ed.<br />
In medium complex terrain as for the Wuda study area or the Leigh Creek transfer regi<strong>on</strong>, the PMA<br />
approach yields very good results. Time series analysis can be presented without doubts. Especially<br />
when neglecting the steeply incised valley regi<strong>on</strong> east of the Yellow River (which actually can already<br />
be c<strong>on</strong>sidered as alpine terrain again) the extracti<strong>on</strong> of <str<strong>on</strong>g>coal</str<strong>on</strong>g> and also investigati<strong>on</strong>s of vegetati<strong>on</strong><br />
density is well in accordance with ground truth polyg<strong>on</strong>s. The weaker results of the comparis<strong>on</strong> of<br />
modeling results and mapped mixture grids have already been explained. It is assumed that especially<br />
the interactive mapping <str<strong>on</strong>g>based</str<strong>on</strong>g> <strong>on</strong> subpixel fracti<strong>on</strong> estimati<strong>on</strong> introduces a str<strong>on</strong>g error, which later<br />
hampers quantitative comparis<strong>on</strong> even though patterns look similar.<br />
The results of PMA for the extracti<strong>on</strong> of pyrometamorphically altered rock are not c<strong>on</strong>vincing in that<br />
respect that too many false pixels were extracted also. This is supported through the fact that<br />
pyrometamoph pixels (the ca. 5 100% <strong>on</strong>es, which exist) are not c<strong>on</strong>sidered extreme pixels by a PPI<br />
calculati<strong>on</strong> and similarities to other materials (in this case desert sand) are likely. Although – as for the<br />
knowledge <str<strong>on</strong>g>based</str<strong>on</strong>g> <strong>test</strong> sequence presented in chapter 8 – the PMA pyrometamorphic fracti<strong>on</strong> result<br />
shows very high fracti<strong>on</strong>s in the appropriate <str<strong>on</strong>g>areas</str<strong>on</strong>g>, such high fracti<strong>on</strong>s can also be found elsewhere.<br />
However – opposite to several studies – as presented in figure 9-14, pyrometamorphic <str<strong>on</strong>g>areas</str<strong>on</strong>g> can be<br />
extracted from multi<strong>spectral</strong> remote sensing data. This could be achieved with the knowledge <str<strong>on</strong>g>based</str<strong>on</strong>g> as<br />
well as with the PMA approach. They are both fully appropriate, if a known area is investigated within<br />
a highly interactive analysis. Nevertheless, for the automated extracti<strong>on</strong> of pyrometamorphic rock<br />
from multi<strong>spectral</strong> remote sensing data, partial unmixing is not c<strong>on</strong>sidered a good choice.<br />
Applying the prototype spectrum of <str<strong>on</strong>g>coal</str<strong>on</strong>g> to three regi<strong>on</strong>s in far distance of the well known study sites<br />
and particularly <strong>on</strong> other c<strong>on</strong>tinents and still retrieving extracti<strong>on</strong> accuracies for <str<strong>on</strong>g>coal</str<strong>on</strong>g> and vegetati<strong>on</strong> of<br />
86.87 %-91.55 % and 67.33 % and 89.03 % respectively allows for the following c<strong>on</strong>clusi<strong>on</strong>s. As l<strong>on</strong>g<br />
as scenes are thoroughly radiometrically preprocessed to at ground reflectance and LST prototype<br />
spectra build from a large number of standardized and averaged measurements a <strong>spectral</strong> library set up<br />
in <strong>on</strong>e regi<strong>on</strong> is – special surfaces requested – transferable to another regi<strong>on</strong>. A great advantage for<br />
this study was that <str<strong>on</strong>g>coal</str<strong>on</strong>g> does not vary as str<strong>on</strong>gly in its <strong>spectral</strong> behavior as do e.g. different plant<br />
species. The <str<strong>on</strong>g>coal</str<strong>on</strong>g>ificati<strong>on</strong> process is mostly similar all over the world and hard <str<strong>on</strong>g>coal</str<strong>on</strong>g> spectra – when<br />
- 193 -
esampled to ETM+ resoluti<strong>on</strong> – do not vary substantially unless heavily altered by weathering or<br />
burning.<br />
For the vegetati<strong>on</strong> fracti<strong>on</strong> no distinct unmixing to a certain plant species was required but <strong>on</strong>ly <str<strong>on</strong>g>areas</str<strong>on</strong>g><br />
of dense vegetati<strong>on</strong> cover had to be extracted. A prototype spectrum showing typical vegetati<strong>on</strong><br />
features like the low reflectance in the VIS with a peak in band 2 the str<strong>on</strong>g increase from red to NIR<br />
and the decrease from band 4 to 5 was sufficient to retrieve most densely vegetated pixels.<br />
Single scene PMA could have been slightly improved using MNF transformed data and spectra.<br />
Figure 9-26 presents an MNF color composite of MNF comp<strong>on</strong>ent 1-3 for the Wuda area as well as all<br />
6 MNF comp<strong>on</strong>ents to dem<strong>on</strong>strate the increasing noise level. Although a noise reducti<strong>on</strong> in 6-band<br />
ETM+ data is not of utmost importance MNF also leads to a better representati<strong>on</strong> of feature space.<br />
This partially simplifies the separati<strong>on</strong> of certain surface classes.<br />
b<br />
c<br />
d<br />
a<br />
N<br />
e<br />
f<br />
g<br />
Figure 9-26: MNF transformed data. Color coded comp<strong>on</strong>ents 1-3 (a) and comp<strong>on</strong>ents 1-6 (b-g) dem<strong>on</strong>strating<br />
the increase in noise level from comp<strong>on</strong>ent 1 to 6.<br />
Since MNF transformed PMA requires the applicati<strong>on</strong> of MNF transformed <strong>spectral</strong> libraries for each<br />
image, the MNF transformati<strong>on</strong> and inversi<strong>on</strong> prior to PMA was not c<strong>on</strong>sidered an opti<strong>on</strong> for a fully<br />
automatic extracti<strong>on</strong> chain. However, for individual scene processing the differentiati<strong>on</strong> of the two<br />
classes shadow and <str<strong>on</strong>g>coal</str<strong>on</strong>g> works better <strong>on</strong> MNF transformed data. When interactive processing is not a<br />
limitati<strong>on</strong> it is therefore recommended, to MNF transform the data, extract and MNF transformed<br />
image endmember from a locati<strong>on</strong> of known ground purity and to apply PMA afterwards.<br />
Compared to maximum likelihood approaches performed earlier in the project (KUENZER 2004b) the<br />
knowledge <str<strong>on</strong>g>based</str<strong>on</strong>g> as well as the PMA approach – <strong>on</strong>ce implemented – yielded faster results of equal or<br />
even better accuracy. In chapter 10 the comparis<strong>on</strong> of the two presented approaches for automated<br />
surface extracti<strong>on</strong> is addressed.<br />
- 194 -
10. Coal Fire (Risk) Area Demarcati<strong>on</strong> and Synergy with the Thermal<br />
Algorithm<br />
10.1. Demarcated Coal Fire Areas and Coal Fire Risk Areas<br />
The following 13 maps present the demarcated <str<strong>on</strong>g>coal</str<strong>on</strong>g> <str<strong>on</strong>g>fire</str<strong>on</strong>g> <str<strong>on</strong>g>areas</str<strong>on</strong>g> and <str<strong>on</strong>g>coal</str<strong>on</strong>g> <str<strong>on</strong>g>fire</str<strong>on</strong>g> <str<strong>on</strong>g>risk</str<strong>on</strong>g> <str<strong>on</strong>g>areas</str<strong>on</strong>g> retrieved from<br />
automated <str<strong>on</strong>g>coal</str<strong>on</strong>g> <str<strong>on</strong>g>fire</str<strong>on</strong>g> area demarcati<strong>on</strong>. The maps show recent and probable future <str<strong>on</strong>g>coal</str<strong>on</strong>g> <str<strong>on</strong>g>fire</str<strong>on</strong>g> <str<strong>on</strong>g>areas</str<strong>on</strong>g>, which<br />
should stay under a regular investigati<strong>on</strong> for:<br />
1. Wuda <str<strong>on</strong>g>coal</str<strong>on</strong>g> mining syncline area, 2002 (map 4)<br />
2. Regi<strong>on</strong> northeast of Wuda east of Yellow River, 2002, northern part (map5)<br />
3. Regi<strong>on</strong> east of Wuda east of Yellow River, 2002, middle part (map 6)<br />
4. Regi<strong>on</strong> southeast of Wuda east of Yellow River, 2002, southern part (map 7)<br />
5. Future <str<strong>on</strong>g>coal</str<strong>on</strong>g> <str<strong>on</strong>g>fire</str<strong>on</strong>g> <str<strong>on</strong>g>risk</str<strong>on</strong>g> area around Wuda, I, 2002 (map 8)<br />
6. Future <str<strong>on</strong>g>coal</str<strong>on</strong>g> <str<strong>on</strong>g>fire</str<strong>on</strong>g> <str<strong>on</strong>g>risk</str<strong>on</strong>g> area around Wuda, II, 2002 (map 9)<br />
7. Ruqigou / Gulaben <str<strong>on</strong>g>coal</str<strong>on</strong>g> mining area 2002 (map 10)<br />
8. Coal mining valleys of Hulusitai and Shitanjing, 2002 (map 11)<br />
9. Future <str<strong>on</strong>g>risk</str<strong>on</strong>g> <str<strong>on</strong>g>areas</str<strong>on</strong>g> around Ruqigou / Gulaben, 2002 (map 12)<br />
10. Leigh Creek area, southeast Australia (map 13)<br />
11. Baotou regi<strong>on</strong>, north central China (map 14)<br />
12. Jharia area, northeastern India (map 15)<br />
13. Rāy area, 100 km southwest of Jharia, northeastern India (map 16)<br />
The maps c<strong>on</strong>tain informati<strong>on</strong> <strong>on</strong> the setting of the regi<strong>on</strong> (<str<strong>on</strong>g>based</str<strong>on</strong>g> <strong>on</strong> the satellite data available),<br />
automatically extracted <str<strong>on</strong>g>coal</str<strong>on</strong>g> surfaces, automatically demarcated <str<strong>on</strong>g>coal</str<strong>on</strong>g> <str<strong>on</strong>g>fire</str<strong>on</strong>g> <str<strong>on</strong>g>risk</str<strong>on</strong>g> <str<strong>on</strong>g>areas</str<strong>on</strong>g> and automatically<br />
extracted pixels of pyrometamorphic rock. Furthermore, thermal anomalies detected by the thermal<br />
algorithm are superimposed <strong>on</strong> the maps. Thermal anomalies are differentiated for anomalies located<br />
within the demarcated <str<strong>on</strong>g>coal</str<strong>on</strong>g> <str<strong>on</strong>g>fire</str<strong>on</strong>g> area and anomalies outside these <str<strong>on</strong>g>areas</str<strong>on</strong>g>. All maps are presented in the<br />
UTM coordinate system. The maps designed for the Chinese regi<strong>on</strong>s will be supplied to the project<br />
partners and the local authorities in the provinces of Ningxia and Inner M<strong>on</strong>golia.<br />
In subchapter 10.2. the synergy of automated <str<strong>on</strong>g>coal</str<strong>on</strong>g> <str<strong>on</strong>g>fire</str<strong>on</strong>g> area- and <str<strong>on</strong>g>coal</str<strong>on</strong>g> <str<strong>on</strong>g>fire</str<strong>on</strong>g> <str<strong>on</strong>g>risk</str<strong>on</strong>g> area demarcati<strong>on</strong> and<br />
thermal anomaly extracti<strong>on</strong> as developed by ZHANG, J. (2004) is presented. Aspects of <str<strong>on</strong>g>coal</str<strong>on</strong>g> <str<strong>on</strong>g>fire</str<strong>on</strong>g> area<br />
demarcati<strong>on</strong>, not yet menti<strong>on</strong>ed within the methodic discussi<strong>on</strong> in chapters 8.4. and 9.3. are discussed.<br />
- 195 -
- 196 -
- 197 -
- 198 -
- 199 -
- 200 -
- 201 -
- 202 -
- 203 -
- 204 -
- 205 -
- 206 -
- 207 -
- 208 -
10.2. Synergy with the Thermal Algorithm<br />
The success of the combinati<strong>on</strong> of the multi<strong>spectral</strong> feature extracti<strong>on</strong> algorithms for <str<strong>on</strong>g>coal</str<strong>on</strong>g> <str<strong>on</strong>g>fire</str<strong>on</strong>g> area<br />
demarcati<strong>on</strong> presented here with the thermal anomaly extracti<strong>on</strong> algorithm developed by ZHANG, J.<br />
(2004) could be proven, when 6 new <str<strong>on</strong>g>coal</str<strong>on</strong>g> <str<strong>on</strong>g>fire</str<strong>on</strong>g>s could be detected from remote sensing data exclusively<br />
in 2003. They were validated in the field in September 2003. Furthermore, a sec<strong>on</strong>d formerly<br />
unknown and new <str<strong>on</strong>g>coal</str<strong>on</strong>g> <str<strong>on</strong>g>fire</str<strong>on</strong>g>, which was <strong>on</strong>ly suspected <str<strong>on</strong>g>based</str<strong>on</strong>g> <strong>on</strong> the informati<strong>on</strong> extracted from remote<br />
sensing data exclusively (3 thermal anomalies located within delineated <str<strong>on</strong>g>risk</str<strong>on</strong>g> area) could be verified in<br />
the regi<strong>on</strong> east of Wuda and east of the Yellow River during the field campaign in June 2004.<br />
The algorithm for automated thermal anomaly extracti<strong>on</strong> from the thermal bands uses raw satellite<br />
data (DN values) as input for sub-image statistical analysis. Within a moving window of varying size<br />
the histogram for these subsets of the scene are investigated c<strong>on</strong>cerning the occurrence of thermal<br />
anomalous pixels. Image histogram statistics of <str<strong>on</strong>g>coal</str<strong>on</strong>g> <str<strong>on</strong>g>fire</str<strong>on</strong>g>s were studied in very detail from different<br />
known <str<strong>on</strong>g>coal</str<strong>on</strong>g> <str<strong>on</strong>g>fire</str<strong>on</strong>g> <str<strong>on</strong>g>areas</str<strong>on</strong>g>. The average statistical “behavior” of <str<strong>on</strong>g>coal</str<strong>on</strong>g> <str<strong>on</strong>g>fire</str<strong>on</strong>g>s within thermal images was<br />
determined. Specific features within the subset histograms (first turning point after the main<br />
maximum) could be defined as thresholds allowing the separati<strong>on</strong> of thermally anomalous pixels from<br />
background pixels.<br />
Due to the c<strong>on</strong>cept of a moving window, each pixel within the scene is sampled several times.<br />
Depending <strong>on</strong> how often a pixel is regarded as thermally anomalous, it is declared as a thermal<br />
anomaly. The advantage of this approach is that c<strong>on</strong>trary to an overall threshold definiti<strong>on</strong> regi<strong>on</strong>al<br />
thermal anomalies will be extracted. The thermal anomalous pixels are then clustered <str<strong>on</strong>g>based</str<strong>on</strong>g> <strong>on</strong> an 8-<br />
neighbourhood. These thermal anomalous clusters are numbered and statistically investigated for their<br />
minimum-, maximum- and mean DN, their standard deviati<strong>on</strong>s and their spatial coverage. For<br />
example, <str<strong>on</strong>g>coal</str<strong>on</strong>g> <str<strong>on</strong>g>fire</str<strong>on</strong>g> <str<strong>on</strong>g>areas</str<strong>on</strong>g> do not exceed a certain size. If the algorithm picks out a thermally anomalous<br />
cluster of several square kilometers it is probably a sun illuminated slope. Warm water surfaces can be<br />
excluded <str<strong>on</strong>g>based</str<strong>on</strong>g> <strong>on</strong> the cluster’s temperature variance. While water surfaces show a very low<br />
temperature variance, <str<strong>on</strong>g>coal</str<strong>on</strong>g> <str<strong>on</strong>g>fire</str<strong>on</strong>g> clusters are characterized by high variances.<br />
This way, the final output image <strong>on</strong>ly c<strong>on</strong>tains thermal anomalies of small size, having a reas<strong>on</strong>able<br />
chance of being <str<strong>on</strong>g>coal</str<strong>on</strong>g> <str<strong>on</strong>g>fire</str<strong>on</strong>g>s. Nevertheless, automated statistical analysis of thermal anomalies also leads<br />
to the extracti<strong>on</strong> of anomalous pixels not related to <str<strong>on</strong>g>coal</str<strong>on</strong>g> <str<strong>on</strong>g>fire</str<strong>on</strong>g>s. These cannot necessarily be<br />
distinguished from a <str<strong>on</strong>g>coal</str<strong>on</strong>g> <str<strong>on</strong>g>fire</str<strong>on</strong>g> anomaly. Such anomalies are smaller sun illuminated surfaces, which<br />
pass the areal threshold menti<strong>on</strong>ed above, solar illuminati<strong>on</strong> effects of small extent even occurring in<br />
night time data, thermal anomalies resulting form the heating of houses, industry, the burning of<br />
agricultural fields or garbage, limest<strong>on</strong>e burning or even forest or grassland <str<strong>on</strong>g>fire</str<strong>on</strong>g>s. The demarcated <str<strong>on</strong>g>coal</str<strong>on</strong>g><br />
<str<strong>on</strong>g>fire</str<strong>on</strong>g> (<str<strong>on</strong>g>risk</str<strong>on</strong>g>) <str<strong>on</strong>g>areas</str<strong>on</strong>g> can serve as a spatial limitati<strong>on</strong> to exclude many of these thermal anomalies not<br />
stemming from <str<strong>on</strong>g>coal</str<strong>on</strong>g> <str<strong>on</strong>g>fire</str<strong>on</strong>g> influence.<br />
The combinati<strong>on</strong> of the informati<strong>on</strong> automatically extracted from multi<strong>spectral</strong> as well as thermal data<br />
can support the demarcati<strong>on</strong> of <str<strong>on</strong>g>areas</str<strong>on</strong>g> with a high potential for <str<strong>on</strong>g>coal</str<strong>on</strong>g> <str<strong>on</strong>g>fire</str<strong>on</strong>g> occurrence. Within a subset of<br />
Landsat-7 ETM+ scene path 129, row 33 of 21.09.2002 several <str<strong>on</strong>g>areas</str<strong>on</strong>g> for <str<strong>on</strong>g>coal</str<strong>on</strong>g> <str<strong>on</strong>g>fire</str<strong>on</strong>g> occurrence were<br />
extracted with the multi<strong>spectral</strong> approach. The northernmost area close to the city of Wuda hosts<br />
several <str<strong>on</strong>g>coal</str<strong>on</strong>g> <str<strong>on</strong>g>fire</str<strong>on</strong>g>s already well known. The same applies for the westernmost area Ruqigou / Gulaben.<br />
- 209 -
Both <str<strong>on</strong>g>areas</str<strong>on</strong>g> are well studied and also c<strong>on</strong>tain several well known <str<strong>on</strong>g>coal</str<strong>on</strong>g> <str<strong>on</strong>g>fire</str<strong>on</strong>g>s. Areas never investigated so<br />
far are the north south striking <str<strong>on</strong>g>coal</str<strong>on</strong>g> outcrops east of the Yellow River and the <str<strong>on</strong>g>coal</str<strong>on</strong>g> outcrops in the two<br />
valleys of Hulusitai and Shitanjing. These valleys run parallel to each other from Northwest to<br />
Southeast, approximately 50km southwest of Wuda. The demarcated <str<strong>on</strong>g>coal</str<strong>on</strong>g> <str<strong>on</strong>g>fire</str<strong>on</strong>g> <str<strong>on</strong>g>risk</str<strong>on</strong>g> <str<strong>on</strong>g>areas</str<strong>on</strong>g> c<strong>on</strong>tain<br />
several thermal anomalies. Such <str<strong>on</strong>g>areas</str<strong>on</strong>g>, where some thermal anomalies were located within the<br />
automatically extracted <str<strong>on</strong>g>coal</str<strong>on</strong>g> <str<strong>on</strong>g>fire</str<strong>on</strong>g> (<str<strong>on</strong>g>risk</str<strong>on</strong>g>) <str<strong>on</strong>g>areas</str<strong>on</strong>g>, were checked during the recent field campaigns in 2003<br />
and 2004.<br />
On September 13 th 2003 a field trip was organized to the very remote area shown in figure 10-1. The<br />
<str<strong>on</strong>g>coal</str<strong>on</strong>g> <str<strong>on</strong>g>fire</str<strong>on</strong>g> fighting team of Wuda, joining <strong>on</strong> the survey, did not know about the area visited beforehand,<br />
nor did they have any informati<strong>on</strong> <strong>on</strong> possible <str<strong>on</strong>g>coal</str<strong>on</strong>g> <str<strong>on</strong>g>fire</str<strong>on</strong>g>s in that regi<strong>on</strong>. Once arrived in the area, which<br />
is very sparsely settled and <strong>on</strong>ly accessible via dirt roads, informati<strong>on</strong> from the local inhabitants<br />
reveiled that the regi<strong>on</strong> <strong>on</strong>ce was a prospering <str<strong>on</strong>g>coal</str<strong>on</strong>g> mining area. However, producti<strong>on</strong> has decreased<br />
drastically due to financial problems. With the help of GPS, the thermal anomalies, extracted from the<br />
satellite data were located within an area of very rugged terrain of former <str<strong>on</strong>g>coal</str<strong>on</strong>g> waste piles, aband<strong>on</strong>ed<br />
mines and heavily disturbed <str<strong>on</strong>g>coal</str<strong>on</strong>g> outcrops. Five of the thermal anomalies proved to be <str<strong>on</strong>g>coal</str<strong>on</strong>g> <str<strong>on</strong>g>fire</str<strong>on</strong>g>s in an<br />
actual <str<strong>on</strong>g>coal</str<strong>on</strong>g> seam, while the other anomalies resulted from <str<strong>on</strong>g>fire</str<strong>on</strong>g>s in a <str<strong>on</strong>g>coal</str<strong>on</strong>g> waste pile. Therefore, all six<br />
anomalies could be verified as <str<strong>on</strong>g>coal</str<strong>on</strong>g> <str<strong>on</strong>g>fire</str<strong>on</strong>g> anomalies. In this <str<strong>on</strong>g>coal</str<strong>on</strong>g> <str<strong>on</strong>g>fire</str<strong>on</strong>g> area, the <str<strong>on</strong>g>fire</str<strong>on</strong>g> temperatures ranged<br />
from 170 to 340 ºC.<br />
No <str<strong>on</strong>g>coal</str<strong>on</strong>g> <str<strong>on</strong>g>fire</str<strong>on</strong>g>s<br />
No <str<strong>on</strong>g>coal</str<strong>on</strong>g> <str<strong>on</strong>g>fire</str<strong>on</strong>g><br />
Storage<br />
pile <str<strong>on</strong>g>fire</str<strong>on</strong>g>s<br />
Subsurface<br />
<str<strong>on</strong>g>coal</str<strong>on</strong>g> <str<strong>on</strong>g>fire</str<strong>on</strong>g>s<br />
Industry<br />
Solar<br />
effect<br />
no <str<strong>on</strong>g>coal</str<strong>on</strong>g><br />
<str<strong>on</strong>g>fire</str<strong>on</strong>g><br />
N<br />
Figure 10-1: Newly detected <str<strong>on</strong>g>coal</str<strong>on</strong>g> <str<strong>on</strong>g>fire</str<strong>on</strong>g>s <str<strong>on</strong>g>based</str<strong>on</strong>g> <strong>on</strong> <str<strong>on</strong>g>coal</str<strong>on</strong>g> <str<strong>on</strong>g>fire</str<strong>on</strong>g> (<str<strong>on</strong>g>risk</str<strong>on</strong>g>) area demarcati<strong>on</strong> and thermal anomaly<br />
detecti<strong>on</strong> in two parallel valleys 50 km southwest of Wuda. The <str<strong>on</strong>g>coal</str<strong>on</strong>g> <str<strong>on</strong>g>fire</str<strong>on</strong>g>s were not known outside the local<br />
community beforehand. Extracted <str<strong>on</strong>g>coal</str<strong>on</strong>g> is displayed as a superimposed vector layer in light blue, thermal<br />
anomalies in yellow (located within the demarcated area), and green (located outside the demarcated area),<br />
demarcated <str<strong>on</strong>g>coal</str<strong>on</strong>g> <str<strong>on</strong>g>fire</str<strong>on</strong>g> (<str<strong>on</strong>g>risk</str<strong>on</strong>g>) <str<strong>on</strong>g>areas</str<strong>on</strong>g> in red, center coordinate: 611355E, 4342156N, UTM, Z48N.<br />
- 210 -
On June 18 th 2004 a field trip was undertaken to the eastern side of the Yellow River, approximately<br />
25 km southeast of Wuda. Based <strong>on</strong> remote sensing data analysis exclusively, also this area showed<br />
indicati<strong>on</strong> to host at least <strong>on</strong>e <str<strong>on</strong>g>coal</str<strong>on</strong>g> <str<strong>on</strong>g>fire</str<strong>on</strong>g>. The thermal anomalies extracted and located within the<br />
demarcated <str<strong>on</strong>g>coal</str<strong>on</strong>g> <str<strong>on</strong>g>fire</str<strong>on</strong>g> <str<strong>on</strong>g>areas</str<strong>on</strong>g> proved to be an underground <str<strong>on</strong>g>coal</str<strong>on</strong>g> seam <str<strong>on</strong>g>fire</str<strong>on</strong>g> the direct local inhabitants new<br />
about. However, it was unknown to the authorities of Wuda and Wuhai city (SUN, Y. 2004).<br />
According to a local worker the <str<strong>on</strong>g>fire</str<strong>on</strong>g> had developed in wild private <str<strong>on</strong>g>coal</str<strong>on</strong>g> mines, which were aband<strong>on</strong>ed<br />
and improperly sealed. Though the local people tried to seal these mines with sand and loess just<br />
recently, it is difficult to c<strong>on</strong>trol the <str<strong>on</strong>g>fire</str<strong>on</strong>g>, which now has been burning for 2 years and is spreading<br />
rapidly.<br />
Solar<br />
effect<br />
Industry<br />
Industry<br />
Storage<br />
pile <str<strong>on</strong>g>fire</str<strong>on</strong>g>s<br />
Subsurface<br />
<str<strong>on</strong>g>coal</str<strong>on</strong>g> <str<strong>on</strong>g>fire</str<strong>on</strong>g>s<br />
Limest<strong>on</strong>e<br />
burning<br />
Limest<strong>on</strong>e<br />
burning<br />
N<br />
Figure 10-2: Newly detected coa l<str<strong>on</strong>g>fire</str<strong>on</strong>g>s <str<strong>on</strong>g>based</str<strong>on</strong>g> <strong>on</strong> <str<strong>on</strong>g>coal</str<strong>on</strong>g> <str<strong>on</strong>g>fire</str<strong>on</strong>g> (<str<strong>on</strong>g>risk</str<strong>on</strong>g>) area demarcati<strong>on</strong> and thermal anomaly<br />
detecti<strong>on</strong> 25 km southeast of Wuda. The <str<strong>on</strong>g>coal</str<strong>on</strong>g> <str<strong>on</strong>g>fire</str<strong>on</strong>g>s were not known except to few local inhabitants. Extracted<br />
<str<strong>on</strong>g>coal</str<strong>on</strong>g> is displayed as a superimposed polyg<strong>on</strong> vector layer in light blue, thermal anomalies in yellow (inside the<br />
demarcated area) and green (outside the demarcated area), the demarcated <str<strong>on</strong>g>coal</str<strong>on</strong>g> <str<strong>on</strong>g>fire</str<strong>on</strong>g> (<str<strong>on</strong>g>risk</str<strong>on</strong>g>) <str<strong>on</strong>g>areas</str<strong>on</strong>g> are<br />
superimposed in red. Center coordinate:669169E, 4365414N, UTM, Z48N<br />
In the area presented above active mining is still <strong>on</strong>going. Coal <str<strong>on</strong>g>fire</str<strong>on</strong>g> fighting is undertaken, trying to<br />
separate the burning part of the <str<strong>on</strong>g>coal</str<strong>on</strong>g> seam from the unaffected part through a trench. However, to date<br />
the <str<strong>on</strong>g>fire</str<strong>on</strong>g> is not under c<strong>on</strong>trol and spreads al<strong>on</strong>g dip and strike directi<strong>on</strong>. According to Sun, Y. (2004)<br />
without the remote sensing analysis the <str<strong>on</strong>g>coal</str<strong>on</strong>g> <str<strong>on</strong>g>fire</str<strong>on</strong>g> would have remained unknown to any<strong>on</strong>e but the<br />
local workers. In the c<strong>on</strong>text of <str<strong>on</strong>g>coal</str<strong>on</strong>g> <str<strong>on</strong>g>fire</str<strong>on</strong>g> extinguishing acti<strong>on</strong>s planned for the broader Wuda area in<br />
the following year, this area can at least be included into extinguishing strategies. Figures 10-3 a and b<br />
illustrate the situati<strong>on</strong> in this area. The eastern side of the Yellow River east of Wuda is c<strong>on</strong>sidered as<br />
an area very pr<strong>on</strong>e to <str<strong>on</strong>g>coal</str<strong>on</strong>g> <str<strong>on</strong>g>fire</str<strong>on</strong>g>s. It is expected that more <str<strong>on</strong>g>coal</str<strong>on</strong>g> <str<strong>on</strong>g>fire</str<strong>on</strong>g>s will spread within the wild mining<br />
operati<strong>on</strong>s in the future.<br />
- 211 -
<str<strong>on</strong>g>coal</str<strong>on</strong>g> <str<strong>on</strong>g>fire</str<strong>on</strong>g> exhaust<br />
former wild mines,<br />
improperly sealed<br />
Covering<br />
of <str<strong>on</strong>g>fire</str<strong>on</strong>g><br />
burning<br />
seam<br />
trench<br />
a<br />
b<br />
trench<br />
Figure 10-3 a,b: Newly detected <str<strong>on</strong>g>coal</str<strong>on</strong>g> <str<strong>on</strong>g>fire</str<strong>on</strong>g>s <str<strong>on</strong>g>based</str<strong>on</strong>g> <strong>on</strong> <str<strong>on</strong>g>coal</str<strong>on</strong>g> <str<strong>on</strong>g>fire</str<strong>on</strong>g> (<str<strong>on</strong>g>risk</str<strong>on</strong>g>) area demarcati<strong>on</strong> and thermal anomaly<br />
detecti<strong>on</strong> 25 km southeast of Wuda. Note the <str<strong>on</strong>g>coal</str<strong>on</strong>g> <str<strong>on</strong>g>fire</str<strong>on</strong>g> related smoke in figure 10-3 a and the improperly sealed<br />
former private mines in figure 10-3 b. The trench is excavated to prevent the spreading of the <str<strong>on</strong>g>fire</str<strong>on</strong>g>. Photos: a: C.<br />
KUENZER. b: J. ZHANG, June 2004<br />
To quantify the synergetic effects of the thermal anomaly detecti<strong>on</strong> algorithm and the <str<strong>on</strong>g>coal</str<strong>on</strong>g> <str<strong>on</strong>g>fire</str<strong>on</strong>g> (<str<strong>on</strong>g>risk</str<strong>on</strong>g>)<br />
area demarcati<strong>on</strong> algorithm, it is investigated, how many false alarm anomalies can be rejected<br />
through <str<strong>on</strong>g>coal</str<strong>on</strong>g> <str<strong>on</strong>g>fire</str<strong>on</strong>g> (<str<strong>on</strong>g>risk</str<strong>on</strong>g>) area demarcati<strong>on</strong>.<br />
Table 10-1: Coal <str<strong>on</strong>g>fire</str<strong>on</strong>g> area demarcati<strong>on</strong> supporting the exclusi<strong>on</strong> of false alarms: knowledge <str<strong>on</strong>g>based</str<strong>on</strong>g> demarcati<strong>on</strong><br />
Anomalies in #<br />
pixels extracted by<br />
thermal algorithm<br />
Anomalies in #<br />
pixels rejected by<br />
<str<strong>on</strong>g>coal</str<strong>on</strong>g> <str<strong>on</strong>g>fire</str<strong>on</strong>g> <str<strong>on</strong>g>risk</str<strong>on</strong>g> area<br />
algorithm<br />
Anomalous area<br />
before <str<strong>on</strong>g>coal</str<strong>on</strong>g> <str<strong>on</strong>g>fire</str<strong>on</strong>g><br />
area demarcati<strong>on</strong><br />
[km²]<br />
Anomalous area<br />
after <str<strong>on</strong>g>coal</str<strong>on</strong>g> <str<strong>on</strong>g>fire</str<strong>on</strong>g> area<br />
demarcati<strong>on</strong><br />
[km²]<br />
226 / 211<br />
ETM+ night<br />
28.09.2002<br />
129 / 033<br />
ETM+ day<br />
21.09.2002<br />
129 / 033<br />
ETM+ day<br />
20.09.1987<br />
140 / 044<br />
ETM+ day<br />
02.11.2001<br />
128 / 032<br />
ETM+ day<br />
21.08.2002<br />
098 / 081<br />
ETM+ day<br />
15.11.2002<br />
451<br />
10,911<br />
9,817<br />
243 (500m)<br />
211 (1000m)<br />
9449 (500m)<br />
8884 (1000m)<br />
9,078 (500m)<br />
8593 (1000m)<br />
14.49<br />
61.46<br />
100.41<br />
6.77 (500m)<br />
7.54 (1000m)<br />
10.77 (500m)<br />
13.22 (1000m)<br />
8.48 (500m)<br />
11.22 (1000m)<br />
6,067 4533 (500m) 42.84 14.92 (500m)<br />
15,653 15036 (500m) 83.90 3.90 (500m)<br />
1334 1300 (500 m) 7.25 0.14 (500 m)<br />
- 212 -
Table 10-1 and table 10-2 dem<strong>on</strong>strate how many pixels were extracted as thermally anomalous from<br />
ETM+ nighttime and daytime data, how many of these thermally anomalous pixels were located<br />
outside the demarcated <str<strong>on</strong>g>coal</str<strong>on</strong>g> <str<strong>on</strong>g>fire</str<strong>on</strong>g> (<str<strong>on</strong>g>risk</str<strong>on</strong>g>) <str<strong>on</strong>g>areas</str<strong>on</strong>g> and how large the overall <str<strong>on</strong>g>coal</str<strong>on</strong>g> <str<strong>on</strong>g>fire</str<strong>on</strong>g> <str<strong>on</strong>g>risk</str<strong>on</strong>g> area is with regard<br />
to the size of the full original scene. While table 10-1 focuses <strong>on</strong> the improvement of thermal outputs<br />
applying the knowledge <str<strong>on</strong>g>based</str<strong>on</strong>g> <strong>spectral</strong> <strong>test</strong> sequence for <str<strong>on</strong>g>coal</str<strong>on</strong>g> <str<strong>on</strong>g>fire</str<strong>on</strong>g> area demarcati<strong>on</strong>, table 10-2 presents<br />
the results achieved with PMA analyses and demarcati<strong>on</strong>.<br />
The thermal algorithm was applied <strong>on</strong> the nighttime scene of September 28 th 2002. 451 thermal<br />
anomalies were extracted for this scene and the overall thermal anomalous area covers 14.49 km².<br />
Applying the knowledge <str<strong>on</strong>g>based</str<strong>on</strong>g> <str<strong>on</strong>g>coal</str<strong>on</strong>g> <str<strong>on</strong>g>fire</str<strong>on</strong>g> demarcati<strong>on</strong> algorithm presented in this thesis (chapter 8),<br />
with a 500 m delineati<strong>on</strong> radius 243 of the 451 thermal anomalous clusters are rejected as probable<br />
<str<strong>on</strong>g>coal</str<strong>on</strong>g> <str<strong>on</strong>g>fire</str<strong>on</strong>g> anomalies, while 208 clusters remain. With a delineati<strong>on</strong> radius of 1000m 211 anomalies are<br />
rejected The spatial coverage of remaining <str<strong>on</strong>g>coal</str<strong>on</strong>g> <str<strong>on</strong>g>fire</str<strong>on</strong>g> related anomalies is 6.77 km² and 7.56 km²<br />
respectively. The number and area of thermal anomalies regarded as probable <str<strong>on</strong>g>coal</str<strong>on</strong>g> <str<strong>on</strong>g>fire</str<strong>on</strong>g> related<br />
anomalies by the algorithm of ZHANG (2004) can be reduced for about 50 % by the knowledge <str<strong>on</strong>g>based</str<strong>on</strong>g><br />
<str<strong>on</strong>g>coal</str<strong>on</strong>g> <str<strong>on</strong>g>fire</str<strong>on</strong>g> area demarcati<strong>on</strong> algorithm.<br />
In the daytime scene covering Wuda and Ruqigou (129/033 from 21.09.2002) 10911 anomalies were<br />
extracted by the thermal algorithm. Coal <str<strong>on</strong>g>fire</str<strong>on</strong>g> <str<strong>on</strong>g>risk</str<strong>on</strong>g> area demarcati<strong>on</strong> with a delineati<strong>on</strong> radius of 500m<br />
rejects 9449 of these anomalies. With a 1000m radius 8884 anomalies are rejected. The area<br />
c<strong>on</strong>sidered as <str<strong>on</strong>g>coal</str<strong>on</strong>g> <str<strong>on</strong>g>fire</str<strong>on</strong>g> related anomalies can therefore be reduced from 61.46km² to 10.77km² (500m)<br />
and 13.22 (1000m) respectively. Between 87% and 81% (500m, 1000m) of the anomalies can be<br />
rejected. The thermal anomalous area is reduced for 83%.<br />
From the daytime scene 129/33 covering Wuda and Ruqigou acquired <strong>on</strong> 20.09.1987 a total of 9817<br />
thermal anomalies was detected. 9078 of these anomalies can be rejected when <str<strong>on</strong>g>coal</str<strong>on</strong>g> <str<strong>on</strong>g>fire</str<strong>on</strong>g> area<br />
demarcati<strong>on</strong> is performed with a 500 m delineati<strong>on</strong> radius. 8593 anomalies are c<strong>on</strong>sidered false alarms<br />
if a 1000 m radius is applied. The thermal anomalous area can be reduced from over 100 km² to<br />
8.48 km² and 11.22 km² respectively. Thus over 90 % of the thermal anomalies do not need to be<br />
observed with regard to <str<strong>on</strong>g>coal</str<strong>on</strong>g> <str<strong>on</strong>g>fire</str<strong>on</strong>g> analyses.<br />
From the daytime scene from India 6067 thermally anomalous clusters were extracted applying the<br />
thermal algorithm. 4433 anomalies are rejected by the <str<strong>on</strong>g>coal</str<strong>on</strong>g> <str<strong>on</strong>g>fire</str<strong>on</strong>g> area demarcati<strong>on</strong> algorithm. The<br />
thermally anomalous area is reduced from 42.84 km² to 14.92 km². This equals a reducti<strong>on</strong> in<br />
anomalies for 70 % and a reducti<strong>on</strong> of the thermal anomalous area for 65 %.<br />
In the daytime scene of Baotou 15653 thermal anomalies were extracted as probable <str<strong>on</strong>g>coal</str<strong>on</strong>g> <str<strong>on</strong>g>fire</str<strong>on</strong>g><br />
anomalies. The overall thermal anomalous area the algorithm c<strong>on</strong>siders as <str<strong>on</strong>g>coal</str<strong>on</strong>g> <str<strong>on</strong>g>fire</str<strong>on</strong>g> anomalies is 83.9<br />
km². 15036 of the 15653 anomalies are rejected by <str<strong>on</strong>g>coal</str<strong>on</strong>g> <str<strong>on</strong>g>fire</str<strong>on</strong>g> area demarcati<strong>on</strong>. The thermally<br />
anomalous area is reduced from 83.90km² to 3.09km².<br />
For the scene from Australia thermal anomalies 1334 were extracted fo which 1300 were rejected. The<br />
thermal anomalous area within the demarcated <str<strong>on</strong>g>coal</str<strong>on</strong>g> <str<strong>on</strong>g>fire</str<strong>on</strong>g> <str<strong>on</strong>g>risk</str<strong>on</strong>g> area z<strong>on</strong>e cover 0.14km².<br />
- 213 -
Table 10-2: Coal <str<strong>on</strong>g>fire</str<strong>on</strong>g> area demarcati<strong>on</strong> supporting the exclusi<strong>on</strong> of false alarms: PMA <str<strong>on</strong>g>based</str<strong>on</strong>g> demarcati<strong>on</strong><br />
Anomalies in #<br />
pixels extracted by<br />
thermal algorithm<br />
Anomalies in #<br />
pixels rejected by<br />
<str<strong>on</strong>g>coal</str<strong>on</strong>g> <str<strong>on</strong>g>fire</str<strong>on</strong>g> <str<strong>on</strong>g>risk</str<strong>on</strong>g> area<br />
algorithm<br />
Anomalous area<br />
before <str<strong>on</strong>g>coal</str<strong>on</strong>g> <str<strong>on</strong>g>fire</str<strong>on</strong>g><br />
area demarcati<strong>on</strong><br />
[km²]<br />
Anomalous area<br />
after <str<strong>on</strong>g>coal</str<strong>on</strong>g> <str<strong>on</strong>g>fire</str<strong>on</strong>g> area<br />
demarcati<strong>on</strong><br />
[km²]<br />
226 / 211<br />
ETM+ night<br />
28.09.2002<br />
129 / 033<br />
ETM+ day<br />
21.09.2002<br />
129 / 033<br />
ETM+ day<br />
20.09.1987<br />
140 / 044<br />
ETM+ day<br />
02.11.2001<br />
128 / 032<br />
ETM+ day<br />
21.08.2002<br />
098 / 081<br />
ETM+ day<br />
15.11.2002<br />
451<br />
10,911<br />
9,817<br />
254 (500 m)<br />
225 (1000 m)<br />
9888 (500 m)<br />
9569 (1000 m)<br />
9353 (500 m)<br />
9034 (1000 m)<br />
14.49<br />
61.46<br />
100.41<br />
7.09 (500m)<br />
8.28 (1000m)<br />
8.61 (500 m)<br />
10.09 (1000 m)<br />
7.50 (500 m)<br />
9.29 (1000 m)<br />
6,067 4834 (500 m) 42.84 7.12 (500 m)<br />
15,653 8380 (500 m) 83.90 42.80 (500 m)<br />
1334 1296 (500m) 7.25 0.16 (500m)<br />
Applying the PMA <str<strong>on</strong>g>based</str<strong>on</strong>g> <str<strong>on</strong>g>coal</str<strong>on</strong>g> <str<strong>on</strong>g>fire</str<strong>on</strong>g> demarcati<strong>on</strong> algorithm presented in this thesis (chapter 9), 254<br />
(500 m) and 225 (1000 m) of the 451 thermal anomalous clusters from the 129/33 nighttime scene are<br />
rejected as probable <str<strong>on</strong>g>coal</str<strong>on</strong>g> <str<strong>on</strong>g>fire</str<strong>on</strong>g> anomalies. The spatial coverage of <str<strong>on</strong>g>coal</str<strong>on</strong>g> <str<strong>on</strong>g>fire</str<strong>on</strong>g> related anomalies is reduced<br />
from 14.49 km² to 7.09 km² and 8.28 km² respectively. As for the knowledge <str<strong>on</strong>g>based</str<strong>on</strong>g> algorithm, this<br />
reduces the number of anomalies and their spatial extent for about 50%.<br />
For the daytime scene covering Wuda and Ruqigou (129/033 from 21.09.2002) with PMA <str<strong>on</strong>g>based</str<strong>on</strong>g><br />
demarcati<strong>on</strong> a reducti<strong>on</strong> of anomalies exceeding 80% is achieved. This coincides well with the results<br />
from knowledge <str<strong>on</strong>g>based</str<strong>on</strong>g> <str<strong>on</strong>g>coal</str<strong>on</strong>g> <str<strong>on</strong>g>fire</str<strong>on</strong>g> area demarcati<strong>on</strong>.<br />
In the daytime scene covering Wuda and Ruqigou (129/033) <strong>on</strong> 20.09.1987 overall 9817 anomalous<br />
clusters are extracted. They can be reduced for over 90 % applying <str<strong>on</strong>g>coal</str<strong>on</strong>g> <str<strong>on</strong>g>fire</str<strong>on</strong>g> area demarcati<strong>on</strong>. The<br />
thermally anomalous area to investigate decreases from over 100 km² to 7.5 km² and 9.29 km²<br />
respectively – depending <strong>on</strong> the delineati<strong>on</strong> radius.<br />
For the scene from India 4838 of the 6067 anomalies can be rejected as <str<strong>on</strong>g>coal</str<strong>on</strong>g> <str<strong>on</strong>g>fire</str<strong>on</strong>g> related thermal<br />
anomalies. The thermally anomalous area to be investigated is covers 7.12 km². A reducti<strong>on</strong> for over<br />
80% could thus be achieved.<br />
For the scene from Baotou with a 500 m delineati<strong>on</strong> radius 8380 of the 15653 extracted thermal<br />
anomalies from daytimes data can be rejected with PMA <str<strong>on</strong>g>based</str<strong>on</strong>g> <str<strong>on</strong>g>coal</str<strong>on</strong>g> <str<strong>on</strong>g>fire</str<strong>on</strong>g> area demarcati<strong>on</strong>. The<br />
- 214 -
thermally anomalous area to be investigated is thus reduced from 83.90 km² to 42.80 km². This equals<br />
an reducti<strong>on</strong> of approximately 50%. This reducti<strong>on</strong> is lower compared to other daytime data sets,<br />
where a reducti<strong>on</strong> of 90% can be achieved. It can be explained with the fact that for the scene of<br />
Baotou next to <str<strong>on</strong>g>coal</str<strong>on</strong>g> some other surfaces – like dark asphalt – were extracted also. The delineati<strong>on</strong> z<strong>on</strong>e<br />
is very large. Thus, <strong>on</strong>ly a smaller percentage of the thermal anomalies is rejected.<br />
For the scene covering the Leigh Creek <str<strong>on</strong>g>coal</str<strong>on</strong>g> mining area in Australia 1334 themal anomalous clusters<br />
were extracted from the daytime thermal band. Over 90% of these anomalies can be rejected and the<br />
remaining thermal anomalous area covers <strong>on</strong>ly 0.16 km² compared to 7.25 km² before demarcati<strong>on</strong>.<br />
Figure 10-4 dem<strong>on</strong>strated the rejecti<strong>on</strong> of thermal anomalies with the knowledge <str<strong>on</strong>g>based</str<strong>on</strong>g> approach and<br />
the PMA approach. Except for the scene from Baotou the PMA <str<strong>on</strong>g>based</str<strong>on</strong>g> approach leads to the rejecti<strong>on</strong><br />
of equal (nighttime scene and scene of Australia) or more pixels, than the knowledge <str<strong>on</strong>g>based</str<strong>on</strong>g> approach.<br />
The delineated area resulting from the PMA <str<strong>on</strong>g>based</str<strong>on</strong>g> approach is thus <strong>on</strong> average slightly smaller than<br />
the demarcated <str<strong>on</strong>g>coal</str<strong>on</strong>g> <str<strong>on</strong>g>fire</str<strong>on</strong>g> (<str<strong>on</strong>g>risk</str<strong>on</strong>g>) <str<strong>on</strong>g>areas</str<strong>on</strong>g> defined with the knowledge <str<strong>on</strong>g>based</str<strong>on</strong>g> <strong>test</strong> sequence. However –<br />
except for the scene of Baotou – both methods yield results much alike dem<strong>on</strong>strating the<br />
comparability of output results.<br />
Figure 10-4 : Thermal anomalies in numbers of pixels extracted (orange), anomalies rejected by the knowledge<br />
<str<strong>on</strong>g>based</str<strong>on</strong>g> <str<strong>on</strong>g>coal</str<strong>on</strong>g> <str<strong>on</strong>g>fire</str<strong>on</strong>g> area demarcati<strong>on</strong> (dark grey) and anomalies rejected by PMA <str<strong>on</strong>g>based</str<strong>on</strong>g> <str<strong>on</strong>g>coal</str<strong>on</strong>g> <str<strong>on</strong>g>fire</str<strong>on</strong>g> area demarcati<strong>on</strong><br />
(light grey). Exemplarily presented for six satellite scenes. Displayed are a nighttime and daytime scene from<br />
2002 of the two main study <str<strong>on</strong>g>areas</str<strong>on</strong>g>, a scene of these <str<strong>on</strong>g>areas</str<strong>on</strong>g> for 1987 and scenes for the three transfer <str<strong>on</strong>g>areas</str<strong>on</strong>g> in<br />
India, Baotou and Australia.<br />
In nighttime data the thermal algorithm extracts a substantially lower number of thermal anomalies<br />
than in daytime data. The nighttime and daytime scene of 2002 were acquired with <strong>on</strong>ly <strong>on</strong>e week<br />
time difference. Effects of uneven solar heating due to aspect and slope and especially uneven heating<br />
of surfaces due to their albedo and emissivity lead to the extracti<strong>on</strong> of many false alarms.<br />
The false alarm reducti<strong>on</strong> capability presented in table 10-1 and 10-2 and figure 10-4 as well as the<br />
discovery of formerly unknown <str<strong>on</strong>g>coal</str<strong>on</strong>g> <str<strong>on</strong>g>fire</str<strong>on</strong>g>s from remote sensing data exclusively shows the powerful<br />
capabilities of the combined approach of <str<strong>on</strong>g>coal</str<strong>on</strong>g> <str<strong>on</strong>g>fire</str<strong>on</strong>g> area demarcati<strong>on</strong> and thermal anomaly detecti<strong>on</strong>.<br />
This encourages the goal, aimed at within the project, to set up a detecti<strong>on</strong>- and m<strong>on</strong>itoring system for<br />
<str<strong>on</strong>g>coal</str<strong>on</strong>g> <str<strong>on</strong>g>fire</str<strong>on</strong>g>s in larger <str<strong>on</strong>g>areas</str<strong>on</strong>g> of northern China. Furthermore, automated <str<strong>on</strong>g>coal</str<strong>on</strong>g> <str<strong>on</strong>g>fire</str<strong>on</strong>g> area demarcati<strong>on</strong> shows<br />
a great potential to highlight possible <str<strong>on</strong>g>coal</str<strong>on</strong>g> <str<strong>on</strong>g>fire</str<strong>on</strong>g> <str<strong>on</strong>g>risk</str<strong>on</strong>g> <str<strong>on</strong>g>areas</str<strong>on</strong>g>, not yet showing a thermal expressi<strong>on</strong>.<br />
- 215 -
10.3. Discussi<strong>on</strong><br />
The demarcated <str<strong>on</strong>g>coal</str<strong>on</strong>g> <str<strong>on</strong>g>fire</str<strong>on</strong>g> (<str<strong>on</strong>g>risk</str<strong>on</strong>g>) <str<strong>on</strong>g>areas</str<strong>on</strong>g> presented in maps 4 to 16 serve several purposes. They help the<br />
local people and mining authorities to get a regi<strong>on</strong>al overview over existing and probable <str<strong>on</strong>g>coal</str<strong>on</strong>g> <str<strong>on</strong>g>fire</str<strong>on</strong>g> <str<strong>on</strong>g>risk</str<strong>on</strong>g><br />
<str<strong>on</strong>g>areas</str<strong>on</strong>g> within their municipalities. A ground survey check of present <str<strong>on</strong>g>coal</str<strong>on</strong>g> <str<strong>on</strong>g>fire</str<strong>on</strong>g> <str<strong>on</strong>g>areas</str<strong>on</strong>g> demarcated and<br />
presented in the maps <strong>on</strong> a regular timely basis can support the early detecti<strong>on</strong> of new <str<strong>on</strong>g>fire</str<strong>on</strong>g>s in the<br />
adjacency of the existing <strong>on</strong>es. Furthermore the dynamics of the <str<strong>on</strong>g>fire</str<strong>on</strong>g>s can be observed with the thermal<br />
algorithm. The algorithms can not help to m<strong>on</strong>itor very small spatial changes of <str<strong>on</strong>g>coal</str<strong>on</strong>g> <str<strong>on</strong>g>fire</str<strong>on</strong>g>s, but the<br />
extincti<strong>on</strong> of a <str<strong>on</strong>g>fire</str<strong>on</strong>g> or the rapid growth of a <str<strong>on</strong>g>fire</str<strong>on</strong>g> can be detected.<br />
Furthermore, the multi<strong>spectral</strong> approach to demarcate <str<strong>on</strong>g>coal</str<strong>on</strong>g> <str<strong>on</strong>g>fire</str<strong>on</strong>g> <str<strong>on</strong>g>risk</str<strong>on</strong>g> <str<strong>on</strong>g>areas</str<strong>on</strong>g> allows the definiti<strong>on</strong> of<br />
regi<strong>on</strong>s potentially pr<strong>on</strong>e to <str<strong>on</strong>g>coal</str<strong>on</strong>g> <str<strong>on</strong>g>fire</str<strong>on</strong>g>s. These regi<strong>on</strong>s should not <strong>on</strong>ly be visited during regular field<br />
checks, but should also get a high priority for satellite m<strong>on</strong>itoring as e.g. by the satellite Aster. This<br />
sensor combines the advantages of several multi<strong>spectral</strong> and thermal bands. For a focused m<strong>on</strong>itoring<br />
this sensor is a good replacement for Landsat-7, now that sensor instabilities lead to a failure of ETM+<br />
in late May 2003.<br />
Map 4 presents automatically extracted <str<strong>on</strong>g>coal</str<strong>on</strong>g> surfaces, demarcated <str<strong>on</strong>g>coal</str<strong>on</strong>g> <str<strong>on</strong>g>fire</str<strong>on</strong>g> <str<strong>on</strong>g>risk</str<strong>on</strong>g> <str<strong>on</strong>g>areas</str<strong>on</strong>g> thermal<br />
anomalies for the regi<strong>on</strong> of Wuda syncline. The <str<strong>on</strong>g>coal</str<strong>on</strong>g> <str<strong>on</strong>g>fire</str<strong>on</strong>g> related thermal anomalies are all located<br />
within the demarcated <str<strong>on</strong>g>risk</str<strong>on</strong>g> area. Additi<strong>on</strong>ally, thermal anomalies resulting from industry were<br />
extracted also. Most thermal anomalies extracted from nighttime data are closely related to <str<strong>on</strong>g>coal</str<strong>on</strong>g><br />
surfaces. Next to <str<strong>on</strong>g>coal</str<strong>on</strong>g> seam <str<strong>on</strong>g>fire</str<strong>on</strong>g>s, <str<strong>on</strong>g>coal</str<strong>on</strong>g> waste pile and <str<strong>on</strong>g>coal</str<strong>on</strong>g> storage pile <str<strong>on</strong>g>fire</str<strong>on</strong>g>s are comm<strong>on</strong>place in the<br />
area.<br />
Map 5 presents the same features for the area south of Wuhai. Here thermal anomalies – also extracted<br />
from thermal nighttime data – occur close to <str<strong>on</strong>g>coal</str<strong>on</strong>g> accumulati<strong>on</strong>s, which are mainly industry related.<br />
However, there are some private wild mines directly east of the city of Wuhai, where no thermal<br />
anomalies are present yet. However, this area including the typical tiny round <str<strong>on</strong>g>coal</str<strong>on</strong>g> accumulati<strong>on</strong>s<br />
indicating private mining entrances is probably very pr<strong>on</strong>e to <str<strong>on</strong>g>coal</str<strong>on</strong>g> <str<strong>on</strong>g>fire</str<strong>on</strong>g> genesis. Also the valley<br />
extending south of Wuhai east of the central limest<strong>on</strong>e mountains host many small scale mines and is<br />
pr<strong>on</strong>e to <str<strong>on</strong>g>coal</str<strong>on</strong>g> <str<strong>on</strong>g>fire</str<strong>on</strong>g> genesis.<br />
Map 6 depicts the main part of this valley. Industry related <str<strong>on</strong>g>coal</str<strong>on</strong>g> waste and storage piles, small scale<br />
mines and wild <str<strong>on</strong>g>coal</str<strong>on</strong>g> digging is comm<strong>on</strong>place. In the very southern corner of the map a subsurface <str<strong>on</strong>g>coal</str<strong>on</strong>g><br />
<str<strong>on</strong>g>fire</str<strong>on</strong>g> could be verified in June 2004. The area marked <strong>on</strong> the map as “newly detected <str<strong>on</strong>g>coal</str<strong>on</strong>g> <str<strong>on</strong>g>fire</str<strong>on</strong>g>s” is the<br />
same shown in the photographs of figure 10-3.<br />
In map 7 all larger <str<strong>on</strong>g>coal</str<strong>on</strong>g> accumulati<strong>on</strong>s, which are related to <str<strong>on</strong>g>coal</str<strong>on</strong>g> processing industry in the far<br />
Southeast of Wuda, were extracted. Demarcated <str<strong>on</strong>g>coal</str<strong>on</strong>g> <str<strong>on</strong>g>fire</str<strong>on</strong>g> <str<strong>on</strong>g>risk</str<strong>on</strong>g> <str<strong>on</strong>g>areas</str<strong>on</strong>g> around these industrial<br />
accumulati<strong>on</strong>s (especially in the South of the map) are actually not necessary. This dem<strong>on</strong>strated that a<br />
spectra <str<strong>on</strong>g>based</str<strong>on</strong>g> algorithm cannot distinguish thematic classes. Coal – occurring as <str<strong>on</strong>g>coal</str<strong>on</strong>g> seams, <str<strong>on</strong>g>coal</str<strong>on</strong>g><br />
waste piles, <str<strong>on</strong>g>coal</str<strong>on</strong>g> storage piles, thick <str<strong>on</strong>g>coal</str<strong>on</strong>g> dust – can not be differentiated further.<br />
Map 8 presents a <str<strong>on</strong>g>coal</str<strong>on</strong>g> <str<strong>on</strong>g>fire</str<strong>on</strong>g> <str<strong>on</strong>g>risk</str<strong>on</strong>g> area east of Shizuishan City, which is supposed to be at high <str<strong>on</strong>g>risk</str<strong>on</strong>g> for<br />
<str<strong>on</strong>g>coal</str<strong>on</strong>g> <str<strong>on</strong>g>fire</str<strong>on</strong>g> igniti<strong>on</strong>. Coal is mined in two valleys stretching North-South in the northern foothills of the<br />
Helan Shan. Thermal anomalies do not show up yet. However, the area should be observed closely.<br />
- 216 -
The same applies for the <str<strong>on</strong>g>coal</str<strong>on</strong>g> <str<strong>on</strong>g>fire</str<strong>on</strong>g> <str<strong>on</strong>g>risk</str<strong>on</strong>g> <str<strong>on</strong>g>areas</str<strong>on</strong>g> directly south and east of the <str<strong>on</strong>g>fire</str<strong>on</strong>g>s, which were newly<br />
detected in June 2004. These <str<strong>on</strong>g>areas</str<strong>on</strong>g> are presented in map 9. Driving time from Wuda to this area is<br />
about 2 hours. A regular field check could help to detect <str<strong>on</strong>g>coal</str<strong>on</strong>g> <str<strong>on</strong>g>fire</str<strong>on</strong>g>s early after igniti<strong>on</strong>. This would<br />
guarantee a fast and easy extincti<strong>on</strong> of the <str<strong>on</strong>g>fire</str<strong>on</strong>g>s, <strong>on</strong>ce they flar up.<br />
Map 10 presents the Ruqigou / Gulaben study area. Coal was extracted with high accuracy. The<br />
demarcated <str<strong>on</strong>g>coal</str<strong>on</strong>g> <str<strong>on</strong>g>fire</str<strong>on</strong>g> <str<strong>on</strong>g>risk</str<strong>on</strong>g> area coincides well with the actual occurrence of <str<strong>on</strong>g>coal</str<strong>on</strong>g> <str<strong>on</strong>g>fire</str<strong>on</strong>g>s in this regi<strong>on</strong>.<br />
Over 20 <str<strong>on</strong>g>coal</str<strong>on</strong>g> <str<strong>on</strong>g>fire</str<strong>on</strong>g>s induce thermal anomalies in nighttime data. Most of the anomalies in the map are<br />
<str<strong>on</strong>g>coal</str<strong>on</strong>g> <str<strong>on</strong>g>fire</str<strong>on</strong>g> related. Only very few are false alarms of unclear cause.<br />
Maps 11 and 12 depict <str<strong>on</strong>g>coal</str<strong>on</strong>g> <str<strong>on</strong>g>fire</str<strong>on</strong>g> <str<strong>on</strong>g>risk</str<strong>on</strong>g> <str<strong>on</strong>g>areas</str<strong>on</strong>g> in the valleys of Hulusitai and Shitanjing, north of Ruqigou.<br />
These valleys are located in approximately 50 km distance to Wuda in the North. Both valley <strong>on</strong>ce had<br />
prospering <str<strong>on</strong>g>coal</str<strong>on</strong>g> mining communities. However, reserves have been exhausted several years ago and<br />
many mining operati<strong>on</strong>s were <strong>on</strong>ly improperly sealed. Unknown <str<strong>on</strong>g>coal</str<strong>on</strong>g> <str<strong>on</strong>g>fire</str<strong>on</strong>g>s could be detected and<br />
verified in September 2003. The valley east of Shitanjing has not been visited so far. Nevertheless, this<br />
valley, showing a lot of small round <str<strong>on</strong>g>coal</str<strong>on</strong>g> accumulati<strong>on</strong>s (wild mines), is pr<strong>on</strong>e to <str<strong>on</strong>g>coal</str<strong>on</strong>g> <str<strong>on</strong>g>fire</str<strong>on</strong>g> igniti<strong>on</strong>.<br />
The further maps present the automatically extracted <str<strong>on</strong>g>coal</str<strong>on</strong>g> surfaces and demarcated <str<strong>on</strong>g>coal</str<strong>on</strong>g> <str<strong>on</strong>g>fire</str<strong>on</strong>g> <str<strong>on</strong>g>risk</str<strong>on</strong>g> <str<strong>on</strong>g>areas</str<strong>on</strong>g><br />
for the transfer regi<strong>on</strong>s. In these regi<strong>on</strong>s the thermal anomalies cannot be assigned to certain causes,<br />
since field checks were not possible. In the city area of Baotou several <str<strong>on</strong>g>coal</str<strong>on</strong>g> industries exist.<br />
Furthermore <str<strong>on</strong>g>coal</str<strong>on</strong>g> storage pile <str<strong>on</strong>g>fire</str<strong>on</strong>g>s occur. However, it is not known, where exactly they area located.<br />
For the Leigh Creek mining area in Australia it is not known if <str<strong>on</strong>g>coal</str<strong>on</strong>g> <str<strong>on</strong>g>fire</str<strong>on</strong>g>s do exist. The thermal<br />
anomalies for the Jharia <str<strong>on</strong>g>coal</str<strong>on</strong>g> field are likely to be <str<strong>on</strong>g>coal</str<strong>on</strong>g> <str<strong>on</strong>g>fire</str<strong>on</strong>g> related. However, no updated informati<strong>on</strong><br />
<strong>on</strong> the <str<strong>on</strong>g>coal</str<strong>on</strong>g> <str<strong>on</strong>g>fire</str<strong>on</strong>g> locati<strong>on</strong>s is currently available. The same applies for the <str<strong>on</strong>g>coal</str<strong>on</strong>g> field of Ray.<br />
Comparing the knowledge <str<strong>on</strong>g>based</str<strong>on</strong>g> and the PMA approach for <str<strong>on</strong>g>coal</str<strong>on</strong>g> <str<strong>on</strong>g>fire</str<strong>on</strong>g> area demarcati<strong>on</strong> the first proves<br />
to be more robust and easier to implement in comm<strong>on</strong> programming languages. It is therefore already<br />
used for mass data throughput within the project. However, the PMA <str<strong>on</strong>g>based</str<strong>on</strong>g> approach is a good tool if<br />
detailed knowledge trees do not yet exist and a certain surface type covering a high subpixel fracti<strong>on</strong><br />
shall be extracted fast and without much analyst interacti<strong>on</strong>. As dem<strong>on</strong>strated in figure 10-4 both<br />
methods yield similar results for <str<strong>on</strong>g>coal</str<strong>on</strong>g> <str<strong>on</strong>g>fire</str<strong>on</strong>g> area demarcati<strong>on</strong>. The extracti<strong>on</strong> accuracy of the knowledge<br />
<str<strong>on</strong>g>based</str<strong>on</strong>g> approach is slightly higher but does not imply a general overall advantage<br />
To improve <str<strong>on</strong>g>coal</str<strong>on</strong>g> <str<strong>on</strong>g>fire</str<strong>on</strong>g> <str<strong>on</strong>g>risk</str<strong>on</strong>g> maps and <str<strong>on</strong>g>coal</str<strong>on</strong>g> <str<strong>on</strong>g>fire</str<strong>on</strong>g> <str<strong>on</strong>g>risk</str<strong>on</strong>g> area demarcati<strong>on</strong> many parameters could additi<strong>on</strong>ally<br />
be included. The implementati<strong>on</strong> of further exclusi<strong>on</strong> parameters and indicators, leading to a higher<br />
differentiati<strong>on</strong> within the demarcated <str<strong>on</strong>g>coal</str<strong>on</strong>g> <str<strong>on</strong>g>fire</str<strong>on</strong>g> <str<strong>on</strong>g>areas</str<strong>on</strong>g> was not in the scope of this work. However,<br />
possible improvements include the following opti<strong>on</strong>s:<br />
1) Industry and settlement produce thermal anomalies resulting from <str<strong>on</strong>g>fire</str<strong>on</strong>g>s, waste burning, and<br />
industrial thermal emissi<strong>on</strong> am<strong>on</strong>gst others. Since a lot of industry in the study <str<strong>on</strong>g>areas</str<strong>on</strong>g> is <str<strong>on</strong>g>coal</str<strong>on</strong>g> related it<br />
may occur that a thermal anomaly occurs next to a <str<strong>on</strong>g>coal</str<strong>on</strong>g> surface (e.g. a <str<strong>on</strong>g>coal</str<strong>on</strong>g> stock pile), which actually<br />
bel<strong>on</strong>gs to a <str<strong>on</strong>g>coal</str<strong>on</strong>g> burning plant. The thermal anomaly therefore does not necessarily have to be a <str<strong>on</strong>g>coal</str<strong>on</strong>g><br />
storage pile <str<strong>on</strong>g>fire</str<strong>on</strong>g>, but can result from a very near close by chimney. It is very hard to automatically<br />
extract settlement and industry from multi<strong>spectral</strong> remote sensing imagery. This general challenge is<br />
complicated through the fact that settlements in the study <str<strong>on</strong>g>areas</str<strong>on</strong>g> are often built from materials, which<br />
are hardly distinguishable from natural surface materials. Main houses are build of loam and straw or<br />
- 217 -
icks. Roofs are flat and usually covered with weathered material, <str<strong>on</strong>g>coal</str<strong>on</strong>g> dust or pebbles. This does not<br />
apply for industrial complexes, but these also do not have clear characteristic <strong>spectral</strong> features.<br />
Industrial complexes could most likely be extracted taking image texture and c<strong>on</strong>text as well as<br />
lineament analysis into account. However, the exclusi<strong>on</strong> of settled <str<strong>on</strong>g>areas</str<strong>on</strong>g> and industry within the<br />
demarcated <str<strong>on</strong>g>coal</str<strong>on</strong>g> <str<strong>on</strong>g>fire</str<strong>on</strong>g> (<str<strong>on</strong>g>risk</str<strong>on</strong>g>) <str<strong>on</strong>g>areas</str<strong>on</strong>g> could support the exclusi<strong>on</strong> of some false alarms, which might be<br />
located within the <str<strong>on</strong>g>risk</str<strong>on</strong>g> <str<strong>on</strong>g>areas</str<strong>on</strong>g>.<br />
2) In additi<strong>on</strong> – as presented in chapter 2 – limest<strong>on</strong>e mining and burning is a comm<strong>on</strong>ly undertaken<br />
activity within the area. Thermal anomalies, which occur close to very distinct and visibly bright<br />
surfaces of processed limest<strong>on</strong>e (calcite) are not very likely to be <str<strong>on</strong>g>coal</str<strong>on</strong>g> <str<strong>on</strong>g>fire</str<strong>on</strong>g>s. The calcite or dolomite<br />
signatures could be excluded from the data set in an approach similar to knowledge <str<strong>on</strong>g>based</str<strong>on</strong>g> or partial<br />
unmixing <str<strong>on</strong>g>coal</str<strong>on</strong>g> extracti<strong>on</strong>.<br />
3) Coal <str<strong>on</strong>g>fire</str<strong>on</strong>g>s often lead to cracks and slow as well as sudden land subsidence within their surrounding.<br />
The specificati<strong>on</strong> of subsidence <str<strong>on</strong>g>areas</str<strong>on</strong>g> within the demarcated <str<strong>on</strong>g>risk</str<strong>on</strong>g> <str<strong>on</strong>g>areas</str<strong>on</strong>g> <str<strong>on</strong>g>based</str<strong>on</strong>g> <strong>on</strong> differential SAR<br />
interferometry is to date still very difficult (HOFFMANN et al. 2003). However, the indicati<strong>on</strong> <strong>on</strong><br />
subsidence could increase the <str<strong>on</strong>g>coal</str<strong>on</strong>g> <str<strong>on</strong>g>fire</str<strong>on</strong>g> existence probability within these <str<strong>on</strong>g>areas</str<strong>on</strong>g>.<br />
4) Further parameters of interest are the closeness of the demarcated <str<strong>on</strong>g>areas</str<strong>on</strong>g> to settlement, their<br />
accessibility via infrastructure and the infrastructure density within the <str<strong>on</strong>g>risk</str<strong>on</strong>g> <str<strong>on</strong>g>areas</str<strong>on</strong>g>. This would pay toll<br />
to the fact that <str<strong>on</strong>g>coal</str<strong>on</strong>g> <str<strong>on</strong>g>fire</str<strong>on</strong>g>s are not <strong>on</strong>ly started due to fully natural sp<strong>on</strong>taneous combusti<strong>on</strong> in an<br />
untouched envir<strong>on</strong>ment. Most <str<strong>on</strong>g>coal</str<strong>on</strong>g> <str<strong>on</strong>g>fire</str<strong>on</strong>g>s’ igniti<strong>on</strong> is related to human interacti<strong>on</strong>. A short distance to<br />
settlements and a high infrastructure density in the vicinity as well as within the demarcated <str<strong>on</strong>g>risk</str<strong>on</strong>g> <str<strong>on</strong>g>areas</str<strong>on</strong>g><br />
could raise the potential <str<strong>on</strong>g>risk</str<strong>on</strong>g> within the designated <str<strong>on</strong>g>areas</str<strong>on</strong>g>. Also the structural and ec<strong>on</strong>omical<br />
development of a regi<strong>on</strong> plays an important role. Proper mining techniques and industrialized methods<br />
hamper <str<strong>on</strong>g>coal</str<strong>on</strong>g> <str<strong>on</strong>g>fire</str<strong>on</strong>g> igniti<strong>on</strong>, while practices like wild private mining with inappropriate ventilati<strong>on</strong>, low<br />
security standards and insufficient sealing support sp<strong>on</strong>taneous combusti<strong>on</strong> processes.<br />
5) Provided that a digital global data set of sufficient accuracy of all <str<strong>on</strong>g>coal</str<strong>on</strong>g> basins would be available,<br />
<str<strong>on</strong>g>coal</str<strong>on</strong>g> <str<strong>on</strong>g>fire</str<strong>on</strong>g> <str<strong>on</strong>g>risk</str<strong>on</strong>g> <str<strong>on</strong>g>areas</str<strong>on</strong>g> could be limited to these regi<strong>on</strong>s. This way <strong>on</strong>ly the <str<strong>on</strong>g>risk</str<strong>on</strong>g> area demarcati<strong>on</strong> for <str<strong>on</strong>g>coal</str<strong>on</strong>g><br />
waste and <str<strong>on</strong>g>coal</str<strong>on</strong>g> storage piles further away from their mining origin would be hampered. For China<br />
such a dataset at the scale of 1:500,000 was available from USGS. Even though this dataset is not<br />
c<strong>on</strong>sidered fully complete, for the scenes of China processed no demarcated <str<strong>on</strong>g>coal</str<strong>on</strong>g> <str<strong>on</strong>g>fire</str<strong>on</strong>g> <str<strong>on</strong>g>risk</str<strong>on</strong>g> area extends<br />
into a regi<strong>on</strong>, which is not designated as a <str<strong>on</strong>g>coal</str<strong>on</strong>g> bearing area. For India and Australia such informati<strong>on</strong><br />
was not available for this thesis.<br />
6) As menti<strong>on</strong>ed in chapter 7 different <str<strong>on</strong>g>coal</str<strong>on</strong>g> types show a differing pr<strong>on</strong>eness to sp<strong>on</strong>taneous<br />
combusti<strong>on</strong>. While the highly compacted high ranking anthracite <str<strong>on</strong>g>coal</str<strong>on</strong>g>s of Ruqigou / Gulaben are<br />
actually not so pr<strong>on</strong>e to sp<strong>on</strong>taneous combusti<strong>on</strong>, the low quality <str<strong>on</strong>g>coal</str<strong>on</strong>g>s of Wuda with high sulfur<br />
c<strong>on</strong>tents and a lower density ignite easier. A differentiati<strong>on</strong> of different <str<strong>on</strong>g>coal</str<strong>on</strong>g> types within demarcated<br />
<str<strong>on</strong>g>coal</str<strong>on</strong>g> <str<strong>on</strong>g>fire</str<strong>on</strong>g> <str<strong>on</strong>g>areas</str<strong>on</strong>g> could therefore support the differentiati<strong>on</strong> within the demarcated <str<strong>on</strong>g>risk</str<strong>on</strong>g> <str<strong>on</strong>g>areas</str<strong>on</strong>g> c<strong>on</strong>cerning<br />
<str<strong>on</strong>g>coal</str<strong>on</strong>g> <str<strong>on</strong>g>fire</str<strong>on</strong>g> igniti<strong>on</strong> probability.<br />
7) Also climatic parameters like sunshine hours, average temperatures, aridity, precipitati<strong>on</strong> etc. may<br />
influence the pr<strong>on</strong>eness of an exposed <str<strong>on</strong>g>coal</str<strong>on</strong>g> seam, <str<strong>on</strong>g>coal</str<strong>on</strong>g> waste- or <str<strong>on</strong>g>coal</str<strong>on</strong>g> storage pile for sp<strong>on</strong>taneous<br />
combusti<strong>on</strong>. These factors could be included through rasters allowing the factorial weighting of <str<strong>on</strong>g>areas</str<strong>on</strong>g>.<br />
- 218 -
11. C<strong>on</strong>clusi<strong>on</strong>s and Outlook<br />
In this thesis a c<strong>on</strong>ceptual approach for the automated demarcati<strong>on</strong> of <str<strong>on</strong>g>coal</str<strong>on</strong>g> <str<strong>on</strong>g>fire</str<strong>on</strong>g> <str<strong>on</strong>g>risk</str<strong>on</strong>g> <str<strong>on</strong>g>areas</str<strong>on</strong>g> has been<br />
designed. Based in this c<strong>on</strong>cept, two algorithms have been developed to automatically retrieve <str<strong>on</strong>g>coal</str<strong>on</strong>g><br />
<str<strong>on</strong>g>fire</str<strong>on</strong>g> <str<strong>on</strong>g>risk</str<strong>on</strong>g> <str<strong>on</strong>g>areas</str<strong>on</strong>g> from multi sensor remote sensing data.<br />
These algorithms are <str<strong>on</strong>g>based</str<strong>on</strong>g> <strong>on</strong> detailed field observati<strong>on</strong>s, the results of extensive signature analyses<br />
in satellite imagery and analyses of <strong>spectral</strong> measurements recorded <strong>on</strong> surface samples from the study<br />
<str<strong>on</strong>g>areas</str<strong>on</strong>g>. A knowledge-<str<strong>on</strong>g>based</str<strong>on</strong>g> <strong>spectral</strong> <strong>test</strong> sequence and a partial unmixing approach are employed to<br />
demarcate <str<strong>on</strong>g>coal</str<strong>on</strong>g> <str<strong>on</strong>g>fire</str<strong>on</strong>g> <str<strong>on</strong>g>risk</str<strong>on</strong>g> <str<strong>on</strong>g>areas</str<strong>on</strong>g>. The delineati<strong>on</strong> approach is embedded in an integral <str<strong>on</strong>g>coal</str<strong>on</strong>g> <str<strong>on</strong>g>fire</str<strong>on</strong>g> area<br />
demarcati<strong>on</strong>-, detecti<strong>on</strong>- and quantificati<strong>on</strong> scheme developed within the project. The algorithms<br />
presented have been dem<strong>on</strong>strated to be robust tools for <str<strong>on</strong>g>coal</str<strong>on</strong>g> <str<strong>on</strong>g>fire</str<strong>on</strong>g> area demarcati<strong>on</strong>. They work<br />
automatically and enable to screen unknown <str<strong>on</strong>g>areas</str<strong>on</strong>g> for the probability of <str<strong>on</strong>g>coal</str<strong>on</strong>g> <str<strong>on</strong>g>fire</str<strong>on</strong>g> occurrence.<br />
Furthermore, they have been applied successfully to images acquired by different sensors and to <str<strong>on</strong>g>coal</str<strong>on</strong>g><br />
mining regi<strong>on</strong>s <strong>on</strong> other c<strong>on</strong>tinents. The delineati<strong>on</strong> of <str<strong>on</strong>g>coal</str<strong>on</strong>g> <str<strong>on</strong>g>fire</str<strong>on</strong>g> <str<strong>on</strong>g>risk</str<strong>on</strong>g> <str<strong>on</strong>g>areas</str<strong>on</strong>g> <str<strong>on</strong>g>based</str<strong>on</strong>g> <strong>on</strong> the automated<br />
extracti<strong>on</strong> of <str<strong>on</strong>g>coal</str<strong>on</strong>g> and analysis of vegetati<strong>on</strong> density is cheaper and faster than tedious interactive<br />
mapping and standard classificati<strong>on</strong> approaches. This is of great advantage in countries, where<br />
detailed and updated land cover maps do not exist. Combined with approaches for <str<strong>on</strong>g>coal</str<strong>on</strong>g> <str<strong>on</strong>g>fire</str<strong>on</strong>g> related<br />
thermal anomaly detecti<strong>on</strong> the multi<strong>spectral</strong> demarcati<strong>on</strong> approach now enables the operati<strong>on</strong>al<br />
detecti<strong>on</strong> and m<strong>on</strong>itoring of <str<strong>on</strong>g>coal</str<strong>on</strong>g> <str<strong>on</strong>g>fire</str<strong>on</strong>g> <str<strong>on</strong>g>areas</str<strong>on</strong>g> and <str<strong>on</strong>g>coal</str<strong>on</strong>g> <str<strong>on</strong>g>fire</str<strong>on</strong>g> <str<strong>on</strong>g>risk</str<strong>on</strong>g> <str<strong>on</strong>g>areas</str<strong>on</strong>g> in large regi<strong>on</strong>s, such as northern<br />
China.<br />
11.1. C<strong>on</strong>clusi<strong>on</strong>s<br />
With respect to the questi<strong>on</strong>s raised <strong>on</strong> page 6 in chapter <strong>on</strong>e the following c<strong>on</strong>clusi<strong>on</strong>s can be drawn:<br />
1. Both study <str<strong>on</strong>g>areas</str<strong>on</strong>g> – Wuda and Ruqigou/Gulaben – have underg<strong>on</strong>e a substantial increase in mining<br />
activity between 1987 and 2003. This is indirectly observed in the rapid expansi<strong>on</strong> of <str<strong>on</strong>g>coal</str<strong>on</strong>g> covered<br />
surfaces in both <str<strong>on</strong>g>areas</str<strong>on</strong>g>. From 1987 to 2003 <str<strong>on</strong>g>coal</str<strong>on</strong>g> covered surface <str<strong>on</strong>g>areas</str<strong>on</strong>g> increased by over 100 % in both<br />
regi<strong>on</strong>s. The <str<strong>on</strong>g>coal</str<strong>on</strong>g> covered area in Wuda currently ranges at 3.7 times the area covered in 1987. In<br />
Ruqigou the area covered increased by a factor of 2.7. This finding is <str<strong>on</strong>g>based</str<strong>on</strong>g> <strong>on</strong> the applicati<strong>on</strong> of a<br />
knowledge-<str<strong>on</strong>g>based</str<strong>on</strong>g> <strong>spectral</strong> <strong>test</strong> sequence applying identical thresholds for surface extracti<strong>on</strong> to eight<br />
available ETM+ scenes. This result agrees with investigati<strong>on</strong>s <strong>on</strong> the development of <str<strong>on</strong>g>coal</str<strong>on</strong>g> covered<br />
<str<strong>on</strong>g>areas</str<strong>on</strong>g> using linear partial unmixing. Results of the automated mapping were evaluated <str<strong>on</strong>g>based</str<strong>on</strong>g> <strong>on</strong> an<br />
extensive set of over 50 <str<strong>on</strong>g>coal</str<strong>on</strong>g> ground truth polyg<strong>on</strong>s and seven mixture grids mapped in the field.<br />
Extracti<strong>on</strong> accuracies for the surface <str<strong>on</strong>g>coal</str<strong>on</strong>g> in the study <str<strong>on</strong>g>areas</str<strong>on</strong>g> range from 77.87 % and 95.98 % for both<br />
approaches. The linear trends of increasing <str<strong>on</strong>g>coal</str<strong>on</strong>g> covered surfaces is statistically stable for both study<br />
area time series investigated.<br />
While a quantitative estimate of the <str<strong>on</strong>g>coal</str<strong>on</strong>g> covered area increase has been obtained, the absolute <str<strong>on</strong>g>coal</str<strong>on</strong>g><br />
covered area in 1987 and 2003 can <strong>on</strong>ly be estimated within a larger error range. The requirements for<br />
the algorithm – to be applicable for different times and in several regi<strong>on</strong>s – limits the individual<br />
extracti<strong>on</strong> accuracy. It has been dem<strong>on</strong>strated for the Wuda regi<strong>on</strong> that knowledge-<str<strong>on</strong>g>based</str<strong>on</strong>g> <str<strong>on</strong>g>coal</str<strong>on</strong>g><br />
extracti<strong>on</strong> results tend to slightly underestimate the area of <str<strong>on</strong>g>coal</str<strong>on</strong>g> covered surfaces. This slight<br />
- 219 -
underestimati<strong>on</strong> is observed for all time steps. In Ruqigou the <str<strong>on</strong>g>coal</str<strong>on</strong>g> covered area could be estimated<br />
with slightly higher accuracies. Here, the total <str<strong>on</strong>g>coal</str<strong>on</strong>g> covered area within the broader study area sum to<br />
13.7 km² in 2003.<br />
Coal mining activities in Ruqigou have expanded within the main mining area. The open pit mine of<br />
Dafeng has grown over time, as have the <str<strong>on</strong>g>coal</str<strong>on</strong>g> fields of Gulaben and north of Baijigou. Furthermore,<br />
mining activities in the two valleys of Hulusitai and Shitanjing have str<strong>on</strong>gly increased since 1987. A<br />
spread of small scale private mines cannot be detected visually in Ruqigou / Gulaben. For this regi<strong>on</strong> it<br />
is observed that <str<strong>on</strong>g>coal</str<strong>on</strong>g> mining is expanding within the industrially mined <str<strong>on</strong>g>areas</str<strong>on</strong>g>.<br />
In the broader Wuda study area an increase in <str<strong>on</strong>g>coal</str<strong>on</strong>g> surfaces is not <strong>on</strong>ly noted in the area of the three<br />
major mines, but also outside the Wuda mining syncline. A rapid spread of small scale unlicensed<br />
private mines can be observed east of the Yellow River. Here, the foot-slopes al<strong>on</strong>g a former river<br />
valley are dotted with small mine openings and <str<strong>on</strong>g>coal</str<strong>on</strong>g> waste and storage piles. Many of these did not<br />
exist in 1987. Furthermore, industrial <str<strong>on</strong>g>coal</str<strong>on</strong>g> processing has spread dramatically in the broader Wuda<br />
surrounding. This can be seen in the increase of <str<strong>on</strong>g>coal</str<strong>on</strong>g> storage piles located near roads and settlements<br />
farther away from the actual mining operati<strong>on</strong>s. A temporal investigati<strong>on</strong> <strong>on</strong> how often a certain pixel<br />
was identified as <str<strong>on</strong>g>coal</str<strong>on</strong>g> in all eight observati<strong>on</strong>s (scenes) has been undertaken. This supported the<br />
visualizati<strong>on</strong> of the process of <str<strong>on</strong>g>coal</str<strong>on</strong>g> storage pile growth and <str<strong>on</strong>g>coal</str<strong>on</strong>g> waste pile expansi<strong>on</strong> over time.<br />
The two winter scenes from December 2002 and February 2003 show an inner-annual decrease of <str<strong>on</strong>g>coal</str<strong>on</strong>g><br />
coverage compared to September 2002 and May 2003. This phenomen<strong>on</strong> could be quantified and was<br />
validated through visual interpretati<strong>on</strong>. While 12.4 km² were covered with <str<strong>on</strong>g>coal</str<strong>on</strong>g> in September 2002,<br />
<strong>on</strong>ly 10.34 km² were mapped in December 2002. It is assumed that <str<strong>on</strong>g>coal</str<strong>on</strong>g> storage pile sizes are clearly<br />
reduced in winter, since <str<strong>on</strong>g>coal</str<strong>on</strong>g> is heavily used for heating and electricity generati<strong>on</strong>.<br />
2. Coal <str<strong>on</strong>g>fire</str<strong>on</strong>g>s lead to the deteriorati<strong>on</strong> of vegetati<strong>on</strong> in the vicinity of thermally anomalous <str<strong>on</strong>g>areas</str<strong>on</strong>g> and<br />
cracks releasing toxic fumes. Vegetati<strong>on</strong> density in the <str<strong>on</strong>g>coal</str<strong>on</strong>g> <str<strong>on</strong>g>fire</str<strong>on</strong>g> <str<strong>on</strong>g>areas</str<strong>on</strong>g> studied is generally low and<br />
does not exceed 50 % surface coverage. No <str<strong>on</strong>g>coal</str<strong>on</strong>g> <str<strong>on</strong>g>fire</str<strong>on</strong>g> has been showing healthy vegetati<strong>on</strong> above the<br />
bedrock covering the burning seams. Above the <str<strong>on</strong>g>fire</str<strong>on</strong>g>s vegetati<strong>on</strong> density is 0 %. This was c<strong>on</strong>firmed<br />
with three mapped mixture grids c<strong>on</strong>sisting of 349 raster cells located above <str<strong>on</strong>g>fire</str<strong>on</strong>g>s #6, #8 and #13 in<br />
Wuda during 2002 and 2003. The phenomen<strong>on</strong> can also be observed in vegetati<strong>on</strong> index data such as<br />
SAVI images. A regi<strong>on</strong>al increase of vegetati<strong>on</strong> density with increasing distance from the subsurface<br />
<str<strong>on</strong>g>fire</str<strong>on</strong>g> z<strong>on</strong>e could be identified. Furthermore, partial unmixing results of the vegetati<strong>on</strong> fracti<strong>on</strong> show<br />
values below 25% above the subsurface <str<strong>on</strong>g>fire</str<strong>on</strong>g>s. These values above 0 % result from the overestimati<strong>on</strong><br />
of the requested spectrum in partial unmixing approaches as discussed within the thesis. However, in<br />
agricultural <str<strong>on</strong>g>areas</str<strong>on</strong>g> and forested regi<strong>on</strong>s the vegetati<strong>on</strong> fracti<strong>on</strong> images show values of up to 100%.<br />
Very hot <str<strong>on</strong>g>coal</str<strong>on</strong>g> <str<strong>on</strong>g>fire</str<strong>on</strong>g>s lead to the generati<strong>on</strong> of pyrometamorphic rocks. These are rocks, which<br />
experience color and texture changes due to dehydrati<strong>on</strong> and oxidati<strong>on</strong>. They occur in different colors,<br />
densities and mineral compositi<strong>on</strong>s depending <strong>on</strong> the parent rock and the temperature of<br />
pyrometamorphosis. Spectral differences resulting from different degrees of pyrometamorphosis and<br />
different mineral compositi<strong>on</strong>s were detected <strong>on</strong> surface sample spectra. Where these rocks are<br />
exposed at the surface, they can be detected in high spatial resoluti<strong>on</strong> satellite data. Pyrometamophic<br />
rocks of the Ruqiqou area are clearly visible in Quickbird data available for this regi<strong>on</strong>. Furthermore<br />
- 220 -
4-5 pixels in the ETM+ data show a spectra signal dominated by such rocks. In Wuda<br />
pyrometamorphic outcrops occur <strong>on</strong>ly in a small area. A small regi<strong>on</strong> can be noted in the Quickbird<br />
data, which can <strong>on</strong>ly be recognized with the support of GPS data and detailed ground knowledge. In<br />
ETM+ data pyrometamorphic rock cannot be detected for Wuda.<br />
In additi<strong>on</strong> to vegetati<strong>on</strong> degradati<strong>on</strong> and pyrometamorphic rocks <str<strong>on</strong>g>coal</str<strong>on</strong>g> <str<strong>on</strong>g>fire</str<strong>on</strong>g>s often cause numerous<br />
cracks in the overlaying bedrock. According to field mappings c<strong>on</strong>ducted in 2003, such cracks are<br />
10 cm to 2 m wide, range from centimeters to 20 meters in length and strike orthog<strong>on</strong>al to the<br />
spreading directi<strong>on</strong> of the subsurface <str<strong>on</strong>g>coal</str<strong>on</strong>g> <str<strong>on</strong>g>fire</str<strong>on</strong>g>. They develop due to volume loss underground. Also<br />
larger subsidence phenomena like sinkholes and collapsed mining drives exist. The cracks, sinkholes<br />
and collapsed drives can be detected clearly in high spatial resoluti<strong>on</strong> satellite data. In ETM+ or Aster<br />
data they cannot be seen. So far no automated extracti<strong>on</strong> approach of these features has been<br />
developed. Nevertheless, manual mapping of crack fields can be d<strong>on</strong>e relatively quickly and indicates<br />
the underground <str<strong>on</strong>g>fire</str<strong>on</strong>g> situati<strong>on</strong>.<br />
Studies in the project currently investigate if released gasses and increased aerosol c<strong>on</strong>tents in the<br />
atmosphere above <str<strong>on</strong>g>coal</str<strong>on</strong>g> <str<strong>on</strong>g>fire</str<strong>on</strong>g>s can be observed from atmospheric remote sensing data. However, in<br />
regi<strong>on</strong>s like Wuda, where a lot of emissi<strong>on</strong> results from <str<strong>on</strong>g>coal</str<strong>on</strong>g> industry and other anthropogenic<br />
emissi<strong>on</strong>s, separati<strong>on</strong> from <str<strong>on</strong>g>coal</str<strong>on</strong>g> <str<strong>on</strong>g>fire</str<strong>on</strong>g> emissi<strong>on</strong>s will be difficult.<br />
3. A c<strong>on</strong>ceptual approach for the demarcati<strong>on</strong> of <str<strong>on</strong>g>coal</str<strong>on</strong>g> <str<strong>on</strong>g>fire</str<strong>on</strong>g> <str<strong>on</strong>g>areas</str<strong>on</strong>g> and future <str<strong>on</strong>g>risk</str<strong>on</strong>g> <str<strong>on</strong>g>areas</str<strong>on</strong>g> is presented in<br />
this thesis. Coal <str<strong>on</strong>g>fire</str<strong>on</strong>g> <str<strong>on</strong>g>areas</str<strong>on</strong>g> can be demarcated <str<strong>on</strong>g>based</str<strong>on</strong>g> <strong>on</strong> the automated extracti<strong>on</strong> of the surface ‘<str<strong>on</strong>g>coal</str<strong>on</strong>g>’.<br />
Coal is always present directly at or in the closer vicinity of <str<strong>on</strong>g>coal</str<strong>on</strong>g> <str<strong>on</strong>g>fire</str<strong>on</strong>g>s. It can occur in outcropping <str<strong>on</strong>g>coal</str<strong>on</strong>g><br />
seams, <str<strong>on</strong>g>coal</str<strong>on</strong>g> waste- or <str<strong>on</strong>g>coal</str<strong>on</strong>g> storage piles and mining entrances. Therefore, the automated extracti<strong>on</strong> of<br />
this surface class is the first step for <str<strong>on</strong>g>coal</str<strong>on</strong>g> <str<strong>on</strong>g>fire</str<strong>on</strong>g> area delineati<strong>on</strong>. Depending <strong>on</strong> the dip angle of the <str<strong>on</strong>g>coal</str<strong>on</strong>g><br />
seam, and the assumpti<strong>on</strong> that <str<strong>on</strong>g>coal</str<strong>on</strong>g> <str<strong>on</strong>g>fire</str<strong>on</strong>g>s <strong>on</strong>ly exist to ±150 meters depth, an area can be outlined<br />
around the extracted <str<strong>on</strong>g>coal</str<strong>on</strong>g> surfaces. Within this demarcated area <str<strong>on</strong>g>coal</str<strong>on</strong>g> <str<strong>on</strong>g>fire</str<strong>on</strong>g>s and thermal anomalies<br />
related to the <str<strong>on</strong>g>fire</str<strong>on</strong>g>s are likely to occur.<br />
Investigati<strong>on</strong>s <strong>on</strong> vegetati<strong>on</strong> density and the extracti<strong>on</strong> of pyrometamorphic rock within the<br />
demarcated <str<strong>on</strong>g>areas</str<strong>on</strong>g> can also help to specify likely or unlikely regi<strong>on</strong>s. However, regi<strong>on</strong>s of very low or<br />
zero vegetati<strong>on</strong> density cannot be used directly as an indicator for <str<strong>on</strong>g>coal</str<strong>on</strong>g> <str<strong>on</strong>g>fire</str<strong>on</strong>g> occurrence. Low or zero<br />
vegetati<strong>on</strong> density can also occur in settled <str<strong>on</strong>g>areas</str<strong>on</strong>g>, <strong>on</strong> bare rocks or <strong>on</strong> <str<strong>on</strong>g>coal</str<strong>on</strong>g> piles. Nevertheless, densely<br />
vegetated <str<strong>on</strong>g>areas</str<strong>on</strong>g> within the demarcated z<strong>on</strong>e are unlikely to be <str<strong>on</strong>g>coal</str<strong>on</strong>g> <str<strong>on</strong>g>fire</str<strong>on</strong>g> <str<strong>on</strong>g>areas</str<strong>on</strong>g>, since healthy vegetati<strong>on</strong><br />
rarely exists above smoldering <str<strong>on</strong>g>fire</str<strong>on</strong>g>s releasing toxic fumes. In case pyrometamorphic pixels can be<br />
identified, they can be interpreted as an indicati<strong>on</strong> that a hot <str<strong>on</strong>g>coal</str<strong>on</strong>g> <str<strong>on</strong>g>fire</str<strong>on</strong>g> is existing or has been burning.<br />
All three indicators (<str<strong>on</strong>g>coal</str<strong>on</strong>g>, dense vegetati<strong>on</strong>, pyrometamorphic rocks) can be detected in ETM+ and<br />
Aster satellite data. However, especially for the detecti<strong>on</strong> of pyrometamorphic surfaces data with<br />
higher spatial resoluti<strong>on</strong> would be more suitable. Cracks and subsidence cannot be detected in medium<br />
resoluti<strong>on</strong> data of ETM+ or Aster. Therefore, the automated extracti<strong>on</strong> of cracks and fractures was not<br />
pursued in this thesis<br />
Additi<strong>on</strong>al support for the very rough demarcati<strong>on</strong> of <str<strong>on</strong>g>coal</str<strong>on</strong>g> <str<strong>on</strong>g>fire</str<strong>on</strong>g> <str<strong>on</strong>g>risk</str<strong>on</strong>g> <str<strong>on</strong>g>areas</str<strong>on</strong>g> within a country can be<br />
provided by GIS data. A vector data set <strong>on</strong> the <str<strong>on</strong>g>coal</str<strong>on</strong>g> bearing strata within China exists. This dataset has<br />
- 221 -
a spatial scale of 1:500,000. Provided that the datasets is correct, no <str<strong>on</strong>g>coal</str<strong>on</strong>g> seam <str<strong>on</strong>g>fire</str<strong>on</strong>g> related thermal<br />
anomaly should occur outside the <str<strong>on</strong>g>coal</str<strong>on</strong>g> bearing area. Such data can therefore support <str<strong>on</strong>g>coal</str<strong>on</strong>g> <str<strong>on</strong>g>fire</str<strong>on</strong>g> area<br />
demarcati<strong>on</strong> and detecti<strong>on</strong>. The polyg<strong>on</strong>s were used for an intersecti<strong>on</strong> with demarcated <str<strong>on</strong>g>coal</str<strong>on</strong>g> <str<strong>on</strong>g>fire</str<strong>on</strong>g> <str<strong>on</strong>g>areas</str<strong>on</strong>g><br />
of the scene covering the main study <str<strong>on</strong>g>areas</str<strong>on</strong>g>. This analysis showed that n<strong>on</strong>e of the automatically<br />
demarcated <str<strong>on</strong>g>areas</str<strong>on</strong>g> was located outside the <str<strong>on</strong>g>coal</str<strong>on</strong>g> bearing regi<strong>on</strong>s.<br />
4. Two algorithms have been implemented for <str<strong>on</strong>g>coal</str<strong>on</strong>g> <str<strong>on</strong>g>fire</str<strong>on</strong>g> area demarcati<strong>on</strong>. The first is a knowledge<str<strong>on</strong>g>based</str<strong>on</strong>g><br />
<strong>spectral</strong> <strong>test</strong> sequence separated into three major parts to identify the three surfaces of interest.<br />
The <strong>test</strong> sequence can be c<strong>on</strong>sidered as a series of <strong>spectral</strong> filters. Each image pixel of the input data<br />
set is <strong>test</strong>ed in the <strong>test</strong> sequence. If a pixel passes all <strong>test</strong>s for a certain surface, it is c<strong>on</strong>sidered to be<br />
<str<strong>on</strong>g>coal</str<strong>on</strong>g>, dense vegetati<strong>on</strong> or pyrometamorphic rock. C<strong>on</strong>fusi<strong>on</strong> between the three surfaces did not occur<br />
for any pixel.<br />
For the knowledge <str<strong>on</strong>g>based</str<strong>on</strong>g> extracti<strong>on</strong> of <str<strong>on</strong>g>coal</str<strong>on</strong>g> the separati<strong>on</strong> of <str<strong>on</strong>g>coal</str<strong>on</strong>g> and shadow, which often had<br />
identical <strong>spectral</strong> signals, could be solved employing a relative temperature threshold <strong>test</strong>. This <strong>test</strong> is<br />
<str<strong>on</strong>g>based</str<strong>on</strong>g> <strong>on</strong> the assumpti<strong>on</strong> that <str<strong>on</strong>g>coal</str<strong>on</strong>g> pixels will always be ‘located’ in the upper part (above the mean) of<br />
the thermal band histogram, while cooler shadowed <str<strong>on</strong>g>areas</str<strong>on</strong>g> are located in the lower part (below the<br />
mean). Coal extracti<strong>on</strong> accuracies vary between 87.51 % and 95.98 % for all eleven ETM+ scenes<br />
processed and 91.32 % and 93.81 % for the two Aster scenes.<br />
The extracti<strong>on</strong> of dense vegetati<strong>on</strong> <str<strong>on</strong>g>based</str<strong>on</strong>g> <strong>on</strong> SAVI data shows very good results. Accuracies evaluated<br />
<strong>on</strong> a limited number of ground truth ranging between <strong>on</strong>e and 10 mapped polyg<strong>on</strong>s per scene ranged<br />
between 93.62 and 99.73 % for all scenes.<br />
In c<strong>on</strong>trast, the extracti<strong>on</strong> of pyrometamorphic rock was very challenging. The algorithm is supposed<br />
to detect 4-5 pixels dominated by this surface type within 50 Mio. pixels of the whole scene. Even<br />
though the ground truth regi<strong>on</strong>s were extracted completely (100% producer accuracy) a relatively<br />
large number of additi<strong>on</strong>al pixels was extracted also. A fully automated unsupervised extracti<strong>on</strong> of this<br />
surface therefore proved elusive. Nevertheless, using analyst knowledge, results can be incorporated in<br />
<str<strong>on</strong>g>coal</str<strong>on</strong>g> <str<strong>on</strong>g>fire</str<strong>on</strong>g> area maps.<br />
The sec<strong>on</strong>d approach developed in this work extracts the three surface types of interest <strong>on</strong> the basis of<br />
linear partial unmixing. Mixture analysis results in fracti<strong>on</strong> images for each of the desired surface<br />
comp<strong>on</strong>ents. The fracti<strong>on</strong> images are a quantitative measure for the spatial subpixel c<strong>on</strong>tributi<strong>on</strong><br />
percentage to the overall pixel reflectance. Therefore, partial unmixing enables the mapping of pixel<br />
compositi<strong>on</strong> <strong>on</strong> a subpixel basis. This accounts for the fact that <strong>on</strong>ly few pixels within image data can<br />
be c<strong>on</strong>sidered pure.<br />
Partial mixture analysis (PMA) was performed using self generated prototype spectra for the three<br />
surfaces of interest as a <strong>spectral</strong> reference. These spectra were designed from averaged field and<br />
laboratory measurements of numerous surface samples and were resampled to the <strong>spectral</strong> resoluti<strong>on</strong><br />
of ETM+ and Aster.<br />
The fracti<strong>on</strong> images for <str<strong>on</strong>g>coal</str<strong>on</strong>g> have to be post-processed with a relative temperature <strong>test</strong> to differentiate<br />
shadow and <str<strong>on</strong>g>coal</str<strong>on</strong>g>. After this post processing classificati<strong>on</strong> accuracies of pixels c<strong>on</strong>sidered as pure <str<strong>on</strong>g>coal</str<strong>on</strong>g><br />
- 222 -
(>85% fracti<strong>on</strong>) ranged between 76.47 and 91.42 % (excluding winter scenes). Even though these<br />
results could clearly be improved when minimum noise fracti<strong>on</strong> (MNF) transformed data and MNF<br />
transformed image spectra were used, this c<strong>on</strong>flicted with the required automati<strong>on</strong> of the algorithm.<br />
Untransformed PMA results combined with thermal post-processing were c<strong>on</strong>sidered sufficient to<br />
extract <str<strong>on</strong>g>coal</str<strong>on</strong>g> automatically.<br />
The PMA analysis for the extracti<strong>on</strong> of dense vegetati<strong>on</strong> shows producers accuracies between 67.33<br />
and 91.03 % for pixels with a fracti<strong>on</strong> exceeding 85 %. The exclusi<strong>on</strong> of vegetati<strong>on</strong> within <str<strong>on</strong>g>areas</str<strong>on</strong>g><br />
delineated as <str<strong>on</strong>g>coal</str<strong>on</strong>g> <str<strong>on</strong>g>fire</str<strong>on</strong>g> <str<strong>on</strong>g>risk</str<strong>on</strong>g> <str<strong>on</strong>g>areas</str<strong>on</strong>g> is therefore feasible.<br />
PMA analysis for the mapping of pyrometamorphic rocks encounters the same problems as analysis<br />
with the knowledge-<str<strong>on</strong>g>based</str<strong>on</strong>g> <strong>spectral</strong> <strong>test</strong> sequence. However, with PMA the problem is aggravated. Not<br />
<strong>on</strong>ly is the algorithm comparing prototype spectra to a large number of pixel spectra of which less than<br />
0.000001 % match the prototype. The reference spectrum is furthermore not c<strong>on</strong>sidered as <strong>spectral</strong>ly<br />
extreme and is therefore a mixture itself. Hence, other pixels are mistakenly mapped as<br />
pyrometamophic rock. Although producer’s accuracies are 100%, also from PMA analysis it is<br />
c<strong>on</strong>cluded that the fully automated mapping of pyrometamorphic rock is not feasible at present.<br />
Both algorithms have the advantage that no user interacti<strong>on</strong> is required for the mapping of surfaces.<br />
Once a <strong>spectral</strong> <strong>test</strong> sequence has been defined, the algorithm can run <strong>on</strong> a number of scenes acquired<br />
at different times and for different regi<strong>on</strong>s without any analyst interacti<strong>on</strong>. Also the results are<br />
reproducible in the sense that the result will be the same for identical images. The same applies for<br />
partial unmixing. Once the satellite data has been thoroughly calibrated and radiometrically<br />
preprocessed, the unmixing procedure with similar reference spectra yielded identical results. If<br />
representative prototype spectra for the surfaces of interest exist, partial unmixing can be employed for<br />
different time steps and different regi<strong>on</strong>s as well as for multi sensor data.<br />
The two approaches show clear advantages over standard feature extracti<strong>on</strong> and classificati<strong>on</strong><br />
techniques such as maximum likelihood classificati<strong>on</strong>, unsupervised classificati<strong>on</strong> or object oriented<br />
classificati<strong>on</strong>. These techniques all demand extensive analyst input in the form of training <str<strong>on</strong>g>areas</str<strong>on</strong>g>, class<br />
definiti<strong>on</strong>, the definiti<strong>on</strong> of hierarchies or segmentati<strong>on</strong> levels. Therefore they are not suited for the<br />
design of fully automated algorithms.<br />
5. Especially the first knowledge-<str<strong>on</strong>g>based</str<strong>on</strong>g> <strong>test</strong> sequence approach programmed in IDL (Interactive data<br />
Language, RSI) can be combined easily with the thermal algorithm developed by ZHANG, J. (2004),<br />
which was also programmed in IDL. The fully automated implementati<strong>on</strong> of the partial unmixing<br />
approach in IDL is still <strong>on</strong>going and more challenging. However, it is expected to be completed so<strong>on</strong>.<br />
Both algorithms for <str<strong>on</strong>g>coal</str<strong>on</strong>g> <str<strong>on</strong>g>fire</str<strong>on</strong>g> <str<strong>on</strong>g>risk</str<strong>on</strong>g> area demarcati<strong>on</strong> can run independently from each other. They can<br />
furthermore run independently from the thermal algorithm.<br />
To separate <str<strong>on</strong>g>coal</str<strong>on</strong>g> <str<strong>on</strong>g>fire</str<strong>on</strong>g> related thermal anomalies from false alarm thermal anomalies, the output image<br />
resulting from the thermal algorithm (0 = no thermal anomaly, 1 = thermal anomaly with > 75%<br />
probability to be <str<strong>on</strong>g>coal</str<strong>on</strong>g> <str<strong>on</strong>g>fire</str<strong>on</strong>g> related), is intersected with the result of automated <str<strong>on</strong>g>coal</str<strong>on</strong>g> <str<strong>on</strong>g>fire</str<strong>on</strong>g> <str<strong>on</strong>g>risk</str<strong>on</strong>g> area<br />
demarcati<strong>on</strong>. Anomalies located outside the demarcated <str<strong>on</strong>g>areas</str<strong>on</strong>g> are assigned a low likelihood to be <str<strong>on</strong>g>coal</str<strong>on</strong>g><br />
<str<strong>on</strong>g>fire</str<strong>on</strong>g>s. Anomalies within the demarcated regi<strong>on</strong>s are given a higher likelihood. This is expressed in the<br />
pixel value and color coding. It is important to not delete any thermal anomaly extracted completely.<br />
- 223 -
For all <str<strong>on</strong>g>areas</str<strong>on</strong>g> studied the demarcated <str<strong>on</strong>g>risk</str<strong>on</strong>g> <str<strong>on</strong>g>areas</str<strong>on</strong>g> and the two types of thermal anomalies are presented in<br />
13 maps. It is more useful to leave all extracted anomalies in the final output (the map) and highlight<br />
the probable <str<strong>on</strong>g>coal</str<strong>on</strong>g> <str<strong>on</strong>g>fire</str<strong>on</strong>g> related anomalies. The accidental removal of an anomaly, which might be <str<strong>on</strong>g>coal</str<strong>on</strong>g><br />
<str<strong>on</strong>g>fire</str<strong>on</strong>g> related or which might be of importance for the local authorities for other reas<strong>on</strong>s should be<br />
avoided.<br />
Since the algorithm of ZHANG, J. (2004) employs raw DN values and does not apply atmospheric or<br />
radiometric correcti<strong>on</strong>s the algorithms cannot work with the same input data sets. This however is not<br />
critical. It is very important though that both data sets have the same geometric characteristics. This<br />
means that orthorectificati<strong>on</strong> is required for both inputs to guarantee the spatial comparability of<br />
scenes. In additi<strong>on</strong> the thermal algorithm can be modified easily to work <strong>on</strong> calibrated temperature<br />
image data also. Therefore, the algorithms can be combined to <strong>on</strong>e in the future.<br />
6. The first successful discovery of formerly unknown <str<strong>on</strong>g>coal</str<strong>on</strong>g> <str<strong>on</strong>g>fire</str<strong>on</strong>g>s using remote sensing data exclusively<br />
proves that the combined approach of automated <str<strong>on</strong>g>coal</str<strong>on</strong>g> <str<strong>on</strong>g>fire</str<strong>on</strong>g> area demarcati<strong>on</strong> and thermal anomaly<br />
detecti<strong>on</strong> is successful. This supports the creati<strong>on</strong> of an operati<strong>on</strong>al detecti<strong>on</strong> and m<strong>on</strong>itoring system<br />
for <str<strong>on</strong>g>coal</str<strong>on</strong>g> <str<strong>on</strong>g>fire</str<strong>on</strong>g>s in large <str<strong>on</strong>g>areas</str<strong>on</strong>g> of northern China. It could be dem<strong>on</strong>strated that the demarcati<strong>on</strong> of <str<strong>on</strong>g>coal</str<strong>on</strong>g><br />
<str<strong>on</strong>g>fire</str<strong>on</strong>g> <str<strong>on</strong>g>areas</str<strong>on</strong>g> and possible <str<strong>on</strong>g>coal</str<strong>on</strong>g> <str<strong>on</strong>g>fire</str<strong>on</strong>g> <str<strong>on</strong>g>risk</str<strong>on</strong>g> <str<strong>on</strong>g>areas</str<strong>on</strong>g> can substantially reduce the spatial area in which thermal<br />
investigati<strong>on</strong>s are necessary. An average of <strong>on</strong>ly 9.8 % of the ETM+ input data set are c<strong>on</strong>sidered<br />
relevant for the detecti<strong>on</strong> of thermal anomalies related to <str<strong>on</strong>g>coal</str<strong>on</strong>g> <str<strong>on</strong>g>fire</str<strong>on</strong>g>s. For the full scene 129/33<br />
(covering both study <str<strong>on</strong>g>areas</str<strong>on</strong>g>) <strong>on</strong>ly 1.5 % of the entire area is c<strong>on</strong>sidered of relevance for <str<strong>on</strong>g>coal</str<strong>on</strong>g> <str<strong>on</strong>g>fire</str<strong>on</strong>g><br />
investigati<strong>on</strong>s. For scene (128/032) of Baotou 0.59 % of the input data set area are extracted as a<br />
probable <str<strong>on</strong>g>coal</str<strong>on</strong>g> <str<strong>on</strong>g>fire</str<strong>on</strong>g> regi<strong>on</strong>. For scene (098/081) c<strong>on</strong>taining the Leigh Creek mining regi<strong>on</strong> 1.46 % were<br />
delineated. In India <strong>on</strong>ly 1.48 % of the spatial extent of the input data set 140/044) remain.<br />
To evaluate the combinati<strong>on</strong> of the thermal anomaly detecti<strong>on</strong> algorithm developed by ZHANG, J.<br />
(2004) and the demarcati<strong>on</strong> algorithm presented here, six scenes were processed. For the whole area<br />
covered by ETM+ scene nighttime scene (226/211) 451 thermal anomalies were extracted by the<br />
thermal algorithm. 243 of these (ca. 50%) are located outside the demarcated <str<strong>on</strong>g>coal</str<strong>on</strong>g> <str<strong>on</strong>g>fire</str<strong>on</strong>g> <str<strong>on</strong>g>areas</str<strong>on</strong>g>. These<br />
anomalies are not likely to be <str<strong>on</strong>g>coal</str<strong>on</strong>g> <str<strong>on</strong>g>fire</str<strong>on</strong>g> related. For all other daytime scenes between 1334 and 10,911<br />
thermal anomalous clusters were extracted. This numbers could be reduced by over 80 % <strong>on</strong> average.<br />
7. A major advantage of the multi<strong>spectral</strong> algorithm for <str<strong>on</strong>g>coal</str<strong>on</strong>g> <str<strong>on</strong>g>fire</str<strong>on</strong>g> <str<strong>on</strong>g>risk</str<strong>on</strong>g> area demarcati<strong>on</strong> is the fact that<br />
<str<strong>on</strong>g>risk</str<strong>on</strong>g> <str<strong>on</strong>g>areas</str<strong>on</strong>g> can be mapped, even if thermal anomalies have not yet developed. Maps of scale 1:100000<br />
and 1:200,000 were generated for the study <str<strong>on</strong>g>areas</str<strong>on</strong>g> Wuda and Ruqigou / Gulaben, their surrounding, the<br />
broader area of Baotou as well as for transfer <str<strong>on</strong>g>areas</str<strong>on</strong>g> in India and Australia. These <str<strong>on</strong>g>coal</str<strong>on</strong>g> <str<strong>on</strong>g>fire</str<strong>on</strong>g> <str<strong>on</strong>g>risk</str<strong>on</strong>g> maps<br />
display the extracted <str<strong>on</strong>g>coal</str<strong>on</strong>g> surfaces, automatically generated <str<strong>on</strong>g>coal</str<strong>on</strong>g> <str<strong>on</strong>g>fire</str<strong>on</strong>g> <str<strong>on</strong>g>risk</str<strong>on</strong>g> <str<strong>on</strong>g>areas</str<strong>on</strong>g> and detected thermal<br />
anomalies. They can be extended through the intersecti<strong>on</strong> with additi<strong>on</strong>al informati<strong>on</strong>. Relevant<br />
parameters within the delineated z<strong>on</strong>es are the <str<strong>on</strong>g>coal</str<strong>on</strong>g>’s susceptibility to sp<strong>on</strong>taneous combusti<strong>on</strong>, the<br />
degree of mining activity, infrastructure density, <str<strong>on</strong>g>coal</str<strong>on</strong>g> seam accessibility and other parameters.<br />
The outlined <str<strong>on</strong>g>risk</str<strong>on</strong>g> <str<strong>on</strong>g>areas</str<strong>on</strong>g> c<strong>on</strong>stitute locati<strong>on</strong>s to be closely m<strong>on</strong>itored in the future. When a new thermal<br />
anomaly is detected within the delineated <str<strong>on</strong>g>areas</str<strong>on</strong>g> of <str<strong>on</strong>g>coal</str<strong>on</strong>g> <str<strong>on</strong>g>fire</str<strong>on</strong>g> <str<strong>on</strong>g>risk</str<strong>on</strong>g> a field check by local authorities is<br />
recommended.<br />
- 224 -
Areas in the Wuda and Ruqigou / Gulaben surrounding, which are recommended to be kept under<br />
close observati<strong>on</strong>, are:<br />
• UL: 4398000 N, 658000 E, LR: 4390000 N, 664000 E<br />
• UL: 4384000 N, 662000 E, LR: 4364000N, 672000 E<br />
• UL: 4358000 N, 634000 E, LR: 4340000N, 646000 E<br />
• UL: 4370000 N, 674000 E, LR: 4362000N, 680000 E<br />
• UL: 4350000 N, 616000 E, LR: 4336000N, 624000 E, (all UTM, Z<strong>on</strong>e 48 North, WGS 84)<br />
M<strong>on</strong>itoring <str<strong>on</strong>g>coal</str<strong>on</strong>g> <str<strong>on</strong>g>fire</str<strong>on</strong>g> <str<strong>on</strong>g>risk</str<strong>on</strong>g> <str<strong>on</strong>g>areas</str<strong>on</strong>g> can enable a rapid resp<strong>on</strong>se to <str<strong>on</strong>g>coal</str<strong>on</strong>g> <str<strong>on</strong>g>fire</str<strong>on</strong>g>s at their initial stage. Coal <str<strong>on</strong>g>fire</str<strong>on</strong>g><br />
fighting at the initial stage increases the probability to c<strong>on</strong>trol and extinguish the <str<strong>on</strong>g>fire</str<strong>on</strong>g> it with low effort.<br />
11.2 Outlook<br />
The results presented in this thesis str<strong>on</strong>gly suggest that an automated <str<strong>on</strong>g>coal</str<strong>on</strong>g> <str<strong>on</strong>g>fire</str<strong>on</strong>g> area demarcati<strong>on</strong>, <str<strong>on</strong>g>coal</str<strong>on</strong>g><br />
<str<strong>on</strong>g>fire</str<strong>on</strong>g> detecti<strong>on</strong> and m<strong>on</strong>itoring <strong>on</strong> a large spatial scale can be achieved applying the algorithms<br />
developed.<br />
Unfortunately, the recent failure of Landsat-7 ETM+ in May 2003 is of c<strong>on</strong>cern for most <str<strong>on</strong>g>coal</str<strong>on</strong>g> <str<strong>on</strong>g>fire</str<strong>on</strong>g><br />
scientists. However, it could be dem<strong>on</strong>strated that the methods applied and the algorithms developed<br />
can work <strong>on</strong> multi sensor data and are easily transferable to different spatial and <strong>spectral</strong> resoluti<strong>on</strong>s.<br />
With respect to a l<strong>on</strong>g term m<strong>on</strong>itoring c<strong>on</strong>cept it is important to keep automated methods as flexible<br />
as possible.<br />
Currently, the Aster sensor is fully sufficient for <str<strong>on</strong>g>coal</str<strong>on</strong>g> <str<strong>on</strong>g>fire</str<strong>on</strong>g> analysis. Analyses of this data with the<br />
algorithms developed can be framed by other data as so<strong>on</strong> as it is available. A follow <strong>on</strong> missi<strong>on</strong> of<br />
ETM+ or the thermal satellite Bird are under discussi<strong>on</strong>. Furthermore, analyses can be supported by<br />
high spatial resoluti<strong>on</strong> data of Quickbird or Ik<strong>on</strong>os imagery. Also the MODIS sensor with a pre-dawn<br />
overpass time (5:00 am) <strong>on</strong> the platform AQUA and a daytime overpass <strong>on</strong> the platform TERRA<br />
might enable the detecti<strong>on</strong> of very hot <str<strong>on</strong>g>fire</str<strong>on</strong>g>s. Obtaining several acquisiti<strong>on</strong>s within <strong>on</strong>e day is an<br />
advantage no other sensor can offer. Furthermore, <strong>test</strong>s <strong>on</strong> thermal Envisat AATSR data are currently<br />
pursued.<br />
Still a lot of remote sensing <str<strong>on</strong>g>based</str<strong>on</strong>g> <str<strong>on</strong>g>coal</str<strong>on</strong>g> <str<strong>on</strong>g>fire</str<strong>on</strong>g> research has to be undertaken <strong>on</strong> a regi<strong>on</strong>al and local scale.<br />
Current investigati<strong>on</strong>s focus <strong>on</strong> the analysis of hyper<strong>spectral</strong> Hyperi<strong>on</strong> data (30m spatial resoluti<strong>on</strong>,<br />
>200 <strong>spectral</strong> bands). This data is of interest for the more accurate extracti<strong>on</strong> of pyrometamorphic<br />
rock. Furthermore, <str<strong>on</strong>g>coal</str<strong>on</strong>g> types of different sulfur c<strong>on</strong>tent might be differentiable. This would allow a<br />
remote sensing <str<strong>on</strong>g>based</str<strong>on</strong>g> mapping of <str<strong>on</strong>g>coal</str<strong>on</strong>g> types with different susceptibility for sp<strong>on</strong>taneous combusti<strong>on</strong>.<br />
However, hyper<strong>spectral</strong> data presently is expensive to acquire and covers <strong>on</strong>ly a very limited spatial<br />
area. Therefore such studies currently <strong>on</strong>ly serve a purely scientific interest. It is not assumed that<br />
hyper<strong>spectral</strong> data will play a key role in <str<strong>on</strong>g>coal</str<strong>on</strong>g> <str<strong>on</strong>g>fire</str<strong>on</strong>g> remote sensing for large scale approaches.<br />
The further improvement of the <str<strong>on</strong>g>coal</str<strong>on</strong>g> <str<strong>on</strong>g>fire</str<strong>on</strong>g> area demarcati<strong>on</strong> algorithm presented here may lead to<br />
results at a more detailed scale. Additi<strong>on</strong>al and reliable GIS data <strong>on</strong> <str<strong>on</strong>g>coal</str<strong>on</strong>g> bearing regi<strong>on</strong>s, mining<br />
operati<strong>on</strong>s, populati<strong>on</strong> density, infrastructure density, climate and many more could support the<br />
generati<strong>on</strong> of a <str<strong>on</strong>g>coal</str<strong>on</strong>g> <str<strong>on</strong>g>fire</str<strong>on</strong>g> <str<strong>on</strong>g>risk</str<strong>on</strong>g> index map for entire China.<br />
- 225 -
A l<strong>on</strong>g term study for a larger number of <str<strong>on</strong>g>coal</str<strong>on</strong>g> <str<strong>on</strong>g>fire</str<strong>on</strong>g> <str<strong>on</strong>g>areas</str<strong>on</strong>g> should be undertaken to investigate the<br />
influence of <str<strong>on</strong>g>coal</str<strong>on</strong>g> <str<strong>on</strong>g>fire</str<strong>on</strong>g>s <strong>on</strong> regi<strong>on</strong>al atmospheric c<strong>on</strong>diti<strong>on</strong>s. It is assumed that the rapid spatial spread of<br />
<str<strong>on</strong>g>coal</str<strong>on</strong>g> <strong>on</strong> the surface al<strong>on</strong>e, which leads to a decrease in overall regi<strong>on</strong>al albedo, might influence the<br />
thermal pattern of an area.<br />
On a China-wide and global scale, the evaluati<strong>on</strong> of Kyoto relevant green-house gas emissi<strong>on</strong>s<br />
released by the <str<strong>on</strong>g>fire</str<strong>on</strong>g>s is c<strong>on</strong>sidered of high relevance c<strong>on</strong>cerning future <str<strong>on</strong>g>coal</str<strong>on</strong>g> <str<strong>on</strong>g>fire</str<strong>on</strong>g> research. The protocol<br />
obliges industrialized nati<strong>on</strong>s to cut their emissi<strong>on</strong>s by 5% <strong>on</strong> average below the levels of 1990 during<br />
the first commitment period between 2008 and 2012 (ROSENQVIST et al. 2003, WAGNER 2003). The<br />
magnitude of the <str<strong>on</strong>g>coal</str<strong>on</strong>g> <str<strong>on</strong>g>fire</str<strong>on</strong>g> problem in China becomes apparent keeping the first estimate of a 0.1 % -<br />
0.2 % c<strong>on</strong>tributi<strong>on</strong> to the annual global human induced CO 2 emissi<strong>on</strong>s in mind. Within the Kyoto<br />
Protocol emissi<strong>on</strong>s of the six greenhouse gasses (measured in terms of CO 2 equivalents) carb<strong>on</strong><br />
dioxide (CO 2 ), methane (CH 4 ), nitrous oxides (N 2 O), hydrofluorocarb<strong>on</strong>s (HFCs), perfluorocarb<strong>on</strong>s<br />
(PFCs) and sulphur hexafluoride(SF 6 ) are c<strong>on</strong>sidered most relevant for the assessment of possibly<br />
human influenced global climate change (ROSENQVIST et al. 2003). Especially the first three gasses<br />
are emitted by <str<strong>on</strong>g>coal</str<strong>on</strong>g> <str<strong>on</strong>g>fire</str<strong>on</strong>g>s.<br />
Three steering mechanisms are introduced within the Kyoto Protocol. They all aim at the reducti<strong>on</strong> of<br />
greenhouse gas emissi<strong>on</strong>s into the atmosphere. The Clean Development Mechanism (CDM) allows<br />
industrialized nati<strong>on</strong>s (Annex I nati<strong>on</strong>s) to earn credits for investments in developing countries. The<br />
Joint Implementati<strong>on</strong> Mechanism (JI) encourages the investment of industrialized countries in other<br />
industrialized Annex I nati<strong>on</strong>s, to receive credits when lower emissi<strong>on</strong>s result. Furthermore, the<br />
general trade with greenhouse relevant emissi<strong>on</strong>s will increase str<strong>on</strong>gly in the near future (WAGNER<br />
2003, ROSENQVIST et al. 2003).<br />
Even today, several European <str<strong>on</strong>g>coal</str<strong>on</strong>g> mining companies show interest in the <str<strong>on</strong>g>coal</str<strong>on</strong>g> <str<strong>on</strong>g>fire</str<strong>on</strong>g> problem in China.<br />
To extinguish a <str<strong>on</strong>g>coal</str<strong>on</strong>g> <str<strong>on</strong>g>fire</str<strong>on</strong>g> in China may be a cheap way of receiving credits for the reducti<strong>on</strong> of CO 2<br />
emissi<strong>on</strong>s. To achieve reducti<strong>on</strong>s in the industrialized high-wage home country equivalent to these<br />
achieved by the extincti<strong>on</strong> of a few <str<strong>on</strong>g>coal</str<strong>on</strong>g> <str<strong>on</strong>g>fire</str<strong>on</strong>g>s would probably be much more cost intensive. This<br />
scenario can of course be discussed intensively.<br />
Currently, the dynamic modeling of the subsurface burning process, the estimati<strong>on</strong> of the amounts of<br />
<str<strong>on</strong>g>coal</str<strong>on</strong>g> being burned, research <strong>on</strong> the burning efficiency as well as <strong>on</strong> the gaseous emissi<strong>on</strong> products are<br />
undertaken within the geoscientific Sino-German Coal Fire Research Initiative. Combining the results<br />
of the different research disciplines can lead to a quantificati<strong>on</strong> of <str<strong>on</strong>g>coal</str<strong>on</strong>g> <str<strong>on</strong>g>fire</str<strong>on</strong>g> induced emissi<strong>on</strong>s <strong>on</strong> a<br />
country wide scale. Furthermore, the estimati<strong>on</strong> of resource loss and calculati<strong>on</strong>s <strong>on</strong> the <str<strong>on</strong>g>coal</str<strong>on</strong>g> <str<strong>on</strong>g>fire</str<strong>on</strong>g><br />
related c<strong>on</strong>tributi<strong>on</strong> to the annual green-house gas budget will be feasible.<br />
The final extincti<strong>on</strong> of the <str<strong>on</strong>g>fire</str<strong>on</strong>g>s should always be c<strong>on</strong>sidered the final goal of all <str<strong>on</strong>g>coal</str<strong>on</strong>g> <str<strong>on</strong>g>fire</str<strong>on</strong>g> research.<br />
This should not <strong>on</strong>ly be motivated by the m<strong>on</strong>etary benefits of possible emissi<strong>on</strong> trades or the<br />
protecti<strong>on</strong> of a valuable ec<strong>on</strong>omic resource. The extincti<strong>on</strong> of the <str<strong>on</strong>g>fire</str<strong>on</strong>g>s will clearly improve the living-,<br />
health-, and safety c<strong>on</strong>diti<strong>on</strong>s of the local inhabitants in <str<strong>on</strong>g>coal</str<strong>on</strong>g> <str<strong>on</strong>g>fire</str<strong>on</strong>g> regi<strong>on</strong>s such as Wuda. To achieve<br />
this goal it is of utmost importance for scientists of different research disciplines to cross their<br />
disciplinary boundaries and face the challenges in a joint effort.<br />
- 226 -
12. References<br />
A …<br />
ABRAMS, M.J. & S.J. HOOK, 1995: Simulated Aster Data for Geologic Studies. In: IEEE Transacti<strong>on</strong>s<br />
<strong>on</strong> Geoscience and Remote Sensing, Vol. 33, No. 3, pp. 692-699.<br />
ABRAMS, M.J., KAHLE, A.B., PALLUCONI, F.D. & J.P. SCHIELDGE, 1984: Geologic Mapping Using<br />
Thermal Images. In: Remote Sensing of Envir<strong>on</strong>ment, Vol. 16, No. 1, pp. 13-33.<br />
ABUELGASIM, A.A., GOPAL, S., IRON, J.R. & A.H. STRAHLER, 1996: Classificati<strong>on</strong> of SA Multiangle<br />
and Multi<strong>spectral</strong> Measurements Using Artificial Neural Networks. In: Remote Sensing of<br />
Envir<strong>on</strong>ment, Vol. 57, No. 2, pp. 79-87.<br />
ABUELGASIM, A.A., ROSS, W.D., GOPAL, S. & C.E. WOODCOCK, 1999: Change detecti<strong>on</strong> using<br />
adaptive fuzzy neural networks: envir<strong>on</strong>mental damage assessment after the Gulf war. In:<br />
Remote Sensing of Envir<strong>on</strong>ment, Vol. 70, No. 2, pp. 208-223.<br />
ADAMS, J.B., SABOL, D.E., KAPOS, V., ALMEIDA FILHO, R., ROBERTS, D.A., SMITH, M.O. & A.R.<br />
GILLESPIE, 1995: Classificati<strong>on</strong> of Multi<strong>spectral</strong> Images Based <strong>on</strong> Fracti<strong>on</strong>s of Endmembers:<br />
Applicati<strong>on</strong> to Land-Cover Change in the Brazilian Amaz<strong>on</strong>. In: Remote Sensing of<br />
Envir<strong>on</strong>ment, Vol. 52, No. 2, pp. 137-154.<br />
ANDRÉFOUET, S., MULLER-KARGER, F.E., HOCHBERG, E.J., HU, C. & K.L. CARDER, 2001: Change<br />
detecti<strong>on</strong> in shallow coral reef envir<strong>on</strong>ment using Landsat 7 ETM+ data. In: Remote Sensing of<br />
Envir<strong>on</strong>ment, Vol. 78, No. 1-2, pp. 150-162.<br />
ARANUVACHAPUN, S., 1983: Variati<strong>on</strong> of Atmospheric Optical Depth for Remote Sensing Radiance<br />
Calculati<strong>on</strong>s. In: Remote Sensing of Envir<strong>on</strong>ment, Vol. 13, No. 2, pp. 131-147.<br />
ARVIDSON, T., J. GASCH & S.N. GOWARD, 2001: Landsat 7’s L<strong>on</strong>g Term Acquisiti<strong>on</strong> Plan – an<br />
innovative approach to building a global imagery archive. Remote Sensing of the Envir<strong>on</strong>ment,<br />
Vol. 78, No. 1, pp. 13-26.<br />
ASNER, G.P. & K.B. HEIDEBRECHT, 2003: Imaging Spectroscopy for desertificati<strong>on</strong> Studies:<br />
Comparing AVIRIS and EO-1 Hyperi<strong>on</strong> in Argentina Drylands. In: IEEE Transacti<strong>on</strong>s <strong>on</strong><br />
Geoscience and Remote Sensing, Vol. 41, No. 6, pp. 1283-1294.<br />
ATZBERGER, C., 2002: Remote sensing through the atmosphere – Physical principles and effects.<br />
unpublished manuscript, University of Trier, Germany, 7 pp.<br />
B …<br />
BACHMANN, M., 2002: Evaluati<strong>on</strong> of Image Fusi<strong>on</strong> Techniques for Large-Scale Mapping of N<strong>on</strong>-<br />
Green Vegetati<strong>on</strong>. Example: Barrax, Spain. Master thesis at the German Remote Sensing Data<br />
Center and the Technical University of Dresden, -Dresden, Germany, 150 pp.<br />
BAHRENBERG, G., GIESE, E. & J. NIPPER, 1990: Statistische Methoden in der Geographie. Teubner. –<br />
Stuttgart, Germany, 232 pp.<br />
- 227 -
BAMLER, R., M. EINEDER, M. SCHWÄBISCH & A. ROTH 1996: SAR-Interferometrie – Sensoren,<br />
System und Produkte. In: DECH, S. & W. METT (editors): Tagungsband: 13. Nutzerseminar des<br />
DFD der DLR. –Oberpfaffenhofen, Germany, pp. 37-42.<br />
BANDELOW, K.-F., 2003: Pers<strong>on</strong>al Interview <strong>on</strong> August 5 th 2003. Dr. Bandelow is head of the<br />
department of mining and geology at the German M<strong>on</strong>tane Technology (DMT).<br />
BANERJEE S.C., 1982: A theoretical design to the determinati<strong>on</strong> of <str<strong>on</strong>g>risk</str<strong>on</strong>g> index of sp<strong>on</strong>taneous <str<strong>on</strong>g>fire</str<strong>on</strong>g>s in<br />
<str<strong>on</strong>g>coal</str<strong>on</strong>g> mines. In: Journal of Mines, Metals and Fuels, Vol. 30, pp. 399-406.<br />
BANERJEE S.C., 1985: Sp<strong>on</strong>taneous Combusti<strong>on</strong> of Coal and Mine Fires. –Rotterdam, Netherlands,<br />
168 pp.<br />
BANERJEE S.C., NANDY D.K., BANERJEE, D.D. & R.N. CHAKRAVORTY, 1972: Classificati<strong>on</strong> of <str<strong>on</strong>g>coal</str<strong>on</strong>g><br />
with respect to their susceptibility to sp<strong>on</strong>taneous combusti<strong>on</strong>. In: Transacti<strong>on</strong>s of the Mining<br />
and Metallurgical Institute of India, Vol. 59(2), pp. 15-31.<br />
BARAL, D.J. & R.P. GUPTA, 1997: Integrati<strong>on</strong> of satellite sensor data with DEM for the study of snow<br />
cover distributi<strong>on</strong> and depleti<strong>on</strong> pattern. In: Internati<strong>on</strong>al Journal of Remote Sensing, Vol. 18,<br />
No. 18, pp. 3889-3894.<br />
BATESON, A. & B. CURTISS, 1996: A Method for Manual Endmember Selecti<strong>on</strong> and Spectral<br />
Unmixing. In: Remote Sensing of Envir<strong>on</strong>ment, Vol. 55, No. 2, pp. 229-243.<br />
BAUER, T. & K. STEINOCHER, 2001: Per-parcel land use classificati<strong>on</strong> in urban <str<strong>on</strong>g>areas</str<strong>on</strong>g> applying a rule<br />
<str<strong>on</strong>g>based</str<strong>on</strong>g> technique. In: GIS, Vol. 6, pp. 24-27.<br />
BAUMGARDNER, M.F., L.F. SILVA, L.F. BIEHL, L.L. STONER, 1985: Reflectance Properties of Soils.<br />
In: BRADY, N.C. (editor): Advances in Agr<strong>on</strong>omy, 38, Academic Press, Orlando, FL, pp. 1-44<br />
BECKER, F., 1987: The impact of emissivity <strong>on</strong> the measurement of land surface temperature from a<br />
satellite. In: Internati<strong>on</strong>al Journal of Remote Sensing, Vol. 8, No. 10, pp. 1509-1522.<br />
BELCHANSKY, G. I. & D. C. DOUGLAS, 2000: Classificati<strong>on</strong> Methods for M<strong>on</strong>itoring Arctic Sea Ice<br />
Using OKEAN Passive/Active Two-Channel Microwave Data. In: Remote Sensing of<br />
Envir<strong>on</strong>ment, Vol. 73, No. 3, pp. 307-322.<br />
BENEDIKTSSON, J.A. & J.R. SVEINSSON, 1997: Feature extracti<strong>on</strong> for multisource data classificati<strong>on</strong><br />
with artificial neural networks. In: Internati<strong>on</strong>al Journal of Remote Sensing, Vol. 18, No. 4, pp.<br />
727-740.<br />
BENZ, U., HOFMANN, P., WILLHAUCK, G., LINGENFELDER, I. & M. HEYNEN, 2004: Multi-resoluti<strong>on</strong><br />
object oriented fuzzy analysis of remote sensing data for GIS ready informati<strong>on</strong>. In:<br />
Photogrammetry and Remote Sensing, in press.<br />
BERK, A., BERNSTEIN, L.S. & D.C. ROBERTSON, 1989: MODTRAN: a moderate resoluti<strong>on</strong> model for<br />
LOWTRAN 7. GL-TR-89-0122, Massachusettes, USA<br />
BETHGE, P., 1999: Feuer unter China. In: Der Spiegel 44/1999, Germany, pp. 238-242<br />
BHATTACHARYA A. & C.S. REDDY, 1994: Underground and surface <str<strong>on</strong>g>coal</str<strong>on</strong>g> mine <str<strong>on</strong>g>fire</str<strong>on</strong>g> detecti<strong>on</strong> in India's<br />
Jharia <str<strong>on</strong>g>coal</str<strong>on</strong>g>field using airborne thermal infra-red data. In: Asian Pacific Remote Sensing Journal.<br />
Vol. 7, pp. 59-73.<br />
- 228 -
BHATTACHARYA, A., REDDY S. & T.K. MUKHERJEE, 1991: Multi-tir remote sensing data analyses for<br />
<str<strong>on</strong>g>coal</str<strong>on</strong>g> <str<strong>on</strong>g>fire</str<strong>on</strong>g> mapping in Jharia <str<strong>on</strong>g>coal</str<strong>on</strong>g>field of Bihar, India. In: Proceedings of the 12th Asian<br />
C<strong>on</strong>ference <strong>on</strong> Remote Sensing. Singapore, 30 Oct. – 5 Nov. 1991, pp. 221-226.<br />
BLOM, R. & M. DAILY, 1982: Radar Image processing for Rock-Type Discriminati<strong>on</strong>. In: IEEE<br />
Transacti<strong>on</strong>s <strong>on</strong> Geoscience and Remote Sensing, Vol. GE-20, No. 3, pp. 343-351.<br />
BOARDMAN, J.W., KRUSE, F.A. & R.O. GREEN: Mapping target signature via partial unmixing of<br />
Aviris data. Internal report at Center for the Study of the Earth from Space, University of<br />
Colorado, Boulder, USA, report CO 80309-0216, pp. 23-26.<br />
BOEKEMEIER R., WANG, H, ZHU, L. & S. ELLERINGMANN 2002: Hoellenfahrt durch China. In: GEO,<br />
9, 2003. – Hamburg, Germany, pp. 21-29.<br />
BOREL, C.C. & S.A. GERSTL, 1994: N<strong>on</strong>linear Spectral Mixing Models for Vegetative and Soil<br />
Surfaces. In. Remote Sensing of Envir<strong>on</strong>ment, Vol. 47, No. 3, pp. 403-416.<br />
BRADY, N.C. & R.R. WEIL 1996: The nature and properties of soils. – New Jersey, USA, 881 pp.<br />
BROWN DE COLSTOUN, E.C., STORY, M.H., THOMPSON, C., COMMISSO, K., SMITH, T.G. & J.R. IRONS,<br />
2003: Nati<strong>on</strong>al Park vegetati<strong>on</strong> mapping using multitemporal Landsat 7 data and a decisi<strong>on</strong> tree<br />
classifier. In: Remote Sensing of Envir<strong>on</strong>ment, Vol. 85, No. 3, pp. 316-327.<br />
BRYANT, R., MORAN, M.S., MCELROY, S.A., HOLIFELD, C., THOME, K.J., TOMOKAI, M. & S.F.<br />
BIGGAR, 2003: Data C<strong>on</strong>tinuity of Earth Observing 1 (EO-1) Advanced Land Imager (ALI) and<br />
Landsat TM and ETM+. In: IEEE Transacti<strong>on</strong>s <strong>on</strong> Geoscience and Remote Sensing, Vol. 41,<br />
No. 6, pp. 1204-1212.<br />
BYLO, Z., 1960: The role of sulph<strong>on</strong>ati<strong>on</strong> in the sp<strong>on</strong>atneous igniti<strong>on</strong> of <str<strong>on</strong>g>coal</str<strong>on</strong>g>. In: Serie des Sciences<br />
Techniques, Vol. 8 (2), pp. 107-114.<br />
C …<br />
CARR, R., 1996: Spectral and textural classificati<strong>on</strong> of single and multiple band digital images. In:<br />
Computers and Geosciences, Vol. 22, No. 8, pp. 849-865.<br />
CASACCHIA, R., MAZZARINI, F., SALVATORI, R. & F. SALVINI, 1999: Rock-type discriminati<strong>on</strong> by<br />
field, TM and SPOT data, Tarn Flat, Antartica. In: Internati<strong>on</strong>al Journal of Remote Sensing,<br />
Vol. 20, No. 2, pp. 403-420.<br />
CHAIKEN, R.F., BRENNAN, R.J., HEISEY, B.S., KIM, A.G., MALENKA, W.T. & J.T. SCHIMMEL, 1998:<br />
Problems in the C<strong>on</strong>trol of Anthracite Mine Fires: A Case Study of the Centralia Mine Fire.<br />
Report of Investigati<strong>on</strong>s 8799 of the United States Department of the Interior. –Pittsburgh,<br />
USA, 68 pp.<br />
CHAVEZ, P.S., 1996: Image-Based Atmospheric Correcti<strong>on</strong>s – Revisited and Improved. In:<br />
Photogrammetric Engineering & Remote Sensing, Vol.62, No. 9, pp. 1025-1036.<br />
CHEN, K.S., Y.C.TZENG, C.F. CHEN & W.L. KAO (1995): Land-Cover Classificati<strong>on</strong> of Multi<strong>spectral</strong><br />
Imagery Using a Dynamic Neural Network. In: Photogrammetric Engineering and Remote<br />
Sensing, Vol. 61, No.4, 1995, pp. 403-408.<br />
- 229 -
CHEN, Liding, 1997: Subsidence Assessment in the Ruqigou Coalfield, Ningxia, China, using a<br />
Geomorphological Approach. Master thesis at ITC, Enschede, Netherlands, pp. 130.<br />
CIHLAR, J. (2000): Land cover mapping of large <str<strong>on</strong>g>areas</str<strong>on</strong>g> from satellites: status and research priorities. In:<br />
Internati<strong>on</strong>al Journal of Remote Sensing, Vol. 21, No.6&7, pp. 1093-1114.<br />
CIHLAR, J., QINGHAN, X., CHEN, J., BEAUBIEN, J., FUNG, K. & R. LATIFOVIC, 1998: Classificati<strong>on</strong> by<br />
progressive generalizati<strong>on</strong>: a new automated methodology for remote sensing multichannel<br />
data. In: Internati<strong>on</strong>al Journal of Remote Sensing, Vol. 19, No. 14, pp. 2685-2704.<br />
CLARK, R.N., 1999: Spectroscopy of Rocks and Minerals and Principles of Spectroscopy. In: RENZ,<br />
A.N. (editor): Remote Sensing for the Earth Sciences: Manual of Remote Sensing. 3 rd editi<strong>on</strong>, -<br />
New York, pp. 189-248.<br />
CLARK, R.N. & G.A, SWAYZE, 1995: Mapping Minerals, Amorphous Materials, Envir<strong>on</strong>mental<br />
Materials, Vegetati<strong>on</strong>, Water, Ice and Snow, and Other Materials: The USGS Tricorder<br />
Algorithm. In: Summaries of the 5 th Annual JPL Airborne Earth Science Workshop, January 23-<br />
26, JPL publicati<strong>on</strong> 95-1, pp. 39-40.<br />
CLARK, R.N., A.J. GALLAGHER & G.A, SWAYZE, 1995: Material Absorpti<strong>on</strong> Band Depth Mapping of<br />
Imaging Spectrometer Data Using a Complete Band Shape Least-Squares Fit with Library<br />
Reference Spectra. In: Proceedings of the 2 nd AVIRIS Workshop, JPL Publicati<strong>on</strong> 90-54, pp.<br />
176-186.<br />
COCHRANE, M.A. & C.M. SOUZA, 1998 Linear mixture model classificati<strong>on</strong> of burned forests in the<br />
Eastern Amaz<strong>on</strong>. In: : Internati<strong>on</strong>al Journal of Remote Sensing, Vol. 19, No. 17, pp. 3433-3440.<br />
COLBY, G.D., 1991: Topographic Normalizati<strong>on</strong> in Rugged Terrain. In: Photogrammetric Engineering<br />
& Remote Sensing, Vol. 57, No. 5, pp. 531-537.<br />
COLLINS, J.B. & C.E. WOODCOCK, 1996: An assessment of several linear change detecti<strong>on</strong> techniques<br />
for mapping forest mortality using multitemporal Landsat TM data. In: Remote Sensing of<br />
Envir<strong>on</strong>ment, Vol. 56, No. 1, pp. 66-77.<br />
CONGALTON, G. & K. GREEN, 1999: Assessing the Accuracy of Remotely Sensed Data: Principles and<br />
Practices. -Boca Rat<strong>on</strong>, FL, USA, 137 pp.<br />
CONGHE, S., C.E. WOODCOCK, K.C. SETO, M.P. LENNEY & S.A. MACOMBER, 2001: Classificati<strong>on</strong> and<br />
Change Detecti<strong>on</strong> Using Landsat TM Date: When and How to Correct Atmospheric Effects?.<br />
In: Remote Sensing of the Envir<strong>on</strong>ment, Vol. 75, No. 2, pp. 230-244.<br />
CORTIJO, F. & PEREZ DE LA BLANCA, N., 1997: A comparative study of some n<strong>on</strong>-parametric <strong>spectral</strong><br />
classifiers. Applicati<strong>on</strong>s to problems with high-overlapping training sets. In: Internati<strong>on</strong>al<br />
Journal of Remote Sensing, Vol. 18, No. 6, pp. 1259-1275.<br />
COWARD, H.F., 1957: Research <strong>on</strong> sp<strong>on</strong>taneous combusti<strong>on</strong> of <str<strong>on</strong>g>coal</str<strong>on</strong>g> in mines – a review. Safety in<br />
Mines Research Establishment Research Report (SMRE), report No. 142, USA, 57 pp.<br />
CRACKNELL, A.P. & Y. XUE, 1996: Thermal inertia determinati<strong>on</strong> from space – a tutorial review. In:<br />
Internati<strong>on</strong>al Journal of Remote Sensing, Vol. 17, No. 3, pp. 431-461.<br />
CRIPPEN, R.E. (1990): Calculating the Vegetati<strong>on</strong> Index Faster. In: Remote Sensing of the<br />
Envir<strong>on</strong>ment, Vol. 9, No. 1, pp.71-73.<br />
- 230 -
CRIST, E.P. & R.C. CICONE 1984: A physically-<str<strong>on</strong>g>based</str<strong>on</strong>g> transformati<strong>on</strong> of Thematic mapper data – the<br />
TM Tasseled Cap. In: IEEE Transacti<strong>on</strong>s <strong>on</strong> Geoscience and Remote Sensing, Vol. 50, pp.<br />
1497-1503.<br />
D …<br />
DAI, S., REN, D., TANG, Y., SHAO, L. & S. LI, 2002: Distributi<strong>on</strong>, isotopic variati<strong>on</strong> and origin of<br />
sulfur in <str<strong>on</strong>g>coal</str<strong>on</strong>g>s in the Wuda <str<strong>on</strong>g>coal</str<strong>on</strong>g>field, Inner M<strong>on</strong>golia, China. In: Internati<strong>on</strong>al Journal of Coal<br />
Geology, No. 57, pp. 237-250.<br />
DANIEL, M., 1994: Chinese <str<strong>on</strong>g>coal</str<strong>on</strong>g> prospects to 2010. Internati<strong>on</strong>al Energy Agency, IEA <strong>on</strong> Coal<br />
Research –L<strong>on</strong>d<strong>on</strong>, 35 pp.<br />
DAMM, A., 1994: Anwendung spektral und geometrisch hoch auflösender Fernerkundungsdaten für<br />
stadtökologische Fragestellungen. Master thesis at the Humboldt University Berlin, 128 pp.<br />
DAVE, J.V., 1981: Influence <strong>on</strong> illuminati<strong>on</strong> and viewing geometry and atmospheric compositi<strong>on</strong> <strong>on</strong><br />
the “tasseled cap” transformati<strong>on</strong> of Landsat MSS data. In: Remote Sensing of Envir<strong>on</strong>ment,<br />
Vol. 11, No. 1, pp. 37-55.<br />
DE JONG, S., 1994: Applicati<strong>on</strong>s of Reflective Remote Sensing for Land Degradati<strong>on</strong> Studies in<br />
Mediterranean Envir<strong>on</strong>ments. Ph.D. thesis at Utrecht University, Netherlands, 250 pp.<br />
DEFRIES, R.S. & J.R.G. TOWNSHEND, 1994: NDVI-derived land-cover classificati<strong>on</strong>s at a global scale.<br />
In: Internati<strong>on</strong>al Journal of Remote Sensing, Vol. 15, No. 17, pp. 3567-3586.<br />
DENG W., WAN Y., & R. ZHAO, 2001: Detecting <str<strong>on</strong>g>coal</str<strong>on</strong>g> <str<strong>on</strong>g>fire</str<strong>on</strong>g>s with a neural network to reduce the effect<br />
of solar radiati<strong>on</strong> <strong>on</strong> Landsat Thematic Mapper thermal infrared images. In: Internati<strong>on</strong>al<br />
Journal of Remote Sensing, Vol. 22, No. 6, pp. 933-944.<br />
DEROIN, J.-P., MOTTI, E. & A. SIMONIN, 1998: A comparis<strong>on</strong> of the potential for using optical and<br />
SAR data for geological mapping in an arid regi<strong>on</strong>: the Atar site, Western Sahara, Mauritania.<br />
In: Internati<strong>on</strong>al Journal of Remote Sensing, Vol. 19, No. 6, pp. 1115-1132.<br />
DOUSSET, B., 1995: Synthetic aperture radar imaging of urban surfaces: a case study. In: IGARSS<br />
Proceedings, 10-14 th July 1995, Firenze, pp. 2092-2096.<br />
DRAKE, N.A., MACKIN, S. & J.J. SETTLE, 1999: Mapping Vegetati<strong>on</strong>, Soils, and Geology in Semiarid<br />
Shrublands Using Spectral Matching and Mixture Modeling of SWIR AVIRIS Imagery. In:<br />
Remote Sensing of Envir<strong>on</strong>ment, Vol. 68, No. 1, pp. 12-25.<br />
DRIESSEN, P.M. & R. DUDAL 1991: The major soils of the world. –Leuven, Belgium, 390 pp.<br />
E …<br />
EARTH REMOTE SENSING DATA ANALYSIS CENTER, 2000: DAR Guideline, Versi<strong>on</strong> 1.0. –Tokyo,<br />
53 pp.<br />
EARTH REMOTE SENSING DATA ANALYSIS CENTER, 2001: ASTER User’s Guide, Part I. Versi<strong>on</strong> 3.1.,<br />
42 pp.<br />
ELLYETT C.D. & A.W. FLEMING, 1974: Thermal infrared imagery of the Burning Mountain <str<strong>on</strong>g>coal</str<strong>on</strong>g> <str<strong>on</strong>g>fire</str<strong>on</strong>g>.<br />
In: Remote Sensing of Envir<strong>on</strong>ment, Vol. 3, No. 1, pp. 79-86.<br />
- 231 -
ESCH, T., 2003: Eignung eines objektorientierten Klassifikati<strong>on</strong>sverfahrens zur Gewinnung<br />
planungsrelevanter Informati<strong>on</strong>en ueber urban gepraegten Raeumen. Master thesis at the<br />
German Remote Sensing Data Center and the University of Trier, Germany, 191 pp.<br />
F …<br />
FARRAND, W.H., 1997: Identificati<strong>on</strong> and mapping of ferric oxide and oxihydroxide minerals in<br />
imaging spectrometer data of Summuitville, Colorado, U.S.A., and the surrounding San Juan<br />
Mountains. In: Internati<strong>on</strong>al Journal of Remote Sensing, Vol. 18, No. 7, pp. 1543-1552.<br />
FISHER W. & W. KNUTH, 1968: Detecti<strong>on</strong> and delineati<strong>on</strong> of subsurface <str<strong>on</strong>g>coal</str<strong>on</strong>g> <str<strong>on</strong>g>fire</str<strong>on</strong>g>s by aerial infrared<br />
scanning. In: Geological Society America, Vol. 115, pp. 67-68.<br />
FISHER, P., 1997: The Pixel: A Snare and a Delusi<strong>on</strong>. In: Internati<strong>on</strong>al Journal of Remote Sensing,<br />
Vol. 18, No. 3, pp. 679-685.<br />
FLYNN, L.P., A.J.L. HARRIS & R. WRIGHT, 2001: Improved identificati<strong>on</strong> of volcanic features using<br />
Landsat 7 ETM+. In: Remote Sensing of Envir<strong>on</strong>ment, Vol. 78, No. 2, pp. 180-193.<br />
FOODY, G.M. & D.P. COX, 1994: Sub-pixel land cover compositi<strong>on</strong> estimati<strong>on</strong> using a linear mixture<br />
model and fuzzy membership functi<strong>on</strong>s. In: Internati<strong>on</strong>al Journal of Remote Sensing, Vol. 15,<br />
No. 3, pp. 619-631.<br />
FRIEDL, M.A. & C.E. BRODLEY, 1996: Decisi<strong>on</strong> Tree Classificati<strong>on</strong> of Land Cover from Remotely<br />
Sensed Data. In: Remote Sensing of Envir<strong>on</strong>ment, Vol. 61, No. 3, pp. 399-409.<br />
FRIEDL, M.A., MCIVER, D.K., HODGES, J.C.F., ZHANG, X.Y., MUCHONEY, D., STRAHLER, A.H.,<br />
WOODCOCK, C.E., GOPAL, S., SCHNEIDER, A., COOPER, A., BACCINI, A., GAO, F. & C. SCHAAF,<br />
2002: Global land cover mapping from MODIS: algorithms and early results. In: Remote<br />
Sensing of Envir<strong>on</strong>ment, No. 83, No. 2, pp. 287-302.<br />
G …<br />
GAFFEY, S.J., MCFADDEN, L.A., NASH, D. & C.M. PIETERS 1: Ultraviolet, Visible, and Near Infrared<br />
Reflectance Spectroscopy: Laboratory Spectra of geologic Materials. In: Pieters, C.M. & P.A.J.<br />
Englert (editors): Remote Geochemical Analysis: Elemental and Mineralogical Compositi<strong>on</strong>. –<br />
New York, pp. 42-77.<br />
GANGOPADHYAY, P., 2003: Coal<str<strong>on</strong>g>fire</str<strong>on</strong>g> Detecti<strong>on</strong> and M<strong>on</strong>itoring in Wuda, North China – A Multi<strong>spectral</strong><br />
and Multi-sensor TIR Approach. Master thesis at ITC. –Enschede, Netherlands, 72 pp.<br />
GARCIÁ-HARO, F.J., GILABERT, M.A., MELIÁ, J. & M.T. YOUNIS, 1994: Estimati<strong>on</strong> of pure<br />
comp<strong>on</strong>ents spectra from <strong>spectral</strong> mixtures. In: GUYOT, G. & T. FULPIN (editors), 1994:<br />
Physical Measurements and Signatures in Remote Sensing. –Rotterdam, Netherlands, <strong>on</strong>line<br />
versi<strong>on</strong>.<br />
GARCIÁ-HARO, F.J., GILABERT, M.A., & J. MELIÁ, J., 1999: Extracti<strong>on</strong> of Endmembers from Spectral<br />
Mixtures. In: Remote Sensing of Envir<strong>on</strong>ment, Vol. 68, No. 3, pp. 237-253.<br />
- 232 -
GAVEAU, D.L.A., BALZTER, H. & S. PLUMMER, 2003: Forest woody biomass classificati<strong>on</strong> with<br />
satellite <str<strong>on</strong>g>based</str<strong>on</strong>g> radar coherence over 90000 km² in Central Siberia. In: Forest Ecology and<br />
Management. Vol. 174, No. 1-3, pp. 65-75.<br />
GEOPHYSICAL AND ENVIRONMENT CORPORATION, 1999: GER 3700 Users Handbook (unpubl.), 112<br />
pp.<br />
GIELISCH, H., 2002: Loeschung v<strong>on</strong> Kohlebraenden – Statusbericht zum GTZ Projekt. Internal<br />
unpublished report of the DMT (German M<strong>on</strong>tan Technology) <strong>on</strong> a project <strong>on</strong> <str<strong>on</strong>g>coal</str<strong>on</strong>g> <str<strong>on</strong>g>fire</str<strong>on</strong>g><br />
extincti<strong>on</strong> in China within the framework of a German GTZ project, 52 pp.<br />
GLOVER, L. 1998: Burning Beneath the Surface, In: Tribune Review, May 3, 1998, USA<br />
GOPAL, S., WOODCOCK, C.E. & A.H. STRAHLER, 1999: Fuzzy Neural Network Classificati<strong>on</strong> of<br />
Global Land Cover from 1° AVHRR Data Set. In: Remote Sensing of Envir<strong>on</strong>ment, No. 67, No.<br />
2, pp. 230-243.<br />
GOWARD, S.N., J.G. MASEK, D.L. WILLIAMS, J.R. IRONS & R.J. THOMPSON, 2001: The Landsat 7<br />
missi<strong>on</strong>. Terrestrial research and applicati<strong>on</strong>s for the 21 st century. In: Remote Sensing of<br />
Envir<strong>on</strong>ment, Vol. 78, No. 1, pp. 3-12.<br />
GREEN, A.A., BERMAN, M., SWITZER,P., & M.D. CRAIG, 1988: A transformati<strong>on</strong> for ordering<br />
multi<strong>spectral</strong> data in terms of image quality with implicati<strong>on</strong>s for noise removal. In: IEEE<br />
Transacti<strong>on</strong>s <strong>on</strong> Geoscience and Remote Sensing, Vol. 26, No. 1, pp. 65-74.<br />
GREENE G.W., MOXHAM R.M. & A.H. HARVEY, 1969: Aerial infrared surveys and borehole<br />
temperature measurements of <str<strong>on</strong>g>coal</str<strong>on</strong>g> mine <str<strong>on</strong>g>fire</str<strong>on</strong>g>s in Pennsylvania. In: Proceedings of the 6 th<br />
Symposium <strong>on</strong> Remote Sensing of Envir<strong>on</strong>ment, University of Michigan, 13-16 October 1969<br />
Institute of Science and Technology, University of Michigan, USA, pp.517-525.<br />
GREY, W.M., LUCKMANN, A.J. & D. HOLLAND, 2003: Mapping urban change in the UK using satellite<br />
radar interferometry. In: Remote Sensing of Envir<strong>on</strong>ment, Vol. 87, No. 1, pp. 16-22.<br />
GUAN, H. 1989: Applicati<strong>on</strong>s of remote sensing techniques in <str<strong>on</strong>g>coal</str<strong>on</strong>g> geology. In: Acta Geologica<br />
Sinica, Vol. 2, pp. 253-269.<br />
GUPTA, R.P. & A. PRAKASH, 1998: Reflectance aureoles associated with thermal anomalies due to<br />
subsurface mine <str<strong>on</strong>g>fire</str<strong>on</strong>g>s in the Jharia <str<strong>on</strong>g>coal</str<strong>on</strong>g>field, India. In: Internati<strong>on</strong>al Journal of Remote Sensing,<br />
Vol. 19, No. 14, pp. 2619-2622.<br />
GUYOT, G., 1990: Optical Properties of Vegetati<strong>on</strong> Canopies. – In: STEVEN, M.D. & J.A. CLARK<br />
(editors): Applicati<strong>on</strong> of Remote Sensing in Agriculture. –L<strong>on</strong>d<strong>on</strong>, pp. 19-43.<br />
H …<br />
HALIK, U., BANDELOW, F.-K. & J. SCHLUZ, 2003: Land-use and socio-ec<strong>on</strong>omic aspects of the Helan<br />
Shan in Ningxia and Inner M<strong>on</strong>golia, China. Unpublished project report of the project<br />
“Innovative technologies for the explorati<strong>on</strong>, extincti<strong>on</strong> and m<strong>on</strong>itoring of <str<strong>on</strong>g>coal</str<strong>on</strong>g> <str<strong>on</strong>g>fire</str<strong>on</strong>g>s in north<br />
China”, 56 pp.<br />
HANSEN, M.C., DEFRIES, R.S., TOWNSHEND, J.R.G. & R. SOHLBERG, 2000: Global land cover<br />
classificati<strong>on</strong> at 1km spatial resoluti<strong>on</strong> using a classificati<strong>on</strong> tree approach. In: Internati<strong>on</strong>al<br />
Journal of Remote Sensing, Vol. 21, No. 6&7, pp. 1331-1364.<br />
- 233 -
HANSEN, M.C., DUBAYAH, R., & R.S. DEFRIES, 1996: Classificati<strong>on</strong> trees: an alternative to traditi<strong>on</strong>al<br />
land cover classifiers. In: Internati<strong>on</strong>al Journal of Remote Sensing, Vol. 17, No. 5, pp. 1075-<br />
1081.<br />
HECKER, C., 2003: Assessing the Potential of MODIS/Terra Acquired Thermal Imagery in Detecting<br />
and M<strong>on</strong>itoring Coal Fires. Internal report at ITC, Enschede, Netherlands, 26 pp.<br />
HILL, J. & B. STURM, 1991: Radiometric Correcti<strong>on</strong> of multitemporal Thematic mapper data for use in<br />
agricultural land-cover classificati<strong>on</strong> and vegetati<strong>on</strong> m<strong>on</strong>itoring. In: Internati<strong>on</strong>al Journal of<br />
Remote Sensing, Vol. 12, No.7, pp. 1471-1491.<br />
HILL, J. & D. AIFADOPOOULOU, 1990: Comparative Analysis of Landsat-5 TM and SPOT HRV-1<br />
Data for Use in Multiple Sensor Approaches. In: Remote Sensing of the Envir<strong>on</strong>ment, Vol.34,<br />
No. 1, 1990, pp.55-70.<br />
HILL, J. & J. MÉGIER, 1988: Regi<strong>on</strong>al land cover and agricultural area statistics and mapping in The<br />
Département Ardèche, Franc, by use of Themtic Mapper data. In: Internati<strong>on</strong>al Journal of<br />
Remote Sensing, 1988 Vol. 9, No. 10 & 11, pp.1573-1595.<br />
HILL, J. & W. MEHL, 2003: Geo- und radiometrische Aufbereitung multi- und hyperspektraler<br />
Zeitreihen. In: Photogrammetrie, Fernerkundung, Geoinformati<strong>on</strong>, Vol. 1, pp. 7-14.<br />
HILL, J., MEHL, W. & V. RADELOFF 1995: Improved forest mapping by combining correcti<strong>on</strong>s of<br />
atmospheric and topographic effects in Landsat TM imagery, In: ASKNE (editor) 1995: Sensors<br />
and Envir<strong>on</strong>mental Applicati<strong>on</strong>s of Remote Sensing, Rotterdam, Netherlands, pp. 21-31.<br />
HILL, J., 1993a: High precisi<strong>on</strong> land cover mapping and inventory with multi-temporal earth<br />
observati<strong>on</strong> satellite data – The Ardèche Experiment. –Luxemburg, 118 pp.<br />
HILL, J., 1993b: M<strong>on</strong>itoring land degradati<strong>on</strong> and soil erosi<strong>on</strong> in Mediterranean envir<strong>on</strong>ments. In: ITC<br />
Journal No.4, Netherlands, pp. 323-331.<br />
HILL, J., 1998: Neue Wege zur geowissenschaftlichen Auswertung multispektraler<br />
Fernerkundungsdaten. In: Geographische Rundschau, Vol.50, 1998, pp.113-119.<br />
HILL, J., J. MÉGIER & H. KOHL, 1991: Land-use inventory and mapping in a mountainous area: the<br />
Ardèche experiment. In: Internati<strong>on</strong>al Journal of Remote Sensing, Vol.12, No.3, pp.445-462.<br />
HOFFMANN, J., ROTH, A., TETZLAFF, A. & S. VOIGT, 2003: Detecting <str<strong>on</strong>g>coal</str<strong>on</strong>g> <str<strong>on</strong>g>fire</str<strong>on</strong>g>s differential<br />
interferometric synthetic aperture radar. Online proceedings of the fringe workshop 2003,<br />
01.12.-05.12. 2003, Esrin, Italy.<br />
HOLZER-POPP, T., M. BITTNER, E. BORG, S.DECH, T. EBERTSEDER, B. FICHTELMANN & M.<br />
SCHROEDTER, 2002: Das automatische Atmosphärenkorrekturverfahren “Durchblick”. In:<br />
BLASCHKE, T. (editor), 2002: Fernerkundung und GIS. Neue Sensoren – Innovative Methoden.<br />
Wichmann, -Karlsruhe, pp.78-87.<br />
HOOK, S.J., GABELL, A.R., GREEN, A.A. & P.S. KEALY, 1992: A comparis<strong>on</strong> of techniques for<br />
extracting emissivity informati<strong>on</strong> from thermal infrared data for geologic studies. In: Remote<br />
Sensing of Envir<strong>on</strong>ment, Vol. 42, No. 2, pp. 123-135.<br />
HORNSTRA, T.J., MAAS, G.G. & S.M. DE JONG, 2000. Classificati<strong>on</strong> of Spectroscopical Imagery by<br />
Combining Spectral and Spatial Informati<strong>on</strong>: the SSC Method. In: proceedings of the 19 th<br />
ISPRS C<strong>on</strong>gress, Amsterdam, 16-23 July, pp. 550-558.<br />
- 234 -
HOSTERT, P., 2001: M<strong>on</strong>itoring v<strong>on</strong> Degradati<strong>on</strong>serscheinungen im europäisch-mediterranen Raum<br />
mit Methoden der Fernerkundung und GIS. Ph.D. thesis at the University of Trier, 219 pp.<br />
HUBER, R., 2001: Scene classificati<strong>on</strong> of SAR images acquired from antiparallel tracks using<br />
evidential and rule <str<strong>on</strong>g>based</str<strong>on</strong>g> fusi<strong>on</strong>. In: Image and Visi<strong>on</strong> Computing, Vol. 19, No. 13, pp. 1001-<br />
1010.<br />
HUBERT-MOY, L., COTONNEC, A., LE DU, L, CHARDIN, A. & P. PEREZ, 2001: A Comparis<strong>on</strong> of<br />
Parametric Classificati<strong>on</strong> Procedures of Remotely Sensed Data Applied at Different Landscape<br />
Units. In: Remote Sensing of Envir<strong>on</strong>ment, Vol. 75, No. 2, pp. 174-187.<br />
HUGHES, G.F., 1968: On the mean accuracy of statistical pattern recognizers. In: IEEE Transacti<strong>on</strong>s<br />
<strong>on</strong> Informati<strong>on</strong> Theory, Vol. 14, pp. 55-63.<br />
HUNT, G.R. & J.W. SALISBURY, 1970: Visible and near infrared spectra of minerals and rocks: I<br />
Silicate Minerals. In: Modern Geology, Vol. 1, pp. 283-300.<br />
HUNT, G.R. & J.W. SALISBURY, 1971: Visible and near infrared spectra of minerals and rocks: II<br />
Carb<strong>on</strong>ates. In: Modern Geology, Vol. 2, pp. 23-30.<br />
HUNT, G.R., SALISBURY, J.W. & C.J. LENHOFF, 1971: Visible and near infrared spectra of minerals<br />
and rocks: III Oxides and Hydroxides. In: Modern Geology, Vol. 2, pp. 195-205.<br />
I …<br />
J …<br />
JAEGER, E. 2003: Pers<strong>on</strong>al interviews in January 2003. E. Jaeger is Professor for botany at the<br />
University of Halle, Germany. He classified the plant samples collected during the field<br />
campaign in September 2002.<br />
JIA, J., 2001: Rangeland degradati<strong>on</strong> in Ordos Plateau, its nature and assessment. In: RALA report no.<br />
200, Beijing, pp. 87-95.<br />
JIA, Y. 2002: Pers<strong>on</strong>al interviews during the fieldwork campaign in September 2002 (Y. Jia is the<br />
chief engineer of the <str<strong>on</strong>g>coal</str<strong>on</strong>g> <str<strong>on</strong>g>fire</str<strong>on</strong>g> fighting team Wuda).<br />
JIA, Y. 2003: Pers<strong>on</strong>al interviews during the fieldwork campaign in September 2003. (Y. Jia is the<br />
chief engineer of the <str<strong>on</strong>g>coal</str<strong>on</strong>g> <str<strong>on</strong>g>fire</str<strong>on</strong>g> fighting team Wuda).<br />
K …<br />
KAHLE, A.B., GILLESPIE, A.R. & A.F.H. GOETZ, 1976: Thermal Inertia Imaging: a new geological<br />
mapping tool. In: Geophysical research Letters, Vol. 3, No. 1, pp. 26-28.<br />
KARATHANASSI, V, IOSSIFIDIS, C. & D. ROKOS, 2000: A texture <str<strong>on</strong>g>based</str<strong>on</strong>g> method for classifying build<br />
<str<strong>on</strong>g>areas</str<strong>on</strong>g> according to their density. In: Internati<strong>on</strong>al Journal of Remote Sensing, Vol. 21, No. 9, pp.<br />
1807-1823.<br />
KARTIKEYAN, B., SARKAR, A. & K.L. MAJUMDER, 1998: A segmentati<strong>on</strong> approach to classificati<strong>on</strong> of<br />
remote sensing imagery. In: Internati<strong>on</strong>al Journal of Remote Sensing, Vol. 19, No. 9, pp. 1695-<br />
1709.<br />
- 235 -
KAUFMANN, Y.J. & C. SENDRA, 1988: Algorithm for automatic atmospheric correcti<strong>on</strong>s to visible and<br />
near-IR satellite imagery. In: Internati<strong>on</strong>al Journal of Remote Sensing, Vol. 9, pp. 1357-1381.<br />
KAUTH, R.J. & G. THOMAS, 1976: The tasseled cap – a graphic descripti<strong>on</strong> of the <strong>spectral</strong>-temporal<br />
development of agricultural crops as seen by Landsat. In: Proceedings of the Symposium <strong>on</strong><br />
Machine Processing of Remotely Sensed Data 1976, Purdue University, West Lafayette,<br />
Indiana, USA, pp. 4 B41 – 4 B51.<br />
KEALY, P.S. & S.J. HOOK, 1993: Separating Temperature and Emissivity in Thermal Infrared<br />
Multi<strong>spectral</strong> Scanner Data: Implicati<strong>on</strong>s for Recovering Land Surface Temperatures. In: IEEE<br />
Transacti<strong>on</strong>s <strong>on</strong> Geoscience and Remote Sensing, Vol. 31, No. 6, pp. 1155-1164.<br />
KEMPER, T., 2003: Reflectance Spectroscopy for Mapping and M<strong>on</strong>itoring of metal Mining related<br />
C<strong>on</strong>taminati<strong>on</strong> – A Case Study of the Aznalcóllar Mining Accident, Spain. Ph.D. thesis at the<br />
University of Trier and the JRC, pp. 217.<br />
KENEA, N.H., 1997: Improved geological mapping using Landsat TM data, Southern Red Sea Hills,<br />
Sudan: PC and HIS decorrelati<strong>on</strong> stretching. In: Internati<strong>on</strong>al Journal of Remote Sensing, Vol.<br />
18, No. 6, pp. 1233-1244.<br />
KEUCHEL, J., NAUMANN, S., HEILER, M. & A. SIEGMUND, 2003: Automatic land cover analysis for<br />
Tenerife by supervised classificati<strong>on</strong> using remotely sensed data. In: Remote Sensing of<br />
Envir<strong>on</strong>ment, Vol. 86, No. 4, pp. 530-541.<br />
KIM, A.G. & R.F. CHAIKEN, 1993: Fires in Aband<strong>on</strong>ed Coal Mines and Waste Banks. Bureau of<br />
Mines Informati<strong>on</strong> Circular 9352 of the United States Department of the Interior. –Pittsburgh,<br />
USA, 58 pp.<br />
KNUTH, W.M., FISHER, W.JR. & R.W. STINGELIN, 1968: Detecti<strong>on</strong>, delineati<strong>on</strong> and m<strong>on</strong>itoring of<br />
subsurface <str<strong>on</strong>g>coal</str<strong>on</strong>g> <str<strong>on</strong>g>fire</str<strong>on</strong>g>s by aerial infrared scanning. In: Geographer HRB-Singer, Inc., a subsidiary<br />
of the Singer Company, state College, Pennsylvania, USA, pp. 877-881.<br />
KOCH, M., 2000: Geological c<strong>on</strong>trols of land degradati<strong>on</strong> as detected by remote sensing – a case study<br />
in Los M<strong>on</strong>geros, north-east Spain. In: Internati<strong>on</strong>al Journal of Remote Sensing, Vol. 21, No. 3,<br />
pp. 457-473.<br />
KOKALY, R.F., DESPAIN, D.G., CLARK, R.N. & K.E. LIVO, 2003: Mapping vegetati<strong>on</strong> in Yellowst<strong>on</strong>e<br />
Nati<strong>on</strong>al Park using <strong>spectral</strong> feature analysis of AVIRIS data. In: Remote Sensing of<br />
Envir<strong>on</strong>ment, Vol. 84, No. 3, pp. 437-456.<br />
KRAUS, K. 1988: Fernerkundung Band 1: Physikalische Grundlagen und Aufnahmetechniken. –B<strong>on</strong>n,<br />
Germany, 291 pp.<br />
KRAUS, K. 1990: Fernerkundung Band 2: Auswertung photographischer und digitaler Bilder. –B<strong>on</strong>n,<br />
Germany, 314 pp.<br />
KRESSLER, F., FRANZEN, M. & K. STEINOCHER, 2003: Automati<strong>on</strong>sgestützte Erfassung der<br />
Landnutzung in Staedten mittels objektorientierter Auswertung v<strong>on</strong> Luftbildern. In: STROBL., J.,<br />
BLASCHKE, T. & G. GRIESEBNER (editors), 2003: Angewandte Geographische<br />
Informati<strong>on</strong>sverarbeitung XV. –Salzburg, Austria, pp. 250-256.<br />
KRISHNAMURTHY, J., 1997: The evaluati<strong>on</strong> of digitally enhanced Indian Remote Sensing Satellite<br />
(IRS) data for lithological and structural mapping. In: Internati<strong>on</strong>al Journal of Remote Sensing,<br />
Vol. 18, No. 16, pp. 3409-3437.<br />
- 236 -
KRUSE, F.A., BOARDMAN, J.W. & A.B. LEFKOFF, 2000: Extracti<strong>on</strong> of Compositi<strong>on</strong>al Informati<strong>on</strong> for<br />
Trafficability Mapping from Hyper<strong>spectral</strong> Data. In: Proceedings of the SPIE Internati<strong>on</strong>al<br />
Symposium <strong>on</strong> Aerosense, 24-28 April 2000, Orlando, FL, pp. 262-273.<br />
KRUSE, F., BOARDMAN, J.W. & J.F. HUNTINGTON, 2003: Comparis<strong>on</strong> of Airborne Hyper<strong>spectral</strong> Data<br />
and EO-1 Hyperi<strong>on</strong> for Mineral Mapping. In: IEEE Transacti<strong>on</strong>s <strong>on</strong> Geoscience and Remote<br />
Sensing, Vol. 41, No. 6, pp. 1388-1400.<br />
KRUSE, F.A., KIEREIN-YOUNG, K.S. & J.W. BOARDMAN, 1990: Mineral Mapping at Cuprite, Nevada<br />
with a 63-Channel Imaging Spectrometer. In: Photogrammetric Engineering and Remote<br />
Sensing, Vol. 56, No.1, pp. 83-92.<br />
KUEMMERLE, T., 2003: Investigating the impact of livestock grazing by means of remote sensing and<br />
GIS – a case study in Northern Greece using multi-date <strong>spectral</strong> mixture analysis and cost<br />
surface modeling. Master thesis at the University of Trier, Germany, 167 pp.<br />
KUENZER, C., 2001: Multitemporale Untersuchung der Landnutzung des Parc Natural de la Haute<br />
Sûre unter Einsatz v<strong>on</strong> Fernerkundung und GIS im Hinblick auf die Wasserqualitaet des<br />
Stausees Obersauer. Master thesis at the University of Tier, Department of Remote Sensing. –<br />
Trier, 158 pp.<br />
KUENZER, C., NIEBERGALL, S. & S. VOIGT, 2004b: Multitemporale Untersuchungen im chinesischen<br />
Kohleabbau- und Kohlebrandgebiet Ruqigou basierend auf Landsat- und höchstauflösenden<br />
Quickbird Daten. In: STROBL, J., BLASCHKE, T. AND GRIESEBNER, G., (editors): Angewandte<br />
Geoinformatik 2004. Beitraege zum 16. AGIT-Symposium Salzburg 2004. –Heidelberg,<br />
Wichmann, pp.393-398.<br />
KUENZER, C., STRUNZ, G., VOIGT, S. & W. WAGNER, 2004a: Multitemporal Landcover Investigati<strong>on</strong>s<br />
in a Semi-arid Mining Envir<strong>on</strong>ment: Coal Fire Areas in Northern China. In: Proceedings of the<br />
C<strong>on</strong>ference of the EARSeL Special Interest Group <strong>on</strong> Land use and Land Cover, Dubrovnik,<br />
May 2004, 8 pp.<br />
KUENZER, C., ZHANG, J. & S. VOIGT, 2003: Set Up of a Spectral Database for Unmixing Approaches<br />
in Mining Envir<strong>on</strong>ments in North-central China: Demarcating Coal Fire Risk Areas. In:<br />
Proceedings of the 3 rd EARSeL Workshop <strong>on</strong> Imaging Spectroscopy, Herrsching, Germany,<br />
May 13-16 2003, pp. 344-348.<br />
KUENZER, C., ZHANG, J., TETZLAFF, A., VOIGT, S., VAN DIJK, P., WAGNER, W. & H. MEHL:<br />
Unc<strong>on</strong>trolled <str<strong>on</strong>g>coal</str<strong>on</strong>g> <str<strong>on</strong>g>fire</str<strong>on</strong>g>s and their envir<strong>on</strong>mental impacts: Investigating two arid mining<br />
envir<strong>on</strong>ments in north-central China. In review at: Applied Geography, 16 pp.<br />
L …<br />
LAPHAM, D.M., BARNES, J.H., DOWNEY, W.F. & R. FINKELMAN, 1980: Mineralogy associated with<br />
burning anthracite deposits of Eastern Pennsylvania. Mineral Resource Report 78 of the<br />
Pennsylvania Geological Survey, 82 pp.<br />
LAUER, W. & P. FRANKENBERG, 1986: Zur Rek<strong>on</strong>strukti<strong>on</strong> des Klimas. 2 nd editi<strong>on</strong> – Berlin, Germany,<br />
54 pp.<br />
- 237 -
LE HÉGARAT-MASCALE, S., A. QUESNEY, D. VIDAL-MADJAR & O. TACONET, 2000: Land cover<br />
discriminati<strong>on</strong> from multitemporal ERS images and multi<strong>spectral</strong> Landsat images: a study case<br />
in an agricultural area in France. In: Internati<strong>on</strong>al Journal of Remote Sensing, Vol. 221, No. 3,<br />
pp. 435-456.<br />
LENZ, L. & B. WIEDERSICH, 1993: Grundlagen der Geologie und Landschaftsformen. Deutscher<br />
Verlag für Grundstoffindustrie – Stuttgart, Germany, 348 pp.<br />
LI, D.X., 1985: Applied study of airborne remote sensing in Taiyuan <str<strong>on</strong>g>coal</str<strong>on</strong>g>field, China. Internal Report<br />
of the Remote sensing centre of the ministry of <str<strong>on</strong>g>coal</str<strong>on</strong>g> industry, Xian, China, pp. 3-10 (in<br />
Chinese).<br />
LI, X. & A.G.O. YEH, 1998: Principal comp<strong>on</strong>ent analysis of stacked multi-temporal images for the<br />
m<strong>on</strong>itoring of rapid urban expansi<strong>on</strong> in the Pearl River Delta. In: Internati<strong>on</strong>al Journal of<br />
Remote Sensing, Vol. 19, No. 8, pp. 1501-1518.<br />
LILLESAND, T.M. & R.W. KIEFER 1994: Remote Sensing and Image Interpretati<strong>on</strong>. 3rd editi<strong>on</strong>. –New<br />
York, USA, 748 pp.<br />
LIU, J.G., A. BLACK. H. LEE, H. HANIZUMI & J.M. MOORE, 2001: Land surface change detecti<strong>on</strong> in a<br />
desert in Algeria using multi-temporal ERS SAR coherence images. In: Internati<strong>on</strong>al Journal of<br />
Remote Sensing, Vol. 22, No. 13, pp. 2463-2477.<br />
LIVINGOOD, M., WINICATIES, J. & J. STEIN, 1999: Centralia Mine Fire Analysis: Presence of Sulfurbearing<br />
Mineral Deposits at Thermal Vents. Research paper at West Chester University,<br />
Pennsylvania, USA, 9 pp.<br />
LOCAL FARMERS, 2002: Interviews with local farmers during field investigati<strong>on</strong>s in 2002. Four<br />
farmers irrigating their fields were interviewed with the help of a translator.<br />
LOESCHENBRAND, F., MOTT, C., ANDRESEN, T., ZIMMERMANN, S., SCHNEIDER, T. & U. KIAS, 2003:<br />
Objektorientierte Klassifikati<strong>on</strong> hyperspektraler CASI-Daten zur Ableitung naturschutzfachlich<br />
relevanter Landbedeckungsparameter. In: STROBL., J., BLASCHKE, T. & G. GRIESEBNER<br />
(editors), 2003: Angewandte Geographische Informati<strong>on</strong>sverarbeitung XV. –Salzburg, pp.268-<br />
274.<br />
LÖFFLER, E., 1994: Geographie und Fernerkundung. Teubner. –Stuttgart, Germany, 251 pp.<br />
LONGHI, I., SGAVETTI, M., CHIARI, R. & C. MAZZOLI, 2001: Spectral analysis and classificati<strong>on</strong> of<br />
metamorphic rocks from laboratory reflectance spectra in the 0.4-2.5 µm interval: a tool for<br />
hyper<strong>spectral</strong> data interpretati<strong>on</strong>. In: Internati<strong>on</strong>al Journal of Remote Sensing, Vol. 22, No. 18,<br />
pp. 3763-3782.<br />
LUNETTA, R. & C.D. ELVIDGE (editors), 1999: Remote Sensing Change Detecti<strong>on</strong>. –L<strong>on</strong>d<strong>on</strong>, Great<br />
Britain, 320 pp.<br />
LUNETTA, R.S. 1999: Applicati<strong>on</strong>s, Project Formulati<strong>on</strong>, and Analytical Approach. In: LUNETTA, R. &<br />
C.D. ELVIDGE (editors): Remote Sensing Change Detecti<strong>on</strong>. –L<strong>on</strong>d<strong>on</strong>, 318 pp.<br />
M …<br />
MALYUTO, V., 2002: Simulated stellar classificati<strong>on</strong> combining the minimum distance method with a<br />
maximum likelihood procedure. In: New Astr<strong>on</strong>omy, Vol. 7, No. 8, pp. 461-470.<br />
- 238 -
MANSOR S.B., CRACKNELL A.P., SHILIN B.V. & V.I. GORNYI, 1994: M<strong>on</strong>itoring of underground <str<strong>on</strong>g>coal</str<strong>on</strong>g><br />
<str<strong>on</strong>g>fire</str<strong>on</strong>g>s using thermal infrared data. In: Internati<strong>on</strong>al Journal of Remote Sensing, Vol. 15, No. 8,<br />
pp. 1675-1685.<br />
MARACCI, G, 1992: Field and laboratory narrow band spectrometers and the techniques employed. In:<br />
TOSELLI, F. & J. BODECHTEL (editors): Imaging Spectroscopy: Fundamentals and Prospective<br />
Applicati<strong>on</strong>s. –Dordrecht, Netherlands, pp. 33-46.<br />
MARKHAM, B.L., J.L. BARKER, W.C. BONCYK, E. KAITA & D.L. HELDER, 1996: Landsat-7 Enhanced<br />
Thematic Mapper Plus – in flight radiometric calibrati<strong>on</strong>. In: Internati<strong>on</strong>al Geoscience and<br />
Remote Sensing Symposium, 2, Lincoln, Nebraska, USA, pp. 1270-1272.<br />
MAS, J.-F., 1999: M<strong>on</strong>itoring land-cover changes: a comparis<strong>on</strong> of change detecti<strong>on</strong> techniques. In:<br />
Internati<strong>on</strong>al Journal of Remote Sensing, Vol. 20, No. 1, pp. 139-152.<br />
MASEK, J.G., M. HONZAK, S.N. GOWARD, P. LIU & E. PAK, 2001: Landsat7 ETM+ as an observatory<br />
for land cover. Initial radiometric and geometric comparis<strong>on</strong>s with Landsat 5 Thematic Mapper.<br />
In: Remote Sensing of the Envir<strong>on</strong>ment, Vol. 78, No. 1, pp.118-130.<br />
MATSON M. & J. DOZIER, 1981: Identificati<strong>on</strong> of sub-resoluti<strong>on</strong> high temperature sources using a<br />
thermal IR sensor. In: Photogrammetric Engineering and Remote Sensing, Vol. 47, No. 1, pp.<br />
1311-1318.<br />
MCIVER, D.K. & M.A. FRIEDL, 2002: Using prior probabilities in decisi<strong>on</strong>-tree classificati<strong>on</strong> of<br />
remotely sensed data. In: Remote Sensing of Envir<strong>on</strong>ment, Vol. 81, No. 2-3, pp. 253-261.<br />
MICKUS, K. & E. JOHNSON, 2001: Mapping sedimentary and volcanic units within and surrounding<br />
Petrified Forest Nati<strong>on</strong>al Park, Ariz<strong>on</strong>a, using Landsat-5 and SPOT panchromatic data. In:<br />
Internati<strong>on</strong>al Journal of Remote Sensing, Vol. 22, No. 10, pp. 1919-1935.<br />
MIKA, A.M., 2000: Three Decades of Landsat Instruments. In: Photogrammetric Engineering and<br />
Remote Sensing, Vol. 63, No. 7, pp. 839-852.<br />
MILTON, J. E., 1987: Principles of field spectroscopy. In: Internati<strong>on</strong>al Journal of Remote Sensing,<br />
Vol. 8, No. 1, pp. 1807-1827<br />
MOELLER-JENSEN, L., 1997: Classificati<strong>on</strong> of urban land cover <str<strong>on</strong>g>based</str<strong>on</strong>g> <strong>on</strong> expert systems, object<br />
models and texture. In: Urban Systems, Vol. 21, No. 3 & 4, pp. 291-302.<br />
MOXHAM R.M. & G.W. GREENE, 1967: Infrared surveys of <str<strong>on</strong>g>coal</str<strong>on</strong>g> mine <str<strong>on</strong>g>fire</str<strong>on</strong>g>s in the anthracite and<br />
bituminous fields, Pennsylvania. USA, Geological Survey Inter-Agency Report BM-2, U.S.<br />
Bureau of Mines, 67 pp.<br />
MUECHER, C.A., STEINOCHER, K.T., KRESSLER, F.P. & C. HEUNKS, 2000: Land cover<br />
characterizati<strong>on</strong> and change detecti<strong>on</strong> for envir<strong>on</strong>mental m<strong>on</strong>itoring of pan-Europe. In:<br />
Internati<strong>on</strong>al Journal of Remote Sensing, Vol. 21, No. 6&7, 2000, pp. 1159-1181.<br />
MUENZER, H., 1972: Der Einfluss v<strong>on</strong> Fremdstoffen auf das Selbstentzündungsverhalten v<strong>on</strong><br />
Steinkohle. Teil 1: Zum Einfluss des Wassers. Glückauf Forschungshefte 33, pp. 116-120. In:<br />
STACH, E., MACKOWSKY, M.-TH., TEICHMÜLLER, M., TAYLOR, G.H., CHANDRA, D & R.<br />
TEICHMÜLLER, 1975: Stach’s Text book of Coal Petrology, 2 nd editi<strong>on</strong> -Berlin, Germany, 535<br />
pp.<br />
- 239 -
N …<br />
NERRY, F., LABED, J. & M.P. STOLL, 1990: Spectral Properties of land Surfaces in the Thermal<br />
Infrared – Laboratory Measurements of Absolute Spectral Emissivity Signatures. In: Journal of<br />
Geophysical Research, Vol. 95, No. B5, pp. 7072-7044.<br />
NETELER, M., 1999: Spectral Mixture Analysis v<strong>on</strong> Satellitendaten zur Bestimmung v<strong>on</strong><br />
Bodenbedeckungsgraden im Hinblick auf die Erosi<strong>on</strong>smodellierung. Master-thesis at the<br />
University of Hannover, Germany, 131 pp.<br />
NIANG, A., GROSS, L., THIRIA, S., BADRAN, F. & C. MOULIN, 2003: Automatic neural classificati<strong>on</strong> of<br />
ocean colour reflectance at the top of the atmosphere with introducti<strong>on</strong> of expert knowledge. In:<br />
Remote Sensing of Envir<strong>on</strong>ment, Vol. 86, No. 2, pp. 257-271.<br />
NIELSON, A.A: 1994: Analysis of regularly and irregularly sampled, spatial, multivariate, and multitemporal<br />
data. Ph.D. thesis, Institute of Mathematical Modelling, Technical University of<br />
Denmark, Lyngsby, Denmark, 198 pp.<br />
O …<br />
OUAIDRARI, H. & E.F. VERMOTE, 1999: Operati<strong>on</strong>al Atmospheric Correcti<strong>on</strong> of Landsat TM Data. In<br />
Remote Sensing of Envir<strong>on</strong>ment, Vol. 70, No. 1, pp. 4-15.<br />
P …<br />
PAGE, S.E., SIEGERT, F., RIELEY, J.O., BOEHM, H.D. & A. JAYA 1997: The amount of carb<strong>on</strong> released<br />
from peat and forest <str<strong>on</strong>g>fire</str<strong>on</strong>g>s in Ind<strong>on</strong>esia during 1997. In: Nature, Vol. 420, pp. 61-65.<br />
PAL, S.K., BANDYOPADHYAY, S. & C.A. MURTHY, 2001: Genetic classifiers for remotely sensed<br />
images: comparis<strong>on</strong> with standard methods. In: Internati<strong>on</strong>al Journal of Remote Sensing, Vol.<br />
22, No. 13, pp. 2545-2569.<br />
PALACIOS-ORUETA, A., PINZON, J., USTIN, S.L. & D.A. ROBERTS, 1999: Remote Sensing of Soils in<br />
the Santa M<strong>on</strong>ica Mountains: Hierarchical Foreground and Background Analysis. In: Remote<br />
Sensing of Envir<strong>on</strong>ment, Vol. 68, No. 2, pp. 138-151.<br />
PATRONO, A., 1996: Synergism of remotely sensed data for land cover mapping in heterogeneous<br />
alpine <str<strong>on</strong>g>areas</str<strong>on</strong>g>: an example combining accuracy and resoluti<strong>on</strong>. In: ITC Journal, No. 2, pp. 101-<br />
109.<br />
PEARLMAN, J.S., BARRY, P.S., SEGAL, C.C., SHEPANSKI, J., BEISO, D. & S.L. CARMAN, 2003:<br />
Hyperi<strong>on</strong>, a Space-Based Imaging Spectrometer. In: IEEE Transacti<strong>on</strong>s <strong>on</strong> Geoscience and<br />
Remote Sensing, Vol. 41, No. 6, pp. 1160-1173.<br />
PENG, B., 1983: Inhibiti<strong>on</strong> of sp<strong>on</strong>taneous combusti<strong>on</strong> by c<strong>on</strong>trolling the water c<strong>on</strong>tecnt of the <str<strong>on</strong>g>coal</str<strong>on</strong>g>.<br />
In: Proceedings of the 20 th Internati<strong>on</strong>al C<strong>on</strong>ference of Safety in Mines. –Sheffield, 87 pp.<br />
PENNIG, L., 2002: Studienprojekt: Globale Dimensi<strong>on</strong> der Kohlebraendeproblematik. Unpublished<br />
manuscript at the University of Jena, Germany, 50 pp.<br />
PENNIG, L., 2003: Vergleich zweier Kohlebrandregi<strong>on</strong>en in Nordchina mit Hilfe v<strong>on</strong> Fernerkundungsdaten<br />
und GIS. Master Thesis at the University of Jena, 90 pp.<br />
- 240 -
PEOPLE’S REPUBLIC OF CHINA MINISTRY OF GEOLOGY AND MINERAL RESOURCES, 1990: Regi<strong>on</strong>al<br />
Geology of Ningxia Hui Aut<strong>on</strong>omous Regi<strong>on</strong>. Geological Memoirs, Series 1, No. 22. Beijing,<br />
China, pp. 469-522.<br />
PEOPLE’S REPUBLIC OF CHINA MINISTRY OF GEOLOGY AND MINERAL RESOURCES, 1991: Regi<strong>on</strong>al<br />
Geology of Inner M<strong>on</strong>golia Aut<strong>on</strong>omous Regi<strong>on</strong>. Geological Memoirs, Series 1, No. 25.<br />
Beijing, China, pp. 667-725.<br />
PRAKASH, A. & R.P. GUPTA, 1998: Land-use mapping and change detecti<strong>on</strong> in a <str<strong>on</strong>g>coal</str<strong>on</strong>g> mining area – a<br />
case study in the Jharia <str<strong>on</strong>g>coal</str<strong>on</strong>g>field, India. In: Internati<strong>on</strong>al Journal of Remote Sensing, Vol. 19,<br />
No. 3, pp. 391-410.<br />
PRAKASH, A. & R.P. GUPTA, 1999: Surface <str<strong>on</strong>g>fire</str<strong>on</strong>g>s in Jharia Coalfield, India - their distributi<strong>on</strong> and<br />
estimati<strong>on</strong> of area and temperature from TM data. In: Internati<strong>on</strong>al Journal of Remote Sensing,<br />
Vol. 20, No. 10, pp. 1935-1946.<br />
PRAKASH, A., FIELDING, E.J., GENS, R., VAN GENDEREN, J.L. & D.L. EVANS, 2001: Data fusi<strong>on</strong> for<br />
investigating land subsidence and <str<strong>on</strong>g>coal</str<strong>on</strong>g><str<strong>on</strong>g>fire</str<strong>on</strong>g> hazards in a <str<strong>on</strong>g>coal</str<strong>on</strong>g> mining area. In: Internati<strong>on</strong>al<br />
Journal of Remote Sensing, Vol. 22, No. 6, pp. 921-932.<br />
PRAKASH, A., GENS, R. & Z. VEKERDY, 1999: M<strong>on</strong>itoring <str<strong>on</strong>g>coal</str<strong>on</strong>g> <str<strong>on</strong>g>fire</str<strong>on</strong>g>s using multi-temporal night-time<br />
thermal images in a <str<strong>on</strong>g>coal</str<strong>on</strong>g>field in North-west China. In: Internati<strong>on</strong>al Journal of Remote Sensing,<br />
Vol. 20, No. 14, pp. 2883-2888.<br />
PRAKASH, A., GUPTA, R.P. & A.K. SARAF, 1997: A Landsat TM <str<strong>on</strong>g>based</str<strong>on</strong>g> comparative study of surface<br />
and subsurface <str<strong>on</strong>g>fire</str<strong>on</strong>g>s in the Jharia Coalfield, India. In: Internati<strong>on</strong>al Journal of Remote Sensing,<br />
Vol. 18, No. 14, pp. 2463-2469.<br />
PRAKASH, A., SARAF, A.K., GUPTA, R.P., DUTTA, M. & R.M. SUNDARAM, 1995: Surface thermal<br />
anomalies with underground <str<strong>on</strong>g>fire</str<strong>on</strong>g>s in Jharia <str<strong>on</strong>g>coal</str<strong>on</strong>g> mine, India. In: Internati<strong>on</strong>al Journal of Remote<br />
Sensing, Vol. 16, No. 2, pp. 2105-2109.<br />
PRATT, D.A., FOSTER, S.J. & C.D. ELLYETT, 1980: A Calibrati<strong>on</strong> Procedure for Fourier Series<br />
Thermal Inertia Models. In: Photogrammetric Engineering & Remote Sensing, Vol. 46, No. 4,<br />
pp. 529-538.<br />
PROY, C., D. TANRÉ & P.Y. DESCHAMPS, 1989: Evaluati<strong>on</strong> of Topographic Effects in Remotely<br />
Sensed Data. In: Remote Sensing of the Envir<strong>on</strong>ment. Vol. 30, No 1, 1989, pp. 21-32.<br />
Q …<br />
R …<br />
RABCHEVSKY, G.A., 1972: Determinati<strong>on</strong> from available satellite and aircraft imagery of the<br />
applicability of remote sensing techniques to the detecti<strong>on</strong> of <str<strong>on</strong>g>fire</str<strong>on</strong>g>s burning in aband<strong>on</strong>ed <str<strong>on</strong>g>coal</str<strong>on</strong>g><br />
mines and unmined <str<strong>on</strong>g>coal</str<strong>on</strong>g> deposits located in North Central Wyoming and Southern M<strong>on</strong>tana. In:<br />
U.S. Department of Interior, Bureau of Mines, Prepared by Allied Research Associates Inc.,<br />
C<strong>on</strong>tract No. SO 211087, Final Report No. 8G86-F, 21 pp.<br />
RADELOFF, V., HILL, J. & W. MEHL (1997): Forest Mapping from Space – Enhanced satellite data<br />
processing by <strong>spectral</strong> mixture analysis and topographic correcti<strong>on</strong>s. –Luxemburg, 88 pp.<br />
- 241 -
RATHORE C.S. & R. WRIGHT, 1993: M<strong>on</strong>itoring envir<strong>on</strong>mental impacts of surface <str<strong>on</strong>g>coal</str<strong>on</strong>g> mining. In:<br />
Internati<strong>on</strong>al Journal of Remote Sensing, Vol. 14, No. 6, pp. 1021-1042.<br />
RAY, T.W. & B.C. MURRAY, 1996: N<strong>on</strong>linear Spectral Mixing in Desert Vegetati<strong>on</strong>. In: Remote<br />
Sensing of Envir<strong>on</strong>ment, Vol. 55, No. 1, pp. 59-64.<br />
REES, W.G., WILLIAMS, M. & P. VITEBSKY, 2003: Mapping land cover change in a reindeer herding<br />
area of the Russian Arctic using Landsat TM and ETM+ imagery and indigenous knowledge.<br />
In: Remote Sensing of Envir<strong>on</strong>ment, Vol. 85, No. 4, pp. 441-452.<br />
RESMINIE, R.G., KAPPUS, M.E., ALDRICH, W.S., HARSANYI, J.C. & M. ANDERSON, 1997: Mineral<br />
mapping with Hyper<strong>spectral</strong> Digital Imagery Collecti<strong>on</strong> Experiment (HYDICE) sensor data at<br />
Cuprite, Nevada, U.S.A.. In: Internati<strong>on</strong>al Journal of Remote Sensing, Vol. 18, No. 7, pp. 1553-<br />
1570.<br />
RICHARDS, J.A., 1986: Remote Sensing Digital Image Analysis – an Introducti<strong>on</strong>. –Berlin, Germany,<br />
281 pp.<br />
RICHARDS, J.A., 1996: Classifier Performance and Map Accuracy. In Remote Sensing of<br />
Envir<strong>on</strong>ment, Vol. 57, No. 3, pp. 161-166.<br />
RICHTER, G. (editor) 1996: Handbuch ausgewählter Klimastati<strong>on</strong>en der Erde. 5 th ed., -Trier, Germany,<br />
400 pp.<br />
RICHTER, R., 1998: Correcti<strong>on</strong> of satellite imagery over mountainous terrain. Applied Optics, Vol. 37,<br />
No.18, pp. 4004-4015.<br />
RICHTER, R., 2003: Atmospheric and Topographic Correcti<strong>on</strong> for Satellite Imagery. ATCOR-2/3 User<br />
Guide, versi<strong>on</strong> 5.5., DLR-I3 564-02/03, Wessling, Germany, 57 pp.<br />
ROBERTS, D.A., GARDNER, M., CHURCH, R., USTIN, S., SCHEER, G. & R.O. GREEN, 1998: Mapping<br />
Chaparral in the Santa M<strong>on</strong>ica Mountains Using Multiple Endmember Spectral Mixture<br />
Models. In: Remote Sensing of Envir<strong>on</strong>ment, Vol. 65, No. 3, pp. 267-279.<br />
ROBERTS, D.A., SMITH, M.O. & J.B. ADAMS, 1993: Green vegetati<strong>on</strong>, n<strong>on</strong>photosynthetic vegetati<strong>on</strong>,<br />
and soils in AVIRIS data. In: Remote Sensing of Envir<strong>on</strong>ment, Vol. 44, No. 2-3, pp. 255-269.<br />
ROSEMA, A., H. GUAN, H. VELD, Z. VEKERDY, A. TEN KATEN & A. PRAKASH, 1999:Manual of <str<strong>on</strong>g>coal</str<strong>on</strong>g><br />
<str<strong>on</strong>g>fire</str<strong>on</strong>g> detecti<strong>on</strong> and m<strong>on</strong>itoring. Utrecht, Netherlands, 240 pp.<br />
ROSENQVIST, A., MILNE, A., LUCAS, R., IMHOFF, M. & C. DOBSON, 2003: A review of remote sensing<br />
technology in support of the Kyoto Protocoll. In: Envir<strong>on</strong>mental Science and Policy, No. 6, pp.<br />
441-455.<br />
ROTHERY, D.A. & P.W. FRANCIS, 1990: Short wavelength infrared images for volcano m<strong>on</strong>itoring. In:<br />
Internati<strong>on</strong>al Journal of Remote Sensing, Vol. 11, No. 10, pp. 1665-1667.<br />
RSI, 2003: Research Systems Incorporated, ENVI 3.4. <strong>on</strong>line documentati<strong>on</strong>.<br />
RUECKER, G., 2003: Ein Satelliten- und GIS-gestuetztes Waldbrand Fruehwarnsystem fuer Tropische<br />
Regenwaelder in Ost-Kalimantan, Ind<strong>on</strong>esien. In: STROBL, J., BLASCHKE, T. AND GRIESEBNER,<br />
G., (editors): Angewandte Geographische Informati<strong>on</strong>sverarbeitung XV. Beitraege zum AGIT-<br />
Symposium Salzburg 2003. –Heidelberg, Wichmann, pp.402-410.<br />
RUSS, J.C., 1999: Image Processing Handbook. 3 rd editi<strong>on</strong>, -Raleigh, North Carolina, USA, 744, pp.<br />
- 242 -
S …<br />
SABINS, F.F., 1996: Remote Sensing. 3 rd editi<strong>on</strong>, - New York, USA, 450 pp.<br />
SAN MIGUEL-AYANZ, J. & G.S. BIGING, 1997: Comparis<strong>on</strong> of Singe Stage and Multi-Stage<br />
Classificati<strong>on</strong> Approaches for Cover Type Mapping with TM and SPOT Data. In: Remote<br />
Sensing of Envir<strong>on</strong>ment, Vol. 59, No. 1, pp. 92-104.<br />
SARAF, A.K., PRAKASH, A., SENGUPTA, S., & P. GUPTA, 1995: Landsat-TM data for estimating ground<br />
temperature and depth of subsurface <str<strong>on</strong>g>coal</str<strong>on</strong>g> <str<strong>on</strong>g>fire</str<strong>on</strong>g> in the Jharia <str<strong>on</strong>g>coal</str<strong>on</strong>g> field, India. In: Internati<strong>on</strong>al<br />
Journal of Remote Sensing, Vol. 16, No. 12, pp. 2111-2124.<br />
SCHAAB, G., 2000: Modellierung und Visualisierung der räumlichen und zeitlichen Variabilität der<br />
Einstrahlungsstärke mittels eines Geo-Informati<strong>on</strong>ssystems. Ph.D thesis at the Technical<br />
University of Dresden., Germany, 160 pp.<br />
SCHARDT, M., 1990: Verwendbarkeit v<strong>on</strong> Thematic Mapper-Daten zur Klassifizierung v<strong>on</strong> Baumarten<br />
und natürlichen Altersklassen. Published science report, Ph.D. thesis, DLR-FB 90-44, 199 pp.<br />
SCHLERF, M., ATZBERGER, C., UDELHOVEN, T., JARMER, T., MADER, S., WERNER, W. & J. HILL,<br />
2003: Spectrometric estimati<strong>on</strong> of leaf pigments in Norway spruce needles using band-depth<br />
analysis, partial least-square regressi<strong>on</strong> and inversi<strong>on</strong> of a c<strong>on</strong>ifer leaf model. In: Proceedings of<br />
the 3 rd EARSeL Workshop <strong>on</strong> Imaging Spectroscopy, Herrsching, Germany, May 13-16 2003,<br />
pp. 559-569.<br />
SCHMUGGE, T.J., BECKER, F. & Z.L. LI, 1991: Spectral Emissivity Variati<strong>on</strong>s Observed in Airborne<br />
Surface Temperature Measurements. In: Remote Sensing of Envir<strong>on</strong>ment, Vol. 35, No. 2, pp.<br />
95-104.<br />
SCHNEIDER, W., 1996: The <str<strong>on</strong>g>coal</str<strong>on</strong>g>-bearing Jurassic at the southern margin of the Junggar basin,<br />
Xinjiang. In: Geowissenschaften, Vol. 14, pp. 285-287.<br />
SCHOTT, J.R., 1997: Remote Sensing, The Image Chain Approach. – Oxford, Great Britain, 394 pp.<br />
SCHOWENGERDT, R.A., 1997: Remote Sensing – Models and Methods for Image Processing. 2 nd<br />
revised and expanded editi<strong>on</strong>, -San Diego, 517 pp.<br />
SCHROEDER-BRZOSNIOWSKY, M., 2000: Stochastic Modeling of Image C<strong>on</strong>tent in Remote Sensing<br />
Image Archives. Ph.D. thesis at the Swiss Federal Institute of Technology,-Zurich, 177 pp.<br />
SCHRÖTER, W., LAUTENSCHLÄGER, K.-H. & H. BIBRACK, 1992: Chemie – Fakten und Gesetze. Buchund<br />
Zeitverlagsgesellschaft mbH, -Cologne, Germany, 424 pp.<br />
SCHWARZ, J., H.-D. BETTAC & K.-D. MISSLING, 1999: Das DFD Bodensegment für Landsat 7. In:<br />
MEHL, H. & S. DECH (editors): Tagungsband: 16. Nutzerseminar des DFD der DLR, –<br />
Oberpfaffenhofen, Germany, pp. 49-57.<br />
SETTLE, J.J. & N.A. DRAKE, 1993: Linear mixing and the estimati<strong>on</strong> of ground cover proporti<strong>on</strong>s. In:<br />
Internati<strong>on</strong>al Journal of Remote Sensing, Vol. 14, No. 6, pp. 1159-1177.<br />
SKAKUN, R.S., WULDER, M.A. & S.E. FRANKLIN, 2003: Sensitivity of the thematic mapper enhanced<br />
wetness difference index to detect mountain pine beetle red-attack damage. In: Remote Sensing<br />
of Envir<strong>on</strong>ment, Vol. 86, No. 4, pp. 433-443.<br />
- 243 -
SLAVECKI R.J., 1964: Detecti<strong>on</strong> and locati<strong>on</strong> of subsurface <str<strong>on</strong>g>coal</str<strong>on</strong>g> <str<strong>on</strong>g>fire</str<strong>on</strong>g>s. In: Proceedings of the third<br />
Symposium <strong>on</strong> Remote Sensing of Envir<strong>on</strong>ment. 14-16 October 1964, Institute of Science and<br />
Technology, University of Michigan, USA, pp. 537-547.<br />
SMITH, A.C. & C.P. LAZZARA, 1987: Sp<strong>on</strong>taneous combusti<strong>on</strong> of US <str<strong>on</strong>g>coal</str<strong>on</strong>g>s. Internal Report 9079 of<br />
the Department of the Interior, Bureau of Mines. –Pittsburgh, USA, 29 pp.<br />
SMITH, G.M. & R.M. FULLER, 2001: An integrated approach to land cover classificati<strong>on</strong>: an example<br />
in the Island of Jersey. In: Internati<strong>on</strong>al Journal of Remote Sensing, Vol. 22, No. 16, pp. 3123-<br />
3142.<br />
SMITH, M.O., J.B. ADAMS & D.E. SABOL, 1994: Spectral Mixture Analysis – New Strategies for the<br />
Analysis of Multi<strong>spectral</strong> Data. In: HILL, J. & J. MÉGIER (editors): Imaging Spectromety – a<br />
Tool for Envir<strong>on</strong>mental Observati<strong>on</strong>s. –Dordrecht, Netherlands, pp.125-145.<br />
SMITH, M.O., USTIN, S.L., ADAMS, J.B. & A.R. GILLESPIE, 1990: Vegetati<strong>on</strong> in Deserts: I. A Regi<strong>on</strong>al<br />
Measure of Abundance from Multi<strong>spectral</strong> Images. In: Remote Sensing of the Envir<strong>on</strong>ment,<br />
Vol. 31, No. 1, pp. 1-26.<br />
SONG, C., C.E. WOODCOCK, K.C. SETO, M.P. LENNEY & S.A. MACOMBER, 2001: Classificati<strong>on</strong> and<br />
Change Detecti<strong>on</strong> using Landsat TM Data: When and How to Correct Atmospheric Effects? In:<br />
Remote Sensing of Envir<strong>on</strong>ment, Vol. 75, No. 2, pp. 230-244.<br />
STAENZ, K., NADEAU, C., SECKER, J. & P. BUDKEWITSCH, 2000: Spectral Unmixing Applied to<br />
Vegetated Envir<strong>on</strong>ments in the Canadian Arctic for Mineral Mapping. In: Proceedings of the<br />
XIX ISPRS C<strong>on</strong>gress, 15.07.-23.07.2000, Amsterdam, Netherlands, 8 pp.<br />
STEHMAN, S.V., 1997: Selecting and Interpreting Measures of Thematic Classificati<strong>on</strong> Accuracy. In:<br />
Remote Sensing of Envir<strong>on</strong>ment, Vol. 62, No. 1, pp. 77-89.<br />
STOLZ, R., 1998: Die Verwendung der Fuzzy Logic Theorie zur wissensbasierten Klassifikati<strong>on</strong> v<strong>on</strong><br />
Fernerkundungsdaten. Ph.D. thesis at the University of Munich, Germany, 178 pp.<br />
SUN, Y. 2002: Pers<strong>on</strong>al Interviews during the fieldwork campaign in September 2002. Y. Sun is an<br />
engineer of the Wuda <str<strong>on</strong>g>coal</str<strong>on</strong>g> <str<strong>on</strong>g>fire</str<strong>on</strong>g> fighting department and leads the team <strong>on</strong> <str<strong>on</strong>g>coal</str<strong>on</strong>g> geology.<br />
SUN, Y. 2003: Pers<strong>on</strong>al Interviews during the fieldwork campaign in September 2003. Y. Sun is an<br />
engineer of the Wuda <str<strong>on</strong>g>coal</str<strong>on</strong>g> <str<strong>on</strong>g>fire</str<strong>on</strong>g> fighting department and leads the team <strong>on</strong> <str<strong>on</strong>g>coal</str<strong>on</strong>g> geology.<br />
SUNAR, F., 1998: An analysis of changes in a multi-date data set: a case study in the Ikitelli area,<br />
Istanbul, Turkey. In: Internati<strong>on</strong>al Journal of Remote Sensing, Vol. 19, No. 2, pp. 225-235.<br />
SWITZER, P. & A.A. GREEN, 1984: Min/Max Autocorrelati<strong>on</strong> Factors for Multivariate Spatial Imagery.<br />
In: Tech. Report No. 6, Department of Statistics, Stanford University, Stanford, California,<br />
USA, 10 pp.<br />
T …<br />
TEILLET, P.M., BARKER, J.L., MARKHAM, B.L., IRISH, R.R., FEDOSEJEVS, G. & J.C. STOREY, 2001:<br />
Radiometric cross calibrati<strong>on</strong> of the Landsat-7 ETM+ and Landsat-5 TM sensors <str<strong>on</strong>g>based</str<strong>on</strong>g> <strong>on</strong><br />
tandem data sets. In: Remote Sensing of Envir<strong>on</strong>ment, Vol. 78, No. 1, pp. 39-54.<br />
- 244 -
TETZLAFF, A. 2004: Coal <str<strong>on</strong>g>fire</str<strong>on</strong>g> quantificati<strong>on</strong> using Aster, ETM and Bird satellite instrument data. Ph.D<br />
thesis at the Ludwig Maximilians University Munich, Germany, 155 pp.<br />
THESEIRA, M.A., THOMAS, G. & C.A.D. SANNIER, 2002: An evaluati<strong>on</strong> of <strong>spectral</strong> mixture modelling<br />
applied to a semi-arid envir<strong>on</strong>ment. In: Internati<strong>on</strong>al Journal of Remote Sensing, Vol. 23, No. 4,<br />
pp. 687-700.<br />
THOME, K.J., 2001: Absolute radiometric calibrati<strong>on</strong> of Landsat 7 ETM+ using the reflectance-<str<strong>on</strong>g>based</str<strong>on</strong>g><br />
method. In: Remote Sensing of Envir<strong>on</strong>ment, Vol. 78, No. 1, pp. 27-38.<br />
THOMSON, A.G., FULLER, R.M. & J.A. EASTWOOD, 1998: Supervised versus unsupervised methods<br />
for classificati<strong>on</strong> of coasts and river corridors from airborne remote sensing. In: Internati<strong>on</strong>al<br />
Journal of Remote Sensing, Vol. 19, No. 17, pp. 3423-3431.<br />
TIPLER, P.A., 2000: Physik. 3 rd editi<strong>on</strong>, Spektrum Akademischer Verlag, Heidelberg, Germany,<br />
1520 pp.<br />
TODD, D. & J. FEMGJUN, 1997: Interregi<strong>on</strong>al <str<strong>on</strong>g>coal</str<strong>on</strong>g> flows in China and the problem of transport<br />
bottlenecks. In: Applied Geography, Vol. 17, No. 3, pp. 215-230.<br />
TOKOLA, T., J. SARKEALA & M. VAN DER LINDEN, 2001: Use of topographic correcti<strong>on</strong> in Landsat<br />
TM-<str<strong>on</strong>g>based</str<strong>on</strong>g> forest interpretati<strong>on</strong> in Nepal. In: Internati<strong>on</strong>al Journal of Remote Sensing, Vol. 22,<br />
No. 4, pp. 551-563.<br />
TOMPKINS, S., MUSTARD, J.F., PIETERS, C.M. & D.W. FORSYTH, 1997: Optimizati<strong>on</strong> of Endmembers<br />
for Spectral Mixture Analysis. In: Remote Sensing of Envir<strong>on</strong>ment, Vol. 59, No. 3, pp. 472-<br />
489.<br />
TSO, B. & MATHER, P.M., 2001: Classificati<strong>on</strong> Methods for Remotely Sensed Data. –L<strong>on</strong>d<strong>on</strong>, Great<br />
Britain, 329 pp.<br />
U …<br />
UNDERWOOD, E., USTIN, S. & D. DIPIETRO, 2003: Mapping n<strong>on</strong>-native plants using hyper<strong>spectral</strong><br />
imagery. In: Remote Sensing of Envir<strong>on</strong>ment, Vol. 86, No. 2, pp. 150-161.<br />
UNITED STATES GEOLOGICAL SURVEY, 1999: Landsat 7 Data Users Handbook. –Sioux Falls, USA<br />
V …<br />
VAN DER MEER, F.D., 1999a: Image classificati<strong>on</strong> through <strong>spectral</strong> unmixing. In: STEIN, A., VAN DER<br />
MEER, F.D. & B. VAN DE GORTE, (editors): Spatial Statistics for Remote Sensing, Kluwer<br />
Academic Publishers, Netherlands, pp. 185-193.<br />
VAN DER MEER, F.D. & DE JONG, S. (editors), 2001: Imaging Spectrometry: Basic Principles and<br />
Prospective Applicati<strong>on</strong>s. –Dordrecht, Netherlands, 425 pp.<br />
VAN DER MEER, F.D., 1999b: Iterative Spectral Unmixing (ISU). In: Internati<strong>on</strong>al Journal of Remote<br />
Sensing, Vol. 20, No. 17, pp. 3431-3436.<br />
VAN DER MEER, F.D., 2000: Spectral curve shape matching with a c<strong>on</strong>tinuum removed CCSM<br />
algorithm. In: Internati<strong>on</strong>al Journal of Remote Sensing, Vol. 21, No. 16, pp. 3179-3185.<br />
- 245 -
VAN DER MEER, F.D., VAZQUES-TORRES & P.M. VAN DIJK, 1997: Spectral Characterizati<strong>on</strong> of<br />
ophiolite lithologies in the Troodos Ophiolite complex of Cyprus and its potential in prospecting<br />
for massive sulphide deposits. In: Internati<strong>on</strong>al Journal of Remote Sensing, Vol. 18, No. 6, pp.<br />
1245-1257.<br />
VAN GENDEREN, J.L., & H. GUAN, 1997: Envir<strong>on</strong>mental m<strong>on</strong>itoring of sp<strong>on</strong>taneous combusti<strong>on</strong> in the<br />
North China <str<strong>on</strong>g>coal</str<strong>on</strong>g>fields. –Enschede, Netherlands, 243 pp.<br />
VERBURG, P.H., VELDKAMP, A. & L.O. FRESCO, 1999: Simulati<strong>on</strong> of changes in the spatial pattern of<br />
land use in China. In: Applied Geography, Vol. 19, pp. 211-233.<br />
VERBYLA, D.L. & S.H. BOLES (2000): Bias in land cover change estimates due to misregistrati<strong>on</strong>. In:<br />
Internati<strong>on</strong>al Journal for Remote Sensing, Vol. 21, No.18, pp.3553-3560.<br />
VERMOTE, E.F., D. TANRÉ, J.L.DEUZÉ, M. HERMAN & J.-J. MORCRETTE, 1997: Sec<strong>on</strong>d Simulati<strong>on</strong> of<br />
the Satellite Signal in the Solar Spectrum, 6S: An Overview. In: IEEE Transacti<strong>on</strong>s <strong>on</strong><br />
Geosciences and Remote Sensing, Vol. 35, No. 3, pp. 675-686.<br />
VIDAL, A., 1991: Atmospheric and emissivity correcti<strong>on</strong> of land surface temperature measured from<br />
satellite using ground measurements or satellite data. In: Internati<strong>on</strong>al Journal of Remote<br />
Sensing, Vol. 12, No. 12, pp. 2449-2460.<br />
VIOVY, N., 2000: Automatic Classificati<strong>on</strong> of Time Series (ACTS): a new clustering method for<br />
remote sensing time series. In: Internati<strong>on</strong>al Journal of Remote Sensing, Vol. 21, No. 6&7, pp.<br />
1537-1560.<br />
VOGELMANN, J.E., T. SOHL & S.M. HOWARD 1998: Regi<strong>on</strong>al Characterizati<strong>on</strong> of Land Cover Using<br />
Multiple Sources of Data. In: Photogrammetric Engineering &Remote Sensing, Vol. 64, No.1,<br />
pp.47-57<br />
VOIGT, S., 2000: Advanced methods for operati<strong>on</strong>al mapping of Alpine snow cover using medium<br />
resoluti<strong>on</strong> optical satellite data. Ph.D. thesis at the University of Bern, Switzerland, 91 pp.<br />
VOIGT, S., TETZLAFF, A., ZHANG, J., KUENZER, C., ZHUKOV, B., STRUNZ, G., OERTEL, D., ROTH, A.,<br />
VAN DIJK, P. & H. MEHL, 2004: Integrating Satellite Remote Sensing Techniques for Detecti<strong>on</strong><br />
and Analysis of Unc<strong>on</strong>trolled Coal Seam Fires in North China. In: Internati<strong>on</strong>al Journal of Coal<br />
Geology, No. 59, pp. 121-136.<br />
W …<br />
WAGNER, W., 2003: Global Climate Change. Unpublished script for a lecture at Vienna University of<br />
Technology, 111 pp.<br />
WAGNER, W., LUCKMANN, A., VIETMEIER, J., TANSEY, K., BALZTER, H., SCHMULLIUS, C.,<br />
DAVIDSON, M., GAVEAU, D., GLUCK, M.. & T. LETOAN, 2003: Large scale mapping of boreal<br />
forest in SIBERIA using ERS tandem coherence and JERS backscatter data. In: Remote<br />
Sensing of Envir<strong>on</strong>ment, Vol. 85, No. 2, pp. 125-144.<br />
WALKER, S., 1999: Unc<strong>on</strong>trolled <str<strong>on</strong>g>fire</str<strong>on</strong>g>s in <str<strong>on</strong>g>coal</str<strong>on</strong>g> and <str<strong>on</strong>g>coal</str<strong>on</strong>g> wastes. Internati<strong>on</strong>al Energy Agency, IEA <strong>on</strong><br />
Coal Research –L<strong>on</strong>d<strong>on</strong>, Great Britain, 73 pp.<br />
WANG, C., 2002. Detecti<strong>on</strong> of <str<strong>on</strong>g>coal</str<strong>on</strong>g> <str<strong>on</strong>g>fire</str<strong>on</strong>g>s in Xinjiang (China) using remote sensing techniques. Master<br />
thesis at ITC, Enschede, Netherlands, 93 pp.<br />
- 246 -
WANG, F., 1990: Fuzzy supervised classificati<strong>on</strong> of remote sensing images. In: IEEE Transacti<strong>on</strong>s <strong>on</strong><br />
Geoscience and Remote Sensing, No. 28, pp. 194-201.<br />
WARNER, T.A. & X. CHEN, 2001: Normalizati<strong>on</strong> of Landsat thermal imagery for the effect of solar<br />
heating and topography. In: Internati<strong>on</strong>al Journal of Remote Sensing, Vol. 22, No. 5, pp. 773-<br />
788.<br />
WATSON, N. & D. WILCOCK, 2001: Preclassificati<strong>on</strong> as an Aid to the Improvement of Thematic and<br />
Spatial Accuracy in Land Cover Maps Derived from Satellite Imagery. In: Remote Sensing of<br />
Envir<strong>on</strong>ment, Vol. 75, No. 2, pp. 267-278.<br />
WEISCHET, W. 1988: Einführung in die Allgemeine Klimatologie. Physikalische und meteorologische<br />
Grundlagen. 4 th editi<strong>on</strong>, -Stuttgart, Germany, 264 pp.<br />
WEN, C.G. & R. TATEISHI, 2001: 30-sec<strong>on</strong>d degree grid land cover classificati<strong>on</strong> of Asia. In:<br />
Internati<strong>on</strong>al Journal of Remote Sensing, Vol. 22, No. 18, pp. 3845-3854.<br />
WRIGHT, P. & R. STOW, 1999: Detecting mining subsidence from space. In: Internati<strong>on</strong>al Journal of<br />
Remote Sensing, Vol. 20, No. 6, pp. 1183-1188.<br />
WU, W. & W. ZHANG, 2003: Present land use and cover patterns and their development potential in<br />
North Ningxia, China. In: Journal of Geographical Sciences, Vol. 13, No.1, pp. 54-62<br />
WU, W., LAMBIN, E.F. & M.-F. COUREL 2001: Land use and cover change detecti<strong>on</strong> and modelling for<br />
North Ningxia, China. PRODIG-UMR8586/CNRS, Louvain, Belgium, 37 pp.<br />
X …<br />
XIE, Y. 2001. Einfluss der Weidewirtschaft auf die Vegetati<strong>on</strong> und die ökologischen Bedingungen der<br />
Trockensteppe in Ningxia, China. –Ph.D thesis at the University of Frankfurt, Germany, 135 pp.<br />
Y …<br />
YAN, G., 2003: Pixel <str<strong>on</strong>g>based</str<strong>on</strong>g> and object oriented image analysis for <str<strong>on</strong>g>coal</str<strong>on</strong>g> <str<strong>on</strong>g>fire</str<strong>on</strong>g> research. Master thesis at<br />
ITC, Enschede, Netherlands, 82 pp.<br />
YAN, H., 1995: Detecti<strong>on</strong> of Areas of sp<strong>on</strong>taneous combusti<strong>on</strong> of <str<strong>on</strong>g>coal</str<strong>on</strong>g> by using airborne and TM data<br />
in Xinjiang, China. Master thesis at ITC, Enschede, Netherlands, 71 pp.<br />
YANG, G., COLLINS, M.J. & P. GONG, 1998: Multisource data selecti<strong>on</strong> for lithologic classificati<strong>on</strong><br />
with artificial neural networks. In: Internati<strong>on</strong>al Journal of Remote Sensing, Vol. 19, No. 18, pp.<br />
3675-3680.<br />
YOUNG, S.S. & C.Y. WANG, 2001: Land-cover analysis of China using global-scale Pathfinder<br />
AVHRR Landcover (PAL) data, 1982-92. In: Internati<strong>on</strong>al Journal of Remote Sensing, Vol. 22,<br />
No. 8, pp. 1457-1477.<br />
YUAN, D., C.D. ELVIDGE & R.S. LUNETTA, 1999: Survey of Multi<strong>spectral</strong> Methods for Land Cover<br />
Change Analysis. In: LUNETTA, R. & C.D. ELVIDGE (editors): Remote Sensing Change<br />
Detecti<strong>on</strong>. –L<strong>on</strong>d<strong>on</strong>, pp.21-39.<br />
- 247 -
Z …<br />
ZHANG, J., 1996: SWIR spectra of rocks in <str<strong>on</strong>g>areas</str<strong>on</strong>g> affected by <str<strong>on</strong>g>coal</str<strong>on</strong>g> <str<strong>on</strong>g>fire</str<strong>on</strong>g>s, Xinjiang Aut<strong>on</strong>omous Regi<strong>on</strong>,<br />
P.R. of China. Master thesis at the ITC, Enschede, Netherlands, 74 pp.<br />
ZHANG, J., 2004: Spatial and Statistical Analysis of Thermal Satellite Imagery for Extracti<strong>on</strong> of Coal<br />
Fire Related Anomalies. Ph.D. thesis at the Technical University Vienna, Austria, 166 pp.<br />
ZHANG, J., WAGNER, W., PRAKASH, A., MEHL, H., AND VOIGT, S., 2004a: Detecting Coal Fire Using<br />
Remote Sensing Techniques. In: Internati<strong>on</strong>al Journal of Remote Sensing, Vol. 25, No. 16, pp.<br />
3193-3220.<br />
ZHANG, R. 2003: Pers<strong>on</strong>al interviews during the fieldwork campaign in September 2003. R. Zhang is<br />
the chief engineer of the Wuda mine.<br />
ZHANG, X. 1997: Regi<strong>on</strong>al geological mapping by using remote sensing and sedimentary<br />
characteristics of the Ruqigou basin, Ningxia, China. Master thesis at ITC, Enschede,<br />
Netherlands, 87 pp.<br />
ZHANG, X., 1998: Coal Fires in Northwest China – Detecti<strong>on</strong>, M<strong>on</strong>itoring, and Predicit<strong>on</strong> Using<br />
Remote Sensing Data. PhD-thesis at ITC –Enschede, Netherlands, 235 pp.<br />
ZHANG, X., VAN GENDEREN, J.L. & S.B. KROONENBERG, 1997: A method to evaluate the capability of<br />
Landsat-5 TM band 6 data for sub-pixel <str<strong>on</strong>g>coal</str<strong>on</strong>g> <str<strong>on</strong>g>fire</str<strong>on</strong>g> detecti<strong>on</strong>. In: Internati<strong>on</strong>al Journal of Remote<br />
Sensing, Vol. 18, No. 15, pp. 3279-3288.<br />
ZHANG, X., ZHANG, J., KUENZER, C., VOIGT, S. & W. WAGNER, 2004: Capability evaluati<strong>on</strong> of 3-5µm<br />
and 8-12,5µm airborne thermal data for underground <str<strong>on</strong>g>coal</str<strong>on</strong>g><str<strong>on</strong>g>fire</str<strong>on</strong>g> detecti<strong>on</strong>. In: Internati<strong>on</strong>al Journal<br />
of Remote Sensing, Vol. 25, No. 12, pp. 2245-2258.<br />
ZHU, G. & D.G. BLUMBERG, 2002: Classificati<strong>on</strong> using ASTER data and SVM algorithms; the case<br />
study of Beer Sheva, Israel. In: Remote Sensing of Envir<strong>on</strong>ment, Vol. 80, No. 2, pp. 233-240.<br />
Internet sources:<br />
URL 2-1: http://www.dwd.de/de/WundK/Klimadaten/index.html, 16.09.2004<br />
URL 2-2: http://www.cpirc.org.cn/en/eindex.htm, 16.09.2004<br />
URL 3-1: http://www.hgimaging.com/PDF/Kruse_ISSSR99.pdf, 16.09.2004<br />
URL 4-1: http://ltpwww.gsfc.nasa.gov/IAS/handbook/handbook_htmls/chapter1/chapter1.html,<br />
URL 4-2: http://landsat.gsfc.nasa.gov/, 16.09.2004<br />
URL 4-3: http://asterweb.jpl.nasa.gov/instrument/instrument.htm, 16.09.2004<br />
URL 4-4: http://asterweb.jpl.nasa.gov/, 16.09.2004<br />
URL 4-5: http://eo1.usgs.gov/, 16.09.2004<br />
URL 4-6: http://www.eurimage.com/products/quickbird.html, 16.09.2004<br />
URL 4-7: http://www.esa.int/export/esaSA/GGGWBR8RVDC_earth_0.html, 16.09.2004<br />
URL 8-1: http://www.pir.sa.gov.au/pages/minerals/resources/commodity/<str<strong>on</strong>g>coal</str<strong>on</strong>g>.htm%3AsectID=245-<br />
&tempID=7, 16.09.2004<br />
- 248 -