How to increase satisfaction with online learning: Technical ... - ipedr
How to increase satisfaction with online learning: Technical ... - ipedr
How to increase satisfaction with online learning: Technical ... - ipedr

Create successful ePaper yourself
Turn your PDF publications into a flip-book with our unique Google optimized e-Paper software.
2011 2nd International Conference on Education and Management Technology<br />
IPEDR vol.13 (2011) © (2011) IACSIT Press, Singapore<br />
<strong>How</strong> <strong>to</strong> <strong>increase</strong> <strong>satisfaction</strong> <strong>with</strong> <strong>online</strong> <strong>learning</strong>: <strong>Technical</strong><br />
suggestions <strong>to</strong> enhance the usefulness of importance-performance<br />
analysis<br />
Ro Jin Pak 1<br />
1 Department of Information & Statistics<br />
Dankook University<br />
Yongin, Korea<br />
Abstract. The difference and the relationship between the measurement of importance and the<br />
measurement of performance are of central interest in analyzing cus<strong>to</strong>mer <strong>satisfaction</strong>. Importanceperformance<br />
analysis (IPA) is known as a useful and convenient method for this purpose. Importance and<br />
performance are generally measured using five- or seven-points scales, so that they are intrinsically nominal<br />
or ordinal data. <strong>How</strong>ever, there is a tendency for IPA <strong>to</strong> be conducted as if observations were continuous data.<br />
In this paper, we propose <strong>to</strong> use categorical data model, such as the log-linear model and the multinomial<br />
logistic regression model, <strong>to</strong> analyze importance-performance data. We focus on two aspects for IPA <strong>to</strong> be<br />
more precise and useful in dealing <strong>with</strong> <strong>satisfaction</strong>/dis<strong>satisfaction</strong>: (1) IPA should be considered from the<br />
aspect of categorical data analysis and (2) how IPA contributes <strong>to</strong> <strong>satisfaction</strong>/dis<strong>satisfaction</strong>. We test the<br />
independence between the importance and the performance of attributes and test the dependency between<br />
(overall) <strong>satisfaction</strong> and performance using the log-linear model. Additionally, we investigate how the<br />
performance of attributes can raise overall <strong>satisfaction</strong> by utilizing the multinomial logistic regression model.<br />
This study uses data from a cus<strong>to</strong>mer <strong>satisfaction</strong> survey for an on-line lecture program that prepares students<br />
for the Korean Scholastic Aptitude Test.<br />
Keywords: categorical data analysis, IPA, multinomial logistic regression model, log linear models<br />
1. Introduction<br />
The IPA was first proposed by Martilla and James [14] as a consumer opinion survey technique for the<br />
au<strong>to</strong>motive industry. It has since been used in various fields [4][5][7][11][20]. The IPA, as a multidimensional<br />
decision-making technique, provides comparative information <strong>with</strong> four types of decisions: (1)<br />
keep up the good work, (2) concentrate here, (3) low priority, and (4) possible overkill. Survey respondents<br />
were asked in the questionnaire about degrees of importance and performance for a number of quality<br />
attributes. The ordered pairs of the averages (or medians) of the responses on importance and performance<br />
for the attributes are located on a two dimensional grid, where the importance is indicated by the y-axis, the<br />
performance is indicated by the x-axis and the pair of overall averages (or medians) of importance and<br />
performance is the origin. IPA locates the attributes of a product or a service on a two-dimensional grid<br />
defined by the four quadrants: quadrant I-Keep up the good work, quadrant II-Concentrate here, quadrant III-<br />
Low priority, and quadrant IV-Possible overkill.Two implicit assumptions underlie the IPA [13]: (1)<br />
Performance and cus<strong>to</strong>mer <strong>satisfaction</strong> is a linear relationship and (2) the variables, performance and<br />
importance, are independent and have no causal relationship. <strong>How</strong>ever, not all the researches executing IPA<br />
checked these assumptions. Importance and performance are usually measured using five- or seven-points<br />
scales, they should be considered as ordinal or nominal data. Log linear models [5][7][8][9][18] and<br />
multinomial logistic models [1][2][10][19] are useful in checking those assumption and analyzing<br />
importance-performance data. We demonstrate that the results from such categorical data analyses could<br />
Email: rjpak@dankook.ac.kr<br />
17
provide useful information <strong>to</strong> analyze cus<strong>to</strong>mer <strong>satisfaction</strong>. We focus on two aspects for IPA <strong>to</strong> be more<br />
precise and useful in dealing <strong>with</strong> <strong>satisfaction</strong>/dis<strong>satisfaction</strong>. First, IPA should be considered from the<br />
aspect of categorical data analysis; then determine how IPA contributes <strong>to</strong> <strong>satisfaction</strong>/dis<strong>satisfaction</strong>.<br />
An empirical study on cus<strong>to</strong>mer <strong>satisfaction</strong> <strong>with</strong> <strong>online</strong> education in Korea was undertaken. Online<br />
education or <strong>learning</strong> has experienced an early adaption across all sec<strong>to</strong>rs of education in Korea. The<br />
popularity of <strong>online</strong> courses or programs is rapidly rising, but at the same time, the students dissatisfied <strong>with</strong><br />
them. Now is the right time <strong>to</strong> study what causes the students the <strong>learning</strong> <strong>satisfaction</strong>/dis<strong>satisfaction</strong> when<br />
participating in <strong>online</strong> courses or programs. IPA and categorical data analysis provide useful ways <strong>to</strong><br />
enhance cus<strong>to</strong>mer <strong>satisfaction</strong>.<br />
2. Methods<br />
After examining several previous studies [3][16] the five key quality attributes of <strong>online</strong> education for<br />
students preparing for the Korean Scholastic Aptitude Test were determined <strong>to</strong> be; 1. accessibility, 2. cost, 3.<br />
text, 4. Lecturer, and 5. interaction. The importance and performance of each attribute were investigated by<br />
asking questions as follows; for example, “<strong>How</strong> important is it <strong>to</strong> access <strong>online</strong> classes <strong>with</strong>out regard for<br />
time and place?”, and “<strong>How</strong> well are you able <strong>to</strong> access <strong>online</strong> classes <strong>with</strong>out regard for time and place?”<br />
Respondents were asked <strong>to</strong> choose the appropriate response from one of five categories such as 1: extremely<br />
negative, 2: negative, 3: neutral', 4: positive, and 5: extremely positive. The overall <strong>satisfaction</strong> <strong>with</strong> the<br />
service quality of <strong>online</strong> education was also asked in addition <strong>to</strong> the questions concerning the five attributes.<br />
245 college students responded <strong>to</strong> the survey. Statistical analysis is done using SPSS 17.0.<br />
2.1. Test of independence and dependence<br />
In this section, we test independence or dependence among importance, performance, and <strong>satisfaction</strong>.<br />
Suppose X 1 = importance of accessibility, X 2 , = performance of accessibility, X 3 = overall <strong>satisfaction</strong> and<br />
consider a log linear model:<br />
log mijk<br />
= u + u1 ( i)<br />
+ u2(<br />
j)<br />
+ u3(<br />
k ) + u12(<br />
ij)<br />
+ u13(<br />
ik ) + u23(<br />
jk ) + u123(<br />
ijk ) for i,<br />
j,<br />
k = 1, …,5;<br />
where m ijk is the expected frequency when the importance of accessibility, the performance of accessibility<br />
and the overall <strong>satisfaction</strong> are at levels of i, j, and k, respectively. Then we estimate the effects of<br />
interactions u 12(ij) , u 13(ik) and u 23(jk) . We repeat such estimation for all other attributes. Table 1 lists the<br />
estimates and the corresponding significant probabilities of the interaction terms for the five attributes. We<br />
note that all the interactions between the importance and performance of the five attributes are significant,<br />
except for the ‘text’ attribute. That is, there is insufficient evidence <strong>to</strong> assume that the importance and<br />
performance of any attribute except ‘text’ are independent. In order <strong>to</strong> secure independence, we transform<br />
the five-point scale responses in<strong>to</strong> three-point scale responses, by encoding categories ‘1 and 2 → 1’ and ‘4<br />
and 5 → 5’ and ‘3 → 3’ <strong>to</strong> assure independence. After transformation, the independence between importance<br />
and performance for all attributes is assured at the 0.01 level of significance (Table 1). The dependence<br />
between overall <strong>satisfaction</strong> and performance of the attributes is guaranteed in both three- and five-point<br />
scales (Table 1). The averages of the importance and performance for the five attributes in both three- and<br />
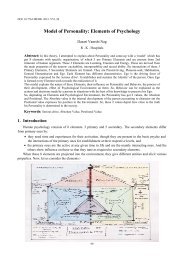
five-point scales are calculated and they are located on an IPA matrix in Figure 1. The IPA based on either<br />
five- or three-point scale places ‘lecturer’ in quadrant I, ‘text’ in quadrant II, both ‘cost’ and ‘interaction’ in<br />
quadrant III, and ‘accessibility’ in quadrant IV. The above transformation does not make big differences on<br />
the results of IPA, but the IPA based on three-point scale is justified and recommended for this example.<br />
2.2. Logistic modeling <strong>to</strong> enhance <strong>satisfaction</strong><br />
We perform the five multinomial logistic regressions for the overall <strong>satisfaction</strong> (a dependent variable)<br />
<strong>with</strong> each one of the five attributes as an independent variable. For each attribute, consider the multinomial<br />
logistic model,<br />
⎡ P(<br />
Y = j | x , x2<br />
) ⎤<br />
log⎢<br />
⎥ = β0<br />
+ β1x1<br />
+ β 2x2,<br />
j<br />
⎣ P(<br />
Y = 1| x1,<br />
x2<br />
) ⎦<br />
1 =<br />
3,5<br />
18
y taking the <strong>satisfaction</strong>’s reference level (or category) as level 1 and by letting x 1 , x 2 be dummy<br />
variables, such that the attribute’s level is 5 if x 1 =0, x 2 =0; 3 if x 1 =0, x 2 =1; and 1 if x 1 =1, x 2 =0,<br />
respectively. For example, if an attribute has been performed at the level of 1 (x 1 =1, x 2 =0), the odds of<br />
the <strong>satisfaction</strong>’s level j <strong>to</strong> the level 1 is<br />
P(<br />
Y = j | x 1 = 1, x2<br />
= 0)<br />
= exp[ β 0 + 1].<br />
P(<br />
Y = 1| x = 1, x = 0)<br />
β<br />
1<br />
2<br />
is<br />
Then, the odds ratio of the <strong>satisfaction</strong>’s level j <strong>to</strong> the level 1 if an attribute is performed at the level of 1<br />
P(<br />
Y = j | x<br />
P(<br />
Y = 1| x<br />
= 1, x<br />
= 1, x<br />
= 0)<br />
= 0)<br />
P(<br />
Y = j | x<br />
P(<br />
Y = 1| x<br />
= 0, x<br />
= 0, x<br />
exp[ β0<br />
+ β1]<br />
exp[ β1]<br />
=<br />
= .<br />
exp[ β + β ] + exp[ β ] exp[ β ] + 1<br />
0<br />
1<br />
1<br />
2<br />
2<br />
2<br />
0<br />
2<br />
1<br />
1<br />
2<br />
2<br />
= 1,0)<br />
= 1,0)<br />
Furthermore, the odds ratio of the <strong>satisfaction</strong>’s level j <strong>to</strong> the level i if an attribute is performed at the<br />
performance level of 1 (x 1 =1, x 2 =0) is<br />
PY ( = j|<br />
x1<br />
= 1, x2<br />
= 0) PY ( = j|<br />
x1<br />
= 0, x2<br />
= 0,1)<br />
PY ( = i|<br />
x1<br />
= 1, x2<br />
= 0) PY ( = i|<br />
x1<br />
= 0, x2<br />
= 0,1)<br />
⎡PY<br />
( = j|<br />
x1<br />
= 1, x2<br />
= 0) PY ( = j|<br />
x1<br />
= 0, x2<br />
= 0,1) ⎤<br />
= ⎢<br />
⎥<br />
⎣PY<br />
( = 1| x1<br />
= 1, x2<br />
= 0) PY ( = 1| x1<br />
= 0, x2<br />
= 0,1) ⎦<br />
⎡PY<br />
( = i|<br />
x1<br />
= 1, x<br />
⎢<br />
⎣PY<br />
( = 1| x1<br />
= 1, x<br />
2<br />
2<br />
= 0)<br />
= 0)<br />
PY ( = i|<br />
x1<br />
= 0, x<br />
PY ( = 1| x = 0, x<br />
1<br />
2<br />
2<br />
= 0,1) ⎤<br />
⎥.<br />
= 0,1) ⎦<br />
5<br />
concentrate here<br />
three-scale<br />
five-scale<br />
Keep up the good<br />
work<br />
lecturer<br />
4.5<br />
text<br />
lecturer<br />
text<br />
importance<br />
4<br />
interaction<br />
cost<br />
cost<br />
accessibility<br />
3.5<br />
interaction<br />
accessiblity<br />
3<br />
low priority<br />
possible overkill<br />
2 2.5 3 3.5 4<br />
performance<br />
five scale<br />
three scale<br />
Fig. 1: IPA diagram: three- & five-point scales<br />
Table 2 displays the multinomial regression estimation results. Table 3 records the odds ratios for the<br />
levels of <strong>satisfaction</strong> <strong>with</strong> the five attributes. Here are some examples about how <strong>to</strong> interpret those numbers<br />
in Tables 2 and 3. On the <strong>to</strong>p row in Table 2, the significant probability of <strong>satisfaction</strong> at level 3 when<br />
‘accessibility’ is performed at level 1 is .151 (>.05), that is, the chance that a student is moderately satisfied<br />
rather than less satisfied is not significant when ‘accessibility’ is performed at a low level. On the <strong>to</strong>p row in<br />
Table 3, the odds ratio of <strong>satisfaction</strong> of level 1 <strong>to</strong> level 3 is 0.533 if ‘accessibility’ is performed at level 1,<br />
while the ratio of <strong>satisfaction</strong> of the level 1 <strong>to</strong> level 5 is 0.267. This means that if the performance of<br />
‘accessibility’ is low, the odds that the level of <strong>satisfaction</strong> goes from ‘low’ <strong>to</strong> ‘moderate’ will be about 1.99<br />
19
times the odds that the level of <strong>satisfaction</strong> goes from ‘low’ <strong>to</strong> ‘high’. In a plain language it is unlikely that<br />
the student, who is less satisfied now, is going <strong>to</strong> be moderately or highly satisfied, as long as ‘accessibility’<br />
is performed at a low level. On the third row in Table 3, if the performance of ‘accessibility’ is low the odds<br />
ratio of <strong>satisfaction</strong> of level 5 <strong>to</strong> level 1 is 3.745, which is the largest number for ‘accessibility’. We may say<br />
that even if a student is highly satisfied now, there is a high chance that one will become less satisfied as<br />
long as ‘accessibility’ is performed at a low level. We can interpret all other numbers in Tables 2 and 3 in<br />
similar ways.<br />
3. Results<br />
The results are summarized below.<br />
• Accessibility: According <strong>to</strong> IPA, ‘accessibility’ has already achieved a high level of performance, but<br />
it has been over-invested. Even if a high level of performance of ‘accessibility’ would be achieved, a<br />
relatively small improvement in <strong>satisfaction</strong> is expected compared <strong>to</strong> other attributes.<br />
• Cost: Since ‘cost’ turns out <strong>to</strong> be a low priority attribute, it should be running at a moderate level of<br />
performance. Then, there is a relatively equal chance for <strong>satisfaction</strong> <strong>to</strong> rise or fall. Only a high-level<br />
performance for this attribute is expected <strong>to</strong> guarantee an <strong>increase</strong> in <strong>satisfaction</strong>.<br />
• Interaction: ‘Interaction’ is also classified as a low priority attribute, but a moderate level of<br />
performance should result in an <strong>increase</strong> in <strong>satisfaction</strong>. If it is performed at a high level, it is<br />
expected <strong>to</strong> cause the most dramatic <strong>increase</strong> in <strong>satisfaction</strong><br />
• Lecturer: This attribute belongs <strong>to</strong> ‘keep up the good work’, so it is necessary for ‘lecturer’ <strong>to</strong> be<br />
maintained in the current status. <strong>How</strong>ever, if this attribute is performed at a moderate level there<br />
would be a chance for <strong>satisfaction</strong> <strong>to</strong> <strong>increase</strong> or decrease. Unfortunately, if it is performed at a low<br />
level, there is a high chance that <strong>satisfaction</strong> will decrease. Hence, ‘lecture’ should be performed at<br />
least at the moderate level for <strong>satisfaction</strong> not <strong>to</strong> decrease.<br />
• Text: IPA recommends that this attribute is the subject for improvement; otherwise, <strong>satisfaction</strong> is<br />
expected <strong>to</strong> decline if it is performed at a low level. The good news is that a sharp <strong>increase</strong> in<br />
<strong>satisfaction</strong> seems possible if it is performed at a high level.<br />
• A dramatic rise in <strong>satisfaction</strong> is expected at high performance levels of 'interaction', 'instruc<strong>to</strong>r, and<br />
‘cost’, in that order. Although IPA places 'interaction' and 'cost' in quadrant III (low priority),<br />
maintaining the highest level of performance in these attributes <strong>with</strong>in revenue may optimize<br />
<strong>satisfaction</strong>.<br />
• In contrast, if 'accessibility', 'cost', and 'lecturer' reach a low level of performance, <strong>satisfaction</strong> could<br />
fall sharply. These three attributes are categorized as low in importance according <strong>to</strong> IPA, but less<br />
investment in them could lower <strong>satisfaction</strong> rapidly.<br />
• According <strong>to</strong> Kano, et al. [12], (1) ‘accessibility’ can be seen as a basic (or must-be) attribute,<br />
because <strong>satisfaction</strong> will remain unchanged at high level of performance while performance in low<br />
levels will result in downing <strong>satisfaction</strong>, (2) ‘cost’ and ‘lecturer’ can be classified as a onedimensional<br />
attribute, because the level of <strong>satisfaction</strong> tend <strong>to</strong> move in the same direction as the level<br />
of performance, and (3) ‘text’ and ‘interaction’ are thought of as exciting (or attractive) attributes,<br />
because dramatic <strong>increase</strong>s in <strong>satisfaction</strong> can be expected at high levels of performance for these two<br />
attributes, while <strong>satisfaction</strong> can be lowered or unchanged at the low level of performance.<br />
4. Conclusions<br />
IPA is known as a simple yet useful method <strong>to</strong> understand the effects of various fac<strong>to</strong>rs for <strong>satisfaction</strong>.<br />
In this article, we propose two additional techniques <strong>to</strong> enhance the usefulness of IPA. We use a <strong>satisfaction</strong><br />
survey of <strong>online</strong> education as an example. The log linear method enables us <strong>to</strong> check the basic assumptions<br />
on IPA, so we could fix the violations on such assumptions. Once IPA has been done, <strong>with</strong> the help of the<br />
multinomial logistic regression, we could determine how <strong>to</strong> enhance the <strong>satisfaction</strong> in conjunction <strong>with</strong> the<br />
results of IPA. With the help of the categorical data analysis, we could discover the some interesting facts<br />
that should be overlooked if only IPA is considered.<br />
20
Table 1.Effect of interaction between importance and performance<br />
Effect<br />
five-point scales<br />
three-point scales<br />
df Chi-Square Sig. Chi-Square Sig.<br />
accessibility_i accessibility_p 16 57.347 .000 31.681 .011<br />
cost_i cost_p 16 47.890 .000 22.182 .137<br />
interaction_i interaction_p 16 51.170 .000 18.689 .285<br />
lecturer_i lecturer_p 16 4.032 .001 12.255 .726<br />
text_i text_p 16 23.751 .095 6.711 .978<br />
<strong>satisfaction</strong> accessibility_p 16 48.431 .000 22.121 .000<br />
<strong>satisfaction</strong> cost_p 16 41.955 .000 33.196 .000<br />
<strong>satisfaction</strong> interaction_p 16 84.839 .000 44.909 .000<br />
<strong>satisfaction</strong> lecturer_p 16 11.960 .000 66.412 .000<br />
<strong>satisfaction</strong> text_p 16 84.369 .000 58.654 .000<br />
( _p and _i abbreviate performance and importance, respectively)<br />
Table 2.Results of multinomial logistic regression (reference category is <strong>satisfaction</strong> level 1)<br />
attribute <strong>satisfaction</strong> performace B Sig. Exp(B)<br />
3 1 -.629 .151 .533<br />
3 .788 .001 2.200<br />
accessibility<br />
5 .480 .055 1.615<br />
5 1 -1.322 .019 .267<br />
3 -.041 .886 .960<br />
5 .592 .015 1.808<br />
3 1 .092 .710 1.097<br />
3 .847 .001 2.333<br />
cost<br />
5 .310 .435 1.364<br />
5 1 -.601 .047 .548<br />
3 -.043 .884 .958<br />
5 1.157 .001 3.182<br />
3 1 -.405 .097 .667<br />
3 1.218 .000 3.381<br />
interaction<br />
5 .693 .327 2.000<br />
5 1 .388 .001 .357<br />
3 2.183 .038 1.762<br />
5 19.335 .001 7.667<br />
3 1 -2.398 .001 .091<br />
3 .794 .000 2.212<br />
lecturer<br />
5 1.003 .004 2.727<br />
5 1 -1.299 .005 .273<br />
3 -.361 .184 .697<br />
5 1.431 .000 4.182<br />
3 1 -.375 .176 .687<br />
3 1.114 .000 3.045<br />
text<br />
5 .288 .451 1.333<br />
5 1 -1.163 .001 .313<br />
3 .343 .219 1.409<br />
5 1.041 .002 2.833<br />
Table 3. odds ratios between <strong>satisfaction</strong> levels<br />
attribute<br />
accessibility<br />
cost<br />
interaction<br />
lecturer<br />
odds ratio <strong>satisfaction</strong> j<br />
performace <strong>satisfaction</strong> i 1 3 5<br />
1 1 1.000 .533 .267<br />
3 1.876 1.000 .501<br />
5 3.745 1.996 1.000<br />
3 1 1.000 2.200 .960<br />
3 .455 1.000 .436<br />
5 1.042 2.292 1.000<br />
5 1 1.000 1.615 1.808<br />
3 .619 1.000 1.120<br />
5 .553 .893 1.000<br />
1 1 1.000 1.097 .548<br />
3 .912 1.000 .500<br />
5 1.825 2.002 1.000<br />
3 1 1.000 2.333 .958<br />
3 .429 1.000 .411<br />
5 1.044 2.435 1.000<br />
5 1 1.000 1.364 3.182<br />
3 .733 1.000 2.333<br />
5 .314 .429 1.000<br />
1 1 1.000 .667 .357<br />
3 1.499 1.000 .535<br />
5 2.801 1.868 1.000<br />
3 1 1.000 3.381 1.762<br />
3 .296 1.000 .521<br />
5 .568 1.919 1.000<br />
5 1 1.000 2.000 7.667<br />
3 .500 1.000 3.834<br />
5 .130 .261 1.000<br />
1 1 1.000 .091 .273<br />
3 1.989 1.000 3.000<br />
21
text<br />
5 3.663 .333 1.000<br />
3 1 1.000 2.212 .697<br />
3 .452 1.000 .315<br />
5 1.435 3.174 1.000<br />
5 1 1.000 2.727 4.182<br />
3 .367 1.000 1.534<br />
5 .239 .652 1.000<br />
1 1 1.000 .687 .313<br />
3 1.456 1.000 .456<br />
5 3.195 2.195 1.000<br />
3 1 1.000 3.045 1.409<br />
3 .328 1.000 .463<br />
5 .710 2.161 1.000<br />
5 1 1.000 1.333 2.833<br />
3 .750 1.000 2.125<br />
5 .353 .471 1.000<br />
5. References<br />
[1] A. Agresti. Computing conditional maximum likelihood estimates for generalized Rasch models using simple<br />
loglinear models <strong>with</strong> diagonal parameters. Scandinavian Journal of Statistics. 1993, 20 (1): 63-71.<br />
[2] R. Bishop, S. Fienberg, and P. Holland. Discrete multivariate analysis: theory and practice. MIT Press, 1975.<br />
[3] L. Carswell, P. Thomas, M. Pete, B. Price, and M. Richards. Distance education via the Internet: the student<br />
experience. British Journal of Educational Technology. 2000, 31 (1): 29-46.<br />
[4] R. Chu, and T. Choi. An importance-performance analysis of hotel selection fac<strong>to</strong>rs in the Hong Kong hotel<br />
industry: a comparison of business and leisure travelers. Tourism Management. 2000, 21 (4): 363-377.<br />
[5] D. Cox, and E. Snell. Analysis of binary data (2nd ed.). Chapman & Hall, 1989.<br />
[6] M. Enright, and J. New<strong>to</strong>n. Tourism destination competitiveness: a quantitative approach. Tourism Management.<br />
2004, 25 (6): 777-788.<br />
[7] S. Haberman. Analysis of qualitative data, Vol. 1, Introduction <strong>to</strong>pics. Academic Press, 1978.<br />
[8] S. Haberman. Analysis of qualitative data, Vol. 2, Introduction <strong>to</strong>pics. Academic Press, 1979.<br />
[9] J. Hagenaars. Categorical longitudinal data-loglinear analysis of panel, trend and cohort data. Sage, 1990.<br />
[10] D. Hosmer, and S. Lemeshow. Applied logistic regression (2nd ed.). Wiley, 2000.<br />
[11] T. Huan, J. Beaman, and L. Shelby. Using action-grids in <strong>to</strong>urism management. Tourism Management. 2002, 23<br />
(3): 255-264.<br />
[12] N. Kano, S. Nobuhiku, T. Fumio, and T. Shinichi. Attractive quality and must-be quality. Journal of the Japanese<br />
Society for Quality Control. 1984, 14 (2): 39–48.<br />
[13] K. Matzler, F. Bailom, H. Hinterhuber, B. Renzl, and J. Pichler. The asymmetric relationship between attributelevel<br />
performance and overall cus<strong>to</strong>mer <strong>satisfaction</strong>: a reconsideration of the importance-performance analysis.<br />
Industrial Marketing Management. 2004, 33 (4): 271-277.<br />
[14] J. Martlla, and J. James. Importance-performance analysis. Journal of Marketing. 1977, 41 (4): 13-17.<br />
[15] M. O’Neil, and A. Palmer. Importance-performance analysis: a useful <strong>to</strong>ol for directing continuous quality<br />
improvement in higher education. Quality Assurance in Education. 2004, 12 (1): 39-52.<br />
[16] N. Shin, and J. Chan. Direct and indirect effects of <strong>online</strong> <strong>learning</strong> on distance education. British Journal of<br />
Education Technology. 2004, 35 (2): 275-288.<br />
[17] H. Tikkanen, K. Alajoutsijarvi, and J. Tahtinen. The concept of <strong>satisfaction</strong> in industrial markets: a contextual<br />
perspective and a case study from the software industry. Industrial Marketing Management. 2000, 29 (4): 373-386.<br />
[18] J. Vermunt. Log-linear models for event his<strong>to</strong>ry his<strong>to</strong>ries, Advanced Qualitative Techniques in the Social Science<br />
Series, Vol. 8. Thousand Oaks: Sage, 1997.<br />
[19] T. Wickens. Multiway contingency tables analysis for the social sciences. Lawrence Erlbaum Associates,<br />
Publishers, 1989.<br />
[20] H. Zhang, and I. Chow. Application of importance-performance model in <strong>to</strong>ur guides’ performance: evidence from<br />
mainland Chinese outbound visi<strong>to</strong>rs in Hong Kong. Tourism Management. 2004, 25 (1): 81-91.<br />
22