ekS - Instytut Agrofizyki im. Bohdana DobrzaÅskiego PAN w Lublinie ...
ekS - Instytut Agrofizyki im. Bohdana DobrzaÅskiego PAN w Lublinie ...
ekS - Instytut Agrofizyki im. Bohdana DobrzaÅskiego PAN w Lublinie ...
Create successful ePaper yourself
Turn your PDF publications into a flip-book with our unique Google optimized e-Paper software.
Fig. 14.<br />
Fig. 15.<br />
Fig. 16.<br />
Fig. 17.<br />
Fig. 18.<br />
Fig. 19.<br />
Fig. 20.<br />
Fig. 21.<br />
Fig. 22.<br />
Fig. 23.<br />
Fig. 24.<br />
Fig. 25.<br />
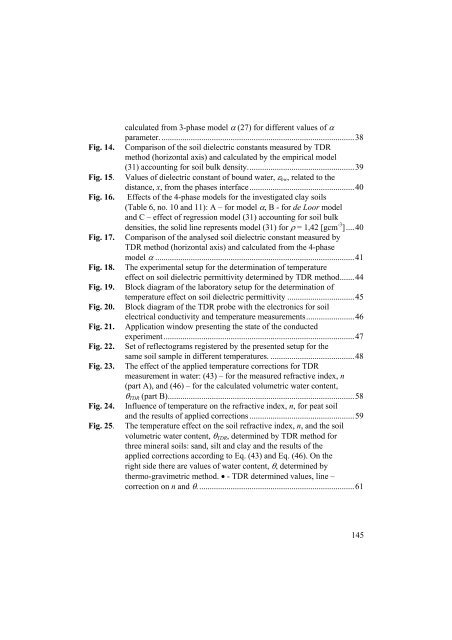
calculated from 3-phase model α (27) for different values of α<br />
parameter. ............................................................................................38<br />
Comparison of the soil dielectric constants measured by TDR<br />
method (horizontal axis) and calculated by the empirical model<br />
(31) accounting for soil bulk density...................................................39<br />
Values of dielectric constant of bound water, ε bw , related to the<br />
distance, x, from the phases interface..................................................40<br />
Effects of the 4-phase models for the investigated clay soils<br />
(Table 6, no. 10 and 11): A – for model α, B - for de Loor model<br />
and C – effect of regression model (31) accounting for soil bulk<br />
densities, the solid line represents model (31) for ρ = 1,42 [gcm -3 ]....40<br />
Comparison of the analysed soil dielectric constant measured by<br />
TDR method (horizontal axis) and calculated from the 4-phase<br />
model α ...............................................................................................41<br />
The exper<strong>im</strong>ental setup for the determination of temperature<br />
effect on soil dielectric permittivity determined by TDR method.......44<br />
Block diagram of the laboratory setup for the determination of<br />
temperature effect on soil dielectric permittivity ................................45<br />
Block diagram of the TDR probe with the electronics for soil<br />
electrical conductivity and temperature measurements.......................46<br />
Application window presenting the state of the conducted<br />
exper<strong>im</strong>ent...........................................................................................47<br />
Set of reflectograms registered by the presented setup for the<br />
same soil sample in different temperatures. ........................................48<br />
The effect of the applied temperature corrections for TDR<br />
measurement in water: (43) – for the measured refractive index, n<br />
(part A), and (46) – for the calculated volumetric water content,<br />
θ TDR (part B).........................................................................................58<br />
Influence of temperature on the refractive index, n, for peat soil<br />
and the results of applied corrections ..................................................59<br />
The temperature effect on the soil refractive index, n, and the soil<br />
volumetric water content, θ TDR , determined by TDR method for<br />
three mineral soils: sand, silt and clay and the results of the<br />
applied corrections according to Eq. (43) and Eq. (46). On the<br />
right side there are values of water content, θ, determined by<br />
thermo-grav<strong>im</strong>etric method. • - TDR determined values, line –<br />
correction on n and θ...........................................................................61<br />
145


