

C - Lublin
C - Lublin
C - Lublin

Create successful ePaper yourself
Turn your PDF publications into a flip-book with our unique Google optimized e-Paper software.
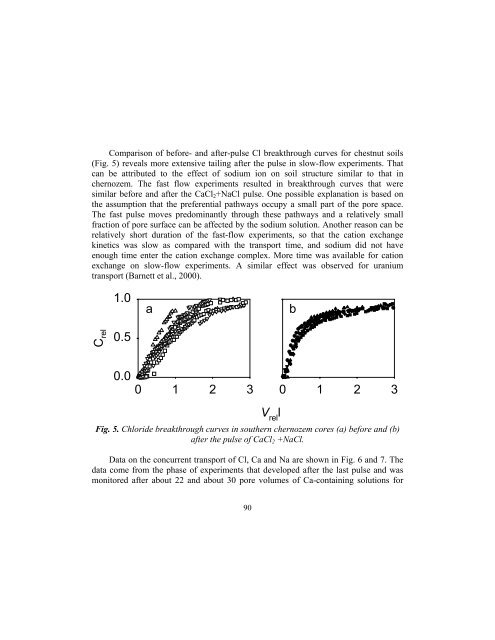
Comparison of before- and after-pulse Cl breakthrough curves for chestnut soils<br />
(Fig. 5) reveals more extensive tailing after the pulse in slow-flow experiments. That<br />
can be attributed to the effect of sodium ion on soil structure similar to that in<br />
chernozem. The fast flow experiments resulted in breakthrough curves that were<br />
similar before and after the CaCl 2 +NaCl pulse. One possible explanation is based on<br />
the assumption that the preferential pathways occupy a small part of the pore space.<br />
The fast pulse moves predominantly through these pathways and a relatively small<br />
fraction of pore surface can be affected by the sodium solution. Another reason can be<br />
relatively short duration of the fast-flow experiments, so that the cation exchange<br />
kinetics was slow as compared with the transport time, and sodium did not have<br />
enough time enter the cation exchange complex. More time was available for cation<br />
exchange on slow-flow experiments. A similar effect was observed for uranium<br />
transport (Barnett et al., 2000).<br />
1.0<br />
a<br />
b<br />
C rel<br />
0.5<br />
0.0<br />
0 1 2 3<br />
V rel<br />
l<br />
0 1 2 3<br />
Fig. 5. Chloride breakthrough curves in southern chernozem cores (a) before and (b)<br />
after the pulse of CaCl 2 +NaCl.<br />
Data on the concurrent transport of Cl, Ca and Na are shown in Fig. 6 and 7. The<br />
data come from the phase of experiments that developed after the last pulse and was<br />
monitored after about 22 and about 30 pore volumes of Ca-containing solutions for<br />
90


