Spring - InsideOutdoor Magazine
Spring - InsideOutdoor Magazine
Spring - InsideOutdoor Magazine

You also want an ePaper? Increase the reach of your titles
YUMPU automatically turns print PDFs into web optimized ePapers that Google loves.
the Use<br />
Intelligence<br />
Gear<br />
Real-Time Visibility<br />
Throughout the organization<br />
High Staff Turnover<br />
Capital Constraints<br />
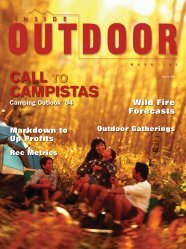
Camping’s Cool Gear, Lukewarm Outlook<br />
by Martin Vilaboy<br />
Store-Level IT Investment<br />
Meeting High Customer<br />
“Steady, consistent, predictable”: those certainly are terms Expectations Federal & State Taxes Generated<br />
that could describe the camping market during the past several by Activity Category, $Billions<br />
years. “Flat participation” is another way to look at it.<br />
Camping 0 10 20 30 40 50 60 70<br />
$36.4<br />
Bicycling<br />
And it’s hard to see the latter as anything other than negative,<br />
or at least worrisome, when considering the massive role Snow SMBsports All Retailers<br />
$8.8<br />
Percentage $17.7 of Respondents<br />
Trail $11.2<br />
camping sales play in the outdoor specialty sector. Camping-related<br />
Paddling $4.8<br />
activities, for example, annually generate almost as much Source: Fishing Gartner Group<br />
$4.1<br />
0.5 1<br />
retail gear sales as snow-, trail- and paddle-based recreations all<br />
Wildlife viewing $2.7<br />
Influence<br />
Hunting $2.2<br />
combined, say figures from Outdoor Industry Association. The<br />
Source: OIA<br />
federal and state taxes generated by camping are more than<br />
double those generated by bicycling, which is the number two Camping, for many, is thought of as a “family activity,” and<br />
activity in terms of tax dollars generated.<br />
How surveys Winners support Focus the on anecdotal Customer-Centricity<br />
assumptions that “camping” is<br />
Looking at the sheer numbers of participants, camping ranks<br />
Educate<br />
largely<br />
and empower<br />
reliant on families setting up a base next to their cars.<br />
behind only hiking, biking and fishing, according to OIA’s most our in-store In a 2005 employees OIA survey, for example, eight out of ten “car campers”<br />
90%<br />
recent participation figures, while the annual spending on durable<br />
using technology<br />
and about two-thirds of those who camped 67% away from<br />
goods per camping participant is second only to skiers their Add self-service cars (63 percent) said they go camping with other family 86%<br />
customer-facing Technologies<br />
among the primary categories of outdoor activities, at about members. We’d venture to guess that a goodly chunk 67% of the<br />
to Improve<br />
It’s all about our product<br />
$440 a year compared to skiers’ $480 a year.<br />
mix. If families we build it, found they at America’s campgrounds are what would 81% be<br />
nels<br />
considered will come. “traditional” families – two parents living together 80%<br />
U.S. Outdoor Activities Markets Comparison, 2006Focus on a<br />
with<br />
more convenient<br />
a couple of kids and maybe a dog.<br />
77%<br />
87%<br />
12%<br />
customerexperience<br />
64%<br />
Participants Gear Retail<br />
Category<br />
The problem is a shift in some U.S. demographics that’s<br />
(000s) Sales ($M)<br />
Improved in-store<br />
71%<br />
leading security to fewer and fewer traditional families to draw from.<br />
65% Camp-based recreation 23% 12% 45,161 $8,676<br />
69%<br />
More According personalized to figures from the U.S. Census and The Brookings<br />
Hunting 12,800 $6,886<br />
73%<br />
Institution, attention from both the average number of persons per household<br />
47% Fishing 36% 16% 32,900 $6,416<br />
our Employees<br />
58%<br />
Bicycle-based recreation 59,837 $6,230<br />
in the U.S. and 0% the percent 20% of family 40% households 60% compared 80% to 100%<br />
total U.S. households have been in decline for well more than<br />
71% Trail-based recreation 26%<br />
55,834 $3,340<br />
Retail Winners<br />
a decade, with those All declines Other<br />
Snow-based recreation 15,587 $3,125<br />
expected to continue into the<br />
5% Paddle-based 51% recreation14%<br />
23,596 $2,668<br />
foreseeable future.<br />
Source: Retail Systems Research<br />
Source: OIA<br />
Then again, maybe camping as a category really hasn’t had<br />
40% 34%<br />
a fair chance. For at least the last two decades, after all, the<br />
In other words, for most general outdoor stores, camping<br />
61%<br />
53%<br />
remains the 33% primary 6% reason why most folks walk through<br />
the doors, and with those campers come all manner of addon<br />
and impulse 38% sales. 9% Even for the more niche-enthusiast,<br />
sport specialty shops, it’s certainly not unusual for hard core<br />
Annual Durable Goods Expenditures Per Participant<br />
$500<br />
rtant<br />
climbers, Not paddlers very important or anglers to visit a campground as part<br />
of their play, so if camping is not a good part of your marketing<br />
$400<br />
and merchandising strategies, an opportunity likely<br />
t Important<br />
is being missed.<br />
$300<br />
Yet since OIA began tallying participation rates in<br />
1998, charts tracking how many people go camping and how $200<br />
often have been nothing but flat, with virtually no period of<br />
sustained growth.<br />
$100<br />
Certainly, it’s not hard to understand the powers working<br />
against camping’s popularity, such as some recent trends involving<br />
$0<br />
“done in a day” adventures, close-to-home pursuits and<br />
“outdoors as a gym.” At the same time, some much larger national<br />
trend lines aren’t exactly making the outlook any rosier for<br />
future participation.<br />
Bicycle<br />
Source: OIA<br />
Water Sports Camping Trail Snowsports<br />
34 | <strong>InsideOutdoor</strong> | <strong>Spring</strong> 2008