Shipping safety - Ingenia
Shipping safety - Ingenia
Shipping safety - Ingenia

You also want an ePaper? Increase the reach of your titles
YUMPU automatically turns print PDFs into web optimized ePapers that Google loves.
MARINE MATTERS<br />
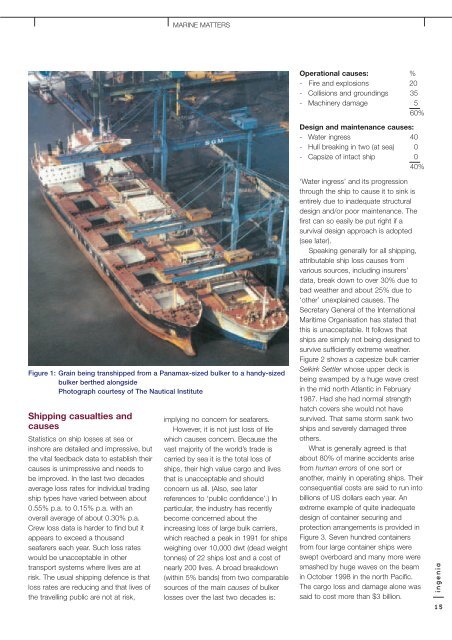
Figure 1: Grain being transhipped from a Panamax-sized bulker to a handy-sized<br />
bulker berthed alongside<br />
Photograph courtesy of The Nautical Institute<br />
<strong>Shipping</strong> casualties and<br />
causes<br />
Statistics on ship losses at sea or<br />
inshore are detailed and impressive, but<br />
the vital feedback data to establish their<br />
causes is unimpressive and needs to<br />
be improved. In the last two decades<br />
average loss rates for individual trading<br />
ship types have varied between about<br />
0.55% p.a. to 0.15% p.a. with an<br />
overall average of about 0.30% p.a.<br />
Crew loss data is harder to find but it<br />
appears to exceed a thousand<br />
seafarers each year. Such loss rates<br />
would be unacceptable in other<br />
transport systems where lives are at<br />
risk. The usual shipping defence is that<br />
loss rates are reducing and that lives of<br />
the travelling public are not at risk,<br />
implying no concern for seafarers.<br />
However, it is not just loss of life<br />
which causes concern. Because the<br />
vast majority of the world’s trade is<br />
carried by sea it is the total loss of<br />
ships, their high value cargo and lives<br />
that is unacceptable and should<br />
concern us all. (Also, see later<br />
references to ‘public confidence’.) In<br />
particular, the industry has recently<br />
become concerned about the<br />
increasing loss of large bulk carriers,<br />
which reached a peak in 1991 for ships<br />
weighing over 10,000 dwt (dead weight<br />
tonnes) of 22 ships lost and a cost of<br />
nearly 200 lives. A broad breakdown<br />
(within 5% bands) from two comparable<br />
sources of the main causes of bulker<br />
losses over the last two decades is:<br />
Operational causes: %<br />
- Fire and explosions 20<br />
- Collisions and groundings 35<br />
- Machinery damage 5<br />
60%<br />
Design and maintenance causes:<br />
- Water ingress 40<br />
- Hull breaking in two (at sea) 0<br />
- Capsize of intact ship 0<br />
40%<br />
‘Water ingress’ and its progression<br />
through the ship to cause it to sink is<br />
entirely due to inadequate structural<br />
design and/or poor maintenance. The<br />
first can so easily be put right if a<br />
survival design approach is adopted<br />
(see later).<br />
Speaking generally for all shipping,<br />
attributable ship loss causes from<br />
various sources, including insurers’<br />
data, break down to over 30% due to<br />
bad weather and about 25% due to<br />
‘other’ unexplained causes. The<br />
Secretary General of the International<br />
Maritime Organisation has stated that<br />
this is unacceptable. It follows that<br />
ships are simply not being designed to<br />
survive sufficiently extreme weather.<br />
Figure 2 shows a capesize bulk carrier<br />
Selkirk Settler whose upper deck is<br />
being swamped by a huge wave crest<br />
in the mid north Atlantic in February<br />
1987. Had she had normal strength<br />
hatch covers she would not have<br />
survived. That same storm sank two<br />
ships and severely damaged three<br />
others.<br />
What is generally agreed is that<br />
about 80% of marine accidents arise<br />
from human errors of one sort or<br />
another, mainly in operating ships. Their<br />
consequential costs are said to run into<br />
billions of US dollars each year. An<br />
extreme example of quite inadequate<br />
design of container securing and<br />
protection arrangements is provided in<br />
Figure 3. Seven hundred containers<br />
from four large container ships were<br />
swept overboard and many more were<br />
smashed by huge waves on the beam<br />
in October 1998 in the north Pacific.<br />
The cargo loss and damage alone was<br />
said to cost more than $3 billion.<br />
ingenia<br />
15


![[322/03] Francke - Ingenia](https://img.yumpu.com/23411337/1/184x260/322-03-francke-ingenia.jpg?quality=85)