Minilyzer ML1 User Manual
Minilyzer ML1 User Manual
Minilyzer ML1 User Manual

Create successful ePaper yourself
Turn your PDF publications into a flip-book with our unique Google optimized e-Paper software.
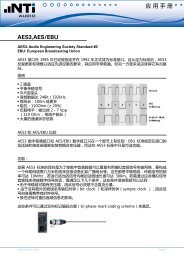
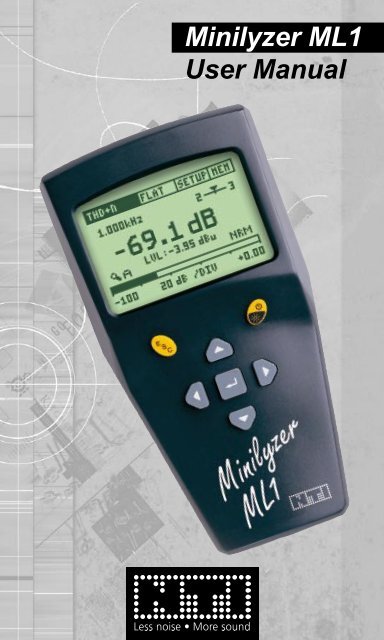
<strong>Minilyzer</strong> <strong>ML1</strong><br />
<strong>User</strong> <strong>Manual</strong>
NTi Audio Contact<br />
Headquarter: NTi Audio AG<br />
Im alten Riet 102<br />
9494 Schaan<br />
Liechtenstein, Europe<br />
Tel +423 - 239 6060<br />
Fax +423 - 239 6089<br />
E-mail info@nti-audio.com<br />
Home www.nti-audio.com<br />
NTi Audio is an ISO 9001:2008<br />
certified company.<br />
© NTi Audio AG<br />
All rights reserved.<br />
Subject to change without notice.<br />
Release 3.12 / May 2011 / Software V3.12<br />
<strong>Minilyzer</strong>, Minirator, MiniSPL and Minstruments<br />
are registered trademarks of<br />
NTi Audio AG.<br />
2<br />
Made in<br />
Switzerland
TAble of CoNTeNTs:<br />
1. In t r o d u c t Io n ....................................................................4<br />
CE Declaration of Conformity ...................................................... 4<br />
Registration ................................................................................. 5<br />
International Warranty and Repair .............................................. 6<br />
Warnings ..................................................................................... 7<br />
Overview ..................................................................................... 8<br />
Battery Replacement ................................................................... 9<br />
2. Ba s Ic op e r a t Io n ............................................................10<br />
Power ON/OFF - Backlight .........................................................11<br />
Escape .......................................................................................11<br />
Enter / Cursor Control ............................................................... 12<br />
Display Mode ............................................................................ 12<br />
Menu Bar ................................................................................... 13<br />
Inputs and Monitor Output ......................................................... 17<br />
Music Detection ......................................................................... 17<br />
3. Me a s u r e M e n t Fu n c t Io n s .................................................18<br />
Level RMS ................................................................................. 18<br />
Level Relativ .............................................................................. 19<br />
Sound Pressure Level ............................................................... 20<br />
THD+N ...................................................................................... 27<br />
vu + PPM .................................................................................. 28<br />
Polarity ...................................................................................... 30<br />
Signal Balance Error ................................................................. 32<br />
Sweep ....................................................................................... 33<br />
1/3<br />
3<br />
rd Octave RMS ...................................................................... 37<br />
1/3rd Octave SPL ....................................................................... 38<br />
Scope ........................................................................................ 40<br />
4. In d u c t Io n Lo o p Mo d e (o p t Io n a L) .....................................41<br />
5. tr o u B L e s h o o t In g ...........................................................46<br />
System Break Down .................................................................. 46<br />
Low Level Measurements ......................................................... 46<br />
6. ac c e s s o r I e s ...................................................................47<br />
MiniSPL ..................................................................................... 47<br />
MiniLINK .................................................................................... 47<br />
<strong>ML1</strong> Adapter -20dB ................................................................... 48<br />
Minstruments System Case ...................................................... 48<br />
7. te c h n Ic a L sp e c I F Ic a t Io n .................................................49<br />
Technical Data General Functions ............................................ 49<br />
Technical Data Acoustic Functions ............................................ 51<br />
Test & Calibration Certificate ..................................................... 52
1. INTroduCTIoN<br />
Congratulations and thank you for buying NTi Audio’s <strong>Minilyzer</strong><br />
<strong>ML1</strong>, a product specially suited for professional audio applications.<br />
The <strong>Minilyzer</strong> offers advanced analysis functions, expected only in<br />
much larger and more expensive systems. We are convinced you<br />
will enjoy using it!<br />
NTi Audio products are manufactured in compliance with the highest<br />
quality standards and marked with the CE sign.<br />
In order to avoid any damage to the unit, we strongly recommend to<br />
read the entire manual before you start using the instrument.<br />
Ce declaration of Conformity<br />
We, the manufacturer<br />
NTi Audio AG<br />
Im alten Riet 102<br />
9494 Schaan<br />
Liechtenstein, Europe<br />
hereby declare that the product <strong>Minilyzer</strong> <strong>ML1</strong>, released in 2000,<br />
conforms to the following standards or other normative documents.<br />
EMC-Directives: 89/336, 92/31, 93/68<br />
Harmonized Standards: EN 61326-1<br />
This declaration becomes void in case of any changes on the product<br />
without written authorization by NTi Audio.<br />
Date: 01.04.2000<br />
Signature:<br />
Introduction<br />
Position of Signatory: Technical Director<br />
4
egistration<br />
Register as a customer with NTi Audio and benefit from the following<br />
possibilities:<br />
• Keep your products up-to-date<br />
Access free firmware and software updates.<br />
• Activate options<br />
Enable additional functions for your products.<br />
• Access premium content<br />
Access downloads, information and specific support for your<br />
products.<br />
• Receive application and product news<br />
Sign in for the NTi Audio Newsletter.<br />
• Get fast worldwide support<br />
Register your products for fast support.<br />
• Confirm your ownership<br />
Allows us to contact you with important product notifications<br />
and provides a product record in case of loss or theft.<br />
How to register<br />
Introduction<br />
• Open the web page “http://my.nti-audio.com”.<br />
• You are prompted to login or create the My NTi Audio Account.<br />
• The web page “My NTi Audio Products” opens.<br />
• Select the product type and enter the serial number.<br />
• Confirm with “Register”.<br />
• Now the product is listed in the table “My NTi Audio Products“.<br />
5
Introduction<br />
International Warranty and repair<br />
International Warranty<br />
NTi Audio guarantees the <strong>Minilyzer</strong> and its components against<br />
defects in material or workmanship for a period of one year from<br />
the date of original purchase, and agrees to repair or to replace at<br />
its discretion any defective unit at no cost for either parts or labor<br />
during this period.<br />
restrictions<br />
This warranty does not cover damages caused through accidents,<br />
misuse, lack of care, the attachment or installation of any components<br />
that were not provided with the product, loss of parts, connecting the<br />
instrument to a power supply, input signal voltage or connector type<br />
other than specified, or wrongly polarized batteries. In particular,<br />
no responsibility is granted for special, incidental or consequential<br />
damages.<br />
This warranty becomes void if servicing or repairs of the product are<br />
performed by any party other than an authorized NTi Audio service<br />
center or if the instrument has been opened in a manner other than<br />
specified in this manual.<br />
No other warranty, written or verbal, is authorized by NTi Audio. Except<br />
as otherwise stated in this warranty, NTi Audio makes no representation<br />
or warranty of any kind, expressed or implied in law or in fact,<br />
including, without limitation, merchandising or fitting for any particular<br />
purpose and assumes no liability, either in tort, strict liability, contract<br />
or warranty for products.<br />
repair of your <strong>Minilyzer</strong> Ml1<br />
In case of malfunction, take - or ship prepaid - your NTi Audio <strong>Minilyzer</strong><br />
packed in the original box, to the authorized NTi Audio representative<br />
in your country. For contact-details please see the NTi Audio web<br />
page: www.nti-audio.com<br />
Be sure to include a copy of your sales invoice as prove of purchase<br />
date. Transit damages are not covered by this warranty.<br />
6
Warnings<br />
Introduction<br />
In order to avoid any problems during the operation of the instrument,<br />
follow the rules listed below:<br />
• Read this manual thoroughly before you operate the<br />
instrument for the first time.<br />
• Use the instrument for the intended purpose only.<br />
• Never connect the instrument to a high voltage output such<br />
as a power amplifier, mains power plug, etc.<br />
• Do not disassemble the instrument.<br />
• Never use the instrument in a damp environment.<br />
• Remove the batteries as soon as they are flat or if the<br />
instrument is not intended to be used for a longer period<br />
of time.<br />
7
Overview<br />
Introduction<br />
The <strong>Minilyzer</strong> <strong>ML1</strong> is a sophisticated audio test instrument, supporting<br />
a wide range of useful measurement functions. The results are<br />
displayed on a large LCD with backlight:<br />
• Level RMS, Relative or SPL (Sound Pressure Level)<br />
• THD+N (Total Harmonic Distortion + Noise)<br />
• vu-Indicator and PPM (Peak Program Meter)<br />
• Frequency<br />
• Polarity Test (in combination with NTi Audio’s Minirator)<br />
• Signal Balance Error<br />
• Sweep recording with respect to frequency or time<br />
• 1/3 rd Octave Spectrum RMS or SPL<br />
• Scope<br />
Additionally, several input filters are available, depending on the active<br />
measurement function:<br />
• A-weighting acc. IEC 61672<br />
• C-message acc. CCIR 468-4<br />
• 22 Hz Highpass acc. DIN 45045, -120 dB / dec.<br />
• 60 Hz Highpass acc. DIN 45045, -120 dB / dec.<br />
• 400 Hz Highpass acc. DIN 45045, -120 dB / dec.<br />
• Voice Bandpass acc. ITU-T P.48<br />
• C-weighting acc. IEC 61672<br />
• X-Curve -1 acc. ISO 2969<br />
The X-Curve -1 filter is especially applicable for the recording,<br />
monitoring and play-back of wide range soundtracks in indoor<br />
theatres, review rooms or cinemas. To measure the acoustic<br />
response in such rooms e.g. the Minirator MR1 shall be used with<br />
the pink noise signal selected. Via the <strong>Minilyzer</strong> the 1/3 rd octave<br />
spectrum has to be recorded using the X-Curve -1 filter. According<br />
the ISO-norm the result shall be a flat graph (a continuous noise<br />
spectrum having constant energy per 1/3 rd octave bandwidth).<br />
A setup screen allows to adjust four settings according to the specific<br />
demands of the user:<br />
• Auto power off duration<br />
• Auto backlight off duration<br />
• LCD contrast<br />
• Multiple setup (individual settings for up to 4 users)<br />
8
attery replacement<br />
Introduction<br />
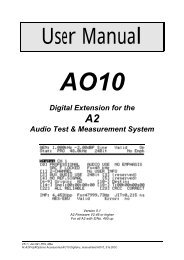
After unpacking, insert three (3) pcs. 1.5 V alkaline batteries, type AA,<br />
LR6, AM3 into the <strong>ML1</strong> battery compartment as shown in Fig 1 and Fig<br />
2. The typical life-time for a set of alkaline batteries is 16 hours.<br />
Fig 1.1 Open Battery Compartment Fig 1.2 Inserted Batteries<br />
NOTES • We do not recommend to use rechargeable NiCd- or<br />
NiMH-batteries.<br />
• Do not insert batteries of different types.<br />
• Note the correct polarities of the inserted<br />
batteries.<br />
• Remove the batteries as soon as they are flat and<br />
change all batteries at the same time.<br />
9
2. bAsIC operATIoN<br />
Basic Operation<br />
Despite the wide range of available measurement functions and<br />
optional setups, the operation of the <strong>Minilyzer</strong> is almost selfexplanatory.<br />
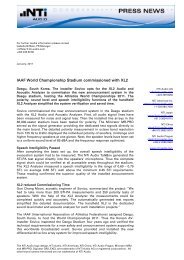
Fig 2.1 Display & Control Elements<br />
The LCD is divided in the menu bar on top (measurement function,<br />
filter, setup and running / low battery) and the results displayed below<br />
are showing various information’s about the current status.<br />
The cursor control keys and the escape button allow straightforward<br />
navigation through the available features to quickly get the required<br />
information’s like<br />
• Actual setup (measurement function, filters)<br />
• Status of the unit / batteries<br />
• Measurement results (numerical values and bargraph).<br />
10
Power ON/OFF - Backlight<br />
The yellow, oval-shaped key on the right hand side has the following<br />
functions:<br />
• Device on, press and hold it for at least one second to turn the<br />
unit on.<br />
• Backlight, press it shortly to activate the backlight.<br />
• Device off, press and hold it for at least two second to turn the<br />
unit off.<br />
The <strong>Minilyzer</strong> will start up in the same mode (e.g. measurement<br />
function) and with the same settings as it was switched off the last<br />
time. In case the setup screen has been selected at switching off the<br />
unit, the previous measurement function will be entered.<br />
The backlight may be activated at any time, without affecting the<br />
settings of the unit.<br />
Please note that the <strong>ML1</strong> has independent auto power off functions for<br />
main power and the backlight. These may be adjusted separately.<br />
escape<br />
Basic Operation<br />
The yellow key on the left-hand side labeled ESC, activates the<br />
escape (exit) function and may be selected at any time. Depending<br />
on the instrument status, pressing the ESC-key performs the following<br />
functions:<br />
• No menu is open, the cursor returns to its default position (top<br />
left field).<br />
• A selection menu is open, the menu gets closed, resetting the<br />
unit to the status in which it was opened.<br />
• In the SETUP mode, the executed changes are saved and the<br />
previous measurement mode is recalled.<br />
In other terms, by pressing the ESC-key maximum twice, the unit<br />
is reset to the last active status and the cursor returns to its default<br />
position.<br />
11
enter / Cursor Control<br />
The cursor is the core control element of <strong>ML1</strong>, providing access to<br />
its menus and to the current instrument settings. The cursor position<br />
is represented by an inverted display (white on black) of the field<br />
holding the cursor.<br />
The cursor may be moved from menu to menu by using the four gray<br />
arrow keys , , and . The enter key (↵) has to be pressed to<br />
enter a submenu or to confirm the current selection.<br />
To modify the menu status execute the following procedure:<br />
• Move the cursor to the field of interest and press the enter key.<br />
• Scroll to the required menu option by using the arrow keys.<br />
• Confirm your selection by pressing the enter key.<br />
Please note that in certain selection modes, the measurement result<br />
will be updated with the new selection even before the enter key has<br />
been pressed for confirmation.<br />
For instance, if a new level unit is selected - but not yet confirmed - the<br />
display will instantly update to the newly selected unit even before the<br />
enter key has been pressed for confirmation.<br />
In case of an unwanted change of any menu, the old status may be<br />
re-established by pressing the ESC-key.<br />
display Mode<br />
Basic Operation<br />
Giving a better readability the display mode determines the rapidity of<br />
following up input signal changes. The available modes are:<br />
• SLOW 3 sec. averaging<br />
• NRM 1 sec. averaging<br />
• FAST no averaging<br />
If averaging is active, measurements are smoothed in an exponential<br />
way (exponential time constant) before being displayed.<br />
12
Menu bar<br />
Basic Operation<br />
The menu bar, located at the top of the LCD, allows the user to select<br />
the measurement function, to activate a filter or to enter the setup<br />
screen. The field on the right hand side displays the battery voltage<br />
status of the unit.<br />
To make any selection move the cursor to one of the menu bar fields<br />
and press the enter key.<br />
a. selection of Measurement function<br />
Fig 2.2 Example of Function Submenu<br />
The entries of the pull down menu are the following:<br />
• LEVEL RMS<br />
• LEVEL REL - the RMS input level relative to a user-defined<br />
reference level<br />
• LEVEL SPL - sound pressure level<br />
• THD+N - total harmonic distortion and noise<br />
• vu + PPM - volume indicator and peak program meter, selectable<br />
standards are Type I, Type IIA, Nordic<br />
• POLARITY - analysis function corresponding to the Minirator MR1<br />
polarity test signal, acquired either by direct cable connection or<br />
through the built-in microphone of <strong>ML1</strong><br />
• BALANCE - the signal balance error quantitatives the level<br />
deviation between pin 2 and pin 3 of the XLR input connector<br />
• SWEEP - sweep recording with respect to frequency or time<br />
• 1/3 rd OCT. RMS - one third octave spectrum of line input signal<br />
• 1/3 rd OCT. SPL - one third octave spectrum of microphone input<br />
signal, sound pressure level<br />
• SCOPE - the time graph of the input signal<br />
13
. Selection of Filters<br />
Basic Operation<br />
Fig 2.3 Example of Filter Submenu<br />
There are two sets of filters with the following characteristics<br />
available:<br />
Set 1:<br />
FLAT Flat frequency response (no filtering)<br />
A-WTD A-weighting filter acc. IEC 60651<br />
C-MESS C-Message filter acc. CCIR Rec. 468-4<br />
HP22 Highpass 22 Hz acc. DIN 45045, -120 dB/dec.<br />
HP60 Highpass 60 Hz acc. DIN 45045, -120 dB/dec.<br />
HP400 Highpass 400 Hz acc. DIN 45045, -120 dB/dec.<br />
VOICE Voice band filter acc. ITU-T P.48<br />
Set 1 filters are applicable with the measurement functions LEVEL<br />
RMS, LEVEL REL, THD+N and SWEEP.<br />
Set 2:<br />
FLAT Flat frequency response (no filtering)<br />
A-WTD A-weighting filter acc. IEC 60651<br />
C-WTD C-weighting filter acc. IEC 60651<br />
X-CRV -1 inverted X-Curve filter acc. ISO 2969<br />
Set 2 filters are applicable with the measurement functions LEVEL-<br />
SPL and 1/3 rd OCT., whereby the X-CRV -1 filter is enabled in the<br />
1/3 rd OCT. mode only.<br />
Any selected filter will stay active until it is disabled by the user.<br />
However, if the filter is not supported by the measurement function,<br />
it will be disabled automatically.<br />
14
c. setup<br />
Basic Operation<br />
The setup screen allows to customize basic settings of the <strong>Minilyzer</strong><br />
<strong>ML1</strong> by the following procedure:<br />
• Move the cursor to the corresponding field and press enter<br />
• Select the required status by using the arrow keys<br />
• Press the enter key to confirm<br />
Fig 2.4 Setup Screen<br />
AuTo poWer off defines the time after the <strong>ML1</strong> is switched OFF<br />
automatically after the last key-press. The available settings are<br />
3 MIN, 10 MIN, 30 MIN, 60 MIN and DISABLE. In case DISABLE<br />
is selected, the user has to turn the unit off manually or it will run<br />
until the batteries are discharged.<br />
AuTo lIGHT off defines how long the backlight stays on after being<br />
activated. Possible selections are 3 SEC, 10 SEC., 60 SEC. and<br />
DISABLE. In the latter case, the backlight will stay on, until the unit<br />
is switched off. The longer the backlight is turned on, the shorter is<br />
the lifetime of the batteries.<br />
lCd CoNTrAsT adjusts the contrast of the display. Alternatively,<br />
press the ESC and up/down arrow key simultaneously in any<br />
measurement panel.<br />
MulTIple seTup allows four users to store their individual settings.<br />
To enable the multiple setup mode, set the corresponding entry to<br />
ENABLE and confirm. At the next the <strong>Minilyzer</strong> is switched on, the<br />
user will have to select the individual setup-ID (1, 2, 3 or 4) in the<br />
startup screen. All parameter settings in all measurement modes<br />
are now stored under this ID at switch off.<br />
INd. loop Mode allows to activate the AFILS measurement mode<br />
to measure & verify hearing aid installations.<br />
15
Basic Operation<br />
Fig 2.5 Multiple <strong>User</strong> Startup Screen<br />
NOTE Only the last recorded sweep curves will be stored<br />
independent on the selected user setup.<br />
d. low battery Indicator<br />
The "MEM" field is displayed in the right hand field of the <strong>ML1</strong> menu<br />
bar.<br />
Alternatively, if the inserted batteries<br />
are almost exhausted, this field will<br />
show a battery-low indicator .<br />
NOTE As soon as the batteries<br />
are discharged, they<br />
must be removed from<br />
the <strong>ML1</strong>, in order to<br />
avoid damage due to<br />
leakage.<br />
16<br />
Fig 2.6 Low Battery Indicator
Inputs and Monitor output<br />
On top of the <strong>ML1</strong>, three connectors as well as the internal microphone<br />
are located:<br />
• The XLR and RCA inputs allow to feed a signal to the <strong>ML1</strong>.<br />
• A 3.5 mm (1/8“) jack monitor output allows the connection of a<br />
headphone. Thus, the user may hear the input signal.<br />
• The internal microphone provides the possibility to test the polarity<br />
of an acoustical signal if the NTi Audio’s Minirator polarity check<br />
signal is played back. This especially serves to check the polarity<br />
of loudspeakers.<br />
Fig 2.7 Inputs and Outputs of <strong>ML1</strong><br />
NOTE Never connect the XLR- and the RCA input at the same<br />
time!<br />
Music detection<br />
Basic Operation<br />
Automatic gain control is applied to the input signal before being<br />
analyzed and made audible from the monitor jack. In this mode, the<br />
monitor signal behaves similar like a compressor output, whereby the<br />
user hears an almost constant sound pressure level. For input levels<br />
lower -20 dBu the gain is set to +20 dB.<br />
NOTE The automatic music detection is only available in<br />
the measurement functions LEVEL RMS, LEVEL REL,<br />
THD+N, POLARITY, BALANCE, SWEEP and SCOPE.<br />
17
3. MeAsureMeNT fuNCTIoNs<br />
Level RMS<br />
LEVEL RMS reflects the absolute level of the line input signal.<br />
Frequency<br />
Bargraph<br />
Zoom<br />
Mode<br />
Bargraph<br />
Zoom<br />
Control<br />
Measurement<br />
Function<br />
Measurement Functions<br />
Active<br />
Filter<br />
Bargraph with Scaling Information<br />
Fig 3.1 Level RMS Meter Panel<br />
18<br />
Signal<br />
Balance<br />
Level RMS<br />
Result and<br />
Unit<br />
Display<br />
Filter<br />
To enter the LEVEL RMS mode, select LEVEL -> RMS in the<br />
measurement functions submenu.<br />
signal balance: This indicates the deviation from level-match of the<br />
incoming balanced signal between pin 2 and pin 3 in percent (%).<br />
The position of the arrow indicates the following:<br />
• Arrow in center, the input signal is balanced.<br />
• Arrow out of center, linear indication of a balancing problem, e.g.<br />
arrow moves left nearer to the number 2 shows the signal level<br />
on pin 2 is higher than on pin 3.<br />
• Left or right end, the signal balance error is 33% or higher. 33%<br />
equals a difference in the signal level of 6 dB.<br />
• UNBAL, the signal balance symbol changes to UNBAL at the<br />
signal balance error exceeding 90%.<br />
result and unit: Level RMS. The units dBu, dBV, V are selectable.<br />
Bargraph: The bargraph provides an analog display of the RMS level.<br />
The scaling may be controlled automatically or manually.<br />
• Select manual (M) or automatic (A) scaling by the bargraph zoom<br />
mode field.<br />
• Within the manual scaling (M) select the bargraph zoom control,<br />
press enter and the left/right keys to scroll through the
actual range or the up/down keys to increase or decrease the<br />
range (sensitivity) of the bargraph scale.<br />
• Press enter to confirm your setting.<br />
display filter: see Display Mode<br />
NOTES • For balanced input levels higher than +20 dBu, the<br />
<strong>ML1</strong> Adapter -20dB may be applied. (for details see<br />
Accessories).<br />
• The LEVEL RMS function is also available in the<br />
sWeep mode and in 1/3 rd oCT. rMs mode<br />
Level Relativ<br />
This function measures the input RMS level, relative to a user-defined<br />
reference level.<br />
The reference level has to be<br />
defined in the following way:<br />
• Select the LEVEL REL<br />
mode<br />
• Apply the intended<br />
reference level to a<br />
<strong>ML1</strong> input connector.<br />
• Move the cursor to the<br />
REF field below the main<br />
result line and press the<br />
enter key<br />
Measurement Functions<br />
Fig 3.2 Level Relative Meter Panel<br />
19<br />
Reference Level<br />
This stores the applied level as the current reference level for all further<br />
level relative measurements until a new reference level is set. The<br />
level relative is indicated in dBr (dB relative) or %.<br />
The level relative function may be used to measure the signal-to-noise<br />
ratio (S/N) of a device under test (DUT) in the following manner:<br />
• Set the unit of the level relative measurement to dBr.<br />
• Connect the DUT output to the <strong>ML1</strong> and mute the DUT output.<br />
• Adjust the reference level to this signal as described above. By<br />
this, the ‘noise’ signal of the DUT is acquired.<br />
• Enable the DUT, thus applying the signal to the <strong>ML1</strong>. The resulting<br />
level relative value reflects the S/N ratio in dB.
Sound Pressure Level<br />
In the LEVEL SPL mode the <strong>Minilyzer</strong> measures the integratedaveraging<br />
level over time, the actual, minimum and maximum sound<br />
pressure level.<br />
NOTES • For this function a self powered microphone is<br />
required. NTi Audio does recommend to use the<br />
accessory MiniSPL (for details see Accessories).<br />
• Prior the first measurement the <strong>Minilyzer</strong> has to<br />
be calibrated to the microphone specifications.<br />
As default the <strong>ML1</strong> is calibrated according the<br />
Minispl.<br />
• No phantom power is available on the XLR-input.<br />
a. Sound Pressure Level Panel<br />
Calibration<br />
Minimum,<br />
Maximum or<br />
Actual SPL<br />
Measurement Functions<br />
Pause Clock<br />
SPL Bargraph with manual ranging<br />
Fig 3.3 Sound Pressure Level Panel<br />
20<br />
Equivalent<br />
Continious<br />
Sound<br />
Pressure<br />
Level<br />
Time<br />
Weighting<br />
To enter the LEVEL SPL mode (Fig 3.3), select LEVEL -> SPL in the<br />
measurement functions submenu.<br />
For most of the <strong>ML1</strong> applications, the sound pressure level<br />
measurements require the use of the A-weighting filter. To prevent<br />
wrong filter settings, causing wrong non-usable test results, the default<br />
filter setting of the “LEVEL->SPL” mode is A-weighting (A-WTD).<br />
Note: Each time the LEVEL SPL mode is selected the<br />
A-weighting filter is pre-set by default.
Measurement Functions<br />
start of measurement: The sound pressure level measurement is<br />
re-started every time<br />
• The LEVEL SPL screen is entered<br />
• The filter selection is changed.<br />
• The clock is reset.<br />
• The time weighting selection is changed.<br />
• The bargraph range selection (RNGE) is changed.<br />
Sound Pressure Level: The equivalent continuous sound pressure<br />
level (also time-averaged sound level) is indicated in dBL eq , dBL Aeq ,<br />
dBL Ceq , depending on the selected filter in the filter menu.<br />
Example:<br />
• select in the main menu the filter A-WTD<br />
• the measurement unit is changing to dBL Aeq and the minimum,<br />
maximum and actual sound pressure level readings below are<br />
A-weighted.<br />
Below the time-averaged SPL reading one of the following values<br />
may be displayed (select with the cursor keys):<br />
• ACT: actual sound pressure level (SPL)<br />
• MIN: minimum sound pressure level acquired during the<br />
measuring time indicated by the clock. The minimum value is<br />
stored until a new lower reading has been taken.<br />
• MAX: maximum sound pressure level acquired during the<br />
measuring time indicated by the clock. The maximum value is<br />
stored until a new higher reading has been taken.<br />
pause: The L eq and min./max. measurement may be freezed for a<br />
user defined time.<br />
• Select the pause symbol and press the enter key.<br />
• The pause symbol is flashing.<br />
• The actual SPL reading is continuously displayed and not<br />
freezed.<br />
• Select the pause symbol and press the enter key to continue the<br />
measurement, visible by the continuing counting clock.<br />
Clock: Duration in hours:minutes:seconds of the actual measurement;<br />
select the clock and press the enter key to reset the time and restart<br />
the measurement.<br />
21
Time weighting: All sound pressure level measurements include<br />
time weighting. A change in sound pressure level is read out on<br />
the display with a shorter or longer response time.<br />
Available response times, corresponding to IEC 60651, are<br />
• SLOW (long attack- and release time)<br />
• FAST (short attack- and release time)<br />
• IMP (=impulse, very short attack and long release time)<br />
Bargraph: The bargraph provides an analog display of the actual<br />
sound pressure level.<br />
Available bargraph ranges are:<br />
• 20 - 100 dB SPL<br />
• 40 - 120 dB SPL<br />
• 60 - 140 dB SPL<br />
Measurement Functions<br />
The selected bargraph range complies to the measurement range<br />
of the instrument. To achieve accuracy of the measurement within<br />
the specified tolerances the proper range must be selected, called<br />
primary indicator range. The two range indicator arrows assist to<br />
set the <strong>Minilyzer</strong> to the optimal range. As soon as the indicated<br />
bargraph value is found lower than the primary indicator range, the<br />
down arrow symbol below RNGE will start to move, symbolizing the<br />
actual bargraph reading is inaccurate. The lower bargraph range<br />
needs to be changed manually by selecting the moving left arrow<br />
symbol and pressing the enter key.<br />
Fig 3.4 SPL Panel with Overload<br />
22
By exceeding the primary indicator range four overload arrows<br />
replacing the dBL eq reading and no reading below is shown (see<br />
Fig. 13). Select the right arrow below RNGE and press enter to<br />
change to the next higher bargraph range. In case signal clipping<br />
has occurred the term OVL is flashing above the RNGE field as long<br />
as this peak, is significant influencing the integrating sound pressure<br />
level reading. For example an SPL peak for 0.1 sec. will have effects<br />
to the L eq reading for several seconds but it’s contribution can be<br />
neglected after ten minutes.<br />
b. SPL/LEQ Logging<br />
The <strong>Minilyzer</strong> together with the optional MiniLINK USB PC interface<br />
enables the data logging of all test results.<br />
Note: The logging function is a free add-on to the<br />
MiniLINK, available after the registration of your test<br />
instrument<br />
The <strong>Minilyzer</strong> can record the SPL/LEQ curve flow, e.g. during an<br />
event, for many hours. The results can then be loaded to a PC and<br />
visualized as a level diagram using e.g. Microsoft Excel.<br />
The stored results remain within the <strong>Minilyzer</strong> memory even in the<br />
event of a battery failure during the recording session.<br />
Fig 3.5 SPL Logging Start<br />
Measurement Functions<br />
23<br />
Start SPL/LEQ logging<br />
After the <strong>ML1</strong> is successfully<br />
registered, you will find<br />
the additional "LOG AS ...“<br />
function in the LEVEL SPL<br />
memory menu. This feature<br />
enables you to record the<br />
following test results:<br />
• Actual SPL and LEQ<br />
value<br />
• LEQ Overload<br />
• At each recording interval:<br />
SPL averaged, minimum<br />
and maximum
Fig 3.6 SPL Logging Setting<br />
Fig 3.7 SPL/LEQ Memory<br />
Measurement Functions<br />
24<br />
setting of recording time<br />
The maximum recording time<br />
(END) of the sound pressure<br />
level logging depends on the<br />
remaining memory and the<br />
selected test interval period<br />
(T). The logger may record a<br />
maximum of 1500 points over<br />
a custom defined time.<br />
The test interval period (T) can<br />
be defined by the user in the<br />
format hh:mm:ss.<br />
Review logging records<br />
When checking the recorded<br />
data in the memory overview,<br />
the “SPL/LEQ LOG DATA“<br />
screen is displayed. The<br />
result table is stored together<br />
with this screenshot and can<br />
be read out by using the<br />
MiniLINK PC software.<br />
Note: During the <strong>ML1</strong> SPL/LEQ logging the change of<br />
settings is not possible.
c. Calibration Panel<br />
Measurement Functions<br />
The <strong>Minilyzer</strong> <strong>ML1</strong> enables the calibration of microphones, such as<br />
the MiniSPL.<br />
Fig 3.8 Calibration Panel<br />
Select CALIB. in the LEVEL SPL panel field. Press the enter key and<br />
the calibration screen SET SENSITIVITY ... will be displayed (Fig 14).<br />
The following three calibration modes are available:<br />
TO DEFAULT MINISPL-MIC: All MiniSPL are factory calibrated to a<br />
sensitivity of 20.0 mV/Pa. Reset to default setting:<br />
• Select the GO! field on the left.<br />
• Press the enter key to start.<br />
• OK! is shown to confirm the completed calibration.<br />
USING EXT. REF.: The sensitivity may be adjusted with an external<br />
calibrator to produce a certain calibrated sound pressure level.<br />
• Select the dB SPL -value, press the enter key and adjust with the<br />
cursor keys the sound pressure level generated by the calibrator.<br />
Use up/down keys for 1.0 dB SPL steps and left/right keys for 0.1<br />
dB SPL steps. The setting range 80 - 140 dB SPL is supported.<br />
• Confirm the setting with the enter key.<br />
• Produce the specific reference signal with the calibrator to the<br />
microphone attached.<br />
• Press the left cursor key to select the GO! field and press enter to<br />
execute the calibration, whilst the reference signal of the calibrator<br />
is still present.<br />
• The frame WORKING ... followed by the frame CALIBRATION<br />
FINISHED! is shown centered on the calibration screen if all has<br />
been found in good order. Otherwise various error indications may<br />
25
Measurement Functions<br />
be displayed to inform the user about the detailed problem.<br />
• The new sensitivity is calculated by the <strong>Minilyzer</strong> and shown<br />
below USING EXT. REF.: in mV/Pa.<br />
• Press the ESC button to exit the calibration mode and return to<br />
the LEVEL SPL screen.<br />
• Check the calibration by applying the reference signal again to the<br />
attached microphone. The sound pressure level of the calibrator<br />
shall be shown to confirm the calibration is carried out in good<br />
order.<br />
Error indications will appear during the calibration caused by<br />
low/high input level or the calculated sensitivity is out of the range<br />
2 - 80 mV/Pa.<br />
Fig 3.9 Calibration Finished<br />
MANUALLY:<br />
• Select the setting value xx.x mV/Pa.<br />
• Press enter and select with the cursor keys the sensitivity<br />
according to the attached microphone, use up/down keys for<br />
1.0 mV/Pa steps and left/right keys for 0.1 mV/Pa steps. The<br />
setting range 2 - 80 mV/Pa is supported.<br />
Simply press the ESC button to exit from the calibration screen<br />
back to the LEVEL SPL screen. The new measurement is started<br />
immediately.<br />
26
THd+N<br />
Measurement Functions<br />
In this mode the <strong>Minilyzer</strong> measures the THD+N (Total Harmonic<br />
Distortion + Noise) and the k2 - k5 harmonic distortion.<br />
Fig 3.10 THD+N Meter Panel<br />
27<br />
Input Level<br />
(RMS)<br />
The measurement is carried out in the band from 10 Hz - 20 kHz,<br />
expressed in dB or in %. Simultaneously, the LCD shows the actual<br />
RMS input level or the 2nd, 3rd, 4th & 5th harmonics distortion below<br />
the THD+N result.<br />
NOTE The THD+N results are calculated using a restricted<br />
measuring bandwidth of 10 Hz - 20 kHz.<br />
Besides checking the linear purity of a sine signal - e.g. measuring<br />
amount of harmonic distortions - this measurement mode is<br />
particularly suited to get a quick idea whether unwanted disturbances<br />
like hum are present.
vu + PPM<br />
<strong>ML1</strong> provides vu + PPM (Peak Program Meter) measurement results,<br />
following IEC60268.<br />
Reference<br />
Level<br />
Measurement Functions<br />
Integration Time<br />
28<br />
Reference Indicator<br />
Fig 3.11 vu + PPM (Type I) Panel<br />
Numerical<br />
Peak-Hold<br />
Graphical<br />
Peak-Hold<br />
The PPM may be measured according to three standards:<br />
• Type I<br />
• Type IIA<br />
• Nordic standard<br />
One of these standards has to be selected when entering the vu+PPM<br />
mode through the measurement functions menu.<br />
The following chapters describe the different entry fields and indicators<br />
of the vu+PPM display.<br />
a. Reference Level & Indicator<br />
The reference level indicates the RMS level of a 1 kHz sine wave that<br />
defines the value of the reference indicator. The reference level may<br />
be defined by the user in a range of -20 dBu to +14 dBu.<br />
The default reference level depends on the selected standard<br />
• +4 dBu for the vu-meter<br />
• +6 dBu for the PPM standards Type I and Nordic<br />
• +8 dBu for the PPM standard Type IIA.
The following examples explain the correlation between the reference<br />
level and the reference indicator.<br />
Example 1<br />
Given vu-meter reference level set to +4 dBu<br />
Input signal = steady-state sine wave of +4 dBu<br />
Result vu meter level = 0 (reference indicator level)<br />
Example 2<br />
Given vu-meter reference level set to 0 dBu<br />
Input signal = steady-state sine wave of +4 dBu<br />
Result vu-meter level = +4 (+4 dB above reference indicator)<br />
Example 3<br />
Given PPM Nordic standard, reference level set to +12 dBu<br />
Input signal = steady-state sine wave of +6 dBu<br />
Result PPM level = TST (-6 dBu below reference indicator level)<br />
b. Peak Hold<br />
There are two different types of peak hold on the vu+PPM screen:<br />
• Two numerical peak hold indications, located above the right<br />
hand end of the vu and the PPM bargraph.<br />
The numerical peak hold indicates the all-time max. input level<br />
since the vu+PPM mode has been entered. It may be reset by<br />
placing the cursor to it and pressing the return key.<br />
To reset the two numerical peak-hold simultaneously, simply<br />
re-enter the vu+PPM mode.<br />
• Two graphical peak hold indications, represented by a vertical line<br />
in each bargraph. The graphical peak hold display has a decay<br />
time of approximately one second.<br />
c. Integration Time<br />
Measurement Functions<br />
The PPM display provides an additional entry field to select the attack<br />
and release times between NRM (normal) and FAST.<br />
• In the NRM mode, the value of the integration time is given by the<br />
corresponding standard (Type I: 5 ms; Type IIA: 10 ms; Nordic:<br />
5 ms)<br />
• In the FAST mode, the integration time is 1 ms for all<br />
standards.<br />
29
polarity<br />
Measurement Functions<br />
The polarity test function detects the correct cable and speaker polarity<br />
in combination with the Minirator. The <strong>Minilyzer</strong> provides the following<br />
test configurations:<br />
a. Speaker polarity test<br />
Fig 3.12 Speaker Polarity Panel<br />
Fig 3.13 Woofer Polarity Panel<br />
30<br />
Feed the speaker system<br />
with the polarity-test signal of<br />
the Minirator and adjust the<br />
level (at Minirator or amplifier)<br />
that the test signal is good<br />
to hear.<br />
<strong>Minilyzer</strong> settings:<br />
• IN:MIC (INT), using the<br />
internal mic of the <strong>Minilyzer</strong><br />
<strong>ML1</strong><br />
• IN:XLR/RCA, using an<br />
external mic, such as the<br />
MiniSPL<br />
Choose the polarity test<br />
frequency range:<br />
• FULL/MID, for tests with<br />
wide band speakers<br />
• WOOFER, for tests with<br />
woofers<br />
Note: Please note the polarity testing is a simplified<br />
measurement of a very complex signal phasing.<br />
Drivers, speakers and cross-overs cause severe<br />
phase shifts of the audio signal.<br />
The polarity of various speakers within the same<br />
cabinet can be different. This is not a problem nor<br />
caused by bad speaker design.<br />
Polarity testing is useful for checking the correct wiring<br />
of similar speaker systems.
An overrange indicator appears for levels exceeding the instruments<br />
operating range. In this case increase the distance between<br />
microphone and loudspeaker or reduce the volume.<br />
b. Cable polarity test<br />
Use the polarity test signal of the Minirator to feed the cable under<br />
test. The <strong>Minilyzer</strong> analyzes the signal polarity at the other end of<br />
the cable.<br />
Fig 3.14 Cable Polarity Panel<br />
31<br />
<strong>Minilyzer</strong> settings:<br />
• IN: XLR/RCA,<br />
• Mode: Cable<br />
The following problems may be detected quickly and easily in this<br />
way:<br />
• Wrong polarity, caused by wrong or defective wiring inside the<br />
cable<br />
• Cable problems<br />
Measurement Functions<br />
unsymmetrical signals, displayed with the balance indicator, can<br />
lead to the accurate detection of various cable problems, such<br />
as<br />
• “–UBAL–“ leads to a broken internal wire at a symmetrical XLR<br />
cable<br />
• The balance indicator out of center leads to other cable problems<br />
as explained in detail in the NTi Audio application note “Signal<br />
Balance“ (available for download at the NTi Audio website<br />
www.nti-audio.com).<br />
The level measurement is very useful for applications, such as<br />
testing of multicore cables, providing additional information about<br />
the cable quality.
signal balance error<br />
Measurement Functions<br />
The signal balance error reflects the deviation from the perfect<br />
balance status. No signal balance error indicates that the absolute<br />
levels at XLR-pin 2 and pin 3 relative to pin 1 (ground) are identical<br />
and opposite in polarity.<br />
Bargraph<br />
Zoom Mode<br />
Bargraph<br />
Zoom<br />
Control<br />
Frequency of<br />
Input Signal<br />
Signal Balance<br />
Error<br />
Bargraph with Scaling Information<br />
Fig 3.15 Signal Balance Error Screen<br />
32<br />
Balance Indicator<br />
XLR-pin 2,3<br />
Input<br />
Level-RMS<br />
In the BALANCE mode, the signal balance error is shown in a numerical<br />
value, which is the deviation from the optimum in percent.<br />
balance Indicator: The direction of the deviation is indicated by the<br />
arrows like 2 < 3 or 2 > 3, whereby the numbers 2 and 3 represent<br />
the signal at XLR-pin 2 and pin 3.<br />
In the Level, THD+N and Polarity (electrical input only) measurement<br />
function, the <strong>Minilyzer</strong> permanently monitors the balance of the input<br />
signal by a graphical indicator. This enables e.g. to check whether<br />
cable connections are made correctly.<br />
Bargraph: The bargraph shows an analog display of the signal<br />
balance error. The scaling may be controlled automatically or<br />
manually.<br />
• Select manual (M) or automatic (A) scaling by the bargraph zoom<br />
mode field.<br />
• Within the manual scaling press the left/right keys to scroll through<br />
the actual range or the up/down keys to increase or decrease the<br />
range (sensitivity) of the bargraph scale.<br />
• Press enter to confirm your setting.
sweep<br />
<strong>ML1</strong> supports two sweep modes:<br />
• LEVEL RMS as function of frequency<br />
• LEVEL RMS, THD+N and Frequency as function of time<br />
The required sweep mode may be selected through the SWEEP entry<br />
of the measurement function submenu.<br />
a. frequency sweep<br />
During a frequency sweep, <strong>ML1</strong> records the LEVEL RMS of every<br />
input signal that has a stable frequency and level, provided that the<br />
frequency is higher than the one of the previous sample (otherwise<br />
the sample will be neglected).<br />
Arrow Mode<br />
Control<br />
Y-Scale<br />
Zoom Mode<br />
REC /Stop<br />
Control<br />
Measurement Functions<br />
Measurement Mode<br />
Fig 3.16 Frequency Sweep Graph<br />
33<br />
Filter<br />
Arrow Readout<br />
Within a graph, every recorded sample is connected by a straight<br />
line approximation to the previous/next sample, thus building the<br />
displayed curve.<br />
In practice, the following steps are required / available for the execution<br />
of a frequency sweep.<br />
• To enter the frequency sweep mode, select in the measurement<br />
function submenu SWEEP -> FREQ.<br />
• If required activate a filter through the corresponding menu.
Measurement Functions<br />
• Arm the sweep recording process by moving the cursor to the<br />
REC field and press the enter key. Make sure that the signal<br />
generator is at its lowest sweep frequency when the recording<br />
process is starting.<br />
• The unit detects the start tone (315 Hz or 1 kHz) of an external<br />
sweep and as soon the frequency changes the recording is<br />
automatically started. This status is indicated by the flashing<br />
REC field.<br />
Alternatively, the sweep recording may be started manually<br />
by pressing the enter key with the cursor on the ARM field.<br />
Consequently, <strong>ML1</strong> records every incoming signal with a higher<br />
frequency than the previous sample.<br />
• The sweep recording will be stopped as soon as an input signal<br />
with a lower frequency occurs, or as soon as the enter key is<br />
pressed with the cursor on the flashing REC field.<br />
• In order to analyze the sampled curve more detailed, activate the<br />
arrow mode by placing the cursor to the corresponding symbol,<br />
press the enter key, and move the arrow to the sample(s) of<br />
interest by using the left / right keys.<br />
• To zoom in/out the Y-axis, move the cursor to the zoom mode<br />
field, press enter and use the left / right keys.<br />
• To scroll through the Y-axis, move the cursor to the zoom mode<br />
field, press enter and use the up / down keys.<br />
The last recorded sweep curve will be stored internally, even after<br />
leaving the sweep mode or switching off the <strong>Minilyzer</strong>. As soon as<br />
the frequency sweep mode is re-entered, the curve will re-appear on<br />
the graph, until a new frequency sweep is started.<br />
NOTES • As soon as the sweep mode is entered, the filter<br />
that has been active during the recording of the last<br />
curve will be re-activated.<br />
• The auto power off is disabled during a frequency<br />
sweep recording.<br />
34
. Time Sweep<br />
In the TIME SWEEP mode, <strong>ML1</strong> records a user-defined number of<br />
measurements in selectable time intervals.<br />
Arrow Mode<br />
X-Axis Scroll<br />
Indicator<br />
Mean /<br />
Min-Max<br />
Mode<br />
Y-Axis<br />
Zoom Mode<br />
Measurement Functions<br />
Readout Line<br />
Arrow Readout<br />
Fig 3.17 Time Sweep Graph<br />
35<br />
Curve<br />
REC /Stop<br />
Control<br />
Scaling refers<br />
to this line<br />
Thereby, the unit simultaneously records the mean and the min-max<br />
values of:<br />
• LEVEL RMS and<br />
• THD+N and<br />
• Frequency<br />
The curves of these measurement functions are stored in individual<br />
graphs. Within a graph, every sample is represented by a single dot<br />
only, thus building the displayed curve.<br />
In practice, the following steps are required / available for the execution<br />
of a time sweep:<br />
• To enter the time sweep mode, select the entry SWEEP → TIME<br />
in the measurement function submenu.<br />
• If required, activate a filter through the corresponding menu.<br />
• To select the curve to be displayed (LEVEL RMS, THD+N or<br />
Frequency) move the cursor to the curve entry, press enter key,<br />
use the arrow keys and confirm with the enter key.<br />
• To select the mean / min-max mode, move the cursor to the<br />
corresponding field, press enter and the arrow keys.<br />
The curve and the mean/min-max mode can also be<br />
selected after the sweep recording is completed.<br />
• Move the cursor to the REC field and press enter.
A dialog box will open (Fig<br />
3.18) on the graph, where the<br />
sweep duration (min. 60 sec<br />
- max. battery lifetime) and the<br />
recording interval (≥ 1 sec) have<br />
to be entered. Please note that<br />
the number of samples must be<br />
between 60 - 1600.<br />
Measurement Functions<br />
36<br />
Fig 3.18 Time Sweep Setup<br />
• To start the sweep recording, move the cursor to the GO! field<br />
and press enter.<br />
• The time sweep automatically stops when the defined duration<br />
has expired. Alternatively, the sweep may be stopped manually<br />
by pressing enter with the cursor on the REC field.<br />
• To display the mean or the min-max values of the recorded sweep,<br />
place the cursor to the corresponding field and select the required<br />
mode by using the enter and the arrow keys.<br />
• In order to analyze the sampled curve more detailed, activate the<br />
arrow mode by placing the cursor to the corresponding symbol<br />
and pressing the enter key. Move the readout line to the sample(s)<br />
of interest by using the left / right keys, or press the up/down keys<br />
to zoom out/in the X-axis.<br />
• To zoom in/out the Y-axis, move the cursor to the zoom mode<br />
field, press enter and<br />
- use the up/down keys to zoom out/in the Y-axis<br />
- use the left/right keys to scroll through the Y-axis.<br />
The last time sweep recording will be stored internally, even after<br />
leaving the sweep mode or switching off the <strong>Minilyzer</strong>. As soon as the<br />
time sweep mode is re-entered, the last displayed curve will appear<br />
on the graph, until a new time sweep recording is started.<br />
NOTES • As soon as the sweep mode is entered, the filter<br />
that has been active during the recording of the last<br />
curve will be re-activated.<br />
• If a running time sweep is stopped due to empty<br />
batteries, the recorded data will not be lost.<br />
• The auto power off is disabled during a time<br />
sweep.
1/3 rd Octave RMS<br />
The 1/3 rd OCTAVE RMS screen shows the signal frequency spectrum<br />
of the line-in signal, divided into 31 bands.<br />
Arrow<br />
Mode<br />
Run/Pause<br />
Zoom<br />
(Y-Axis)<br />
Time<br />
Constant<br />
Measurement Functions<br />
Arrow Readout<br />
Bargraph of Level-RMS (fullband)<br />
Fig 3.19 1/3 rd Octave RMS Screen<br />
37<br />
1/3rd Octave<br />
Spectrum<br />
Scaling<br />
of Y-Axis<br />
To enter the 1/3 rd OCTAVE RMS mode, select 1/3 rd OCT. -> RMS in<br />
the measurement functions submenu.<br />
Arrow readout: The arrow readout displays the frequency and<br />
the level of the 1/3 rd octave band that it points to. The arrow<br />
automatically points to the highest level in the 1/3 rd octave spectrum,<br />
or, alternatively may be controlled manually.<br />
Arrow Mode: The arrow readout may be moved manually to a certain<br />
specific 1/3 rd octave band.<br />
• Select the arrow mode field and press the enter key.<br />
• Move the arrow to any frequency by using the left/right keys.<br />
run/pause: The 1/3 rd octave spectrum may be freezed.<br />
• Select the run/pause field and press the enter key.<br />
• The1/3 rd octave spectrum is freezed.<br />
• The arrow mode or zoom symbol may be selected for the detailed<br />
read out of the 1/3 rd octave spectrum.<br />
• At selecting any other field the measurement will be continued.<br />
• Press the enter key again to continue the measurement.
Measurement Functions<br />
Zoom (Y-Axis): The scaling of the spectrum’s Y-axis (sensitivity) is<br />
fixed and may be adjusted manually.<br />
• Select the zoom (Y-axis) field and press the enter key.<br />
• Use the up/down keys to scroll the displayed level along the Yaxis<br />
and the left/right keys zoom out/in the Y-axis, e.g. alter the<br />
resolution of the division.<br />
Time Constant: The time constant corresponds to the integration time<br />
of the 1/3 rd octave recording. It may be set to five value: 0.2 / 0.5 /<br />
1.0 / 2.0 / 5.0 seconds. A lower time constant results in a quicker,<br />
more ‘nervous' display, whilst a higher time constant ‘averages’<br />
more samples, thus providing a more stable spectrum.<br />
Bargraph: Below the spectrum, the fullband input RMS level (20 Hz<br />
- 20 kHz) is indicated by a bargraph without auto ranging. Select the<br />
different indication ranges by moving the cursor to the left or right<br />
arrow below RNGE and press enter. The available ranges are:<br />
• -120 to -20 dBu, residual noise of <strong>ML1</strong> < -120dBu (
Measurement Functions<br />
To enter the 1/3 rd OCTAVE SPL mode (Fig 3.20), select 1/3 rd OCT. -><br />
SPL in the measurement functions submenu.<br />
Arrow readout: The arrow readout displays the frequency and<br />
the level of the 1/3 rd octave band that it points to. The arrow<br />
automatically points to the highest level in the 1/3 rd octave spectrum,<br />
or, alternatively may be controlled manually.<br />
Arrow Mode: The arrow readout may be moved manually to a certain<br />
specific 1/3 rd octave band.<br />
• Select the arrow mode field and press the enter key.<br />
• Move the arrow to any frequency by using the left/right keys.<br />
run/pause: The 1/3 rd octave spectrum may be freezed.<br />
• Select the run/pause field and press the enter key.<br />
• The1/3 rd octave spectrum is freezed.<br />
• The arrow mode or zoom symbol may be selected for the detailed<br />
read out of the 1/3 rd octave spectrum.<br />
• At selecting any other field the measurement will be continued.<br />
• Press the enter key again to continue the measurement.<br />
Zoom (Y-Axis): The scaling of the spectrum’s Y-axis (sensitivity) is<br />
fixed and may be adjusted manually.<br />
• Select the zoom (Y-axis) field and press the enter key.<br />
• Use the up/down keys to scroll the displayed level along the Yaxis<br />
and the left/right keys zoom out/in the Y-axis, e.g. alter the<br />
resolution of the division.<br />
Time Constant: The time constant corresponds to the integration time<br />
of the 1/3 rd octave recording. It may be set to five value: 0.2 / 0.5 /<br />
1.0 / 2.0 / 5.0 seconds. A lower time constant results in a quicker,<br />
more ‘nervous' display, whilst a higher time constant ‘averages’<br />
more samples, thus providing a more stable spectrum.<br />
Bargraph: Below the spectrum, the actual sound pressure level is<br />
indicated by a bargraph. Select the different indication ranges by<br />
moving the cursor to the left or right arrow below RNGE and press<br />
enter. The available bargraph ranges are:<br />
• 20 - 100 dB SPL<br />
• 40 - 120 dB SPL<br />
• 60 - 140 dB SPL<br />
39
scope<br />
To activate the SCOPE mode, select the entry SCOPE in the<br />
measurement functions menu.<br />
Y-Axis<br />
Scale<br />
Measurement Functions<br />
Measurement<br />
Function<br />
X-Axis Scale<br />
Fig 3.21 Scope Screen<br />
40<br />
Fundamental<br />
Frequency<br />
The SCOPE screen visualizes the waveform of the input signal. It<br />
automatically triggers to the fundamental frequency and selects the<br />
scaling of the X-axis (time) and Y-axis (level) accordingly.<br />
Furthermore, the input signals fundamental or most dominant<br />
frequency is displayed near the lower right corner of the scope<br />
screen.<br />
NOTE The scaling of the SCOPE display cannot be changed<br />
manually.
4. INDUCTION LOOP MODE (OPTIONAL)<br />
The induction loop mode is available upon installation of the MiniLINK<br />
PC interface. The <strong>Minilyzer</strong> simplifies verifications and adjustments of<br />
AFILS (Audio Frequency Induction Loop Systems). AFIL systems are<br />
used in public buildings to increase the speech intelligibility for users of<br />
hearing aids. Most hearing aids have a built in magnetic coil receiving<br />
audio signals generated by induction loop systems. AFIL systems<br />
consist of a wire loop and a current amplifier generating a magnetic<br />
field into the hearing aid, modulated by the audio input signal, e.g.<br />
voice. Adjustment and verification of AFIL systems is described in the<br />
IEC 60118 standard. The <strong>Minilyzer</strong>, together with an induction<br />
loop receiver, is an ideal tool to accomplish the necessary<br />
measurements.<br />
Induction Loop Receivers<br />
There are various induction loop receivers available from different<br />
AFILS components manufactures. All known types work together with<br />
the <strong>ML1</strong>. Some receivers have a built in A-weighting filter, which must<br />
be disabled to prevent measurement errors.<br />
Activation of the Induction Loop Mode<br />
Fig 4.1 Setup Induction Loop Mode<br />
Induction Loop Mode<br />
41<br />
• Enter the setup page of the<br />
<strong>ML1</strong><br />
• Change the position “Ind.<br />
loop mode” to “ENABLE”<br />
• Press ESC key to exit the<br />
setup page<br />
After this the <strong>ML1</strong> restarts in the induction loop measurement mode. To<br />
return to the common <strong>ML1</strong> measurement mode, disable the induction<br />
loop mode in the setup page again.
Induction loop Measurement Menu<br />
The <strong>Minilyzer</strong> restarts with an specific new AFILS measurement<br />
menu including<br />
• Level, fast weighted<br />
• Level, slow weighting<br />
• Level, PPM<br />
• THD+N<br />
• F-Sweep, frequency sweep<br />
• 1/3rd oct. spectrum analyzer<br />
• Scope<br />
• Calibrate<br />
Units mA/m, dBL<br />
42<br />
Fig 4.2 Induction Loop Menu<br />
The magnetic field strength is measured in A/m (Ampere per meter).<br />
AFIL systems use 400mA/m as a reference level. The logarithmic unit<br />
of the magnetic field strength is dBL (dB Loop) and has a reference<br />
level of 400mA/m.<br />
dBL 1 = 20 * log<br />
Measurement Functions<br />
Magn. field strength<br />
400mA/m<br />
1 The designator of the unit dBL is not standardized jet - but resulted<br />
of IEC 60118 committee members recommendations.
Calibration<br />
An induction loop receiver transforms a magnetic field strength to an<br />
electrical level. The receiver sensitivity is specified within the technical<br />
data. Before a valid measurement can be started the <strong>ML1</strong> sensitivity<br />
setting must be adjusted accordingly.<br />
filters<br />
Induction Loop Mode<br />
Fig 4.3 Calibration Panel<br />
The <strong>ML1</strong> has a built-in A-weighting and a HP400 (high pass 400Hz)<br />
filter, which may be activated using the filter menu. For detailed test<br />
requirements please refer to the IEC 60118 standard. The HP400 filter<br />
has an excellent rejection of mains frequencies, which sometimes is a<br />
dominant part of the signal received by the induction loop receiver.<br />
Fig 4.4 SInduction Loop Filters<br />
43
Level Fast, Level Slow<br />
Measurement Functions<br />
Level of the magnetic field strength measured in accordance to<br />
IEC60804 (sound pressure level time weighting) with different<br />
integration times:<br />
Fig 4.5 Level Fast: 125ms Fig 4.6 Level Slow 1s<br />
Level PPM<br />
Level of the magnetic field<br />
strength measured with a ppm<br />
like peak detector (type IIa).<br />
• Integration time: 10 ms<br />
• dBLp = dB Loop peak<br />
THd+N<br />
Total harmonic distortion +<br />
noise<br />
Please refer to the earlier pages<br />
for more details.<br />
44<br />
Fig 4.7 Level PPM Screen<br />
Fig 4.8 THD+N Screen
fsweep<br />
Frequency Sweep recording;<br />
Please refer to the earlier<br />
pages for more details.<br />
The frequency tracking will<br />
not work if mains frequency<br />
components dominate the<br />
input signal. Activating the<br />
HP400 filter will attenuate all<br />
main frequency components<br />
and a frequency recording is<br />
possible.<br />
1/3 rd Octave<br />
1 / 3 r d o c t a v e s p e c t r u m<br />
analyzer<br />
This function shows the<br />
spectrum of the input signal<br />
in 1/3 octave bands. The <strong>ML1</strong><br />
input ranging is not necessary<br />
in the induction loop mode and<br />
therefore not included. Please<br />
refer to the earlier pages for<br />
more details.<br />
scope<br />
Time domain of the input<br />
signal in A/m<br />
Please refer to the earlier<br />
pages for more details.<br />
Measurement Functions<br />
45<br />
Fig 4.9 F-Sweep Screen<br />
Fig 4.10 1/3rd oct. Screen<br />
Fig 4.11 Scope Screen
Troubleshooting<br />
5. TroublesHooTING<br />
System Break Down<br />
• Switch the device off.<br />
• Reset the <strong>ML1</strong> to the default status by pressing the ESC button<br />
and switching the <strong>Minilyzer</strong> on simultaneously.<br />
• Release the ESC button.<br />
• The below screenshot, Fig 26, shall appear on the display, stating<br />
on the bottom line LOADING DEFAULT SETUP.<br />
• Verify the correct operation.<br />
Fig 5.1 Start Up Screen Loading Default Setup<br />
In case you find system breakdowns happening several times or your<br />
device is malfunctioning please contact the local NTi Audio representative<br />
in your country. For contact-details please see the NTi Audio web<br />
page: "www.nti-audio.com".<br />
Low Level Measurements<br />
The <strong>Minilyzer</strong> does automatically<br />
recognize the actual input (XLR<br />
or RCA) in use. To measure low<br />
level audio signals (< 70 dBu)<br />
the balanced input shall be used<br />
only. Unbalanced signals need<br />
to be connected to the XLRinput<br />
via an XLR/RCA-adapter.<br />
46<br />
1<br />
2<br />
3<br />
Fig 5.2 XLR/RCA Adapter<br />
Hot
6. ACCessorIes<br />
Minispl<br />
The MiniSPL is the perfect accessory<br />
for acoustical measurements. Together<br />
with the <strong>Minilyzer</strong> <strong>ML1</strong> a comprehensive<br />
integrating sound level meter is<br />
formed.<br />
The MiniSPL is a self contained omni<br />
directional 1/2" measuring microphone<br />
with built in impedance converter,<br />
pre-amplifier and power supply. It is<br />
battery powered and the XLR-output is<br />
balanced. The MiniSPL is classified as<br />
type 2 in accordance with IEC 60651.<br />
MinilINK<br />
Accessories<br />
MiniLINK allows documentation and<br />
data acquisition of <strong>ML1</strong> functions in<br />
conjunction with the easy to use Mini-<br />
LINK PC software.<br />
MiniLINK is an upgradeable kit for all<br />
existing and new <strong>Minilyzer</strong>s. It consists<br />
of a small plug-in USB interface board<br />
that can be easily installed without any<br />
tools. MiniLINK supports<br />
• Storing measurement results and<br />
screenshots into the <strong>ML1</strong> flashmemory<br />
• Logging on-line measurement<br />
results onto the PC<br />
• Induction-Loop-Measurements<br />
AFILS acc. standard IEC 600118<br />
47<br />
Fig 6.1 MiniSPL<br />
Fig 6.2 MiniLINK
<strong>ML1</strong> Adapter -20dB<br />
Accessories<br />
The <strong>ML1</strong> Adapter -20dB may be applied<br />
for balanced input levels higher than<br />
+20 dBu. This passive adapter extends<br />
the balanced input range of your<br />
<strong>Minilyzer</strong> up to +40 dBu.<br />
Starting April 2004 this adapter is supplied<br />
with pin1-fuse for safe operation<br />
in combination with the USB interface<br />
MiniLINK.<br />
Pouch<br />
The soft pouch protects your Minstrument<br />
against shocks, dust and water.<br />
With its convenient belt-clip you can<br />
keep your Minstrument close to you<br />
even when you need both hands for<br />
other tasks.<br />
Minstruments system Case<br />
Store your valuable Minstruments<br />
in this compact system<br />
case. It holds the Minirator (MR1,<br />
MR-PRO, MR2), the <strong>Minilyzer</strong> <strong>ML1</strong>,<br />
Acoustilyzer AL1 or Digilyzer DL1<br />
and the MiniSPL with adequate<br />
extra space for your cables and<br />
connectors for those "out in the<br />
field“ jobs.<br />
48<br />
Fig 6.3 <strong>ML1</strong> Adapter -20 dB<br />
Fig 6.4 <strong>ML1</strong> Pouch<br />
Fig 6.5 System Case
Technical Specification<br />
7. TeCHNICAl speCIfICATIoN<br />
Technical Data General Functions<br />
Measurements - Level-RMS, Level-Relative, Frequency<br />
- THD+N<br />
- vu+PPM<br />
- Polarity Test<br />
- Signal Balance Error<br />
- Sweep, Frequency Sweep, Time Sweep<br />
- 1/3 rd Octave Spectrum<br />
- Scope, Frequency<br />
- AFILS measurements (with MiniLINK)<br />
frequency<br />
Range 10 Hz to 20 kHz<br />
Resolution 4 digits<br />
Accuracy < ± 0.1 %<br />
Level<br />
Units dBu, dBV, V RMS<br />
Resolution 3 digits (dB-scale) or 4 digits (V-scale)<br />
Accuracy ± 0.5 % @ 1 kHz<br />
Bandwidth 20 Hz to 20 kHz<br />
Flatness ± 0.1 dB<br />
THD+N (Total Harmonic Distortion + Noise)<br />
Meas. Bandwidth 10 Hz to 20 kHz<br />
Resolution 3 digits (dB-scale) or 4 digits (%-scale)<br />
Residual THD+N balanced < -85 dB @ -10 dBu to +20 dBu<br />
unbalanced < -74 dB @ 0 dBu to +14 dBu<br />
vu+PPM (vu-Indicator and Peak Program Meter)<br />
according to IEC 60268 and DIN 45406.<br />
PPM Type I, IIa and Nordic.<br />
Both meters with adjustable reference and<br />
with analog & numerical peak-hold readout.<br />
Polarity Test (with Minirator test signal)<br />
Positive / Negative detection through internal<br />
microphone or XLR/RCA connector. Checks<br />
polarity of tweeters, midrange-speakers,<br />
woofers, sub-woofers and cables. Down to<br />
10 dB S/N ratio of input signal.<br />
49
Technical Specification<br />
signal balance error Indication range 0.0 % to 100 %<br />
Deviation from perfect balance in % or *1<br />
sweep Frequency Sweep: Level as function of<br />
frequency.<br />
Time Sweep: Measurement of level, THD+N<br />
and frequency as function of time.<br />
1/3 rd Octave Spectrum acc. IEC 1260, class II and ANSI<br />
S1.11-1976, class II from 50 Hz to 20 kHz,<br />
Bargraph for Level RMS 20 Hz to 20 kHz<br />
scope Auto triggering, auto ranging, auto scaling<br />
filters Linear, A-weighting, C-weigting, C-message,<br />
Highpass 22 Hz / 60 Hz / 400 Hz, X-Curve -1 ,<br />
Voice bandpass<br />
Input Connectors XLR balanced, RCA unbalanced<br />
Input Impedance 40 kOhm balanced, 20 kOhm unbalanced<br />
Input rMs 1 ( upper meas. limit )<br />
balanced +20 dBu (7.75 V RMS )<br />
unbalanced +14 dBu (3.8 V RMS )<br />
Max. DC Input ± 50 V DC<br />
residual Noise < 12 μV, XLR-input shorted<br />
Microphone Input (for Polarity measurement only)<br />
Omnidirectional<br />
Monitor output Jack 3.5 mm (1/8“), suitable for all common<br />
headsets<br />
display Graphic LCD 64 x 100 pixel, with backlight<br />
batteries 3x AA package dry batteries (alkaline)<br />
Typical battery lifetime > 16 hrs<br />
Dimensions (L x W x H)<br />
163 x 86 x 42 mm (6.4“ x 3.38“ x 1.63“)<br />
Weight 300 g (10.5 oz) incl. batteries<br />
Temperature 0° to +45° C (32° to 113° F)<br />
Humidity < 90 % R.H., non condensing<br />
1 for input levels > 20 dBu (balanced) the <strong>ML1</strong> Adapter -20 dB is<br />
available<br />
50
Technical Specification<br />
Technical Data Acoustic Functions<br />
Measurements - Sound Pressure Level<br />
- 1/3 rd Octave Spectrum<br />
Acoustical functions<br />
in accordance with IEC61672, Class 2<br />
• Instantaneous Sound Pressure Level (Lp)<br />
• Maximum/Minimum Sound Pressure Level (Lmax/Lmin)<br />
• Time Response selectable<br />
• Weighting Filters<br />
• Equivalent Continuous Sound Pressure Level (Leq)<br />
• Pause- and Continue Function<br />
Sound Pressure Level<br />
Units<br />
Resolution<br />
dB , dB , dB , dB SPL Leq LAeq LCeq<br />
3 digits<br />
Display Ranges<br />
Bandwidth<br />
20 - 140 dB in 3 bands 20 - 100 dB SPL SPL<br />
40 - 120 dBSPL 60 - 140 dBSPL 20 Hz to 20 kHz<br />
Flatness According to class 1<br />
Time response Selectable fast, slow, impuls<br />
Weighting Filters Selectable A, C, linear,<br />
X-Curve -1 (for 1/3 rd octave spectrum only)<br />
Integration Pause- and Continue Function<br />
1/3 rd Octave Spectrum<br />
31 octave band display 20 Hz to 20 kHz<br />
Sensitivity Selectable default value (MiniSPL),<br />
calibration to external source,<br />
editable sensitivity value<br />
51
Test & Calibration Certificate<br />
This is to certify the <strong>Minilyzer</strong> <strong>ML1</strong> is fully tested to the manufacturer’s<br />
specifications.<br />
NTi Audio recommends to calibrate this test instrument one (1) year<br />
after purchase. Thereafter the calibration- and adjustment interval is<br />
subsequently one (1) year.<br />
52
Menu bar<br />
Measurement<br />
display<br />
escape<br />
enter/Cursor<br />
Control Keys<br />
Measurement Function Menu:<br />
LEVEL<br />
THD+N<br />
VU+PPM<br />
POLARITY<br />
BALANCE<br />
SWEEP<br />
1/3 rd OCTAVE<br />
SCOPE<br />
On<br />
RMS<br />
REL<br />
SPL<br />
Quick Guide<br />
<strong>Minilyzer</strong> Ml1<br />
TYPE I<br />
TYPE IIA<br />
NORDIC<br />
FREQUENCY<br />
TIME<br />
RMS<br />
SPL<br />
/ Off (2 sec)<br />
2000 TD 01.10