Cost-effectiveness of MRI for breast cancer ... - BioMed Central
Cost-effectiveness of MRI for breast cancer ... - BioMed Central
Cost-effectiveness of MRI for breast cancer ... - BioMed Central

Create successful ePaper yourself
Turn your PDF publications into a flip-book with our unique Google optimized e-Paper software.
Pataky et al. BMC Cancer 2013, 13:339<br />
http://www.biomedcentral.com/1471-2407/13/339<br />
RESEARCH ARTICLE<br />
<strong>Cost</strong>-<strong>effectiveness</strong> <strong>of</strong> <strong>MRI</strong> <strong>for</strong> <strong>breast</strong> <strong>cancer</strong><br />
screening in BRCA1/2 mutation carriers<br />
Reka Pataky 1,2 , Linlea Armstrong 3,4,5 , Stephen Chia 6,7 , Andrew J Coldman 8 , Charmaine Kim-Sing 9,10 ,<br />
Barbara McGillivray 3,4,5 , Jenna Scott 4 , Christine M Wilson 11,12,13 and Stuart Peacock 1,2,14*<br />
Open Access<br />
Abstract<br />
Background: Women with mutations in BRCA1 or BRCA2 are at high risk <strong>of</strong> developing <strong>breast</strong> <strong>cancer</strong> and, in British<br />
Columbia, Canada, are <strong>of</strong>fered screening with both magnetic resonance imaging (<strong>MRI</strong>) and mammography to<br />
facilitate early detection. <strong>MRI</strong> is more sensitive than mammography but is more costly and produces more false<br />
positive results. The purpose <strong>of</strong> this study was to calculate the cost-<strong>effectiveness</strong> <strong>of</strong> <strong>MRI</strong> screening <strong>for</strong> <strong>breast</strong> <strong>cancer</strong><br />
in BRCA1/2 mutation carriers in a Canadian setting.<br />
Methods: We constructed a Markov model <strong>of</strong> annual <strong>MRI</strong> and mammography screening <strong>for</strong> BRCA1/2 carriers, using<br />
local data and published values. We calculated cost-<strong>effectiveness</strong> as cost per quality-adjusted life-year gained<br />
(QALY), and conducted one-way and probabilistic sensitivity analysis.<br />
Results: The incremental cost-<strong>effectiveness</strong> ratio (ICER) <strong>of</strong> annual mammography plus <strong>MRI</strong> screening, compared to<br />
annual mammography alone, was $50,900/QALY. After incorporating parameter uncertainty, <strong>MRI</strong> screening is<br />
expected to be a cost-effective option 86% <strong>of</strong> the time at a willingness-to-pay <strong>of</strong> $100,000/QALY, and 53% <strong>of</strong> the<br />
time at a willingness-to-pay <strong>of</strong> $50,000/QALY. The model is highly sensitive to the cost <strong>of</strong> <strong>MRI</strong>; as the cost is<br />
increased from $200 to $700 per scan, the ICER ranges from $37,100/QALY to $133,000/QALY.<br />
Conclusions: The cost-<strong>effectiveness</strong> <strong>of</strong> using <strong>MRI</strong> and mammography in combination to screen <strong>for</strong> <strong>breast</strong> <strong>cancer</strong> in<br />
BRCA1/2 mutation carriers is finely balanced. The sensitivity <strong>of</strong> the results to the cost <strong>of</strong> the <strong>MRI</strong> screen itself<br />
warrants consideration: in jurisdictions with higher <strong>MRI</strong> costs, screening may not be a cost-effective use <strong>of</strong><br />
resources, but improving the efficiency <strong>of</strong> <strong>MRI</strong> screening will also improve cost-<strong>effectiveness</strong>.<br />
Keywords: Breast <strong>cancer</strong>, BRCA, <strong>MRI</strong>, <strong>Cost</strong>-<strong>effectiveness</strong>, Screening<br />
Background<br />
Carriers <strong>of</strong> BRCA1 or BRCA2 (BRCA1/2) mutations are at<br />
particularly high risk <strong>of</strong> <strong>breast</strong> <strong>cancer</strong>, with a 45-65% cumulative<br />
risk by age 70 years [1,2]. In current practice at<br />
the British Columbia Cancer Agency (BCCA), women with<br />
a strong family history <strong>of</strong> <strong>breast</strong> and ovarian <strong>cancer</strong> who<br />
meet specific eligibility criteria [3] may be referred to the<br />
Hereditary Cancer Program to receive genetic counseling<br />
and testing <strong>for</strong> BRCA1/2 mutations. Women with a<br />
BRCA1/2 mutation may significantly reduce their risk <strong>of</strong><br />
<strong>breast</strong> <strong>cancer</strong> by opting to undergo prophylactic bilateral<br />
* Correspondence: speacock@bccrc.ca<br />
1 Cancer Control Research, BC Cancer Agency, 675 W. 10th Ave, Vancouver,<br />
BC V5Z 1L3, Canada<br />
2 Canadian Centre <strong>for</strong> Applied Research in Cancer Control, 675 W. 10th Ave,<br />
Vancouver, BC V5Z 1L3, Canada<br />
Full list <strong>of</strong> author in<strong>for</strong>mation is available at the end <strong>of</strong> the article<br />
mastectomy and/or bilateral oophorectomy [4-7], but<br />
many factors are involved in choosing risk-reducing surgery<br />
[8] and many women instead opt <strong>for</strong> early detection<br />
strategies, including regular screening with <strong>MRI</strong> and<br />
mammography [9]. Since 2003, the BCCA has operated a<br />
high-risk screening clinic, <strong>of</strong>fering annual <strong>breast</strong> <strong>cancer</strong><br />
screening with <strong>MRI</strong> and mammography to confirmed<br />
BRCA1/2 mutation carriers.<br />
<strong>MRI</strong> is more sensitive than mammography <strong>for</strong> <strong>breast</strong><br />
<strong>cancer</strong> screening in BRCA1/2 mutation carriers, with<br />
screening trials indicating that between 89-100% <strong>of</strong> <strong>breast</strong><br />
<strong>cancer</strong>s were detected with the combination <strong>of</strong> mammography<br />
and <strong>MRI</strong>, versus 33-50% with mammography alone<br />
[10-18]. However, the specificity <strong>of</strong> <strong>MRI</strong> is lower than<br />
© 2013 Pataky et al.; licensee <strong>BioMed</strong> <strong>Central</strong> Ltd. This is an Open Access article distributed under the terms <strong>of</strong> the Creative<br />
Commons Attribution License (http://creativecommons.org/licenses/by/2.0), which permits unrestricted use, distribution, and<br />
reproduction in any medium, provided the original work is properly cited.
Pataky et al. BMC Cancer 2013, 13:339 Page 2 <strong>of</strong> 9<br />
http://www.biomedcentral.com/1471-2407/13/339<br />
mammography (73-80% <strong>for</strong> mammography and <strong>MRI</strong> vs.<br />
91-99% <strong>for</strong> mammography alone [10-18]), giving rise to<br />
more false positive screens, which may increase costs<br />
and negatively impact quality <strong>of</strong> life <strong>for</strong> screening participants<br />
[19]. Breast <strong>MRI</strong> is more expensive than mammography,<br />
but there is little evidence available on the<br />
cost-<strong>effectiveness</strong> <strong>of</strong> <strong>MRI</strong> <strong>for</strong> <strong>breast</strong> <strong>cancer</strong> screening in<br />
Canada. Estimates from the United States <strong>of</strong> incremental<br />
cost per quality adjusted life year (QALY) <strong>for</strong> the addition<br />
<strong>of</strong> <strong>MRI</strong> to annual mammography screening range widely,<br />
from $55,420/QALY [20] and $69,125/QALY [21] <strong>for</strong><br />
BRCA1 carriers, $130,695/QALY BRCA2 carriers [20], and<br />
$179,599/QALY <strong>for</strong> women with >15% lifetime risk [22]<br />
(all values USD). <strong>Cost</strong>-<strong>effectiveness</strong> ratios are particularly<br />
sensitive to the unit cost <strong>of</strong> an <strong>MRI</strong> screening test [21-23]<br />
and to the <strong>breast</strong> <strong>cancer</strong> risk in the population being<br />
screened [20,24]. In order to better understand the context<br />
<strong>of</strong> <strong>MRI</strong> screening at the BCCA, the investigators determined<br />
a local cost-<strong>effectiveness</strong> analysis was warranted.<br />
The objective <strong>of</strong> this study is to estimate the cost<strong>effectiveness</strong><br />
<strong>of</strong> annual mammography plus <strong>MRI</strong> screening<br />
<strong>for</strong> <strong>breast</strong> <strong>cancer</strong> in BRCA1/2 mutation carriers, as compared<br />
to screening with mammography alone, from the<br />
perspective <strong>of</strong> the British Columbia healthcare system,<br />
using local cost and outcomes data.<br />
Methods<br />
Model design<br />
An advisory panel <strong>of</strong> clinicians, program managers and researchers<br />
was established to support this study. The investigators<br />
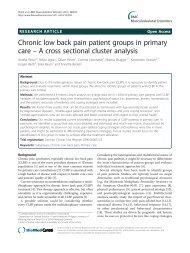
constructed a Markov model to determine the<br />
cost per QALY gained with current <strong>MRI</strong> and mammography<br />
screening practices, comparing annual mammography<br />
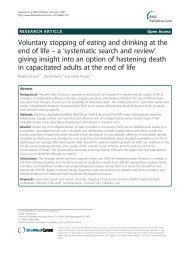
alone to annual mammography and <strong>MRI</strong> (Figure 1),<br />
from the perspective <strong>of</strong> the healthcare system. The model<br />
simulates a cohort <strong>of</strong> women beginning at age 25 years,<br />
with a 6-month cycle length, representing the current time<br />
between screens, and a lifetime time horizon. The model<br />
represents screening, diagnostics and treatment <strong>for</strong> a<br />
woman’s first <strong>breast</strong> <strong>cancer</strong>; screening <strong>for</strong> second primary<br />
<strong>cancer</strong>s is not considered.<br />
In the mammography plus <strong>MRI</strong> screening strategy,<br />
women alternate between <strong>MRI</strong> and mammography screening<br />
every six months (Figure 1). In current practice at the<br />
BCCA high-risk screening clinic, <strong>MRI</strong> is <strong>of</strong>fered from ages<br />
25–64 years, and mammography screening is <strong>of</strong>fered from<br />
ages 30–79 years; thus in the mammography plus <strong>MRI</strong><br />
strategy, women aged 25–29 years receive only <strong>MRI</strong><br />
screening, and women 65–79 years receive only mammography.<br />
In the mammography alone strategy, women are<br />
screened with mammography annually from age 30–79<br />
false positives<br />
Mammography<br />
<strong>MRI</strong> screen<br />
false negatives<br />
Diagnostic<br />
work up<br />
(undetected)<br />
Diagnostic<br />
work up<br />
true positives<br />
In Situ Local Regional<br />
Distant<br />
Well<br />
Progressive<br />
disease<br />
Dead<br />
Figure 1 Markov model <strong>for</strong> annual <strong>breast</strong> <strong>cancer</strong> screening with <strong>MRI</strong> and Mammography. Women begin in the Markov stages “<strong>MRI</strong> screen”<br />
or “Mammography” and alternate every 6 months (in the mammography alone arm, the “<strong>MRI</strong> screen” state is replaced with a 6-month interval with no<br />
screen). Women with positive screening results move through the right side <strong>of</strong> the model; those with no <strong>cancer</strong> (false positives) return to screening,<br />
while <strong>cancer</strong> cases continue to treatment, by stage at diagnosis. Women with <strong>cancer</strong> whose screening results are negative (false negatives) are<br />
screened once more; if their <strong>cancer</strong> remains undetected they are classified as having non-screen-detected <strong>cancer</strong>s, and proceed through treatment.
Pataky et al. BMC Cancer 2013, 13:339 Page 3 <strong>of</strong> 9<br />
http://www.biomedcentral.com/1471-2407/13/339<br />
years. Women with <strong>cancer</strong> detected by screening (true positives)<br />
proceed through diagnostic work-up to treatment;<br />
women with false positive screen results also undergo a<br />
diagnostic work-up but return to screening. Any women<br />
with incident <strong>cancer</strong> that is not detected by screening remain<br />
in the screening health states <strong>for</strong> a further 6 months;<br />
if their <strong>cancer</strong> remains undetected (that is, if in the <strong>MRI</strong><br />
arm their subsequent screen is also negative, or if in the<br />
mammography alone strategy they do not receive a screen<br />
within those 6 months), they are classified as having clinically<br />
manifesting non-screen-detected <strong>cancer</strong>.<br />
Cancer treatments and outcomes by stage at diagnosis<br />
are the same across both strategies <strong>of</strong> the model. In the<br />
model, patients undergo treatment <strong>for</strong> the first 18<br />
months following diagnosis, or until they die or transition<br />
to progressive disease, whichever is shorter. Patients<br />
who die <strong>of</strong> <strong>cancer</strong> within 18 months (3 cycles) <strong>of</strong> diagnosis<br />
transition to the ‘dead’ health state without moving<br />
through the ‘progressive disease’ state, while those who<br />
die in subsequent cycles are assumed to have experienced<br />
progressive disease <strong>for</strong> the last 18 months (3 cycles)<br />
prior to death [25]. In the model, patients with in<br />
situ disease do not progress to invasive disease, and all<br />
patients who survive at least 10 years after diagnosis are<br />
no longer at risk <strong>of</strong> progression.<br />
Transition probabilities<br />
Age-specific <strong>breast</strong> <strong>cancer</strong> incidence in the BRCA1 and<br />
BRCA2 populations [2] was weighted to represent mutation<br />
frequency at the BCCA (59% BRCA1 and 41% BRCA2;<br />
Table 1). Sensitivity and specificity values <strong>for</strong> the mammography<br />
plus <strong>MRI</strong> arm were taken from a meta-analysis <strong>of</strong><br />
<strong>MRI</strong> screening <strong>effectiveness</strong> studies [16]. The sensitivity <strong>of</strong><br />
<strong>MRI</strong> or mammography given a prior false negative screen<br />
with the opposite modality was calculated using the<br />
reported sensitivity values <strong>for</strong> each screening modality<br />
alone and the sensitivity <strong>of</strong> detection by either <strong>MRI</strong> or<br />
mammography when both are <strong>of</strong>fered together. Using these<br />
values, we were able to solve <strong>for</strong> the joint probability <strong>of</strong> detection<br />
by both <strong>MRI</strong> and mammography, and derive estimates<br />
<strong>for</strong> the conditional probability <strong>of</strong> detection by <strong>MRI</strong><br />
given a false negative from mammography, and vice versa.<br />
For the mammography alone strategy, age-specific sensitivity<br />
and specificity values were used [26] to account <strong>for</strong> the early<br />
onset <strong>of</strong> <strong>breast</strong> <strong>cancer</strong> among BRCA1/2 carriers and the decreased<br />
sensitivity <strong>of</strong> mammography in younger women. The<br />
stage distributions <strong>of</strong> <strong>MRI</strong>-detected and mammogramdetected<br />
<strong>cancer</strong>s in the BRCA1/2 population were synthesized<br />
using Dirichlet distributions <strong>for</strong> stage at diagnosis<br />
[11-13,27]. For clinically manifesting, non-screen-detected<br />
<strong>cancer</strong>s, the historical stage distribution prior to screening<br />
was used [28]. In the model, stage distribution <strong>for</strong> screendetected<br />
<strong>cancer</strong>s was based only on method <strong>of</strong> detection,<br />
and was independent <strong>of</strong> prior screening.<br />
Local survival rates <strong>for</strong> the general <strong>breast</strong> <strong>cancer</strong> population<br />
were calculated using data from the BC Cancer Registry<br />
(including linked deaths data from the BC Vital<br />
Statistics Agency), and were fitted to a series <strong>of</strong> Weibull<br />
distributions [29] by the Surveillance and Outcomes Unit<br />
<strong>of</strong> the BCCA to generate the transition probabilities <strong>for</strong><br />
the <strong>cancer</strong> outcomes in the model. The advisory panel validated<br />
this decision; the literature suggests that survival<br />
among BRCA1/2 carriers with <strong>breast</strong> <strong>cancer</strong> is no worse<br />
than <strong>for</strong> mutation-free controls [30]. Transition through<br />
the progressive disease state be<strong>for</strong>e death, described above,<br />
was implemented by introducing an 18-month lead time<br />
to the calculated survival curves. Published estimates <strong>of</strong><br />
competing mortality in the BRCA1/2 population were also<br />
incorporated into the model [31].<br />
<strong>Cost</strong>s<br />
All costs included in the model are summarized in Table 2.<br />
The cost <strong>of</strong> mammography screening was estimated from<br />
the BC Medical Services Commission Fee Schedule <strong>for</strong><br />
2008 [32]. <strong>MRI</strong> screening cost was calculated as the mean<br />
<strong>of</strong> three cost estimates provided by the BCCA and two<br />
regional health authorities. The cost included radiologist,<br />
technologist and clerical staff costs, materials, support<br />
costs, and overhead. The cost <strong>of</strong> a diagnostic work-up<br />
was calculated as the weighted mean cost <strong>of</strong> consultations,<br />
diagnostic mammography, ultrasound, fine needle aspiration,<br />
core biopsy, and open biopsy delivered following abnormal<br />
screen results, using observed frequencies reported<br />
from the provincial screening program [33] and local unit<br />
cost estimates [32,34].<br />
We calculated treatment costs in the model using records<br />
from the BC Cancer Agency database (CAIS) <strong>for</strong> all<br />
<strong>breast</strong> <strong>cancer</strong> patients who underwent mutation testing at<br />
the Hereditary Cancer Program between 2002 and 2007<br />
and were found to be BRCA1 or BRCA2 mutation carriers<br />
(n = 68). Surgery, radiotherapy and systemic therapy in<br />
the first 18 months following diagnosis were included<br />
in the cost calculation [32,35-37] and fitted to gamma distributions<br />
[29]. <strong>Cost</strong>s were calculated separately <strong>for</strong> three<br />
6-month intervals (from months 1–6, 7–12, and 13–18 following<br />
diagnosis) to correspond with model cycle length<br />
and ensure appropriate allocation <strong>of</strong> costs over time. Using<br />
the subset <strong>of</strong> patients who died <strong>of</strong> <strong>breast</strong> <strong>cancer</strong> be<strong>for</strong>e<br />
January 2009 (n = 10) we calculated the cost <strong>of</strong> radiotherapy<br />
and systemic therapy received in the last 18 months <strong>of</strong><br />
life (as three 6-month intervals), and estimated costs <strong>of</strong><br />
additional hospitalization, using published length <strong>of</strong> stay<br />
and per-diem costs [36,37].<br />
Utilities<br />
Standard gamble utility weights obtained from the literature<br />
<strong>for</strong> <strong>breast</strong> <strong>cancer</strong> treatment by stage at diagnosis<br />
were applied <strong>for</strong> up to 18 months while patients were in
Pataky et al. BMC Cancer 2013, 13:339 Page 4 <strong>of</strong> 9<br />
http://www.biomedcentral.com/1471-2407/13/339<br />
the <strong>cancer</strong> treatment states (Table 3) [38]. After 18<br />
months a remission utility was applied to all <strong>cancer</strong> stages,<br />
until transition to progressive disease or return to full<br />
health after 10 years. The screening and interval health<br />
states were assumed to have a utility value <strong>of</strong> 1.0. The utility<br />
<strong>for</strong> a diagnostic workup was derived from a published<br />
value <strong>for</strong> diagnostic mammography, and lasted <strong>for</strong> two<br />
weeks <strong>of</strong> the 6 month cycle [39]. Utilities <strong>for</strong> remission<br />
and diagnostic mammography, which had been measured<br />
using a visual analog scale, were scaled up to approximate<br />
standard gamble values [39,40].<br />
Analysis<br />
The model was analyzed using TreeAge Pro 2012, 1.3.0.<br />
The model design was clinically validated by members <strong>of</strong><br />
the advisory panel, and model estimates <strong>of</strong> incidence<br />
and mortality were verified against published values. We<br />
conducted a cost-<strong>effectiveness</strong> analysis to calculate the incremental<br />
cost <strong>effectiveness</strong> ratio (ICER) <strong>of</strong> screening with<br />
<strong>MRI</strong>, expressed as 2008 CAD$ per quality-adjusted life<br />
year (QALY). <strong>Cost</strong>s and utilities were discounted at 3.5%<br />
per year [41]. Probabilistic sensitivity analysis was<br />
conducted using Monte Carlo simulation techniques with<br />
Table 1 Model inputs <strong>for</strong> transition probabilities <strong>for</strong> <strong>cancer</strong> incidence, screen <strong>effectiveness</strong>, staging and survival<br />
Incidence<br />
10-year risk <strong>of</strong> <strong>breast</strong> <strong>cancer</strong>, by age [2] % 95% CI<br />
20-30 1.5 1.1-1.9<br />
30-40 8.6 6.9-11<br />
40-50 18 14-23<br />
50-60 20 17-25<br />
60-70 18 15-22<br />
Screen <strong>effectiveness</strong> Sensitivity Specificity<br />
% 95% CI % 95% CI<br />
<strong>MRI</strong> and Mammography [16] 94 90-97 77 75-80<br />
<strong>MRI</strong> 77 70-84 86 81-92<br />
<strong>MRI</strong> given false negative mammogram 90 87-93*<br />
Mammography 39 37-41 95 93-97<br />
Mammography given false negative <strong>MRI</strong> 74 68-80*<br />
Mammography alone, by age [26]<br />
30-40 63 42-85 89.4 88.6-90.2<br />
40-50 70 61-80 86.7 86.3-87.2<br />
50-60 81 73-89 87.3 86.8-87.9<br />
60-70 84 77-91 89.0 88.4-89.5<br />
Stage distribution <strong>MRI</strong>-detected [11-13,27]† Mammography detected [11-13,27]† Non-screen detected [28]<br />
% 95% CI % 95% CI % 95% CI<br />
In Situ 16 10-22 27 17-38 5 3-6<br />
Local 68 62-72 49 38-58 48 46-50<br />
Regional 16 10-22 22 12-31 40 37-42<br />
Distant 1 0-4 2 0-11 8 6-9<br />
Survival‡ 5-yr 10-yr<br />
(%) 95% CI (%) 95% CI<br />
In Situ 100 - 100 -<br />
Local 96.8 96.4-97.1 90.6 89.2-91.7<br />
Regional 88.8 84.7-91.6 71.2 63.1-76.9<br />
Distant 26.1 21.9-29.9 10.2 7.2-13.2<br />
* 95% CIs <strong>for</strong> conditional probabilities were estimated by sampling from beta distributions <strong>for</strong> sensitivity <strong>of</strong> <strong>MRI</strong> and mammography combined and sensitivity <strong>for</strong><br />
each modality alone, and solving <strong>for</strong> the conditional probability.<br />
† Calculated using <strong>cancer</strong>s pooled from studies <strong>of</strong> <strong>MRI</strong> and mammography screening added to a uni<strong>for</strong>m Dirichlet distribution.<br />
‡ estimated from Weibull distribution parameters provided by BCCA Surveillance and Outcomes Unit <strong>for</strong> the general <strong>breast</strong> <strong>cancer</strong> population.
Pataky et al. BMC Cancer 2013, 13:339 Page 5 <strong>of</strong> 9<br />
http://www.biomedcentral.com/1471-2407/13/339<br />
Table 2 <strong>Cost</strong>s <strong>of</strong> screening, diagnostics and treatment<br />
Screening and diagnostics <strong>Cost</strong> ($) 95% CI<br />
<strong>MRI</strong> screen 277 196-376<br />
Bilateral mammogram 95 55-146<br />
Diagnostic work-up 187 106-292<br />
Total treatment cost <strong>Cost</strong> ($) 95% CI*<br />
In Situ 3,427 1,713-5,140<br />
Local 10,940 1,997-27,335<br />
Regional 23,612 5,075-56,124<br />
Distant 15,645 4,171-34,561<br />
Progression (end <strong>of</strong> life) 26,704 11,851-47,489<br />
Abbreviations: CI Confidence interval.<br />
* Patient-level total costs were fitted to gamma distributions to generate 95% CI.<br />
10,000 draws from the input distributions. Decision uncertainty<br />
was represented by plotting all results on the cost<strong>effectiveness</strong><br />
plane and by using the cost <strong>effectiveness</strong><br />
acceptability curve, which illustrates the probability that<br />
<strong>MRI</strong> screening is cost-effective <strong>for</strong> a given range <strong>of</strong> willingness<br />
to pay values [29]. <strong>Cost</strong>-<strong>effectiveness</strong> was evaluated at<br />
example willingness to pay values <strong>of</strong> $50,000 and $100,000<br />
per QALY. One-way sensitivity analysis was also conducted<br />
<strong>for</strong> the cost <strong>of</strong> <strong>MRI</strong>, sensitivity and specificity <strong>of</strong> <strong>MRI</strong>, stage<br />
<strong>of</strong> <strong>MRI</strong>-detected <strong>cancer</strong>s, and discount rate to evaluate<br />
their impact on the ICER.<br />
Ethical approval <strong>for</strong> this study was provided by the University<br />
<strong>of</strong> British Columbia-BC Cancer Agency Research<br />
Ethics Board.<br />
Table 3 Health state utility weights<br />
Screening and diagnostics<br />
95% CI<br />
<strong>MRI</strong> screening* 1.000 -<br />
Mammography 1.000 -<br />
Diagnostic workup 0.987 0.761-1.00<br />
Treatment†<br />
In situ 0.965 0.463-1.00<br />
Localized 0.860 0.330-1.00<br />
Regional 0.675 0.315-0.929<br />
Distant 0.380 0.211-0.564<br />
Progression (end <strong>of</strong> life) 0.380 0.211-0.564<br />
Remission 0.965 0.463-1.00<br />
Dead 0.000 -<br />
Well 1.000 -<br />
Abbreviations: CI Confidence interval.<br />
* Full utility (1.00) assumed <strong>for</strong> screening states and ‘Well’ state; not varied in<br />
probabilistic sensitivity analysis.<br />
† Treatment utilities by stage at diagnosis applied <strong>for</strong> 18 months, after which<br />
‘Remission’ value applied until progression and death or transition to ‘Well,’ 10-yrs<br />
post-diagnosis; utilities <strong>for</strong> localized, regional, distant disease, and disease<br />
progression states were derived from Schleinitz et al. [38], and utility <strong>for</strong><br />
diagnostic work-up, remission and in situ disease were from Bonomi et al. [39].<br />
Results<br />
After modeling a BRCA1/2 cohort from age 25 years, the<br />
cumulative risk <strong>of</strong> developing <strong>breast</strong> <strong>cancer</strong> by age 65<br />
years was 42.7% (95% CI: 38.8, 46.7) (Table 4). This was<br />
slightly lower but generally comparable to cumulative incidence<br />
estimated from Antoniou et al. [1] and Chen and<br />
Parmigiani [2] (50.4% and 45.4% respectively), and considered<br />
a valid approximation. Mortality was slightly reduced<br />
with the addition <strong>of</strong> <strong>MRI</strong>, with 80.1% (95% CI: 78.9, 81.1)<br />
vs. 79.1% (95% CI: 77.4, 80.4) <strong>of</strong> women surviving to age<br />
65. Mortality approximated values from Byrd et al. [42];<br />
using data from that study, an estimated 22% <strong>of</strong> female<br />
BRCA1/2 mutation carries died be<strong>for</strong>e age 65 years from<br />
<strong>breast</strong> <strong>cancer</strong> or other causes, excluding ovarian <strong>cancer</strong>.<br />
With the addition <strong>of</strong> <strong>MRI</strong> to annual mammography<br />
screening, 93.9% (95% CI: 89.4, 97.3) <strong>of</strong> <strong>cancer</strong>s that developed<br />
by age 65 years were screen-detected, compared<br />
to 71.7% (95% CI: 65.9, 77.2) with mammography alone.<br />
Cancers in the <strong>MRI</strong> plus mammography arm were less<br />
likely to be either regional or distant, and more likely to be<br />
localized than in the mammography alone arm.<br />
<strong>Cost</strong>-<strong>effectiveness</strong> analysis gave an incremental cost <strong>of</strong><br />
<strong>MRI</strong> screening <strong>of</strong> $4692 (95% CI: 3084, 7910) per participant,<br />
with 0.092 QALYs gained (95% CI: -0.027, 0.190),<br />
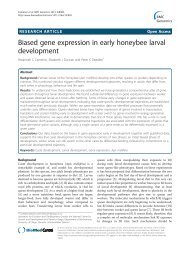
resulting in a mean ICER <strong>of</strong> $50,911/QALY (Table 4). The<br />
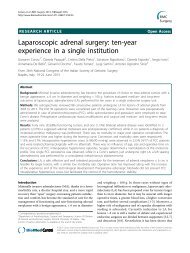
scatter plot <strong>of</strong> incremental cost and <strong>effectiveness</strong> values<br />
<strong>for</strong> each simulation is shown in Figure 2; in 3.9% <strong>of</strong> simulations,<br />
the <strong>MRI</strong> screening strategy was less effective than<br />
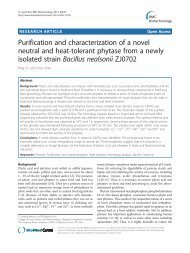
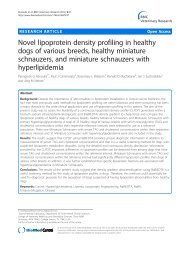
mammography alone. The cost-<strong>effectiveness</strong> acceptability<br />
curve (Figure 3) indicates that if a decision maker were<br />
willing to pay $100,000 per QALY gained, <strong>MRI</strong> screening<br />
is a cost-effective option 85.6% <strong>of</strong> the time. At a willingness<br />
to pay <strong>of</strong> $50,000/QALY, it is cost-effective 52.6% <strong>of</strong><br />
the time.<br />
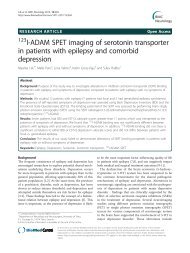
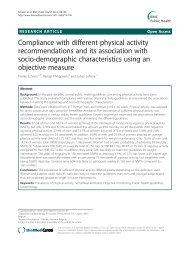
One-way sensitivity analysis indicated that the model<br />
was somewhat sensitive to changes in the <strong>effectiveness</strong> <strong>of</strong><br />
<strong>MRI</strong> screening – measured as <strong>MRI</strong> sensitivity, <strong>MRI</strong> specificity<br />
and stage distribution <strong>of</strong> <strong>MRI</strong>-detected <strong>cancer</strong>s – but<br />
very sensitive to the cost <strong>of</strong> an <strong>MRI</strong> scan (Figure 4). As cost<br />
was varied from $200-$700, the ICER ranged widely, from<br />
$37,119 to $132,944 per QALY.<br />
Discussion<br />
In our model, annual mammography plus <strong>MRI</strong>, compared<br />
to annual mammography alone, has an ICER <strong>of</strong> $50,900<br />
per QALY. This ICER was estimated using local cost and<br />
treatment data, with input from clinicians and decisionmakers<br />
on the project’s advisory panel, in an ef<strong>for</strong>t to most<br />
accurately depict the context <strong>of</strong> <strong>breast</strong> <strong>cancer</strong> screening<br />
and treatment <strong>for</strong> BRCA1/2 mutation carriers in British<br />
Columbia. These results suggest that the cost-<strong>effectiveness</strong><br />
<strong>of</strong> the <strong>MRI</strong> screening program <strong>for</strong> BRCA1/2 mutation carriers<br />
is finely balanced, with sensitivity to input parameters
Pataky et al. BMC Cancer 2013, 13:339 Page 6 <strong>of</strong> 9<br />
http://www.biomedcentral.com/1471-2407/13/339<br />
Table 4 <strong>Cost</strong>-<strong>effectiveness</strong> and <strong>effectiveness</strong> <strong>of</strong> <strong>MRI</strong> screening vs. annual mammography alone<br />
<strong>Cost</strong>-<strong>effectiveness</strong>* Mammography only <strong>MRI</strong> & mammography Increment<br />
Mean 95% CI Mean 95% CI Mean 95% CI<br />
<strong>Cost</strong> ($) 5,201 3,303-7,911 9,893 7,459-12,942 4,692 3,084-6,504<br />
QALYs 22.57 21.86-22.75 22.66 21.85-22.83 0.092 −0.027-0.190<br />
C/E ($/QALY) 231 146-351 437 329-572 50,911 Dominated-213,794<br />
Screening <strong>effectiveness</strong>† Mammography only <strong>MRI</strong> & mammography<br />
Mean (%) 95% CI Mean (%) 95% CI<br />
Incidence 42.7 38.8-46.7 42.7 38.7-46.7<br />
Program sensitivity‡ 71.7 65.9-77.2 93.9 89.4-97.3<br />
Stage distribution<br />
In Situ 20.8 12.8-30.1 18.2 12.8-24.2<br />
Local 48.7 39.1-58.3 61 53.8-67.8<br />
Regional 26.9 19.6-35.5 19.1 13.9-25.1<br />
Distant 3.6 2-7.2 1.7 0.6-3.8<br />
Survival 79.1 77.4-80.4 80.1 78.9-81.1<br />
Abbreviations: <strong>MRI</strong> magnetic resonance imaging, QALY quality-adjusted life year.<br />
* <strong>Cost</strong>s and utilities discounted at 3.5% per year.<br />
† Calculated at end <strong>of</strong> <strong>MRI</strong> plus mammography screening program (age 65 years).<br />
‡ Proportion <strong>of</strong> <strong>cancer</strong>s in model detected by screening; all screen-detected <strong>cancer</strong>s (true positives) divided by all incident <strong>cancer</strong>s.<br />
and statistical uncertainty. The BCCA does not use a cost<strong>effectiveness</strong><br />
threshold, but the ICER falls within the generally<br />
accepted range <strong>for</strong> funded programs.<br />
The mammography plus <strong>MRI</strong> strategy <strong>of</strong> the model differs<br />
from the mammography alone strategy in four key<br />
ways: the cost <strong>of</strong> <strong>MRI</strong> screening, increased screening sensitivity,<br />
a more favourable stage distribution among <strong>MRI</strong>detected<br />
<strong>cancer</strong>s, and more false positive screens due to<br />
decreased screening specificity. The cost-<strong>effectiveness</strong> <strong>of</strong><br />
<strong>MRI</strong> screening is highly dependent on the cost <strong>of</strong> an <strong>MRI</strong><br />
scan, as indicated in one-way sensitivity analysis. In situations<br />
where <strong>MRI</strong> scans are costlier than at the BCCA, <strong>MRI</strong><br />
screening <strong>for</strong> <strong>breast</strong> <strong>cancer</strong> may not be a cost-effective option.<br />
However, these results also suggest that improvements<br />
10000<br />
9000<br />
8000<br />
7000<br />
Incremental <strong>Cost</strong> ($)<br />
6000<br />
5000<br />
4000<br />
3000<br />
2000<br />
1000<br />
0<br />
-1 -0.8 -0.6 -0.4 -0.2 0 0.2 0.4 0.6 0.8 1<br />
Incremental <strong>effectiveness</strong> (QALY)<br />
Figure 2 Scatter plot <strong>of</strong> incremental cost and <strong>effectiveness</strong> <strong>for</strong> 10,000 simulations. Ellipse indicates 95% confidence limit. Abbreviations:<br />
<strong>MRI</strong>, magnetic resonance imaging; QALY, quality-adjusted life-year.
Pataky et al. BMC Cancer 2013, 13:339 Page 7 <strong>of</strong> 9<br />
http://www.biomedcentral.com/1471-2407/13/339<br />
1<br />
0.9<br />
Probability <strong>Cost</strong>-effective<br />
0.8<br />
0.7<br />
0.6<br />
0.5<br />
0.4<br />
0.3<br />
0.2<br />
0.1<br />
0<br />
$0 $30,000 $60,000 $90,000 $120,000<br />
<strong>MRI</strong> & Mammography<br />
Mammography alone<br />
Willingness to Pay ($/QALY)<br />
Figure 3 <strong>Cost</strong> <strong>effectiveness</strong> acceptability curve. Abbreviations: <strong>MRI</strong>, magnetic resonance imaging; QALY, quality-adjusted life-year.<br />
in technical efficiency leading to reductions in the per-scan<br />
cost <strong>of</strong> <strong>MRI</strong> may reduce the cost-<strong>effectiveness</strong> <strong>of</strong> <strong>MRI</strong><br />
screening to more acceptable levels.<br />
The time horizon <strong>of</strong> this model, as with any model <strong>of</strong><br />
preventive or screening techniques, also has an impact on<br />
the findings. The costs <strong>of</strong> <strong>MRI</strong> screening accrue from the<br />
beginning <strong>of</strong> model, while the benefits arising from <strong>MRI</strong><br />
screening, such as lower treatment costs <strong>for</strong> <strong>cancer</strong>s<br />
detected at an earlier stage, appear much later in the model,<br />
particularly as the cohort ages and <strong>cancer</strong> incidence rises.<br />
Consequently, the model is very sensitive to discounting assumptions<br />
<strong>for</strong> cost and QALYs.<br />
The ICER calculated in this study is higher than previously<br />
published cost-<strong>effectiveness</strong> estimates from the UK,<br />
but lower than those from the US [20-22,24]. In the UK<br />
study by Norman et al., women were screened <strong>for</strong> only 10<br />
years, beginning at age 30 or 40 years, giving ICERS <strong>of</strong> approximately<br />
CAD$17,600 and $30,600 per QALY [24]. By<br />
contrast, our model includes <strong>MRI</strong> screening from age 25<br />
to 65 years. In the US studies, the cost <strong>of</strong> <strong>MRI</strong> was much<br />
higher than in this study, around USD$1000 <strong>for</strong> a bilateral<br />
screen, which is a potential reason why the reported<br />
ICERs are also higher. Moore et al. found in their sensitivity<br />
analysis that reducing the cost <strong>of</strong> <strong>MRI</strong> to below USD<br />
$315 resulted in an ICER <strong>of</strong> under USD$50,000/QALY,<br />
down from the base-case ICER <strong>of</strong> nearly USD$180,000/<br />
QALY, which is more consistent with the findings <strong>of</strong> this<br />
study [22]. Both Moore’s model and this study highlight<br />
the fact that <strong>MRI</strong> screening <strong>for</strong> <strong>breast</strong> <strong>cancer</strong> may be cost<br />
effective, when the cost <strong>of</strong> <strong>MRI</strong> scans is low.<br />
A limitation <strong>of</strong> this model is that it represents an idealized<br />
screening program, with all women entering at age 25<br />
Variable name Variable range<br />
ICER range<br />
<strong>MRI</strong> sensitivity 0.85-0.70 43,631-62,904<br />
<strong>MRI</strong> specificity 0.95-0.80 45,236-57,676<br />
In Situ 0.20-0.10 39,049-80,124<br />
Localized 0.75-0.60 45,780-67,019<br />
Regional 0.10-0.20 33,190-93,278<br />
Distant 0.005-0.02 47,491-64,625<br />
<strong>Cost</strong> <strong>of</strong> <strong>MRI</strong> ($) 200-700 37,119-132,944<br />
Discount Rate 0-0.06 25,996-85,502<br />
$20,000 $50,000 $80,000 $110,000 $140,000<br />
ICER ($/QALY)<br />
Figure 4 One-way sensitivity analysis and tornado diagram <strong>of</strong> incremental cost-<strong>effectiveness</strong> <strong>of</strong> <strong>MRI</strong> screening. Abbreviations: <strong>MRI</strong>,<br />
magnetic resonance imaging; ICER, incremental cost-<strong>effectiveness</strong> ratio; QALY, quality-adjusted life year.
Pataky et al. BMC Cancer 2013, 13:339 Page 8 <strong>of</strong> 9<br />
http://www.biomedcentral.com/1471-2407/13/339<br />
and participating until age 65 or until they develop <strong>cancer</strong>.<br />
The <strong>MRI</strong> screening program operated by the BCCA has a<br />
dynamic population. Women join the program at various<br />
ages when they are deemed to be eligible, and leave after<br />
undergoing prophylactic surgery, after developing <strong>cancer</strong>,<br />
or <strong>for</strong> other reasons. The timing <strong>of</strong> screening also varies:<br />
women who must travel to Vancouver <strong>for</strong> screening <strong>of</strong>ten<br />
have both <strong>MRI</strong> and mammography done concurrently, and<br />
the interval between <strong>MRI</strong> screens may exceed 12 months.<br />
Consequently, the cost-<strong>effectiveness</strong> <strong>of</strong> the screening program,<br />
if it were to be measured using real-world, comparative<br />
<strong>effectiveness</strong> program data, may be different. Although<br />
our goal was to use as much local data as possible, the<br />
challenge <strong>of</strong> acquiring comparative <strong>effectiveness</strong> data to in<strong>for</strong>m<br />
the model was a further limitation <strong>of</strong> this study. We<br />
had insufficient sample size and follow-up to fully evaluate<br />
the <strong>effectiveness</strong> <strong>of</strong> the BCCA’s <strong>MRI</strong> screening program.<br />
We instead relied on the literature <strong>for</strong> screening <strong>effectiveness</strong><br />
data. A further limitation <strong>of</strong> the model is that we were<br />
unable to include the risk <strong>of</strong> overdiagnosis from additional<br />
screening with <strong>MRI</strong>. Estimates <strong>of</strong> overdiagnosis attributable<br />
to mammography screening vary widely, from under 10%<br />
to as high as 50% [43-46]; however, overdiagnosis from<br />
<strong>MRI</strong> screening has not been assessed, nor has the rate <strong>of</strong><br />
overdiagnosis in the BRCA1/2 population.<br />
The model that we constructed to assess the cost<strong>effectiveness</strong><br />
<strong>of</strong> <strong>MRI</strong> screening lays the foundation to potentially<br />
address other questions related to <strong>breast</strong> <strong>cancer</strong><br />
screening. For example, as more data become available the<br />
model could be adapted to find the optimal start time and<br />
duration <strong>of</strong> <strong>MRI</strong> screening from a cost-<strong>effectiveness</strong> perspective,<br />
or to investigate the relationship between lifetime<br />
<strong>breast</strong> <strong>cancer</strong> risk and cost-<strong>effectiveness</strong> <strong>of</strong> <strong>MRI</strong> screening,<br />
exploring the feasibility <strong>of</strong> expanding <strong>MRI</strong> screening to<br />
other high-risk groups.<br />
Conclusions<br />
Annual mammography plus <strong>MRI</strong> screening <strong>of</strong> BRCA1/2<br />
mutation carriers at the BCCA was found to be potentially<br />
cost-effective, with an ICER <strong>of</strong> $50,900/QALY when compared<br />
to annual mammography alone, although the cost<strong>effectiveness</strong><br />
is finely balanced. The benefits <strong>of</strong> early<br />
detection <strong>of</strong> <strong>breast</strong> <strong>cancer</strong> with <strong>MRI</strong> in this population<br />
may outweigh the added cost <strong>of</strong> screening and the higher<br />
risk <strong>of</strong> false positives; however, the cost-<strong>effectiveness</strong> <strong>of</strong><br />
<strong>MRI</strong> screening is highly dependent on the cost <strong>of</strong> <strong>MRI</strong><br />
scans and there remains some statistical uncertainty<br />
around the results.<br />
Abbreviations<br />
BC: British Columbia; BCCA: BC Cancer agency; CI: Confidence interval;<br />
ICER: Incremental cost-<strong>effectiveness</strong> ratio; <strong>MRI</strong>: Magnetic resonance imaging;<br />
QALY: Quality-adjusted life-year.<br />
Competing interests<br />
The authors declare that they have no competing interests.<br />
Authors’ contributions<br />
All authors contributed significantly to the model design and validation,<br />
interpretation <strong>of</strong> results, and to critical review <strong>of</strong> this manuscript. RP was<br />
responsible <strong>for</strong> model construction, data analysis and composing the<br />
manuscript. JS, CW, CKS, and AC provided data. All authors read and<br />
approved the final manuscript.<br />
Acknowledgements<br />
Funding <strong>for</strong> this study was provided by Canadian Institutes <strong>of</strong> Health<br />
Research, grant no. PHE-81956.<br />
Author details<br />
1 Cancer Control Research, BC Cancer Agency, 675 W. 10th Ave, Vancouver,<br />
BC V5Z 1L3, Canada. 2 Canadian Centre <strong>for</strong> Applied Research in Cancer<br />
Control, 675 W. 10th Ave, Vancouver, BC V5Z 1L3, Canada. 3 Provincial<br />
Medical Genetics Program, BC Women’s Hospital and Health Centre, 4500<br />
Oak Street, Vancouver, BC V6H 3N1, Canada. 4 Hereditary Cancer Program, BC<br />
Cancer Agency, 600 W. 10th Ave, Vancouver, BC V5Z 4E6, Canada.<br />
5 Department <strong>of</strong> Medical Genetics, Faculty <strong>of</strong> Medicine, University <strong>of</strong> British<br />
Columbia, 2350 Health Science Mall, Vancouver, BC V6T 1Z3, Canada.<br />
6 Medical Oncology, BC Cancer Agency, 600 W. 10th Ave, Vancouver, BC V5Z<br />
4E6, Canada. 7 Department <strong>of</strong> Medicine, Faculty <strong>of</strong> Medicine, University <strong>of</strong><br />
British Columbia, 2775 Laurel St, Vancouver, BC V5Z 1M9, Canada.<br />
8 Population Oncology, BC Cancer Agency, 686 W. Broadway, Vancouver, BC<br />
V5Z 1G1, Canada. 9 Radiation Oncology, BC Cancer Agency, 600 W. 10th Ave,<br />
Vancouver, BC V5Z 4E6, Canada. 10 Department <strong>of</strong> Surgery, Faculty <strong>of</strong><br />
Medicine, University <strong>of</strong> British Columbia, 910 W. 10th Ave, Vancouver, BC V5Z<br />
4E3, Canada. 11 Screening Mammography Program <strong>of</strong> British Columbia, 686<br />
W. Broadway, Vancouver, BC V5Z 1G1, Canada. 12 Diagnostic Imaging, BC<br />
Cancer Agency, 600 W. 10th Ave, Vancouver, BC V5Z 4E6, Canada.<br />
13 Department <strong>of</strong> Radiology, Faculty <strong>of</strong> Medicine, University <strong>of</strong> British<br />
Columbia, 950 W. 10th Ave, Vancouver, BC V5Z 4E3, Canada. 14 School <strong>of</strong><br />
Population and Public Health, University <strong>of</strong> British Columbia, 2206 East Mall,<br />
Vancouver, BC V6T 1Z3, Canada.<br />
Received: 16 November 2012 Accepted: 5 July 2013<br />
Published: 10 July 2013<br />
References<br />
1. Antoniou A, Pharoah PDP, Narod S, Risch HA, Eyfjord JE, Hopper JL, Loman<br />
N, Olsson H, Johannsson O, Borg A, et al: Average risks <strong>of</strong> <strong>breast</strong> and<br />
ovarian <strong>cancer</strong> associated with BRCA1 or BRCA2 mutations detected in<br />
case series unselected <strong>for</strong> family history: A combined analysis <strong>of</strong> 22<br />
studies. Am J Hum Genet 2003, 72:1117–1130.<br />
2. Chen SN, Parmigiani G: Meta-analysis <strong>of</strong> BRCA1 and BRCA2 penetrance.<br />
J Clin Oncol 2007, 25:1329–1333.<br />
3. BC Cancer Agency: Hereditary Cancer Program Referrals. http://www.<br />
screeningbc.ca/Hereditary/ForHealthPr<strong>of</strong>essionals/ReferralProcess.htm.<br />
4. Eisen A, Lubinski J, Klijn J, Moller P, Lynch HT, Offit K, Weber B, Rebbeck T,<br />
Neuhausen SL, Ghadirian P, et al: Breast <strong>cancer</strong> risk following bilateral<br />
oophorectorny in BRCA1 and BRCA2 mutation carriers: An international<br />
case–control study. J Clin Oncol 2005, 23:7491–7496.<br />
5. Kurian AW, Sigal BM, Plevritis SK: Survival Analysis <strong>of</strong> Cancer Risk Reduction<br />
Strategies <strong>for</strong> BRCA1/2 Mutation Carriers. JClinOncol2009, 28:222–231.<br />
6. Meijers-Heijboer H, van Geel B, van Putten WLJ, Henzen-Logmans SC,<br />
Seynaeve C, Menke-Pluymers MBE, Bartels CCM, Verhoog LC, van den<br />
Ouweland AMW, Niermeijer MF, et al: Breast <strong>cancer</strong> after prophylactic<br />
bilateral mastectomy in women with a BRCA1 or BRCA2 mutation. N Eng<br />
J Med 2001, 345:159–164.<br />
7. Rebbeck TR, Friebel T, Lynch HT, Neuhausen SL, van't Veer L, Garber JE,<br />
Evans GR, Narod SA, Isaacs C, Matl<strong>of</strong>f E, et al: Bilateral prophylactic<br />
mastectomy reduces <strong>breast</strong> <strong>cancer</strong> risk in BRCA1 and BRCA2 mutation<br />
carriers: The PROSE study group. J Clin Oncol 2004, 22:1055–1062.<br />
8. Howard AF, Balneaves LG, Bottorff JL, Rodney P: Preserving the Self: The<br />
Process <strong>of</strong> Decision Making About Hereditary Breast Cancer and Ovarian<br />
Cancer Risk Reduction. Qual Health Res 2011, 21:502–519.<br />
9. Saslow D: American <strong>cancer</strong> society guidelines <strong>for</strong> <strong>breast</strong> screening with<br />
<strong>MRI</strong> as an adjunct to mammography. CA Cancer J Clin 2007, 57:75–89.<br />
10. Kriege M, Brekelmans CTM, Boetes C, Besnard PE, Zonderland HM, Obdeijn<br />
IM, Manoliu RA, Kok T, Peterse H, Tilanus-Linthorst MMA, et al: Efficacy <strong>of</strong>
Pataky et al. BMC Cancer 2013, 13:339 Page 9 <strong>of</strong> 9<br />
http://www.biomedcentral.com/1471-2407/13/339<br />
<strong>MRI</strong> and mammography <strong>for</strong> <strong>breast</strong>-<strong>cancer</strong> screening in women with a<br />
familial or genetic predisposition. N Eng J Med 2004, 351:427–437.<br />
11. Warner E, Plewes DB, Hill KA, Causer PA, Zubovits JT, Jong RA, Cutrara MR,<br />
DeBoer G, Yaffe MJ, Messner SJ, et al: Surveillance <strong>of</strong> BRCA1 and BRCA2<br />
Mutation Carriers With Magnetic Resonance Imaging, Ultrasound,<br />
Mammography, and Clinical Breast Examination. JAMA 2004, 292:1317–1325.<br />
12. Kuhl CK, Schrading S, Leutner CC, Morakkabati-Spitz N, Wardelmann E,<br />
FimmersR,KuhnW,SchildHH:Mammography, Breast Ultrasound, and<br />
Magnetic Resonance Imaging <strong>for</strong> Surveillance <strong>of</strong> Women at High<br />
Familial Risk <strong>for</strong> Breast Cancer. J Clin Oncol 2005, 23:8469–8476.<br />
13. Leach MO, Boggis CRM, Dixon AK, Easton DF, Eeles RA, Evans DGR, Gilbert<br />
FF, Griebsch I, H<strong>of</strong>f RJC, Kessar P, et al: Screening with magnetic resonance<br />
imaging and mammography <strong>of</strong> a UK population at high familial risk <strong>of</strong><br />
<strong>breast</strong> <strong>cancer</strong>: a prospective multicentre cohort study (MARIBS).<br />
Lancet 2005, 365:1769–1778.<br />
14. Kriege M, Brekelmans CT, Boetes C, Muller SH, Zonderland HM, Obdeijn IM,<br />
Manoliu RA, Kok T, Rutgers EJ, de Koning HJ, Klijn JG: Differences between<br />
first and subsequent rounds <strong>of</strong> the <strong>MRI</strong>SC <strong>breast</strong> <strong>cancer</strong> screening program<br />
<strong>for</strong> women with a familial or genetic predisposition. Cancer 2006,<br />
106:2318–2326.<br />
15. Lord SJ, Lei W, Craft P, Cawson JN, Morris I, Walleser S, Griffiths A, Parker S,<br />
Houssami N: A systematic review <strong>of</strong> the <strong>effectiveness</strong> <strong>of</strong> magnetic<br />
resonance imaging (<strong>MRI</strong>) as an addition to mammography and<br />
ultrasound in screening young women at high risk <strong>of</strong> <strong>breast</strong> <strong>cancer</strong>.<br />
Eur J Cancer 2007, 43:1905–1917.<br />
16. Warner E, Messersmith H, Causer P, Eisen A, Shumak R, Plewes D:<br />
Systematic review: Using magnetic resonance imaging to screen women<br />
at high risk <strong>for</strong> <strong>breast</strong> <strong>cancer</strong>. Ann Intern Med 2008, 148:671–679.<br />
17. Sardanelli F, Podo F, Santoro F, Manoukian S, Bergonzi S, Trecate G,<br />
Vergnaghi D, Federico M, Cortesi L, Corcione S, et al: Multicenter<br />
surveillance <strong>of</strong> women at high genetic <strong>breast</strong> <strong>cancer</strong> risk using<br />
mammography, ultrasonography, and contrast-enhanced magnetic<br />
resonance imaging (the high <strong>breast</strong> <strong>cancer</strong> risk italian 1 study): final<br />
results. Invest Radiol 2011, 46:94–105.<br />
18. Le-Petross HT, Whitman GJ, Atchley DP, Yuan Y, Gutierrez-Barrera A, Hortobagyi<br />
GN, Litton JK, Arun BK: Effectiveness <strong>of</strong> alternating mammography and<br />
magnetic resonance imaging <strong>for</strong> screening women with deleterious BRCA<br />
mutations at high risk <strong>of</strong> <strong>breast</strong> <strong>cancer</strong>. Cancer 2011, 117:3900–3907.<br />
19. Gilbert FJ, Cordiner CM, Affleck IR, Hood DB, Mathieson D, Walker LG: Breast<br />
screening: the psychological sequelae <strong>of</strong> false-positive recall in women with<br />
and without a family history <strong>of</strong> <strong>breast</strong> <strong>cancer</strong>. Eur J Cancer 1998, 34:2010–2014.<br />
20. Plevritis SK, Kurian AW, Sigal BM, Daniel BL, Ikeda DM, Stockdale FE, Garber AM:<br />
<strong>Cost</strong>-<strong>effectiveness</strong> <strong>of</strong> screening BRCA1/2 mutation carriers with <strong>breast</strong><br />
magnetic resonance imaging. JAMA-J Am Med Assoc 2006, 295:2374–2384.<br />
21. Lee JM, McMahon PM, Kong CY, Kopans DB, Ryan PD, Ozanne EM, Halpern<br />
EF, Gazelle GS: <strong>Cost</strong>-<strong>effectiveness</strong> <strong>of</strong> Breast MR Imaging and Screen-Film<br />
Mammography <strong>for</strong> Screening BRCA1 Gene Mutation Carriers.<br />
Radiology 2010, 254:793–800.<br />
22. Moore S, Shenoy P, Fanucchi L, Tumeh J, Flowers C: <strong>Cost</strong>-<strong>effectiveness</strong> <strong>of</strong><br />
<strong>MRI</strong> compared to mammography <strong>for</strong> <strong>breast</strong> <strong>cancer</strong> screening in a high<br />
risk population. BMC Health Serv Res 2009, 9:9.<br />
23. Griebsch I, Brown J, Boggis C, Dixon A, Dixon M, Easton D, Eeles R, Evans<br />
DG, Gilbert FJ, Hawnaur J, et al: <strong>Cost</strong>-<strong>effectiveness</strong> <strong>of</strong> screening with<br />
contrast enhanced magnetic resonance imaging vs X-ray<br />
mammography <strong>of</strong> women at a high familial risk <strong>of</strong> <strong>breast</strong> <strong>cancer</strong>. Br J<br />
Cancer 2006, 95:801–810.<br />
24. Norman RPA, Evans DG, Easton DF, Young KC: The cost-utility <strong>of</strong> magnetic<br />
resonance imaging <strong>for</strong> <strong>breast</strong> <strong>cancer</strong> in BRCA1 mutation carriers aged<br />
30–49. Eur J Health Econ 2007, 8:137–144.<br />
25. Chia SK, Speers CH, D'Yachkova Y, Kang A, Malfair-Taylor S, Barnett J,<br />
Coldman A, Gelmon KA, O'Reilly SE, Olivotto IA: The impact <strong>of</strong> new<br />
chemotherapeutic and agents on survival in a population-based <strong>of</strong><br />
women with metastatic <strong>breast</strong> <strong>cancer</strong> hormone cohort. Cancer 2007,<br />
110:973–979.<br />
26. Kerlikowske K, Carney PA, Geller B, Mandelson MT, Taplin SH, Malvin K,<br />
Ernster V, Urban N, Cutter G, Rosenberg R, Ballard-Barbash R:<br />
Per<strong>for</strong>mance <strong>of</strong> screening mammography among women with and<br />
without a first-degree relative with <strong>breast</strong> <strong>cancer</strong>. Ann Intern Med<br />
2000, 133:855–863.<br />
27. Hagen AI, Kvistad KA, Maehle L, Holmen MM, Aase H, Styr B, Vabo A, Apold<br />
J, Skaane P, Moller P: Sensitivity <strong>of</strong> <strong>MRI</strong> versus conventional screening in<br />
the diagnosis <strong>of</strong> BRCA-associated <strong>breast</strong> <strong>cancer</strong> in a national prospective<br />
series. Breast 2007, 16:367–374.<br />
28. Lee JM, Kopans DB, McMahon PM, Halpern EF, Ryan PD, Weinstein MC,<br />
Gazelle GS: Breast <strong>cancer</strong> screening in BRCA1 mutation carriers:<br />
Effectiveness <strong>of</strong> MR imaging - Markov Monte Carlo decision analysis.<br />
Radiology 2008, 246:763–771.<br />
29. Briggs A, Schulpher M, Claxton K: Decision modelling <strong>for</strong> health economic<br />
evaluation. Ox<strong>for</strong>d: Ox<strong>for</strong>d University Press; 2006.<br />
30. Liebens FP, Carly B, Pastijn A, Rozenberg S: Management <strong>of</strong> BRCA1/2<br />
associated <strong>breast</strong> <strong>cancer</strong>: A systematic qualitative review <strong>of</strong> the state <strong>of</strong><br />
knowledge in 2006. Eur J Cancer 2007, 43:238–257.<br />
31. Mai PL, Chatterjee N, Hartge P, Tucker M, Brody L, Struewing JP,<br />
Wacholder S: Potential Excess Mortality in BRCA1/2 Mutation Carriers<br />
beyond Breast, Ovarian, Prostate, and Pancreatic Cancers, and<br />
Melanoma. PLoS One 2009, 4:e4812.<br />
32. BC Medical Services Commission Payment Schedule. 2008. http://www.health.<br />
gov.bc.ca/msp/infoprac/physbilling/payschedule/index.html.<br />
33. Screening Mammography Program: 2007/2008 Annual Report. In Book<br />
2007/2008 Annual Report. City: BC Cancer Agency; 2008.<br />
34. <strong>Cost</strong>ing Analysis (CAT) Tool. http://www.occp.com/mainPage.htm.<br />
35. Health Employers Association <strong>of</strong> BC Collective Agreements. http://www.heabc.<br />
bc.ca/Page20.aspx.<br />
36. Najafzadeh M, Marra CA, Sadatsafavi M, Aaron SD, Sullivan SD, Vandemheen<br />
KL, Jones PW, Fitzgerald JM: <strong>Cost</strong> <strong>effectiveness</strong> <strong>of</strong> therapy with<br />
combinations <strong>of</strong> long acting bronchodilators and inhaled steroids <strong>for</strong><br />
treatment <strong>of</strong> COPD. Thorax 2008, 63:962–967.<br />
37. Neutel C, Gao R, Gaudette L, Johansen H: Shorter hospital stays <strong>for</strong> <strong>breast</strong><br />
<strong>cancer</strong>. Health Rep 2004, 16:19–31.<br />
38. Schleinitz MD, DePalo D, Blume J, Stein M: Can differences in <strong>breast</strong><br />
<strong>cancer</strong> utilities explain disparities in <strong>breast</strong> <strong>cancer</strong> care? J Gen Intern Med<br />
2006, 21:1253–1260.<br />
39. Bonomi AE, Boudreau DM, Fishman PA, Ludman E, Mohelnitzky A, Cannon<br />
EA, Seger D: Quality <strong>of</strong> life valuations <strong>of</strong> mammography screening.<br />
Qual Life Res 2008, 17:801–814.<br />
40. Earle CC, Chapman RH, Baker CS, Bell CM, Stone PW, Sandberg EA,<br />
Neumann PJ: Systematic overview <strong>of</strong> cost-utility assessments in<br />
oncology. J Clin Oncol 2000, 18:3302–3317.<br />
41. Longson C, Longworth L, Turner K, Dillon A, Barnett D, Culyer T, Littlejohns P,<br />
Stevens A: Book Guide to the methods <strong>of</strong> technology appraisal, Issued: June 2008.<br />
City: National Institute <strong>for</strong> Health and Clinical Excellence; 2008.<br />
42. Byrd LM, Shenton A, Maher ER, Woodward E, Belk R, Lim C, Lalloo F,<br />
Howell A, Jayson GC, Evans GD: Better Life Expectancy in Women with<br />
BRCA2 Compared with BRCA1 Mutations Is Attributable to Lower<br />
Frequency and Later Onset <strong>of</strong> Ovarian Cancer. Cancer Epi Bio Prev<br />
2008, 17:1535–1542.<br />
43. Jørgensen KJ, Gøtzsche PC: Overdiagnosis in publicly organised<br />
mammography screening programmes: systematic review <strong>of</strong> incidence<br />
trends. BMJ 2009, 339:b2587.<br />
44. Kalager M, Adami HO, Bretthauer M, Tamimi RM: Overdiagnosis <strong>of</strong> Invasive<br />
Breast Cancer Due to Mammography Screening: Results From the Norwegian<br />
Screening Program. AnnInternMed2012, 156:491–499.<br />
45. Independent UK Panel on Breast Cancer Screening: The benefits and<br />
harms <strong>of</strong> <strong>breast</strong> <strong>cancer</strong> screening: an independent review. Lancet 2012,<br />
380:1778–1786.<br />
46. Moss S: Overdiagnosis and overtreatment <strong>of</strong> <strong>breast</strong> <strong>cancer</strong>:<br />
Overdiagnosis in randomised controlled trials <strong>of</strong> <strong>breast</strong> <strong>cancer</strong><br />
screening. Breast Cancer Res 2005, 7:230–234.<br />
doi:10.1186/1471-2407-13-339<br />
Cite this article as: Pataky et al.: <strong>Cost</strong>-<strong>effectiveness</strong> <strong>of</strong> <strong>MRI</strong> <strong>for</strong> <strong>breast</strong><br />
<strong>cancer</strong> screening in BRCA1/2 mutation carriers. BMC Cancer 2013 13:339.