Films minces à base de Si nanostructuré pour des cellules ...
Films minces à base de Si nanostructuré pour des cellules ... Films minces à base de Si nanostructuré pour des cellules ...
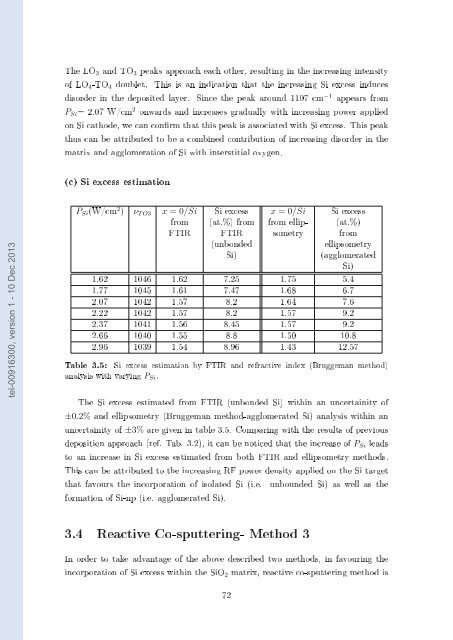
The LO 3 and TO 3 peaks approach each other, resulting in the increasing intensity of LO 4 -TO 4 doublet. This is an indication that the increasing Si excess induces disorder in the deposited layer. Since the peak around 1107 cm −1 appears from P Si = 2.07 W/cm 2 onwards and increases gradually with increasing power applied on Si cathode, we can conrm that this peak is associated with Si excess. This peak thus can be attributed to be a combined contribution of increasing disorder in the matrix and agglomeration of Si with interstitial oxygen. (c) Si excess estimation tel-00916300, version 1 - 10 Dec 2013 P Si (W/cm 2 ) ν T O3 x = 0/Si from FTIR Si excess (at.%) from FTIR (unbonded Si) x = 0/Si from ellipsometry Si excess (at.%) from ellipsometry (agglomerated Si) 1.62 1046 1.62 7.25 1.75 5.4 1.77 1045 1.61 7.47 1.68 6.7 2.07 1042 1.57 8.2 1.64 7.6 2.22 1042 1.57 8.2 1.57 9.2 2.37 1041 1.56 8.45 1.57 9.2 2.66 1040 1.55 8.8 1.50 10.8 2.96 1039 1.54 8.96 1.43 12.57 Table 3.5: Si excess estimation by FTIR and refractive index (Bruggeman method) analysis with varying P Si . The Si excess estimated from FTIR (unbonded Si) within an uncertainity of ±0.2% and ellipsometry (Bruggeman method-agglomerated Si) analysis within an uncertainity of ±3% are given in table 3.5. Comparing with the results of previous deposition approach (ref. Tab. 3.2), it can be noticed that the increase of P Si leads to an increase in Si excess estimated from both FTIR and ellipsometry methods. This can be attributed to the increasing RF power density applied on the Si target that favours the incorporation of isolated Si (i.e. unbounded Si) as well as the formation of Si-np (i.e. agglomerated Si). 3.4 Reactive Co-sputtering- Method 3 In order to take advantage of the above described two methods, in favouring the incorporation of Si excess within the SiO 2 matrix, reactive co-sputtering method is 72
initiated in this thesis, for the growth of SRSO layers. From the parameters analyzed above, T d was chosen as 500°C, and r H as 26% for this set of studies. 3.4.1 Eect of power density applied on Si cathode, (P Si ) The eect of varying the P Si during the reactive co-sputtering is investigated. The same range of power densities and time of deposition as used in method 2 were employed. (a) Deposition rates (r d ) and Refractive index (n 1.95eV ) tel-00916300, version 1 - 10 Dec 2013 The inuence of P Si on r d and n 1.95eV is shown in gure 3.9 with the values of sample thicknesses at each P Si , in the inset. The time of deposition was xed to be 3600s. There is an increase of r d with P Si , similar to the trend observed in method 2. The deposition rate obtained by method 3 is higher than that obtained by method 1 (at T d = 500°C) and lower than that obtained by method 2. The comparison between thicknesses obtained from method 2 and 3 shows this decrease in r d more evidently. For the same deposition conditions, the addition of hydrogen in the plasma decreases the thickness by about 70%. The variation of refractive index shown in the right axis of the gure 3.9 shows a steady increase with P Si . Besides it can be noticed that the refractive index values have increased signicantly as compared to the other two methods. This can be attributed to the combination of deposition methods 1 and 2 that allows in achieving higher Si incorporation in the lm. Figure 3.9: Eect of P Si on deposition rate (left axis), refractive index (right axis), and thickness (Inset). (b) Fourier transform infrared spectroscopy Figure 3.10 shows the eect of P Si as seen from Brewster and normal incidence FTIR spectra. In all the spectra, TO 3 peak is normalized to unity for comparison. It can be seen from the Brewster incidence spectra (Fig. 3.10a), that the LO 3 peak intensity is very low as compared to the other two methods of SRSO growth, 73
- Page 39 and 40: tel-00916300, version 1 - 10 Dec 20
- Page 41 and 42: Figure 1.12: materials. Energy diag
- Page 43 and 44: tel-00916300, version 1 - 10 Dec 20
- Page 45 and 46: Background of this thesis: A new me
- Page 47 and 48: Chapter 2 Experimental techniques a
- Page 49 and 50: maximum power into the plasma. (a)
- Page 51 and 52: Figure 2.2: Illustration of sample
- Page 53 and 54: Ray Diraction, X-Ray Reectivity, El
- Page 55 and 56: (a) Normal Incidence. (b) Oblique (
- Page 57 and 58: to equation 2.4, when X-ray beam st
- Page 59 and 60: investigation. This value is obtain
- Page 61 and 62: e seen that large θ (here, θ is u
- Page 63 and 64: Figure 2.12: Raman spectrometer-Sch
- Page 65 and 66: Experimental set-up and working tel
- Page 67 and 68: ˆ The presence of Si from SiO 2 or
- Page 69 and 70: 2.2.7 Spectroscopic Ellipsometry Pr
- Page 71 and 72: k(E) = f j(ω − ω g ) 2 (ω −
- Page 73 and 74: tel-00916300, version 1 - 10 Dec 20
- Page 75 and 76: Figure 2.20: Schematic diagram of t
- Page 77 and 78: Chapter 3 A study on RF sputtered S
- Page 79 and 80: (a) Deposition rate. (b) Refractive
- Page 81 and 82: Thus, by knowing the refractive ind
- Page 83 and 84: tel-00916300, version 1 - 10 Dec 20
- Page 85 and 86: P Ar (mTorr) P H2 (mTorr) r H (%) 1
- Page 87 and 88: such a peak was witnessed in [Quiro
- Page 89: the host SiO 2 matrix leading to an
- Page 93 and 94: P Si (W/cm 2 ) x = 0/Si Bruggemann
- Page 95 and 96: tel-00916300, version 1 - 10 Dec 20
- Page 97 and 98: Figure 3.15: Absorption coecient cu
- Page 99 and 100: Aim of the study To see the inuence
- Page 101 and 102: tel-00916300, version 1 - 10 Dec 20
- Page 103 and 104: It can be seen that there is a sign
- Page 105 and 106: tel-00916300, version 1 - 10 Dec 20
- Page 107 and 108: 3.8.4 Inuence of SiO 2 barrier thic
- Page 109 and 110: Chapter 4 A study on RF sputtered S
- Page 111 and 112: 4.2.2 Structural analysis (a) Fouri
- Page 113 and 114: tel-00916300, version 1 - 10 Dec 20
- Page 115 and 116: tel-00916300, version 1 - 10 Dec 20
- Page 117 and 118: tel-00916300, version 1 - 10 Dec 20
- Page 119 and 120: (a) FTIR spectra of NRSN, Si 3 N 4
- Page 121 and 122: tel-00916300, version 1 - 10 Dec 20
- Page 123 and 124: Figure 4.15: Absorption coecient sp
- Page 125 and 126: A multilayer composed of 100 patter
- Page 127 and 128: multilayered conguration. Therefore
- Page 129 and 130: around 1250 cm −1 . The blueshift
- Page 131 and 132: tel-00916300, version 1 - 10 Dec 20
- Page 133 and 134: tion but within a dierence of one o
- Page 135 and 136: sample peak 1 (eV) peak 2 (eV) peak
- Page 137 and 138: (a) 1min annealing vs. T A . (b) 1h
- Page 139 and 140: tel-00916300, version 1 - 10 Dec 20
The LO 3 and TO 3 peaks approach each other, resulting in the increasing intensity<br />
of LO 4 -TO 4 doublet. This is an indication that the increasing <strong>Si</strong> excess induces<br />
disor<strong>de</strong>r in the <strong>de</strong>posited layer. <strong>Si</strong>nce the peak around 1107 cm −1 appears from<br />
P <strong>Si</strong> = 2.07 W/cm 2 onwards and increases gradually with increasing power applied<br />
on <strong>Si</strong> catho<strong>de</strong>, we can conrm that this peak is associated with <strong>Si</strong> excess. This peak<br />
thus can be attributed to be a combined contribution of increasing disor<strong>de</strong>r in the<br />
matrix and agglomeration of <strong>Si</strong> with interstitial oxygen.<br />
(c) <strong>Si</strong> excess estimation<br />
tel-00916300, version 1 - 10 Dec 2013<br />
P <strong>Si</strong> (W/cm 2 ) ν T O3 x = 0/<strong>Si</strong><br />
from<br />
FTIR<br />
<strong>Si</strong> excess<br />
(at.%) from<br />
FTIR<br />
(unbon<strong>de</strong>d<br />
<strong>Si</strong>)<br />
x = 0/<strong>Si</strong><br />
from ellipsometry<br />
<strong>Si</strong> excess<br />
(at.%)<br />
from<br />
ellipsometry<br />
(agglomerated<br />
<strong>Si</strong>)<br />
1.62 1046 1.62 7.25 1.75 5.4<br />
1.77 1045 1.61 7.47 1.68 6.7<br />
2.07 1042 1.57 8.2 1.64 7.6<br />
2.22 1042 1.57 8.2 1.57 9.2<br />
2.37 1041 1.56 8.45 1.57 9.2<br />
2.66 1040 1.55 8.8 1.50 10.8<br />
2.96 1039 1.54 8.96 1.43 12.57<br />
Table 3.5: <strong>Si</strong> excess estimation by FTIR and refractive in<strong>de</strong>x (Bruggeman method)<br />
analysis with varying P <strong>Si</strong> .<br />
The <strong>Si</strong> excess estimated from FTIR (unbon<strong>de</strong>d <strong>Si</strong>) within an uncertainity of<br />
±0.2% and ellipsometry (Bruggeman method-agglomerated <strong>Si</strong>) analysis within an<br />
uncertainity of ±3% are given in table 3.5. Comparing with the results of previous<br />
<strong>de</strong>position approach (ref. Tab. 3.2), it can be noticed that the increase of P <strong>Si</strong> leads<br />
to an increase in <strong>Si</strong> excess estimated from both FTIR and ellipsometry methods.<br />
This can be attributed to the increasing RF power <strong>de</strong>nsity applied on the <strong>Si</strong> target<br />
that favours the incorporation of isolated <strong>Si</strong> (i.e. unboun<strong>de</strong>d <strong>Si</strong>) as well as the<br />
formation of <strong>Si</strong>-np (i.e. agglomerated <strong>Si</strong>).<br />
3.4 Reactive Co-sputtering- Method 3<br />
In or<strong>de</strong>r to take advantage of the above <strong>de</strong>scribed two methods, in favouring the<br />
incorporation of <strong>Si</strong> excess within the <strong>Si</strong>O 2 matrix, reactive co-sputtering method is<br />
72


