Films minces à base de Si nanostructuré pour des cellules ...
Films minces à base de Si nanostructuré pour des cellules ... Films minces à base de Si nanostructuré pour des cellules ...
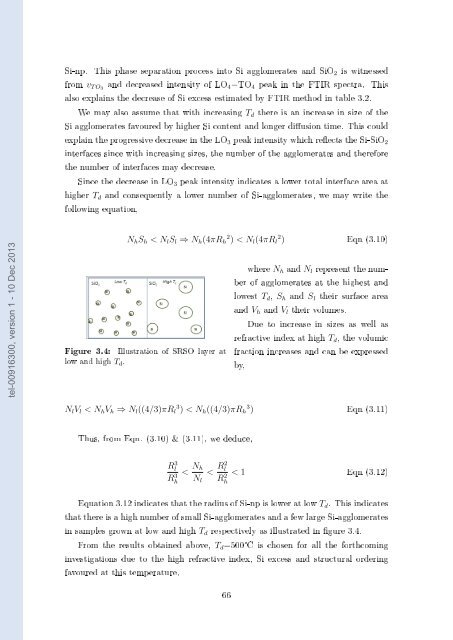
Si-np. This phase separation process into Si agglomerates and SiO 2 is witnessed from v T O3 and decreased intensity of LO 4 −TO 4 peak in the FTIR spectra. This also explains the decrease of Si excess estimated by FTIR method in table 3.2. We may also assume that with increasing T d there is an increase in size of the Si agglomerates favoured by higher Si content and longer diusion time. This could explain the progressive decrease in the LO 3 peak intensity which reects the Si-SiO 2 interfaces since with increasing sizes, the number of the agglomerates and therefore the number of interfaces may decrease. Since the decrease in LO 3 peak intensity indicates a lower total interface area at higher T d and consequently a lower number of Si-agglomerates, we may write the following equation, tel-00916300, version 1 - 10 Dec 2013 N h S h < N l S l ⇒ N h (4πR h 2 ) < N l (4πR l 2 ) Eqn (3.10) Figure 3.4: Illustration of SRSO layer at low and high T d . where N h and N l represent the number of agglomerates at the highest and lowest T d , S h and S l their surface area and V h and V l their volumes. Due to increase in sizes as well as refractive index at high T d , the volumic fraction increases and can be expressed by, N l V l < N h V h ⇒ N l ((4/3)πR l 3 ) < N h ((4/3)πR h 3 ) Eqn (3.11) Thus, from Eqn. (3.10) & (3.11), we deduce, Rl 3 Rh 3 < N h N l < R2 l R 2 h < 1 Eqn (3.12) Equation 3.12 indicates that the radius of Si-np is lower at low T d . This indicates that there is a high number of small Si-agglomerates and a few large Si-agglomerates in samples grown at low and high T d respectively as illustrated in gure 3.4. From the results obtained above, T d =500°C is chosen for all the forthcoming investigations due to the high refractive index, Si excess and structural ordering favoured at this temperature. 66
P Ar (mTorr) P H2 (mTorr) r H (%) 14.4 0.7 4.6% 10.5 1.4 11.7% 8.1 2.9 26% 4 5.3 57% Table 3.3: Conditions used to obtain hydrogen-rich plasma. 3.2.2 Eect of hydrogen gas rate (r H ) tel-00916300, version 1 - 10 Dec 2013 Four layers of SRSO with varying r H were grown at T d = 500°C. Table 3.3 shows the values of partial pressures of Ar and H 2 and the corresponding r H . Since the hydrogen in the plasma leads to two competing phenomena as described above, it becomes important to see how the hydrogen rate in the plasma inuences the compositional and structural properties of SRSO layers. (a) Deposition rate (r d ) and Refractive Index (n 1.95eV ) The evolution of r d and n 1.95eV with respect to r H introduced into the plasma are shown in gure 3.5. It can be seen that there is a steady decrease in r d with increase in r H from 4.6% to 57%. On the contrary, n 1.95eV value increases with increasing r H . Figure 3.5: Eect of r H % on the deposition rate (r d ) nm/s (left axis)and refractive index, n 1.95eV (right axis). When hydrogen is introduced in the plasma, ˆ the Si-Si bonds are broken leading to the removal of Si atoms from the surface [Tsai 89, Drévillion 93, Akasaka 95]. This selective etching leads to a decrease in r d on increasing r H from 4.6%-57%. 67
- Page 33 and 34: Shockley-Queisser limit of 31% [Sho
- Page 35 and 36: tel-00916300, version 1 - 10 Dec 20
- Page 37 and 38: tel-00916300, version 1 - 10 Dec 20
- Page 39 and 40: tel-00916300, version 1 - 10 Dec 20
- Page 41 and 42: Figure 1.12: materials. Energy diag
- Page 43 and 44: tel-00916300, version 1 - 10 Dec 20
- Page 45 and 46: Background of this thesis: A new me
- Page 47 and 48: Chapter 2 Experimental techniques a
- Page 49 and 50: maximum power into the plasma. (a)
- Page 51 and 52: Figure 2.2: Illustration of sample
- Page 53 and 54: Ray Diraction, X-Ray Reectivity, El
- Page 55 and 56: (a) Normal Incidence. (b) Oblique (
- Page 57 and 58: to equation 2.4, when X-ray beam st
- Page 59 and 60: investigation. This value is obtain
- Page 61 and 62: e seen that large θ (here, θ is u
- Page 63 and 64: Figure 2.12: Raman spectrometer-Sch
- Page 65 and 66: Experimental set-up and working tel
- Page 67 and 68: ˆ The presence of Si from SiO 2 or
- Page 69 and 70: 2.2.7 Spectroscopic Ellipsometry Pr
- Page 71 and 72: k(E) = f j(ω − ω g ) 2 (ω −
- Page 73 and 74: tel-00916300, version 1 - 10 Dec 20
- Page 75 and 76: Figure 2.20: Schematic diagram of t
- Page 77 and 78: Chapter 3 A study on RF sputtered S
- Page 79 and 80: (a) Deposition rate. (b) Refractive
- Page 81 and 82: Thus, by knowing the refractive ind
- Page 83: tel-00916300, version 1 - 10 Dec 20
- Page 87 and 88: such a peak was witnessed in [Quiro
- Page 89 and 90: the host SiO 2 matrix leading to an
- Page 91 and 92: initiated in this thesis, for the g
- Page 93 and 94: P Si (W/cm 2 ) x = 0/Si Bruggemann
- Page 95 and 96: tel-00916300, version 1 - 10 Dec 20
- Page 97 and 98: Figure 3.15: Absorption coecient cu
- Page 99 and 100: Aim of the study To see the inuence
- Page 101 and 102: tel-00916300, version 1 - 10 Dec 20
- Page 103 and 104: It can be seen that there is a sign
- Page 105 and 106: tel-00916300, version 1 - 10 Dec 20
- Page 107 and 108: 3.8.4 Inuence of SiO 2 barrier thic
- Page 109 and 110: Chapter 4 A study on RF sputtered S
- Page 111 and 112: 4.2.2 Structural analysis (a) Fouri
- Page 113 and 114: tel-00916300, version 1 - 10 Dec 20
- Page 115 and 116: tel-00916300, version 1 - 10 Dec 20
- Page 117 and 118: tel-00916300, version 1 - 10 Dec 20
- Page 119 and 120: (a) FTIR spectra of NRSN, Si 3 N 4
- Page 121 and 122: tel-00916300, version 1 - 10 Dec 20
- Page 123 and 124: Figure 4.15: Absorption coecient sp
- Page 125 and 126: A multilayer composed of 100 patter
- Page 127 and 128: multilayered conguration. Therefore
- Page 129 and 130: around 1250 cm −1 . The blueshift
- Page 131 and 132: tel-00916300, version 1 - 10 Dec 20
- Page 133 and 134: tion but within a dierence of one o
<strong>Si</strong>-np. This phase separation process into <strong>Si</strong> agglomerates and <strong>Si</strong>O 2 is witnessed<br />
from v T O3 and <strong>de</strong>creased intensity of LO 4 −TO 4 peak in the FTIR spectra. This<br />
also explains the <strong>de</strong>crease of <strong>Si</strong> excess estimated by FTIR method in table 3.2.<br />
We may also assume that with increasing T d there is an increase in size of the<br />
<strong>Si</strong> agglomerates favoured by higher <strong>Si</strong> content and longer diusion time. This could<br />
explain the progressive <strong>de</strong>crease in the LO 3 peak intensity which reects the <strong>Si</strong>-<strong>Si</strong>O 2<br />
interfaces since with increasing sizes, the number of the agglomerates and therefore<br />
the number of interfaces may <strong>de</strong>crease.<br />
<strong>Si</strong>nce the <strong>de</strong>crease in LO 3 peak intensity indicates a lower total interface area at<br />
higher T d and consequently a lower number of <strong>Si</strong>-agglomerates, we may write the<br />
following equation,<br />
tel-00916300, version 1 - 10 Dec 2013<br />
N h S h < N l S l ⇒ N h (4πR h 2 ) < N l (4πR l 2 ) Eqn (3.10)<br />
Figure 3.4: Illustration of SRSO layer at<br />
low and high T d .<br />
where N h and N l represent the number<br />
of agglomerates at the highest and<br />
lowest T d , S h and S l their surface area<br />
and V h and V l their volumes.<br />
Due to increase in sizes as well as<br />
refractive in<strong>de</strong>x at high T d , the volumic<br />
fraction increases and can be expressed<br />
by,<br />
N l V l < N h V h ⇒ N l ((4/3)πR l 3 ) < N h ((4/3)πR h 3 ) Eqn (3.11)<br />
Thus, from Eqn. (3.10) & (3.11), we <strong>de</strong>duce,<br />
Rl<br />
3<br />
Rh<br />
3<br />
< N h<br />
N l<br />
< R2 l<br />
R 2 h<br />
< 1 Eqn (3.12)<br />
Equation 3.12 indicates that the radius of <strong>Si</strong>-np is lower at low T d . This indicates<br />
that there is a high number of small <strong>Si</strong>-agglomerates and a few large <strong>Si</strong>-agglomerates<br />
in samples grown at low and high T d respectively as illustrated in gure 3.4.<br />
From the results obtained above, T d =500°C is chosen for all the forthcoming<br />
investigations due to the high refractive in<strong>de</strong>x, <strong>Si</strong> excess and structural or<strong>de</strong>ring<br />
favoured at this temperature.<br />
66


