Films minces à base de Si nanostructuré pour des cellules ...
Films minces à base de Si nanostructuré pour des cellules ... Films minces à base de Si nanostructuré pour des cellules ...
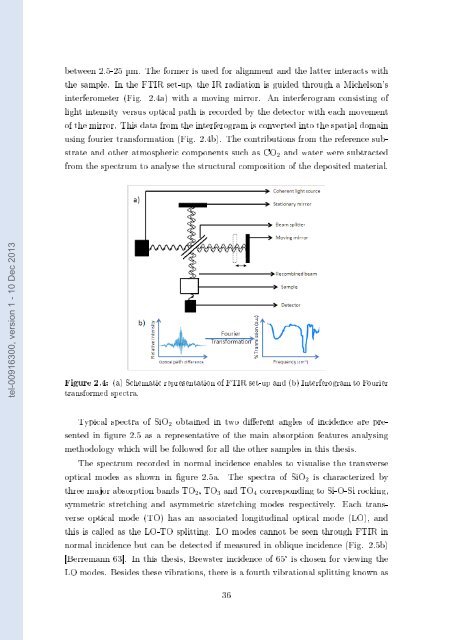
etween 2.5-25 µm. The former is used for alignment and the latter interacts with the sample. In the FTIR set-up, the IR radiation is guided through a Michelson's interferometer (Fig. 2.4a) with a moving mirror. An interferogram consisting of light intensity versus optical path is recorded by the detector with each movement of the mirror. This data from the interferogram is converted into the spatial domain using fourier transformation (Fig. 2.4b). The contributions from the reference substrate and other atmospheric components such as CO 2 and water were subtracted from the spectrum to analyse the structural composition of the deposited material. tel-00916300, version 1 - 10 Dec 2013 Figure 2.4: (a) Schematic representation of FTIR set-up and (b) Interferogram to Fourier transformed spectra. Typical spectra of SiO 2 obtained in two dierent angles of incidence are presented in gure 2.5 as a representative of the main absorption features analysing methodology which will be followed for all the other samples in this thesis. The spectrum recorded in normal incidence enables to visualise the transverse optical modes as shown in gure 2.5a. The spectra of SiO 2 is characterized by three major absorption bands TO 2 , TO 3 and TO 4 corresponding to Si-O-Si rocking, symmetric stretching and asymmetric stretching modes respectively. Each transverse optical mode (TO) has an associated longitudinal optical mode (LO), and this is called as the LO-TO splitting. LO modes cannot be seen through FTIR in normal incidence but can be detected if measured in oblique incidence (Fig. 2.5b) [Berremann 63]. In this thesis, Brewster incidence of 65° is chosen for viewing the LO modes. Besides these vibrations, there is a fourth vibrational splitting known as 36
(a) Normal Incidence. (b) Oblique (Brewster) Incidence. tel-00916300, version 1 - 10 Dec 2013 Figure 2.5: Typical FTIR spectra of SiO 2 which is decomposed into three and ve gaussians in the normal incidence and Brewster incidence spectra respectively. LO 4 -TO 4 , which is assigned to disorder-induced mode in the SiO 2 matrix [Kirk 88]. The presence of these vibrational modes are sometimes overlapping and hence a curve tting within the range of interest was perfomed using gaussian functions to resolve the peaks and estimate their positions. Table 2.1 summarizes the characteristic vibrational frequencies of SiO 2 as compiled from [Lehmann 83, Pai 86, Innocenzi 03]. Peak position (cm −1 ) Vibrational Modes 460 TO 1 Si-O rocking 507 LO 1 Si-O rocking 810 TO 2 Si-O symmetric stretch 820 LO 2 Si-O symmetric stretch 1080 TO 3 Si-O antisymmetric stretch (adjacent O atoms in phase) 1256 LO 3 Si-O antisymmetric stretch 1150-1200 LO 4 -TO 4 Si-O antisymmetric stretch (adjacent O atoms out of phase - disorder induced mode). Table 2.1: Characteristic FTIR vibrational frequencies of SiO 2 . Informations extracted in this thesis ˆ The dierent types of bonds such as Si-O, Si-H, Si-N, Si-ON, N-H etc., are detected from the position of the longitudinal and transverse optic modes. 37
- Page 3 and 4: tel-00916300, version 1 - 10 Dec 20
- Page 5 and 6: 2.1.1 Radiofrequency Magnetron Reac
- Page 7 and 8: tel-00916300, version 1 - 10 Dec 20
- Page 9 and 10: tel-00916300, version 1 - 10 Dec 20
- Page 11 and 12: 3.21 Inuence of sublayer thicknesse
- Page 13 and 14: tel-00916300, version 1 - 10 Dec 20
- Page 15 and 16: tel-00916300, version 1 - 10 Dec 20
- Page 17 and 18: tel-00916300, version 1 - 10 Dec 20
- Page 19 and 20: Introduction State of the art tel-0
- Page 21 and 22: as the thickness of the lm, the pat
- Page 23 and 24: Chapter 1 Role of Silicon in Photov
- Page 25 and 26: mono-, poly- and amorphous silicon,
- Page 27 and 28: Figure 1.3: A typical solar cell ar
- Page 29 and 30: occurance of this three body event
- Page 31 and 32: tel-00916300, version 1 - 10 Dec 20
- Page 33 and 34: Shockley-Queisser limit of 31% [Sho
- Page 35 and 36: tel-00916300, version 1 - 10 Dec 20
- Page 37 and 38: tel-00916300, version 1 - 10 Dec 20
- Page 39 and 40: tel-00916300, version 1 - 10 Dec 20
- Page 41 and 42: Figure 1.12: materials. Energy diag
- Page 43 and 44: tel-00916300, version 1 - 10 Dec 20
- Page 45 and 46: Background of this thesis: A new me
- Page 47 and 48: Chapter 2 Experimental techniques a
- Page 49 and 50: maximum power into the plasma. (a)
- Page 51 and 52: Figure 2.2: Illustration of sample
- Page 53: Ray Diraction, X-Ray Reectivity, El
- Page 57 and 58: to equation 2.4, when X-ray beam st
- Page 59 and 60: investigation. This value is obtain
- Page 61 and 62: e seen that large θ (here, θ is u
- Page 63 and 64: Figure 2.12: Raman spectrometer-Sch
- Page 65 and 66: Experimental set-up and working tel
- Page 67 and 68: ˆ The presence of Si from SiO 2 or
- Page 69 and 70: 2.2.7 Spectroscopic Ellipsometry Pr
- Page 71 and 72: k(E) = f j(ω − ω g ) 2 (ω −
- Page 73 and 74: tel-00916300, version 1 - 10 Dec 20
- Page 75 and 76: Figure 2.20: Schematic diagram of t
- Page 77 and 78: Chapter 3 A study on RF sputtered S
- Page 79 and 80: (a) Deposition rate. (b) Refractive
- Page 81 and 82: Thus, by knowing the refractive ind
- Page 83 and 84: tel-00916300, version 1 - 10 Dec 20
- Page 85 and 86: P Ar (mTorr) P H2 (mTorr) r H (%) 1
- Page 87 and 88: such a peak was witnessed in [Quiro
- Page 89 and 90: the host SiO 2 matrix leading to an
- Page 91 and 92: initiated in this thesis, for the g
- Page 93 and 94: P Si (W/cm 2 ) x = 0/Si Bruggemann
- Page 95 and 96: tel-00916300, version 1 - 10 Dec 20
- Page 97 and 98: Figure 3.15: Absorption coecient cu
- Page 99 and 100: Aim of the study To see the inuence
- Page 101 and 102: tel-00916300, version 1 - 10 Dec 20
- Page 103 and 104: It can be seen that there is a sign
etween 2.5-25 µm. The former is used for alignment and the latter interacts with<br />
the sample. In the FTIR set-up, the IR radiation is gui<strong>de</strong>d through a Michelson's<br />
interferometer (Fig. 2.4a) with a moving mirror. An interferogram consisting of<br />
light intensity versus optical path is recor<strong>de</strong>d by the <strong>de</strong>tector with each movement<br />
of the mirror. This data from the interferogram is converted into the spatial domain<br />
using fourier transformation (Fig. 2.4b). The contributions from the reference substrate<br />
and other atmospheric components such as CO 2 and water were subtracted<br />
from the spectrum to analyse the structural composition of the <strong>de</strong>posited material.<br />
tel-00916300, version 1 - 10 Dec 2013<br />
Figure 2.4: (a) Schematic representation of FTIR set-up and (b) Interferogram to Fourier<br />
transformed spectra.<br />
Typical spectra of <strong>Si</strong>O 2 obtained in two dierent angles of inci<strong>de</strong>nce are presented<br />
in gure 2.5 as a representative of the main absorption features analysing<br />
methodology which will be followed for all the other samples in this thesis.<br />
The spectrum recor<strong>de</strong>d in normal inci<strong>de</strong>nce enables to visualise the transverse<br />
optical mo<strong>de</strong>s as shown in gure 2.5a. The spectra of <strong>Si</strong>O 2 is characterized by<br />
three major absorption bands TO 2 , TO 3 and TO 4 corresponding to <strong>Si</strong>-O-<strong>Si</strong> rocking,<br />
symmetric stretching and asymmetric stretching mo<strong>de</strong>s respectively. Each transverse<br />
optical mo<strong>de</strong> (TO) has an associated longitudinal optical mo<strong>de</strong> (LO), and<br />
this is called as the LO-TO splitting. LO mo<strong>de</strong>s cannot be seen through FTIR in<br />
normal inci<strong>de</strong>nce but can be <strong>de</strong>tected if measured in oblique inci<strong>de</strong>nce (Fig. 2.5b)<br />
[Berremann 63]. In this thesis, Brewster inci<strong>de</strong>nce of 65° is chosen for viewing the<br />
LO mo<strong>de</strong>s. Besi<strong>de</strong>s these vibrations, there is a fourth vibrational splitting known as<br />
36


