Films minces à base de Si nanostructuré pour des cellules ...
Films minces à base de Si nanostructuré pour des cellules ... Films minces à base de Si nanostructuré pour des cellules ...
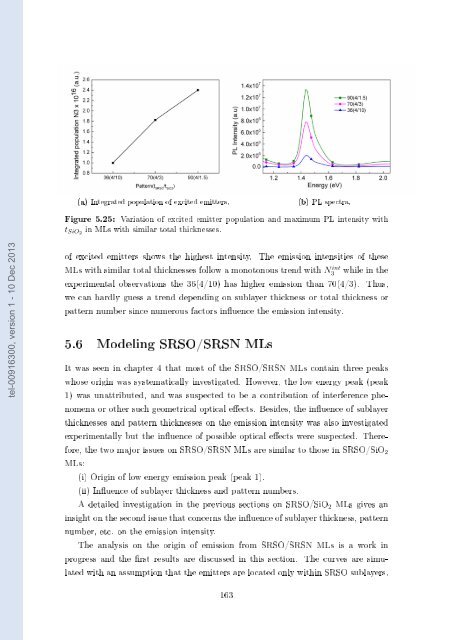
Figure 5.24a shows the maximum PL peak positions in MLs with varying t SiO2 . The 50(3/1.5) ML shows a higher emission intensity than 50(3/3) and 50(3/5) in simulated curves, whereas in the experiments 50(3/1.5) has the lowest intensity (ref. Fig. 3.23 in chapter 3). This dierence between the experimentally obtained and simulated curves may be attributed to the ideal case of ML considered in simulations, which does not account for overgrowth with lower barrier due to diusion of Si within SiO 2 . But, the non-monotonous trend of the emission intensities with increasing t SiO2 indicate that the pump prole has also inuenced this intensity since the emitter distribution varies with the pump prole. tel-00916300, version 1 - 10 Dec 2013 Figure 5.24: t SiO2 (a) I P L.max vs. t SiO2 (b) Integrated population of excited emitters. Variation of excited emitter population and maximum PL intensity with in MLs with dierent total thicknesses. In order to investigate the inuence of the emitter distribution, the population of excited emitters integrated over the whole thickness (N3 int ) was analyzed in each case (Fig. 5.24b). It can be seen that N3 int remains in the range 0.90 ±0.20 x 10 15 /m 2 with varying t SiO2 . The maximum PL intensity follows a similar trend to that of N3 int upto t SiO2 = 9 nm, after which it is no longer proprtional with N3 int (Inset of 5.24a). This suggests the possible optical cavity eect, with increasing total thicknesses that approach the wavelength of emission. These results indicate that various other optical eects that arise with varying thickness, refractive index etc. also play a role besides the pump prole, and excited emitter distributions. The emission intensity of MLs with dierent pattern numbers (36, 70 and 90) leading to similar total thickness with same t SRSO and dierent t SiO2 were also investigated in order to compare with gure 5.24 above and gure 3.22(a) (chapter 3). Figure 5.25 shows N3 int and the simulated PL spectra from 90(4/1.5), 70(4/3) and 36(4/10) MLs. It can be seen from this gure, that 90(4/1.5) which has the highest density 162
(a) Integrated population of excited emitters. (b) PL spectra. Variation of excited emitter population and maximum PL intensity with in MLs with similar total thicknesses. Figure 5.25: t SiO2 tel-00916300, version 1 - 10 Dec 2013 of excited emitters shows the highest intensity. The emission intensities of these MLs with similar total thicknesses follow a monotonous trend with N3 int while in the experimental observations the 36(4/10) has higher emission than 70(4/3). Thus, we can hardly guess a trend depending on sublayer thickness or total thickness or pattern number since numerous factors inuence the emission intensity. 5.6 Modeling SRSO/SRSN MLs It was seen in chapter 4 that most of the SRSO/SRSN MLs contain three peaks whose origin was systematically investigated. However, the low energy peak (peak 1) was unattributed, and was suspected to be a contribution of interference phenomena or other such geometrical optical eects. Besides, the inuence of sublayer thicknesses and pattern thicknesses on the emission intensity was also investigated experimentally but the inuence of possible optical eects were suspected. Therefore, the two major issues on SRSO/SRSN MLs are similar to those in SRSO/SiO 2 MLs: (i) Origin of low energy emission peak (peak 1). (ii) Inuence of sublayer thickness and pattern numbers. A detailed investigation in the previous sections on SRSO/SiO 2 MLs gives an insight on the second issue that concerns the inuence of sublayer thickness, pattern number, etc. on the emission intensity. The analysis on the origin of emission from SRSO/SRSN MLs is a work in progress and the rst results are discussed in this section. The curves are simulated with an assumption that the emitters are located only within SRSO sublayers. 163
- Page 129 and 130: around 1250 cm −1 . The blueshift
- Page 131 and 132: tel-00916300, version 1 - 10 Dec 20
- Page 133 and 134: tion but within a dierence of one o
- Page 135 and 136: sample peak 1 (eV) peak 2 (eV) peak
- Page 137 and 138: (a) 1min annealing vs. T A . (b) 1h
- Page 139 and 140: tel-00916300, version 1 - 10 Dec 20
- Page 141 and 142: (a) Brewster incidence. (b) Normal
- Page 143 and 144: tel-00916300, version 1 - 10 Dec 20
- Page 145 and 146: increases for the 50 patterned samp
- Page 147 and 148: - Peak (3) and (c): 1.8-1.95 eV Die
- Page 149 and 150: 4.10.2 Eect of Si-np Size distribut
- Page 151 and 152: tel-00916300, version 1 - 10 Dec 20
- Page 153 and 154: tel-00916300, version 1 - 10 Dec 20
- Page 155 and 156: Chapter 5 Photoluminescence emissio
- Page 157 and 158: As seen from gure 5.1, a part of th
- Page 159 and 160: function of wavelength consists of
- Page 161 and 162: tel-00916300, version 1 - 10 Dec 20
- Page 163 and 164: In the case of our multilayers, the
- Page 165 and 166: ⎛ ⎜ ⎝ A ′ 2 B ′ 2 1 ⎞
- Page 167 and 168: dN 3 dt = N 2 τ 23 − (σ em. φ
- Page 169 and 170: Figure 5.12: The shapes of k(λ) an
- Page 171 and 172: 5.4 Discussion on the choice of inp
- Page 173 and 174: tting operations show the presence
- Page 175 and 176: (a) 270nm. (b) 300nm. tel-00916300,
- Page 177 and 178: (a) σ emis.max. = 8.78 x 10 −18
- Page 179: (a) 50(3/1.5) (b) 50(3/3) tel-00916
- Page 183 and 184: two kinds of emitters in SRSO subla
- Page 185 and 186: Conclusion and future perspectives
- Page 187 and 188: 4. Investigating the origin of phot
- Page 189 and 190: Bibliography [Abeles 83] B. Abeles
- Page 191 and 192: [Carlson 76] D. E. Carlson & C. R.
- Page 193 and 194: [Di 10] D. Di, I. Perez-Wur, G. Con
- Page 195 and 196: [Gritsenko 99] V. A. Gritsenko, K.
- Page 197 and 198: [Kaiser 56] W. Kaiser, P. H. Kech &
- Page 199 and 200: [Mandelkorn 62] J. Mandelkorn, C. M
- Page 201 and 202: [Pavesi 00] L. Pavesi, L. D. Negro,
- Page 203 and 204: [Sopori 96] B. L. Sopori, X. Deng,
- Page 205 and 206: [Weng 93] Y. M. Weng, Zh. N. fan &
- Page 207 and 208: and the tangential components of th
- Page 209 and 210: Appendix II Trials σ em.max (x10
- Page 211: Résumé tel-00916300, version 1 -
(a) Integrated population of excited emitters.<br />
(b) PL spectra.<br />
Variation of excited emitter population and maximum PL intensity with<br />
in MLs with similar total thicknesses.<br />
Figure 5.25:<br />
t <strong>Si</strong>O2<br />
tel-00916300, version 1 - 10 Dec 2013<br />
of excited emitters shows the highest intensity. The emission intensities of these<br />
MLs with similar total thicknesses follow a monotonous trend with N3 int while in the<br />
experimental observations the 36(4/10) has higher emission than 70(4/3). Thus,<br />
we can hardly guess a trend <strong>de</strong>pending on sublayer thickness or total thickness or<br />
pattern number since numerous factors inuence the emission intensity.<br />
5.6 Mo<strong>de</strong>ling SRSO/SRSN MLs<br />
It was seen in chapter 4 that most of the SRSO/SRSN MLs contain three peaks<br />
whose origin was systematically investigated. However, the low energy peak (peak<br />
1) was unattributed, and was suspected to be a contribution of interference phenomena<br />
or other such geometrical optical eects. Besi<strong>de</strong>s, the inuence of sublayer<br />
thicknesses and pattern thicknesses on the emission intensity was also investigated<br />
experimentally but the inuence of possible optical eects were suspected. Therefore,<br />
the two major issues on SRSO/SRSN MLs are similar to those in SRSO/<strong>Si</strong>O 2<br />
MLs:<br />
(i) Origin of low energy emission peak (peak 1).<br />
(ii) Inuence of sublayer thickness and pattern numbers.<br />
A <strong>de</strong>tailed investigation in the previous sections on SRSO/<strong>Si</strong>O 2 MLs gives an<br />
insight on the second issue that concerns the inuence of sublayer thickness, pattern<br />
number, etc. on the emission intensity.<br />
The analysis on the origin of emission from SRSO/SRSN MLs is a work in<br />
progress and the rst results are discussed in this section. The curves are simulated<br />
with an assumption that the emitters are located only within SRSO sublayers.<br />
163


