Films minces à base de Si nanostructuré pour des cellules ...
Films minces à base de Si nanostructuré pour des cellules ... Films minces à base de Si nanostructuré pour des cellules ...
From the two cases shown in this gure, it can be noticed that the angle of incidence inuences the intensity and position of the pump maxima. This indicates that with 45° incidence used in our PL experiments, the pump intensity is lower than that obtained in normal incidence. (b) Inuence of thickness tel-00916300, version 1 - 10 Dec 2013 The inuence of the lm thickness (d) on the pump prole was investigated for three cases: d = 300 nm, 500 nm and 1000 nm (Fig. 5.4). In all the three cases shown in this gure, the angle of incidence was xed at 45°, and the refractive index is as described before (ref. Fig. 5.2). It can be seen from gure 5.4 that only by varying the total thickness there is a change in the position and intensity of the pump prole. This can be related to the reection in the lm denoted as r glob in equation 5.10, which is a function of lm thickness. These results Figure 5.4: Inuence of total lm thickness on clearly indicate that the mean pump the pump prole. intensity varies non-monotonously with thickness (Tab. 5.1). Thickness (d) nm Pump intensity range W/m 2 300 1 x 10 4 - 8 x 10 4 500 2.5 x 10 4 - 1x10 5 1000 2 x 10 4 - 9.5 x10 4 Table 5.1: The pump intensity range for the three thicknesses investigated. (c) Inuence of complex refractive index The inuence of the real part and imaginary part of the complex refractive index on the pump prole were investigated. (c1) Real part (n 2 ): To witness the contribution of n 2 on the pump wave that travels from medium 1 (air) to medium 2 (thin lm), simulations are made by considering three SRSO monolayers with 500 nm thickness and three dierent refractive indices (n 2 = 1.48, 142
tel-00916300, version 1 - 10 Dec 2013 1.6 and 2.1). We assume that, there are no losses in the lm due to absorption and hence set k 2 =0. Figure 5.5 shows the pump prole variation with n 2 , along the depth (x) from lm surface. The result indicates that the intensity of the incident pump and the position of maxima varies with the refractive indices of the material. The mean pump intensity varies monotonously with refractive index in the three cases investigated (Tab. 5.5). The lower index resulting in the highest intensity. The period of the pump prole also varies with n 2 . We can thus suppose the variation of emission intensity with refractive index is not a sole contribution from Si-np density, but also the eect of the incident pump intensity that varies. Figure 5.5: Pump prole versus real part of thin lm refractive index (n 2 ). Real part (n 2 ) of refractive index Pump intensity range W/m 2 1.48 1.4 x 10 4 - 1.5 x 10 5 1.6 1.1 x 10 4 - 9.5x10 4 2.1 2.3 x 10 4 - 7.9 x10 4 Table 5.2: The pump intensity range for the three thicknesses investigated. (c2) Imaginary part (k 2 ): In order to investigate the eect of losses, the extinction coecient k 2 of the thin lm was varied while keeping n 2 xed at 1.6 (Fig. 5.6). Figure 5.6a shows the pump prole for three cases : k 2 = 0, 0.01 and 0.1 and gure 5.6b illustrates the envelope of the pump maxima and minima taking k 2 = 0.1 as a typical example. It can be seen from gure 5.6a that there are no losses when k 2 =0 and the intensity of the pump maxima and minima are constant with depth (x). With increasing values of extinction factor k 2 : (i) the envelopes of the pump maxima and minima decrease with depth (x) and (ii) the dierence between (Envelope) max. and (Envelope) min. decreases. This indicates that with increasing losses, the pump intensity decreases. These factors would inuence the excitation of emitters along the depth of the thin lm, and consequently on the emission intensity. 143
- Page 109 and 110: Chapter 4 A study on RF sputtered S
- Page 111 and 112: 4.2.2 Structural analysis (a) Fouri
- Page 113 and 114: tel-00916300, version 1 - 10 Dec 20
- Page 115 and 116: tel-00916300, version 1 - 10 Dec 20
- Page 117 and 118: tel-00916300, version 1 - 10 Dec 20
- Page 119 and 120: (a) FTIR spectra of NRSN, Si 3 N 4
- Page 121 and 122: tel-00916300, version 1 - 10 Dec 20
- Page 123 and 124: Figure 4.15: Absorption coecient sp
- Page 125 and 126: A multilayer composed of 100 patter
- Page 127 and 128: multilayered conguration. Therefore
- Page 129 and 130: around 1250 cm −1 . The blueshift
- Page 131 and 132: tel-00916300, version 1 - 10 Dec 20
- Page 133 and 134: tion but within a dierence of one o
- Page 135 and 136: sample peak 1 (eV) peak 2 (eV) peak
- Page 137 and 138: (a) 1min annealing vs. T A . (b) 1h
- Page 139 and 140: tel-00916300, version 1 - 10 Dec 20
- Page 141 and 142: (a) Brewster incidence. (b) Normal
- Page 143 and 144: tel-00916300, version 1 - 10 Dec 20
- Page 145 and 146: increases for the 50 patterned samp
- Page 147 and 148: - Peak (3) and (c): 1.8-1.95 eV Die
- Page 149 and 150: 4.10.2 Eect of Si-np Size distribut
- Page 151 and 152: tel-00916300, version 1 - 10 Dec 20
- Page 153 and 154: tel-00916300, version 1 - 10 Dec 20
- Page 155 and 156: Chapter 5 Photoluminescence emissio
- Page 157 and 158: As seen from gure 5.1, a part of th
- Page 159: function of wavelength consists of
- Page 163 and 164: In the case of our multilayers, the
- Page 165 and 166: ⎛ ⎜ ⎝ A ′ 2 B ′ 2 1 ⎞
- Page 167 and 168: dN 3 dt = N 2 τ 23 − (σ em. φ
- Page 169 and 170: Figure 5.12: The shapes of k(λ) an
- Page 171 and 172: 5.4 Discussion on the choice of inp
- Page 173 and 174: tting operations show the presence
- Page 175 and 176: (a) 270nm. (b) 300nm. tel-00916300,
- Page 177 and 178: (a) σ emis.max. = 8.78 x 10 −18
- Page 179 and 180: (a) 50(3/1.5) (b) 50(3/3) tel-00916
- Page 181 and 182: (a) Integrated population of excite
- Page 183 and 184: two kinds of emitters in SRSO subla
- Page 185 and 186: Conclusion and future perspectives
- Page 187 and 188: 4. Investigating the origin of phot
- Page 189 and 190: Bibliography [Abeles 83] B. Abeles
- Page 191 and 192: [Carlson 76] D. E. Carlson & C. R.
- Page 193 and 194: [Di 10] D. Di, I. Perez-Wur, G. Con
- Page 195 and 196: [Gritsenko 99] V. A. Gritsenko, K.
- Page 197 and 198: [Kaiser 56] W. Kaiser, P. H. Kech &
- Page 199 and 200: [Mandelkorn 62] J. Mandelkorn, C. M
- Page 201 and 202: [Pavesi 00] L. Pavesi, L. D. Negro,
- Page 203 and 204: [Sopori 96] B. L. Sopori, X. Deng,
- Page 205 and 206: [Weng 93] Y. M. Weng, Zh. N. fan &
- Page 207 and 208: and the tangential components of th
- Page 209 and 210: Appendix II Trials σ em.max (x10
tel-00916300, version 1 - 10 Dec 2013<br />
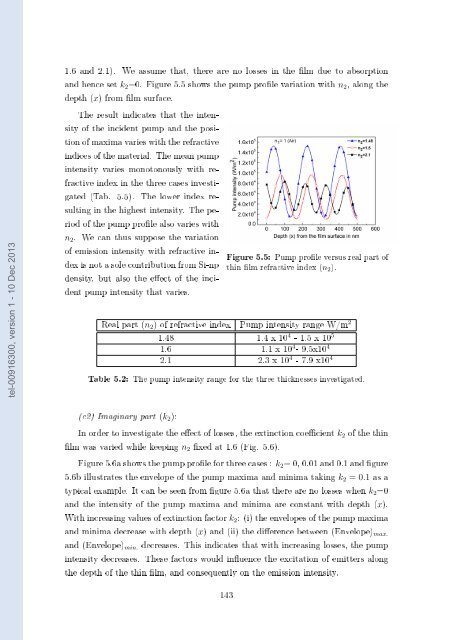
1.6 and 2.1). We assume that, there are no losses in the lm due to absorption<br />
and hence set k 2 =0. Figure 5.5 shows the pump prole variation with n 2 , along the<br />
<strong>de</strong>pth (x) from lm surface.<br />
The result indicates that the intensity<br />
of the inci<strong>de</strong>nt pump and the position<br />
of maxima varies with the refractive<br />
indices of the material. The mean pump<br />
intensity varies monotonously with refractive<br />
in<strong>de</strong>x in the three cases investigated<br />
(Tab. 5.5). The lower in<strong>de</strong>x resulting<br />
in the highest intensity. The period<br />
of the pump prole also varies with<br />
n 2 . We can thus suppose the variation<br />
of emission intensity with refractive in<strong>de</strong>x<br />
is not a sole contribution from <strong>Si</strong>-np<br />
<strong>de</strong>nsity, but also the eect of the inci<strong>de</strong>nt<br />
pump intensity that varies.<br />
Figure 5.5: Pump prole versus real part of<br />
thin lm refractive in<strong>de</strong>x (n 2 ).<br />
Real part (n 2 ) of refractive in<strong>de</strong>x Pump intensity range W/m 2<br />
1.48 1.4 x 10 4 - 1.5 x 10 5<br />
1.6 1.1 x 10 4 - 9.5x10 4<br />
2.1 2.3 x 10 4 - 7.9 x10 4<br />
Table 5.2: The pump intensity range for the three thicknesses investigated.<br />
(c2) Imaginary part (k 2 ):<br />
In or<strong>de</strong>r to investigate the eect of losses, the extinction coecient k 2 of the thin<br />
lm was varied while keeping n 2 xed at 1.6 (Fig. 5.6).<br />
Figure 5.6a shows the pump prole for three cases : k 2 = 0, 0.01 and 0.1 and gure<br />
5.6b illustrates the envelope of the pump maxima and minima taking k 2 = 0.1 as a<br />
typical example. It can be seen from gure 5.6a that there are no losses when k 2 =0<br />
and the intensity of the pump maxima and minima are constant with <strong>de</strong>pth (x).<br />
With increasing values of extinction factor k 2 : (i) the envelopes of the pump maxima<br />
and minima <strong>de</strong>crease with <strong>de</strong>pth (x) and (ii) the dierence between (Envelope) max.<br />
and (Envelope) min. <strong>de</strong>creases. This indicates that with increasing losses, the pump<br />
intensity <strong>de</strong>creases. These factors would inuence the excitation of emitters along<br />
the <strong>de</strong>pth of the thin lm, and consequently on the emission intensity.<br />
143


