Films minces à base de Si nanostructuré pour des cellules ...
Films minces à base de Si nanostructuré pour des cellules ... Films minces à base de Si nanostructuré pour des cellules ...
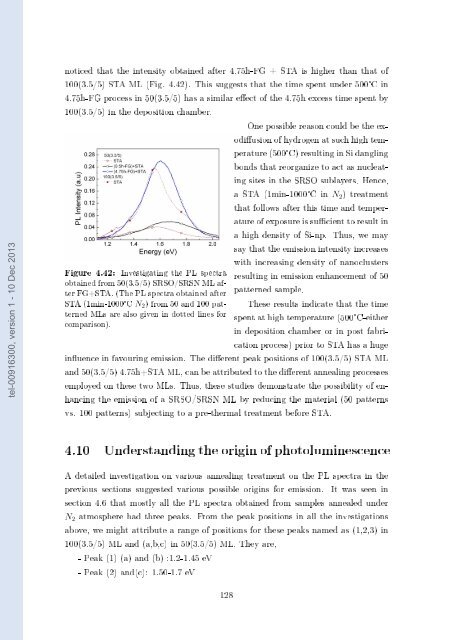
tel-00916300, version 1 - 10 Dec 2013 noticed that the intensity obtained after 4.75h-FG + STA is higher than that of 100(3.5/5) STA ML (Fig. 4.42). This suggests that the time spent under 500 °C in 4.75h-FG process in 50(3.5/5) has a similar eect of the 4.75h excess time spent by 100(3.5/5) in the deposition chamber. Figure 4.42: Investigating the PL spectra obtained from 50(3.5/5) SRSO/SRSN ML after FG+STA. (The PL spectra obtained after STA (1min-1000°C N 2 ) from 50 and 100 patterned MLs are also given in dotted lines for comparison). One possible reason could be the exodiusion of hydrogen at such high temperature (500°C) resulting in Si dangling bonds that reorganize to act as nucleating sites in the SRSO sublayers. Hence, a STA (1min-1000°C in N 2 ) treatment that follows after this time and temperature of exposure is sucient to result in a high density of Si-np. Thus, we may say that the emission intensity increases with increasing density of nanoclusters resulting in emission enhancement of 50 patterned sample. These results indicate that the time spent at high temperature (500°C-either in deposition chamber or in post fabrication process) prior to STA has a huge inuence in favouring emission. The dierent peak positions of 100(3.5/5) STA ML and 50(3.5/5) 4.75h+STA ML, can be attributed to the dierent annealing processes employed on these two MLs. Thus, these studies demonstrate the possibility of enhancing the emission of a SRSO/SRSN ML by reducing the material (50 patterns vs. 100 patterns) subjecting to a pre-thermal treatment before STA. 4.10 Understanding the origin of photoluminescence A detailed investigation on various annealing treatment on the PL spectra in the previous sections suggested various possible origins for emission. It was seen in section 4.6 that mostly all the PL spectra obtained from samples annealed under N 2 atmosphere had three peaks. From the peak positions in all the investigations above, we might attribute a range of positions for these peaks named as (1,2,3) in 100(3.5/5) ML and (a,b,c) in 50(3.5/5) ML. They are, - Peak (1) (a) and (b) :1.2-1.45 eV - Peak (2) and(c): 1.50-1.7 eV 128
- Peak (3) and (c): 1.8-1.95 eV Dierent names are given for the three peaks in 100(3.5/5) and 50(3.5/5) ML since the origin of these three peaks in both the cases may be dierent. It can be seen that the position of peak (c) is sometimes the same as peak (2) or sometimes as peak (3) leading to confusions on the origin of this emission. Hence, further investigations were made in an attempt to understand the origin of PL emission 4.10.1 Role of defects in the matrix In order to see the inuence of SRSN sublayers on the emission of peaks, 50(3.5/3.5) SRSN/SiO 2 MLs were grown and subjected to STA, CA and FG annealing. The tel-00916300, version 1 - 10 Dec 2013 PL spectra obtained from SRSO/SRSN MLs can be compared with SRSN/SiO 2 and SRSO/SiO 2 MLs in order to identify the contribution of SRSO, SRSN and SiO 2 sublayers independently. Figure 4.43 compares the PL spectra obtained from SRSO/SiO 2 , SRSO/SRSN and SRSN/SiO 2 MLs with 50(3.5/3.5) conguration after STA and CA. It can be noticed from the spectra of CA annealed samples that the SRSN/SiO 2 ML exhibits a weak PL around 1.9 eV while that from SRSO/SRSN ML is quenched as demonstrated before (ref. Fig. 4.25). This PL peak appears in a region usually related to the optical transitions in the SiO 2 matrix due to the presence of defects [Gourbilleau 09, Delachat 09]. The lower part of the gure 4.43 shows the PL spectra recorded from STA MLs. It can be noted that both SRSN/SiO 2 and SRSO/SiO 2 emit PL at the same peak position (around 1.9 eV), the latter being very weak. This indicates that besides SiO 2 , SRSN sublayers also contribute to emission around 1.9 eV in SRSN/SiO 2 ML. The PL intensity of SRSN/SiO 2 increases with annealing temperature while the peak position remains xed at 1.9 eV (See inset of Fig. 4.43). From gure 4.40 one can remark that that this peak around 1.9 eV is not seen in 50(3.5/5) ML, while in 100(3.5/5) it is signicant. Moreover, even under N 2 annealed STA samples, this peak was noticed with increasing Figure 4.43: PL spectra from 50(3.5/3.5) SRSO/SRSN, SRSO/SiO 2 and SRSN/SiO 2 MLs after STA and CA treatments. 129
- Page 95 and 96: tel-00916300, version 1 - 10 Dec 20
- Page 97 and 98: Figure 3.15: Absorption coecient cu
- Page 99 and 100: Aim of the study To see the inuence
- Page 101 and 102: tel-00916300, version 1 - 10 Dec 20
- Page 103 and 104: It can be seen that there is a sign
- Page 105 and 106: tel-00916300, version 1 - 10 Dec 20
- Page 107 and 108: 3.8.4 Inuence of SiO 2 barrier thic
- Page 109 and 110: Chapter 4 A study on RF sputtered S
- Page 111 and 112: 4.2.2 Structural analysis (a) Fouri
- Page 113 and 114: tel-00916300, version 1 - 10 Dec 20
- Page 115 and 116: tel-00916300, version 1 - 10 Dec 20
- Page 117 and 118: tel-00916300, version 1 - 10 Dec 20
- Page 119 and 120: (a) FTIR spectra of NRSN, Si 3 N 4
- Page 121 and 122: tel-00916300, version 1 - 10 Dec 20
- Page 123 and 124: Figure 4.15: Absorption coecient sp
- Page 125 and 126: A multilayer composed of 100 patter
- Page 127 and 128: multilayered conguration. Therefore
- Page 129 and 130: around 1250 cm −1 . The blueshift
- Page 131 and 132: tel-00916300, version 1 - 10 Dec 20
- Page 133 and 134: tion but within a dierence of one o
- Page 135 and 136: sample peak 1 (eV) peak 2 (eV) peak
- Page 137 and 138: (a) 1min annealing vs. T A . (b) 1h
- Page 139 and 140: tel-00916300, version 1 - 10 Dec 20
- Page 141 and 142: (a) Brewster incidence. (b) Normal
- Page 143 and 144: tel-00916300, version 1 - 10 Dec 20
- Page 145: increases for the 50 patterned samp
- Page 149 and 150: 4.10.2 Eect of Si-np Size distribut
- Page 151 and 152: tel-00916300, version 1 - 10 Dec 20
- Page 153 and 154: tel-00916300, version 1 - 10 Dec 20
- Page 155 and 156: Chapter 5 Photoluminescence emissio
- Page 157 and 158: As seen from gure 5.1, a part of th
- Page 159 and 160: function of wavelength consists of
- Page 161 and 162: tel-00916300, version 1 - 10 Dec 20
- Page 163 and 164: In the case of our multilayers, the
- Page 165 and 166: ⎛ ⎜ ⎝ A ′ 2 B ′ 2 1 ⎞
- Page 167 and 168: dN 3 dt = N 2 τ 23 − (σ em. φ
- Page 169 and 170: Figure 5.12: The shapes of k(λ) an
- Page 171 and 172: 5.4 Discussion on the choice of inp
- Page 173 and 174: tting operations show the presence
- Page 175 and 176: (a) 270nm. (b) 300nm. tel-00916300,
- Page 177 and 178: (a) σ emis.max. = 8.78 x 10 −18
- Page 179 and 180: (a) 50(3/1.5) (b) 50(3/3) tel-00916
- Page 181 and 182: (a) Integrated population of excite
- Page 183 and 184: two kinds of emitters in SRSO subla
- Page 185 and 186: Conclusion and future perspectives
- Page 187 and 188: 4. Investigating the origin of phot
- Page 189 and 190: Bibliography [Abeles 83] B. Abeles
- Page 191 and 192: [Carlson 76] D. E. Carlson & C. R.
- Page 193 and 194: [Di 10] D. Di, I. Perez-Wur, G. Con
- Page 195 and 196: [Gritsenko 99] V. A. Gritsenko, K.
tel-00916300, version 1 - 10 Dec 2013<br />
noticed that the intensity obtained after 4.75h-FG + STA is higher than that of<br />
100(3.5/5) STA ML (Fig. 4.42). This suggests that the time spent un<strong>de</strong>r 500 °C in<br />
4.75h-FG process in 50(3.5/5) has a similar eect of the 4.75h excess time spent by<br />
100(3.5/5) in the <strong>de</strong>position chamber.<br />
Figure 4.42: Investigating the PL spectra<br />
obtained from 50(3.5/5) SRSO/SRSN ML after<br />
FG+STA. (The PL spectra obtained after<br />
STA (1min-1000°C N 2 ) from 50 and 100 patterned<br />
MLs are also given in dotted lines for<br />
comparison).<br />
One possible reason could be the exodiusion<br />
of hydrogen at such high temperature<br />
(500°C) resulting in <strong>Si</strong> dangling<br />
bonds that reorganize to act as nucleating<br />
sites in the SRSO sublayers. Hence,<br />
a STA (1min-1000°C in N 2 ) treatment<br />
that follows after this time and temperature<br />
of exposure is sucient to result in<br />
a high <strong>de</strong>nsity of <strong>Si</strong>-np. Thus, we may<br />
say that the emission intensity increases<br />
with increasing <strong>de</strong>nsity of nanoclusters<br />
resulting in emission enhancement of 50<br />
patterned sample.<br />
These results indicate that the time<br />
spent at high temperature (500°C-either<br />
in <strong>de</strong>position chamber or in post fabrication<br />
process) prior to STA has a huge<br />
inuence in favouring emission. The dierent peak positions of 100(3.5/5) STA ML<br />
and 50(3.5/5) 4.75h+STA ML, can be attributed to the dierent annealing processes<br />
employed on these two MLs. Thus, these studies <strong>de</strong>monstrate the possibility of enhancing<br />
the emission of a SRSO/SRSN ML by reducing the material (50 patterns<br />
vs. 100 patterns) subjecting to a pre-thermal treatment before STA.<br />
4.10 Un<strong>de</strong>rstanding the origin of photoluminescence<br />
A <strong>de</strong>tailed investigation on various annealing treatment on the PL spectra in the<br />
previous sections suggested various possible origins for emission. It was seen in<br />
section 4.6 that mostly all the PL spectra obtained from samples annealed un<strong>de</strong>r<br />
N 2 atmosphere had three peaks. From the peak positions in all the investigations<br />
above, we might attribute a range of positions for these peaks named as (1,2,3) in<br />
100(3.5/5) ML and (a,b,c) in 50(3.5/5) ML. They are,<br />
- Peak (1) (a) and (b) :1.2-1.45 eV<br />
- Peak (2) and(c): 1.50-1.7 eV<br />
128


