

Films minces à base de Si nanostructuré pour des cellules ...
Films minces à base de Si nanostructuré pour des cellules ...
Films minces à base de Si nanostructuré pour des cellules ...

Create successful ePaper yourself
Turn your PDF publications into a flip-book with our unique Google optimized e-Paper software.
tel-00916300, version 1 - 10 Dec 2013<br />
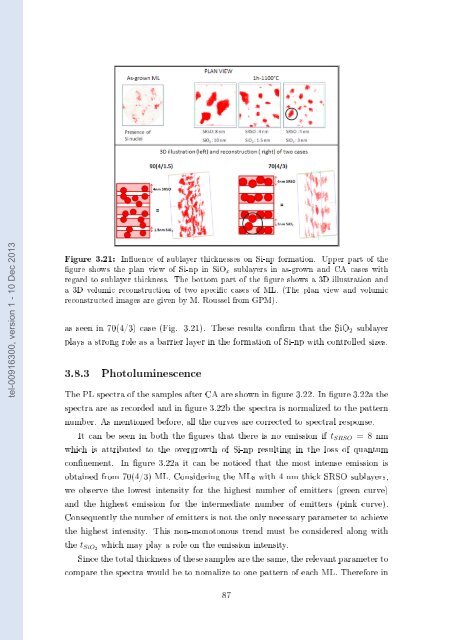
Figure 3.21: Inuence of sublayer thicknesses on <strong>Si</strong>-np formation. Upper part of the<br />
gure shows the plan view of <strong>Si</strong>-np in <strong>Si</strong>O x sublayers in as-grown and CA cases with<br />
regard to sublayer thickness. The bottom part of the gure shows a 3D illustration and<br />
a 3D volumic reconstruction of two specic cases of ML. (The plan view and volumic<br />
reconstructed images are given by M. Roussel from GPM).<br />
as seen in 70(4/3) case (Fig. 3.21). These results conrm that the <strong>Si</strong>O 2 sublayer<br />
plays a strong role as a barrier layer in the formation of <strong>Si</strong>-np with controlled sizes.<br />
3.8.3 Photoluminescence<br />
The PL spectra of the samples after CA are shown in gure 3.22. In gure 3.22a the<br />
spectra are as recor<strong>de</strong>d and in gure 3.22b the spectra is normalized to the pattern<br />
number. As mentioned before, all the curves are corrected to spectral response.<br />
It can be seen in both the gures that there is no emission if t SRSO = 8 nm<br />
which is attributed to the overgrowth of <strong>Si</strong>-np resulting in the loss of quantum<br />
connement. In gure 3.22a it can be noticed that the most intense emission is<br />
obtained from 70(4/3) ML. Consi<strong>de</strong>ring the MLs with 4 nm thick SRSO sublayers,<br />
we observe the lowest intensity for the highest number of emitters (green curve)<br />
and the highest emission for the intermediate number of emitters (pink curve).<br />
Consequently the number of emitters is not the only necessary parameter to achieve<br />
the highest intensity. This non-monotonous trend must be consi<strong>de</strong>red along with<br />
the t <strong>Si</strong>O2 which may play a role on the emission intensity.<br />
<strong>Si</strong>nce the total thickness of these samples are the same, the relevant parameter to<br />
compare the spectra would be to nomalize to one pattern of each ML. Therefore in<br />
87


