31295007615114.pdf
31295007615114.pdf
31295007615114.pdf

You also want an ePaper? Increase the reach of your titles
YUMPU automatically turns print PDFs into web optimized ePapers that Google loves.
PHOTOLUMINESCENCE STUDIES IN HYDROGENATED<br />
AMORPHOUS SILICON AND ITS ALLOYS<br />
by<br />
CHINTAMANI P. PALSULE, B.TECH., M.S.<br />
A DISSERTATION<br />
IN<br />
PHYSICS<br />
Submitted to the Graduate Faculty<br />
of Texas Tech University in<br />
Partial Fulfillment of<br />
the Requirements for<br />
the Degree of<br />
DOCTOR OF PHILOSOPHY<br />
Approved<br />
August, 1993
sol jy^ ~<br />
/ ^ ? 3 TABLE OF CONTENTS ^^^,<br />
AJO. 77<br />
LIST OF TABLES<br />
LIST OF FIGURES<br />
CHAPTER<br />
I. INTRODUCTION<br />
1.1 Photoluminescence in a-Si:H<br />
1.1.1 Localized States in a-Si:H<br />
1.1.2 ThermaUzation of Carriers in a-Si:H<br />
1.1.3 Relaxation Effects in a-Si:H<br />
1.1.4 Recombination in a-Si:H<br />
1.1.5 Recombination Kinetics in a-Si:H<br />
1.2 Scope of This Work<br />
II. EXPERIMENTAL DETAILS<br />
2.1 Film Deposition<br />
2.1.1 Glow Discharge Systems<br />
2.1.2 Reactive Sputtering<br />
2.2 Characterization Techniques<br />
2.2.1 Optical Absorption<br />
2.2.2 Constant Photocurrent Method/ Photothermal Deflection<br />
Spectroscopy<br />
2.2.3 Infrared Absorption<br />
2.3 PL Experimental Setup<br />
III. DATA ANALYSIS<br />
3.1 Calibration of the system<br />
3.2 Analysis of PL decays<br />
3.3 PL Decay Model<br />
IV. PHOTOLUMINESCENCE IN UNDOPED A-SLH<br />
4.1 CW PL in a-Si:H<br />
4.2 PL Decays in a-Si:H<br />
4.2.1 Bound Exciton Theory<br />
4.2.2 Emission energy dependence<br />
4.2.3 Temperature Dependence<br />
4.2.4 Excitation energy dependence<br />
4.2.5 Electric Field Dependence<br />
4.3 Discussion<br />
11
V. PHOTOLUMINESCENCE IN a-Sii_xCx:H<br />
5.1 Variation of parameters with carbon content<br />
5.2 CW PL in a-Sii_xC:,:H films<br />
5.3 PL decays in a-Sii-^CiiH films<br />
5.4 Discussion<br />
VI. PHOTOLUMINESCENCE IN a-SiN^iH<br />
6.1 Variation of parameters with nitrogen content<br />
6.2 CW PL in a-SiN:,:H films<br />
6.3 PL decays in a-SiN^iH films<br />
VII. ELECTRIC FIELD QUENCHING OF CW PL IN a-Si:H<br />
7.1 Results and Interpretation<br />
7.2 Discussion of Results<br />
Vin. CONCLUSIONS<br />
8.1 Recommendations for further research<br />
REFERENCES<br />
111
LIST OF TABLES<br />
2.1 Deposition parameters for undoped a-Si:H films<br />
2.2 Deposition parameters for a-SiN^iH films<br />
2.3 Deposition Parameters for a-Sii_xCx:H fUms<br />
2.4 Summary of experimental parameters<br />
4.1 Summary of characterization parameters for a-Si:H films<br />
5.1 Carbon Contents of the films<br />
5.2 Comparison of ao for different x at 1.46 eV<br />
6.1 Correlation between R and N,H content<br />
IV
LIST OF FIGURES<br />
1.1 Comparison of absorption and luminescence spectra of intrinsic a-Si:H '<br />
1.2 Schematic representation of Anderson's model <<br />
1.3 Schematic of localized and extended wavefunctions<br />
1.4 Schematic of density of states in a-Si:H K<br />
1.5 Comparison of thermalization rates of different mechanisms 1'<br />
1.6 Dependence of PL intensity on defect density 2(<br />
1.7 Integrated PL decay in a-Si:H and extracted lifetime distribution 2^<br />
2.1 Schematic of the experimental Setup for PL measurements 3J<br />
3.1 Typical Instrument Response 4(<br />
3.2 PL decay at 1.54 eV along with the fit using sum of exponentials and the<br />
corresponding weighted residuals<br />
5i<br />
3.3 Lifetime distribution corresponding to the fit 5^<br />
4.1 CW PL spectrum of a-Si:H at 25 K 6(<br />
4.2 Temperature Dependence of CW PL intensity 61<br />
4.3 PL decay fitted with our model 6^<br />
4.4 Lifetime distribution corresponding to fit using our model 6^<br />
4.5 Comparison of the deconvoluted decays at three different emission energies 7'<br />
4.6 Comparison of the lifetime distributions at different emission energies 1[<br />
A.l Comparison of the deconvoluted PL decays at different temperatures 1\<br />
4.8 Comparison of the temperature dependence of lifetimes 7(<br />
4.9 Temperature dependence of the relative contributions of the three lifetimes 7<br />
4.10 Comparison of the deconvoluted PL decays at different excitation energies 8<br />
5.1 Variation of bandgap with carbon content in the film 9
5.2 Change in Si-C stretching mode frequency with carbon content 96<br />
5.3 Integrated absorption of Si-C stretching mode versus carbon content 97<br />
5.4 Variation of Urbach energy and edge width parameter B with carbon<br />
content in the fUm 99<br />
5.5 Variation of (a) ESR spin density (b) g-value with carbon content 101<br />
5.6 Normalized CW PL spectra of a-Sii_xCr:H films for various values of x<br />
at 25 K 103<br />
5.7 Change in peak energy(EL) a-iiti the bandwidth(A£^L) of the CW spectra<br />
with carbon content in the fUm 105<br />
5.8 Bandwidth of the CW spectra versus Urbach energy of the samples<br />
5.9 Comparison of PL decays at 1.46 eV for various values of x at 25 K<br />
5.10 Comparison of deconvoluted PL decays at 1.46 eV<br />
5.11 Comparison of Ufetime distributions at 1.46 eV<br />
5.12 Variation in the relative contributions of the three lifetimes to the PL<br />
decay at 1.46 eV with carbon content at 25 K 113<br />
5.13 Comparison of deconvoluted PL decays at a thermalization depth of ~<br />
0.3 eV 116<br />
5.14 Comparison of lifetime distributions at same thermalization depth 117<br />
5.15 Comparison of lifetime distributions at different emission energies for<br />
sample C5 118<br />
6.1 Variation of optical gap with nitrogen content 130<br />
6.2 Change in Urbach energy and the edge width parameter with nitrogen<br />
content 131<br />
6.3 Defect density versus nitrogen content 133<br />
6.4 Comparison of CW PL spectra for films with different nitrogen content 13^<br />
6.5 Change in PL peak energy and PL bandwidth with nitrogen content 135<br />
6.6 Correlation between CW PL bandwidth and Urbach energy 13(<br />
VI
6.7 Comparison of decays for different nitrogen contents at 1.46 eV 13i<br />
6.8 Comparison of lifetime distributions for samples NFl, NF4 and NF5 14i<br />
7.1 Variation of PL and PC with temperature 14<br />
7.2 Comparison of un-normalized CW PL spectra with and without electric<br />
field at 100 K 14(<br />
7.3 Comparison of normalizedCW PL spectra with and without electric field<br />
at 100 K 14:<br />
7.4 --^ versus Electric Field<br />
7.5 PC versus Electric Field<br />
7.6 „ ^fn\ versus Electric Field<br />
7.7 ; ^ versus--^<br />
CHAPTER I<br />
INTRODUCTION<br />
Hydrogenated amorphous silicon (a-Si:H) and its alloys with carbon (a-Sii_xCx:H)<br />
and nitrogen (a-SiN^iH) have gained considerable importance due to their attractive<br />
optoelectronic appUcations [1, 2, 3, 4]. These include solar cells, liquid crystal displays,<br />
optical scanners and radiation imagers. Many other applications of these materials have<br />
also been suggested or are under development. This commercial interest has triggered a<br />
significant amount of basic research on these materials.<br />
Most of these applications depend on the abiUty to deposit a-Si:H over a large area.<br />
The required technology is considerably cheaper and less sophisticated than the one<br />
required for crystalline silicon (c-Si). In addition, the raw materials needed are<br />
significantly smaller in amounts. Along with these advantages over crystalline<br />
semiconductors, a-Si:H has several other attractive properties such as a continuously<br />
adjustable bandgap, a usable carrier lifetime and diffusion length, efficient optical<br />
transitions and capability of employing either p- or n-type dopants. These properties are<br />
at least comparable to c-Si. So the special attribute of depositing a-Si:H inexpensively<br />
over large areas with comparable electronic properties to c-Si makes it a clear substitute<br />
in large area device applications.<br />
Research into a-Si:H is directed towards an understanding of how the structural<br />
disorder leads to its unique properties. Much of the interest in a-Si:H comes from the<br />
realization that it can not be just regarded as a derivative of c-Si, in which structural<br />
disorder degrades the electronic properties. The disordered atomic structure and the<br />
presence of hydrogen in a-Si:H combine to give new phenomena which are strikingly
different from those in c-Si. Thus proper care needs to be taken in understanding the<br />
results of characterization experiments in this material. This chapter first gives an<br />
overview of the present understanding of photoluminescence (PL) in a-Si:H, identifies<br />
the unsolved problems in this field and finally defines the scope of this work aimed at<br />
solving some of those problems.<br />
1.1 Photoluminescence in a-Si:H<br />
Luminescence is a technique widely used for studying localized states within the<br />
bandgap of a senticonductor. The technique is therefore particularly applicable to<br />
amorphous semiconductors Uke a-Si:H, since much of the interest in these materials<br />
relates to the localized states introduced by the intrinsic disorder or by specific defects.<br />
In a-Si:H, these localized states determine most of the optical and electronic properties.<br />
So a study of these localized states is crucial from an application point of view. As a<br />
result, techniques such as photoluminescence which can yield information about these<br />
states are extremely important for understanding optoelectronic properties of a-Si:H.<br />
Luminescence spectra of a-Si:H were first reported by Engemann and Fischer [5] in<br />
1973. Since then several other groups have reported luminescence measurements [6, 7] in<br />
a-Si:H and established the main features of the luminescence spectrum. There is a<br />
universal agreement that in samples with a high quantum efficiency, there is a single<br />
broad luminescence band. The peak energy at low temperature (
It is generally accepted that transitions between conduction and valence bandtail states<br />
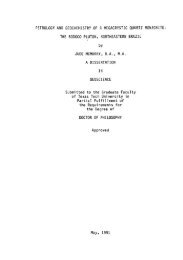
give rise to this band, with two main reasons for this assignment. First, the energy is in<br />
the correct range for the bandtails, as the spectrum lies at the foot of the exponential<br />
absorption spectrum (Fig. 1.1 [6]). Second, the luminescence intensity is highest when<br />
the defect density is lowest, so that the luminescence cannot be a transition to a defect.<br />
The second most well-characterized transition is seen at 0.8-0.9 eV. The PL intensity of<br />
this peak is not very high and it is at the most 1% of the maximum efficiency of the main<br />
peak. This peak is assigned to a transition between the bandtail states and dangling<br />
bond defect states in the midgap and correlates well with the defect density. The present<br />
work deals with the recombination processes which give rise to the 1.25-1.4 eV peak.<br />
The luminescence process can generally be considered as three distinct events in<br />
sequence. First, an electron-hole pair is excited, usually by the absorption of a photon.<br />
Second, the electron and hole relax down in energy by emitting a series of phonons, and<br />
usually end up in band edge localized states. This process is referred to as<br />
thermalization. Finally, there is recombination either by luminescence or by some<br />
non-radiative mechanism. In the foUowing, a brief review of the current understanding<br />
of localized states and various relaxation and recombination processes in a-Si:H is<br />
presented.<br />
1.1.1 Localized States in a-Si:H<br />
The three principal features of the structure of a-Si:H are the short-range order of<br />
the ideal network, the long-range disorder and the coordination defects. The short-range<br />
order refers to the local bonding configuration and the coordination number (number of
11<br />
(*)<br />
Photoluminescence<br />
10^<br />
J3<br />
rz<br />
.$^10-1<br />
c<br />
o<br />
10- .5<br />
o<br />
o<br />
VI<br />
10 g<br />
I 1(^3<br />
Absorption<br />
1.0 1.2 1.4 1.6<br />
Photon energy (eV)<br />
1.8<br />
Figure 1.1: Comparison of absorption and luminescence spectra of intrinsic<br />
-Si:H [6]
nearest neighbors). The first few nearest neighbor distances in a-Si:H are separately<br />
distinguished and are the same as in crystalUne silicon, but the correlation between<br />
atom pairs decreases after a few interatomic spacings. The chemical bonding between<br />
the atoms occurs by sp^ hybridization and leads to a tetrahedral configuration as in c-Si.<br />
Thorpe and Weaire [8] have shown that energy bands are most strongly influenced by<br />
the short-range order and lead to a bandgap separating the conduction and valence<br />
bands, irrespective of the long-range structure.<br />
The loss of long-range order results in deviations in bond lengths and bond angles<br />
from the ideal network. As a result, the periodicity of the potential, which is central to<br />
the band theory of crystalUne semiconductors, is lost. An attempt at quantitatively<br />
describing this disorder was done by Anderson [9]. His theory of localization uses the<br />
model illustrated in Fig. 1.2. The crystal is described by an array of identical potential<br />
weUs and the corresponding band of electronic states is broadened to a band width B by<br />
the interaction between atoms. The disordered state is represented by the same array of<br />
sites to which a random potential with an average ampUtude VQ is added. Anderson [9]<br />
showed that when ^ exceeds a critical value (~ 3), there is zero probability for an<br />
electron at any particular site to diffuse away, which is called as "complete localization."<br />
When the disorder potential VQ is small, the original periodic extended Bloch<br />
wavefunction in the crystal is only sUghtly perturbed and has the effect of scattering the<br />
electron from one Bloch state to another. However, when the disorder potential is strong<br />
enough, it causes such frequent scattering that the wavefunction loses phase coherence<br />
over a distance of one or two atomic spacings. Figure 1.3 shows a schematic of the
(a)<br />
-*-ao-^<br />
Crystalline<br />
00<br />
c<br />
Hi<br />
'JK<br />
k.<br />
C<br />
UJ<br />
ib)<br />
Disorder<br />
potential<br />
Amorphous<br />
Figure 1.2: Schematic representation of Anderson model
I<br />
I<br />
Envelope<br />
Crystal<br />
extended state<br />
rs<br />
Amorphous<br />
extended state<br />
><br />
Envelope<br />
\<br />
Amorphous<br />
localized state<br />
\ ^<br />
Position<br />
Figure 1.3: Schematic of localized and extended wavefunctions
8<br />
wavefunction of extended and localized electron states in crystalline and amorphous<br />
semiconductors and shows the rapid change of phase induced by the disorder.<br />
The strong scattering causes a large uncertainty in the electron momentum k,<br />
through the uncertainty principle,<br />
Ak = l/Ax fa l/aoTn k, (1.1)<br />
where Ax is the scattering length and a© is the interatomic spacing. The uncertainty in<br />
k is similar to the magnitude of k, so momentum is not a good quantum number and is<br />
not conserved in electronic transitions. The loss of k-conservation puts a greater<br />
emphasis on the spatial location of the carrier than its momentum. As a result, the<br />
energy bands are no longer described by the energy-momentum dispersion relations, but<br />
instead by a density of states distribution. In optical transitions, the rules of<br />
conservation of momentum selection do not apply.<br />
The typical band widths in a-Si:H are of the order of 5 eV, so according to<br />
Anderson localization criterion a very large disorder is needed to localize all the<br />
electronic states. Since the short-range order prevents this, Anderson criterion cannot be<br />
fully met in a-Si:H. Mott and Davis [10] have proposed a standard model for amorphous<br />
semiconductors, which suggests that even when the disorder of an amorphous<br />
semiconductor is insufficient to meet the Anderson criterion, some of the states are<br />
localized and these lie at the band edges. So the center of the band is comprised of<br />
extended states at which there is strong scattering and states at the extreme edges of<br />
the bands, caUed "bandtail states," which are locaUzed.
In addition to this, there are coordination defects in which an atom has too many<br />
or too few bonds as compared to the normal coordination. The abiUty of the disordered<br />
network to adapt to different atomic coordination aUows an isolated coordination defect.<br />
In a-Si:H, an under coordinated atom or a dangling bond is the most common<br />
coordination defect. The non-bonding electrons in dangling bonds give rise to midgap<br />
defect states. So the overall density of states in a-Si:H can be represented schematicaUy<br />
as in Fig. 1.4.<br />
1.1.2 ThermaUzation of Carriers in a-Si:H<br />
Due to the characteristic shape of the density of states and different nature of<br />
states in a-Si:H, different thermalization mechanisms apply in different energy and<br />
temperature ranges. Photogenerated carriers in extended states lose energy by the<br />
emission of single phonons as they scatter from one state to another. The rate of loss of<br />
energy in extended states is shown to be [10]<br />
— r^hUo\ (1.2)<br />
where LJQ is of the order of a phonon frequency. Thus, the maximum thermaUzation rate<br />
corresponds to loss of one phonon energy in the time of a phonon vibration. Since the<br />
phonon frequency is of the order of ^ 10^^-10^^ s~^, the thermalization of carriers above<br />
the bandgap (in extended states) is extremely fast. The only experimental technique<br />
with this time resolution is photo-induced absorption using the pump and probe method<br />
[11]. These experiments indicate that the thermalization in the extended states is faster<br />
than 1 ps and proceeds at rates close to 0.5-1.0 eV ps~^ [11, 12].
Figure 1.4: Schematic of density of states in a-Si:H<br />
10 0
11<br />
ThermaUzation in the bandtails at low temperatures occurs by tunneling between<br />
locaUzed states. The low temperature only permits transitions to states of lower energy.<br />
The transition probability to a neighboring site is proportional to the overlap of the two<br />
states. The average distance to the nearest available localized state is approximately the<br />
mean separation of the states, No~^'^, where No is the total density of states which lie<br />
deeper into the bandtail. Assuming an exponentially decreasing density of bandtail<br />
states, given by N{E) = Noexp{-E/kTo),<br />
where kTo=Et is the inverse slope of the<br />
bandtail, Monroe [13] has shown that the rate of energy loss due to tunneling is given by<br />
where RQ is the localization radius. The thermalization rate of carriers assuming two<br />
bandtail widths, corresponding to the conduction and valence bands of a-Si:H is shown<br />
in Fig. 1.5 [13]. This rate decreases very rapidly as the carriers thermaUze deeper<br />
because the density of states decreases rapidly with energy. For practical purposes<br />
thermalization stops at an energy of ~ 5kTo below the mobility edge.<br />
At higher temperatures, the transitions between locaUzed states occur by the<br />
multiple trapping mechanism [14], in which the carriers are excited to the mobility edge<br />
and recaptured by a different tail state. The thermalization rate in this case is<br />
temperature dependent and given by<br />
dE<br />
dt<br />
= u;okTexp{-E/kT). (1.4)<br />
The comparison of this rate with tunneUng thermaUzation is also shown in Fig. 1.5. The<br />
multiple trapping rate is independent of the band-tail slope, unUke tunneUng
12<br />
10'-<br />
'v, 10 10<br />
><br />
Thermalization<br />
Tunneling<br />
Multiple trapping<br />
oooooo Free carrier<br />
oocccoooccoooocco<br />
is IC<br />
«<br />
T3<br />
I 106<br />
15<br />
.^ 10*<br />
.'7=300<br />
r = 50K<br />
10^<br />
-0.2 -O.l<br />
Energy (eV)<br />
0 Ol 02<br />
Figure 1.5: Comparison of thermalization rates of different mechanisms [13]
13<br />
thermalization. Multiple trapping dominates above 200 K for holes and 50 K for<br />
electrons.<br />
1.1.3 Relaxation Effects in a-Si:H<br />
The origin of the luminescence bandwidth is controversial. Two broadening<br />
mechanisms have been proposed [15, 16] to explain the width of the PL band. The first<br />
one is based on phonon broadening associated with the Stokes shift. The identification<br />
of a Stokes shift is based on a comparison of the absorption and luminescence line<br />
shapes. Any emission process has an inverse absorption process and the two are related<br />
by a detailed balance relation given by<br />
where N is the total density of states, u is the frequency, n the refractive index, gi and<br />
g2 are the degeneracies of the ground and excited states, A the wavelength and r~^ is<br />
the transition probability of emission. If T)L is the luminescence quantum efficiency and<br />
G is the excitation intensity, then by definition, TJLG is the luminescence intensity. If<br />
Nocc is the density of states which are occupied by electron-hole pairs, then since<br />
Nocc < N, from Eq. (1.5) it follows that<br />
VLG = < (-r^)— / otdU' (1.6)<br />
This equation relates the absorption coefficient to measurable quantities. A saturation<br />
experiment is carried out, in which the excitation intensity G is increased till all the<br />
available states are filled, giving saturation of luminescence. Under saturation<br />
conditions, the absorption coefficient calculated from Eq. (1.6) at the peak luminescence
14<br />
energy turns out to be 10^ cm~^ [15]. The actual absorption coefficient at the peak<br />
luminescence energy, measured from the luminescence excitation spectrum is only 0.1-1<br />
cm~^, seemingly in conflict with the detailed balance relation. This discrepancy is<br />
removed by a Stokes shift, because then the corresponding absorption transition is at a<br />
higher energy where the absorption coefficient is larger. The Stokes shift in a-Si:H is<br />
estimated to be about 0.4 eV [15]. The main argument against the presence of Stokes<br />
shift questions the validity of using detailed balance between material close to<br />
equilibrium (in an absorption experiment) and under extremely intense optical<br />
excitation (the saturation experiment). Other experimental findings such as the<br />
temperature dependence of the PL bandwidth and the differences in Stokes shifts<br />
exhibited by systems with similar absorption edges, such as chalcogenide glasses and<br />
a-Si:H, are hard to explain using a Stokes shift model.<br />
The opposite point of view is that the line shape and the peak energy are<br />
determined by the bandtail shapes and the convolution of the one-electron density of<br />
states, without significant relaxation effects. The luminescence peak energy (E/,) in this<br />
case is given by the energy separation of electrons and holes after thermalization and<br />
can be expressed as<br />
EL = Ec - Ey - Etc - Eth^ (1.7)<br />
where Ete and Eth are the energies to which electrons and holes have thermaUzed from<br />
the mobiUty edges. From Fig. 1.5, E^e and Eth can be estimated to be ~ 0.1 eV and
~0.25 eV, respectively, so that a bandgap of 1.65-1.75 eV can account for the PL peak<br />
energy of 1.3-1.4 eV. The PL spectrum in this case is described by [17]<br />
15<br />
A{EL) = const.fiEi) J Ny{E)Nc{E + EL)dE, (1.8)<br />
where f(EL) is a function describing the effects of thermalization on the shape of the<br />
spectrum. A difficulty with this interpretation is that the low energy side of the<br />
luminescence has a broader tail, which is hard to explain in the absence of phonon<br />
coupling.<br />
It is quite possible that both disorder broadening and phonon broadening are<br />
present in a-Si:H. Assuming a gaussian line profile, the total linewidth, AEL., is<br />
AEL^ = AE'^disorder + AE^ Stok.s- (1-9)<br />
The relative contributions of disorder and phonon broadening in the luminescence<br />
spectrum of a-Si:H remain to be resolved. The disorder broadening evidently dominates<br />
in alloy materials like a-SiNx:H and a-Sii_xCx:H, in which the band tails are much<br />
broader [18], but the possibility of phonon broadening cannot be completely ruled out.<br />
1.1.4 Recombination in a-Si:H<br />
In a-Si:H there are several possible recombination mechanisms, both radiative and<br />
non-radiative, and the dominant mechanisms depend both on material properties (such<br />
as, defect density) and on the experimental conditions(e.g., excitation intensity,<br />
temperature, etc.). A review of recombination mechanisms that have been identified, and<br />
the experimental condition under which each one prevails, is presented in the following.
16<br />
1.1.4.1 Radiative TunneUng<br />
Since after thermalization, most of the electron-hole pairs are in localized states,<br />
the majority of recombination in a-Si:H takes place by radiative tunneling between two<br />
localized states [19]. This recombination could be geminate or non-geminate. A<br />
geminate pair is an electron and a hole created by the same photon. Initially, the<br />
wavefunctions of these two carriers overlap. After the absorption process, the electron<br />
and hole thermaUze to the band edges as described in the previous section and diffuse<br />
apart. During the diffusion, they are bound by their mutual Coulomb attraction. When<br />
the potential is strong enough, the particles diffuse together, giving geminate<br />
recombination. Otherwise, the electron and hole diffuse apart and any subsequent<br />
recombination is non-geminate or between distant pairs [20]. Therefore, non-geminate<br />
recombination is between carriers created by different absorption events. The Onsager<br />
[21] model provides an estimate of the criterion for geminate recombination given by<br />
e2<br />
4ir€€oLT<br />
>kT, (1.10)<br />
where Lj is the separation between the carriers after thermalization. The binding<br />
potential of electron and hole does not increase indefinitely as the electron and hole<br />
diffuse together, but instead an exciton of binding energy Ex is formed. The exciton can<br />
either dissociate thermaUy with a rate uoexp{-Ex/kT),<br />
or else can recombine with rate<br />
i/crn' So an additional condition for geminate recombination is that<br />
Ex >kTIn{uJo/i^.m), (1.11)
17<br />
and both inequalities, Eq. (1.10) and Eq. (1.11), must be satisfied for geminate<br />
recombination to occur.<br />
In a-Si:H, it has been found that at low temperatures and low excitation intensities<br />
the recombination is geminate--while at higher excitation intensities, it is non-geminate.<br />
Since the photo-generated electron-hole pair density is proportional to the excitation<br />
intensity, at higher excitation intensities the pairs can overlap if the average separation<br />
is smaller than the thermalization length (L^). Such an overiap leads to recombination<br />
between uncorrelated electron-hole pairs, which is non-geminate recombination. In<br />
a-Si:H, it has been suggested [19] that the transition from geminate to non-geminate<br />
recombination takes place at pair densities > 10^* /cm^, but this is another controversial<br />
issue about recombination in a-Si:H. Arguments for and against geminate recombination<br />
have been presented and although there is no clear evidence for one or the other, the<br />
view that geminate recombination dominates in a-Si:H is prevalent.<br />
Another possible radiative recombination channel is through defects, which is<br />
mainly observed in samples with high defect density and at high temperature, with PL<br />
peak energy in the range of 0.8-0.9 eV. Since the efficiency of this peak is larger for<br />
samples with larger defect density and the thermal quenching is weaker than the main<br />
peak, it is associated with dangUng bonds in a-Si:H, which form deeper states in the<br />
bandgap. Further evidence for the association with defects is that the thermal<br />
quenching of the dangUng bond Ught induced electron spin resonance (LESR) signal is<br />
identical to that of this luminescence band [22]. In highly doped n-type or p-type a-Si:H,<br />
this defect recombination is enhanced, while the main luminescence band is quenched.
18<br />
Since doping introduces additional dangling bonds, this supports the assignment of this<br />
transition as bandtail to defect. Even though there is agreement about the general<br />
origin of this transition, there is still considerable debate over the actual microscopic<br />
nature of this recombination process.<br />
There are four types of non-radiative mechanisms that account for non-radiative<br />
recombination in a-Si:H. These are thermal quenching, tunneling to defects. Auger<br />
recombination and surface recombination. In all these cases, depending on the amount<br />
of energy released, there is emission of a corresponding number of phonons. The<br />
probability of the simultaneous emission of "n" phonons is[23]<br />
PMPE = a;oexp(-7n) = a;oexp(-7(Ai;)/^o), (1-12)<br />
where 7 is a constant in the range of 1-2, depending on the strength of the<br />
electron-phonon interactions and AE is the energy released. This rate decreases rapidly<br />
as the released energy increases.<br />
1.1.4.2 Thermal Quenching<br />
The quantum efficiency of the main luminescence band in a-Si:H decreases with<br />
increasing temperature. The main reason for this decrease is thermal quenching. The<br />
increased mobiUty of the carriers is the primary cause for thermal quenching. With an<br />
increase in temperature, the carriers become more mobile and can find non-radiative<br />
centers more easily. Since electrical conduction in a-Si:H is observed above 100 K,<br />
thermal quenching starts dominating at around this temperature. The conventional<br />
theory of thermal quenching by excitation of a carrier out of a shallow trap predicts a
thermally activated process. No single activation energy is observed in a-Si:H, but it is<br />
found that the luminescence efficiency, TJL, foUows the relation [24]<br />
19<br />
(-^-1) =77oexp(-r/TL). (1.13)<br />
The value of TL which fits the experimental data is typically in the range of 20-25 K.<br />
1.1.4.3 Non-radiative TunneUng to Defects<br />
The second important channel for non-radiative recombination observed in samples<br />
with high defect density at low temperatures is tunneUng to defects. Figure 1.6 [25]<br />
shows the dependence of the bandtail luminescence intensity on the defect density<br />
measured by electron spin resonance (ESR) in undoped a-Si:H. The luminescence<br />
intensity drops rapidly when the defect density is above 10^^/cm^, becoming<br />
unobservable at defect densities above 10^^/cm^ [25]. These data establish that the<br />
defects provide an alternative recombination path competing with radiative bandtail<br />
transitions. With an increase in defect density, the average separation between the<br />
defects decreases. If this separation becomes smaller than the average separation<br />
between the photogenerated carriers, then the carriers can tunnel to defects and<br />
eventually recombine non-radiatively.<br />
1.1.4.4 Auger Recombination<br />
Auger recombination occurs when the recombination of an electron-hole pair<br />
excites a third electron or hole up into the band, where it can subsequently thermaUze<br />
to the band edge. The need for a third particle means that Auger recombination is only<br />
important at high excitation intensities. As a result. Auger effects have to be associated
20<br />
1 -<br />
/?c = 100 A<br />
V)<br />
C<br />
10-'<br />
u<br />
c<br />
u<br />
Vi<br />
c<br />
I<br />
Amorphous silicon<br />
10 K<br />
10 16 10 17 10 18<br />
-3)<br />
ESR spin density (cm"-*)<br />
Figure 1.6: Dependence of PL intensity on defect density [25]
21<br />
with non-geminate recombination. In a-Si:H, evidence for an Auger process has been<br />
reported for high excitation intensities below 50 K, but the effect is much weaker than<br />
expected [26].<br />
1.1.4.5 Surface Recombination<br />
Surface recombination occurs when there is a high density of recombination centers<br />
at the surface to provide a non-radiative recombination path. This is a weak effect in<br />
a-Si:H because the diffusion lengths and the carrier mobilities are low as compared to<br />
crystalline materials and, as a result, this effect is confined to the carriers created very<br />
close to the surface. So when the excitation Ught has a very short absorption length, this<br />
effect can affect the luminescence intensity. In a-Si:H, Dunstan [27] has reported that<br />
even when there is significant defect density at the surface, the luminescence intensity<br />
decreases by only 10-20%.<br />
1.1.5 Recombination Kinetics in a-Si:H<br />
One of the characteristic features of PL in a-Si:H is that the PL decay extends over<br />
a very wide time range (10~^ - 10~^s) [19]. This suggests that the lifetimes of the carriers<br />
are correspondingly widely distributed. This wide distribution of lifetimes indicates that<br />
the carriers are in localized rather than extended states and supports the CW<br />
luminescence data. The radiative recombination rate, Ugmy for a transition between an<br />
initial and final state emitting a photon of energy, hoj, is given by the Fermi golden rule,<br />
i^em = {27r/n)\M''\6{E, -Ef-\- hu), (1.14)
22<br />
where M is the matrix element of the transition and the ^-function expresses the<br />
conservation of energy. Since in a-Si:H, momentum is not a good quantum number, the<br />
requirement of k-conservation is relaxed and matrix elements reduce to an average over<br />
all pairs separated by the energy hu) provided the spin conservation rule is obeyed. For<br />
transitions between two locaUzed states, the matrix element is<br />
M = MoJ(^e,^/.), (1.15)<br />
where J is the overlap integral of the electron and hole wavefunctions. Thus,<br />
l^em = 1^0 J^, (1-16)<br />
where I/Q is the transition rate for completely overlapping wavefunctions. A<br />
dipole-allowed transition has a matrix element M proportional to e^r'^/hX^, where erj is<br />
the dipole moment, from which the recombination rate, UQ, is approximately 10^ s~^.<br />
The electron wavefunction envelope for r>> Re is approximately exp(—r/i2e), where r<br />
is the distance from the locaUzed state and Re is the localization radius. For a transition<br />
between localized electrons and holes that are spatially separated by a distance R which<br />
is larger than the locaUzation radii Re and R/i, the overlap integral [28] is given by<br />
J = fexp{-r/Re)exp{-{R-r)/Rh)d^r<br />
~ exp{-R/Re). (1.17)<br />
The approximation follows because the largest contribution to the integral is at one or<br />
the other site and appUes when Re > R/i- So the radiative recombination rate is given by<br />
Uem=i^oexp(-2R/Re). (1.18)
23<br />
A transition between states for which R>Re has a low probabiUty and consequently a<br />
long radiative Ufetime. Such a radiative recombination between carriers by tunneUng<br />
between two localized states is known as radiative tunneling (RT) and is believed to be<br />
the most dominating recombination mechanism in a-Si:H[19].<br />
t<br />
The tunneling recombination does not necessarily have to be radiative. The same<br />
expression with a different value of I/Q applies to non-radiative tunneling. For a<br />
non-radiative transition the prefactor v^ is assumed to be 10^^-10^^s~\ corresponding to<br />
a phonon frequency. In the case of non-radiative tunneling, the separation R in<br />
Eq. (1.18) refers to the separation between a carrier and a defect.<br />
From Eq. (1.18), it is easy to see that a substantial distribution in the separation R<br />
for tunneling processes leads to a very broad distribution in the recombination rates,<br />
which leads to a PL decay which spans 6 decades (10~®-10~^s) in time. Figure 1.7 [19]<br />
shows decay data for a-Si:H along with the Ufetime distributions extracted from those<br />
decays. The distribution has a peak near 10~^-10~^s and a width of 3-4 decades. A<br />
Gaussian distribution of separations between thermaUzed electrons and holes is given by<br />
[19]<br />
G{K) = (4i2V\/^^5^)exp[-(/2/i2,)2], (1.19)<br />
where R^ is the separation at the maximum of the distribution that fits the experimental<br />
Ufetime distribution if the radiative tunneUng model is used for recombination. The fit<br />
yields an electron-hole separation of ~50 A at the peak of the lifetime distribution [19].<br />
For non-radiative tunneUng a critical transfer radius Re is defined such that if the<br />
defect is closer to the electron (it is assumed that the electron is the particle which
24<br />
10*<br />
.^10*<br />
C<br />
It<br />
Temperature<br />
12 K<br />
V<br />
c<br />
'i<br />
^10<br />
1<br />
10-'<br />
.2^<br />
E ^<br />
12<br />
10"* 10-^ 10"* 10"' 10"<br />
Time (s)<br />
10-^ I0--<br />
Figure 1.7: Integrated PL decay in a-Si:H and extracted Ufetime distribution[19]
25<br />
tunnels to the defect) than Re, then non-radiative tunneling is more probable than the<br />
radiative tunneling. On the other hand, the radiative transition dominates when the<br />
defect is farther away than Re. The luminescence efficiency is given by the fraction of<br />
electron-hole pairs which are created farther than Re from the nearest defect. The<br />
distribution of separations in this case is given by the nearest neighbor distribution<br />
function F(R) for randomly dispersed defects, which is given by [29]<br />
F{R) = AirR^NexpC'^''^' ^), (1.20)<br />
where N is the total density of defects. The luminescence eflficiency, TJL-, is therefore [25]<br />
VL= F{R)dR = exv{ ^ 7 ). (1.21)<br />
JRC 3<br />
This gives a good fit [25] to the experimental data for values of Re of 100-120A and the<br />
corresponding fit is shown in Fig. 1.6. Even though this explanation assumes a single<br />
value of the critical transfer radius Re, which is a poor approximation for a distribution<br />
of lifetimes, it does reproduce the experimentally observed trends and supports the<br />
theory of tunneling of carriers to defects for high defect densities.<br />
Although there is a consensus about radiative tunneling being the general<br />
mechanism involved in luminescence, there is a considerable controversy about the tail<br />
of the lifetime distribution in the nanosecond range. The recombination processes in this<br />
range, which correspond to fastest radiative processes in a-Si:H, have not been resolved<br />
experimentally. The two main reasons for this are that the recombination processes that<br />
dominate in this time scale are very weak compared to radiative tunneUng processes and
26<br />
the temporal resolution needed to resolve them needs to be very good. In the following,<br />
a review of three major investigations dealing with fast PL decays in a-Si:H is presented.<br />
Wilson et al. [30] have measured the PL decay of integrated emission spectrum<br />
with a time resolution of 250 ps. They have reported a decay time of 8±2 ns by fitting<br />
the decay over the first 5 ns by a single exponential. It has been also reported that this<br />
decay time is independent of the defect density of the films, indicating the<br />
recombination process to be intrinsic to a-Si:H. They have proposed that a localized<br />
exciton recombination could be the origin of the PL decay.<br />
Stearns [31] has measured PL decays at different emission energies with a temporal<br />
resolution of 500 ps and fitted the decays with a function given by<br />
m = a, + - ^ (1.22)<br />
[t + To)<br />
where ai, a2 and TQ are fitting parameters. The quantity airo/a2 has a physical<br />
significance as the fractional contribution of slower decay components in the decay rate<br />
distribution to the fast PL decay. The quantity TQ represents how fast the decay rate<br />
distribution attenuates at large decay rates, and thus characterizes the strength of the<br />
fast decay components. It has been reported that with an increase in emission energy,<br />
the nanosecond decay becomes faster and the contribution of slower lifetimes to the fast<br />
PL decay decreases. At a fixed emission energy, with an increase in temperature, TQ<br />
decreases and the contribution of slower Ufetimes to the PL decay also decreases. At a<br />
fixed emission energy and temperature, TQ increases with an increase in excitation<br />
energy and airo/a2 increases. Two mechanisms have been suggested to explain these<br />
results: (1) There is a small population of excitons that have either radiative or
27<br />
non-radiative lifetime on the order of ~10 ns. (2) The electron and hole wavefunctions<br />
separate on the nanosecond time scale with the separation resulting from either an<br />
actual diffusion apart of the electron-hole pairs or an increasing locaUzation of the<br />
wavefunctions as the electrons and holes thermaUze into lower energy states.<br />
Orlowski and Scher [32] have performed decay measurements with PL integrated in<br />
the energy range (2.1-1.5 eV) with a time resolution of 50 ps. They have reported that<br />
the PL decay data at 20 K are best fitted by a power law, t"", for 50 ps < t < 3 ns,<br />
with a = 0.6. The parameter a is temperature dependent and increases with<br />
temperature. They have attributed the power-law nature of the PL decay to<br />
non-radiative relaxation processes which bring electrons to lower energy states within<br />
the bandtail manifold and proposed a model which correlates the relaxation with<br />
radiative decay and temperature dependent local diffusion.<br />
As can be seen from the preceding review, there is no consensus about the early PL<br />
decay in a-Si:H. Even though all the previous investigations have a qualitative agreement<br />
about the variation of the PL decays with various parameters, their interpretations are<br />
quite different from each other. The fastest radiative processes in a-Si:H still remain to<br />
be resolved. This work aims at studying the early recombination kinetics and the nature<br />
of electron-hole pair states involved in recombination in a-Si:H and its alloys.<br />
1.2 Scope of This Work<br />
The main objective of this work is to study nanosecond (0.1-50.0 ns) PL decays in<br />
intrinsic a-Si:H. By measuring the PL decay as a function of various parameters Uke
28<br />
temperature, excitation energy, excitation intensity and appUed electric field at different<br />
emission energies, various aspects of the recombination kinetics have been investigated.<br />
In addition, the changes in the PL decays after aUoying a-Si:H with carbon and nitrogen<br />
have been studied. The CW spectra of these alloys have also been analyzed in an<br />
attempt to resolve the controversy of phonon and disorder broadening. Finally, the<br />
changes in CW spectra and photoconductivity of undoped a-Si:H with an electric field<br />
have been investigated to shed some Ught on the issue of geminate/non-geminate<br />
recombination.<br />
For the convenience of presentation of the results, this work has been divided into<br />
the following three major parts.<br />
1. Recombination kinetics in intrinsic a-Si:H--In this part, the PL decays in intrinsic<br />
a-Si:H films with good quantum efficiencies deposited by glow discharge and sputtering<br />
techniques have been recorded as a function of various experimental parameters. A<br />
model decay function has been developed to quantitatively analyze the PL decays and<br />
the results are interpreted in terms of specific physical processes.<br />
2. Effect of alloying on PL decays in a-Si:H- -In this section, CW luminescence and PL<br />
decays in films with varying carbon content (a-Sii_xCx:H) and varying nitrogen content<br />
(a-SiNx:H) have been studied as a function of composition. An attempt to address the<br />
issue of phonon or disorder broadening is made from results of CW spectra. The model<br />
decay function developed for a-Si:H has been used to fit the PL decays in these alloys<br />
and the results have been interpreted with similar processes as in a-Si:H.
29<br />
3. Electric Field Quenching of CW PL in intrinsic a-Si:H--In this part, a simultaneous<br />
measurement of photoconductivity and PL has been carried out to address the issue of<br />
geminate/non-geminate recombination. An empirical model is proposed to explain the<br />
electric field quenching of CW PL in a-Si:H.
CHAPTER n<br />
EXPERIMENTAL DETAILS<br />
2.1 Fihn Deposition<br />
The undoped a-Si:H films used for PL decay measurements were prepared using<br />
either a glow discharge or reactive sputtering technique at the University of<br />
Kaiserslautern. The a-Sii_xCx:H films studied in this work were deposited using<br />
simultaneous sputtering or co-sputtering of siUcon and carbon in a hydrogen gas<br />
atmosphere at the University of Kaiserslautern. The a-SiNx:H films were prepared using<br />
glow discharge decomposition of silane and NF3 at the University of Arkansas. A brief<br />
description of the glow discharge and sputtering systems along with the deposition<br />
parameters used for depositing fUms used in this work is given in the following.<br />
2.1.1 Glow Discharge Systems<br />
This is the most common technique for depositing a-Si:H films. Typically a glow<br />
discharge reactor uses a diode configuration in which the plasma is confined between two<br />
parallel electrodes. The reactor consists of a gas inlet arrangement, the deposition<br />
chamber which holds the substrate, a pumping system, and the source for the discharge.<br />
There are many variables in the deposition process which must be controlled to give a<br />
good material. The gas pressure (SiH4, H2) determines the mean free path for collisions<br />
of the gas molecules and influences whether the reactions are at the growing surface or<br />
in the gas. The gas flow rate determines the residence time of the gas species in the<br />
reactor. The RF power controls the rate of dissociation of the gas and therefore also the<br />
film growth rate, and the temperature of the substrate controls the chemical reactions<br />
30
31<br />
on the growing surface. Table 2.1 gives a summary of the deposition parameters used for<br />
preparing the undoped a-Si:H films used in this work. Other details of this deposition<br />
system can be found elsewhere [33].<br />
In order to deposit a-SiNx:H films with varying nitrogen concentrations, a glow<br />
discharge decomposition of NF3 and SiH4 was used. The ratio R = [stJJ^lrFa] °^ ^^^<br />
flow rates was varied from 0.0 to 0.15, while keeping the total gas flow constant.<br />
Table 2.2 gives some of the operating conditions used for depositing these films. Other<br />
details about this deposition system are given elsewhere [34].<br />
2.1.2 Reactive Sputtering<br />
In reactive sputtering, a silicon target is sputtered, usually with argon ions in a<br />
hydrogen atmosphere to deposit a-Si:H films. The sputtered silicon reacts with atomic<br />
hydrogen in the plasma, forming SiHx radicals from which deposition takes place on a<br />
heated substrate. The main advantage of the sputtering technique in comparison to<br />
glow discharge is that the content of all the constituents can be easily and independently<br />
controlled. A good description of the magnetron sputtering system at the University of<br />
Kaiserslautern can be found elsewhere [35]. The a-Sii_xCx:H films were prepared using<br />
co-sputtering of separated silicon and carbon targets in a hydrogen atmosphere. The<br />
relative content of carbon with respect to silicon was changed by changing the ratio of<br />
the power supplied to the two magnetron sources. The main deposition parameters for<br />
the films discussed in this work are given in Table 2.3.
32<br />
Table 2.1: Deposition parameters for undoped a-Si:H films<br />
Parameter<br />
Base Pressure<br />
Chamber Pressure<br />
RF Power<br />
Electrode Area<br />
Silane Flow Rate<br />
Substrate Temperature<br />
Growth Rate<br />
Film Thickness<br />
Value<br />
1x10-"^ Torr<br />
100 mTorr<br />
low<br />
160 cm^<br />
15.0 seem<br />
240-250 °C<br />
2.9 A/s<br />
1.8-2.1 /im<br />
Table 2.2: Deposition parameters for a-SiNx:H films<br />
Parameter<br />
Base Pressure<br />
Chamber Pressure<br />
RF Power<br />
Electrode Area<br />
Total Flow Rate<br />
Silane Flow Rate<br />
NF3 Flow Rate<br />
Substrate Temperature<br />
Growth Rate<br />
Film Thickness<br />
Value<br />
5x10-"^ Torr<br />
200 mTorr<br />
low<br />
170 cm2<br />
34.0 seem<br />
34.0-29.0 seem<br />
0.0-5.0 seem<br />
250 °C<br />
1.2-10.5 A/s<br />
0.7-1.85 urn
33<br />
Table 2.3: Deposition Parameters for a-Sii_xCx:H films<br />
Parameter<br />
Residual gas pressure<br />
Argon partial pressure<br />
Argon flow rate<br />
Hydrogen partial pressure<br />
Hydrogen flow rate<br />
Substrate Temperature<br />
Sputter power<br />
DC-Potential<br />
Targets<br />
Target-substrate distance<br />
Angle between the targets<br />
Film Thickness<br />
Value<br />
2xlO-^Torr<br />
2 mTorr<br />
14.3 seem<br />
0.2-0.35 mTorr<br />
3-4 seem<br />
320''C<br />
SiUcon: Up to 700 W<br />
Carbon: Up to 1000 W<br />
SiUcon: Up to 700 V<br />
Carbon: Up to 450 V<br />
c-Si discs, 100 mm diameter<br />
glassy carbon discs, 100 mm diameter<br />
17 cm<br />
60°C<br />
0.3-2 /im
34<br />
In all cases, the films were deposited on rough Corning 7059 glass substrates for PL<br />
measurements. The substrates were ground using different grit silicon carbide and<br />
aluminium oxide powders. It has been found [6] that rough substrates eUminate<br />
interference fringes and enhance the PL signal by almost a factor of three due to<br />
minimization of multiple internal reflections. For electric field dependence measurements<br />
of PL, samples with a coplanar geometry of chromium electrodes with a spacing of<br />
0.5 mm were used. Chromium electrodes were chosen because they give good ohmic<br />
contact. In all the cases, samples were deposited simultaneously on crystalUne siUcon<br />
and plain glass substrates for infrared absorption and optical absorption measurements,<br />
respectively.<br />
2.2 Characterization Techniques<br />
Before carrying out PL measurements, the quality of the films and various other<br />
optical and electrical parameters were determined using several other characterization<br />
techniques. In the following, a brief summary of each technique along with the<br />
information obtained from it is presented. Some of these parameters are correlated with<br />
PL in the subsequent chapters.<br />
2.2.1 Optical Absorption<br />
A conventional two beam method, in which optical transmission through a<br />
reference is compared to that through the sample was used to record optical absorption<br />
of the films in the high absorption region. A model UV-265 Shimadzu spectrometer was<br />
used for this purpose. For these measurements, films deposited on plain glass substrates
35<br />
were used along with a reference substrate. When the thickness of the fUms is known,<br />
the optical absorption coefficient (a) of the fUms can be found using the Beer-Lambert's<br />
law given by<br />
f = exp(-a(f), (2.1)<br />
where IQ is the incident light intensity, I is the transmitted Ught intensity and d is the<br />
thickness of the films. From the absorption coefficient in the high energy region, the<br />
optical gap of the films can be found using the Tauc [36] equation given by<br />
{ahi^)^^^ = y/B{hu - Eg), (2.2)<br />
where E^ is the optical gap, B is the band edge width parameter and hu is the energy of<br />
the photon. The parameter B is inversely proportional to the width of bandtails and<br />
gives an indication of disorder in the material [10]. Another parameter that can be<br />
obtained from the absorption spectrum is the refractive index and hence the static<br />
dielectric constant of the film. In the region of low absorption {ad
36<br />
2.2.2 Constant Photocurrent Method/ Photothermal<br />
Deflection Spectroscopy<br />
In the region of low optical absorption {ad
37<br />
selection of fUms for PL measurements. The PDS measurements were done at the<br />
University of Kaiserslautern and the CPM measurements were done at Texas Tech.<br />
2.2.3 Infrared Absorption<br />
The hydrogen content in the films and information about silicon-hydrogen bonding<br />
can be obtained by performing infrared (IR) absorption measurements in a-Si:H. Since<br />
hydrogen is much lighter than silicon, the vibrational frequencies of Si-H, which are<br />
proportional to y^, where k is the force constant and m is the reduced mass, are much<br />
larger than silicon network modes, making them easy to observe. The two most<br />
prominent vibrational modes seen [40] in the IR absorption spectra of a-Si:H are at 2000<br />
cm~^ and 630 cm~^. The first one is assigned to a bond stretching vibration in which<br />
the hydrogen moves along the direction of the Si-H bond and the second one is assigned<br />
to the two perpendicular bond bending modes. There are a few weak modes at 800-900<br />
cm~^ which are associated with Si-Hn (n=2,3) type of configurations. It has been shown<br />
that the hydrogen content in the film can be related to the integrated absorption<br />
intensity of the 630 cm~^ as weU as the 2000 cm~^ peaks. Generally, the 630 cm~^ peak<br />
is used for the calculation of hydrogen concentration using [41]<br />
NH = Aj^d., (2.6)<br />
where N// is the hydrogen concentration and A is the oscillator strength for the bending<br />
mode and is equal to 1.6xl0^^cm~^. In addition, the positions of the stretching and<br />
bending mode peaks are very sensitive to the local bonding environment and can be<br />
used as an indicator of the homogeneity of the fUms after doping with various dopants in
38<br />
alloys of a-Si:H. The shift in the peak position of various modes with a change in dopant<br />
concentration can be predicted and used to verify dopant concentrations. A<br />
Perkin-Elmer model 1600 Fourier transform infrared (FTIR) spectrometer was used to<br />
carry out these measurements.<br />
2.3 PL Experimental Setup<br />
The experimental setup for the PL measurements is shown schematically in<br />
Fig. 2.1. A pulsed and two continuous wave lasers are used as the excitation sources.<br />
The samples are housed inside a temperature-controlled closed cycle refrigeration<br />
system. The emitted PL is dispersed using a monochromator and detected using a<br />
photomultiplier tube (PMT). The output of the PMT is directed to a picoammeter<br />
when acquiring CW spectra or to a fast waveform digitizer when acquiring PL decays.<br />
The PL decays are averaged over a number of pulses using a personal computer and<br />
analyzed on the Vax 8650 mainframe computer. The entire PL acquisition is controlled<br />
over an IEEE-488 bus and is fully automated. This makes data acquisition relatively<br />
easy and allows a good repeatability of experiments. In the following, details of each<br />
component of the experimental setup are described.<br />
A PTI PL 2300 nitrogen laser along with a PTI PL 201 dye laser gives a capabiUty<br />
of a wide range of pulsed excitations. The nitrogen laser pumps the dye laser with<br />
800 ps FWHM, 337.1 nm, 1.3 mJ pulses at a repetition rate of 1-20 Hz. The dye is in a<br />
standard fluorescence quartz cuvette kept in a holder inside the dye laser. Depending on<br />
the dye used, the laser can be operated in the range of 350-1000 nm. The FWHM of the
39<br />
P o:ter<br />
Printer<br />
- i.<br />
Waveform<br />
Digitizer<br />
1 i<br />
Picoammeter<br />
In<br />
ncp<br />
or<br />
ea As PMT<br />
t<br />
Monocnromator<br />
ens 4<br />
ens 3<br />
Helium-Neon<br />
Laser<br />
-f<br />
1 j 1 1.55-eV-Cutoff Filler<br />
-f<br />
Nitro^en-P'jmoec<br />
Samoie<br />
Lens 2 Helium Cryosrat Lens I<br />
Figure 2.1: Schematic of the experimental Setup for PL measurements
40<br />
dye laser pulse is typically 500 ps and the average energy per pulse is in the range of<br />
100-150 /xJ. For these experiments, the laser was generally operated at a repetition rate<br />
of ~ 10 Hz. The output of the laser passes through a beam splitter. The secondary beam<br />
from the beam splitter is incident on a photo-diode, which produces the trigger signal<br />
for the digitizer for PL decay measurements. For CW measurements, 2 HeUum-Neon<br />
lasers: Spectra Physics model 155 and Meredith Instruments model 543, providing<br />
excitations at 1.96 eV and 2.28 eV, respectively, were used along with the corresponding<br />
line filters. The peak power output of these two lasers is 1 mW and 2 mW, respectively.<br />
These excitation energies were chosen because these excitation energies are above the<br />
optical gap for all the samples used in this work and it has been found that [6] in a-Si:H<br />
the CW PL spectra are independent of the excitation energy when above-gap excitation<br />
energies are used. The spot size on the sample for all the excitations was adjusted such<br />
that the photogenerated carrier density was less than 10^^/cm^. Appropriate neutral<br />
density filters were also used to ensure the required excitation intensity.<br />
The samples were mounted on a sample holder inside a closed cycle refrigeration<br />
system. The system is designed to operate in a temperature range of 25 K to 475 K.<br />
The sample holder has two copper fingers which serve the function of holding the sample<br />
tightly in a vertical position, ensuring a good thermal contact with the sample holder as<br />
well as making electrical contact, if necessary, to the electrodes on the sample surface.<br />
These fingers are connected to BNC ports for external electrical connections. The<br />
vacuum chamber of the cooUng system is connected to a roughing pump. The roughing<br />
pump pumps down the vacuum chamber to about 10 mTorr before the compressor of
41<br />
the refrigeration system starts operating. A radiation shield reduces losses due to<br />
radiation at temperatures below 80 K. The shield has four windows, of which 2 adjacent<br />
windows are used for excitation and emission during a PL experiment. The other two<br />
windows are covered with aluminium foil to reduce further radiation losses. The whole<br />
assembly is covered with an aluminium shroud which has four quartz windows, through<br />
which optical excitation and emission is possible with minimum losses.<br />
Depending on the excitation energy, suitable cut-off filters were used to eliminate<br />
excitation Ught scattered off the surface of the sample. The PL signal is dispersed<br />
through a SPEX model 1680 double monochromator. The monochromator has two<br />
gratings with 600 lines/mm and a dispersion of 1.8 nm/mm of exit slit width. The<br />
wavelength control is attained using a computer controlled SPEX motor drive. The<br />
output of the monochromator is connected to a PMT for detection.<br />
Two photo-multiplier tubes were used in these experiments, depending on whether<br />
steady state or transient measurements were carried out. For PL decay measurements, a<br />
Hamamatsu R1564U-01 two-stage, proximity focused microchannel plate (MCP) PMT<br />
was used. This PMT has its maximum sensitivity at 2.4-2.6 eV and drops to very low<br />
values below 1.4 eV. As a result, all the decay measurements were limited to energies<br />
above 1.4 eV. The MCP has a transit time jitter of approximately 90 ps and a rise time<br />
of the order of 300 ps making it suitable for fast PL decay measurements. Since the CW<br />
PL spectrum of a-Si:H is quite broad and extends to 1.15 eV, to record the whole<br />
spectrum, an IR sensitive Hamamatsu R2658 InGaAs side-on PMT was used. The PMT<br />
is cooled to -10°C to reduce the dark current and improve the sensitivity of the tube.
42<br />
The rise time of this tube is ~ 1 ns and hence is slower than the MCP for studying<br />
subnanosecond PL decays.<br />
The output from the PMT was directed either to a picoammeter, when acquiring<br />
CW spectra, or to a Tektronix 7912AD fast waveform digitizer, when acquiring PL<br />
decay data. The picoammeter provides an analog voltage signal proportional to the<br />
photocurrent appropriate for the analog to digital (A/D) converter board mounted<br />
inside the IBM PC. The fast waveform digitizer consists of the main control unit and<br />
two plug-in units, the 7A29 ampUfier and 7B90P programmable time base. The digitizer<br />
has a bandwidth of ~ 750 MHz and a maximum digitization rate of 100 GHz<br />
(10 ps/channel). The digitizer acquires a scan on a trigger signal from the photodiode<br />
synchronous with the excitation pulse. A typical PL decay is averaged over 512 or 1024<br />
pulses. The PL decays in this work were acquired in the 50 ns time scale with the<br />
digitization rate of 100 ps/channel. A summary of the experimental parameters is given<br />
in Table 2.4.
43<br />
Table 2.4: Summary of experimental parameters<br />
Parameter<br />
CW excitation energies<br />
PL decay excitation energy range<br />
FWHM of dye laser pulse<br />
Average energy per pulse<br />
Repetition Rate<br />
Photogenerated carrier density<br />
MCP-PMT rise time<br />
Digitizer bandwidth<br />
Monochromator dispersion<br />
Temporal Resolution<br />
Value<br />
1.96, 2.28 eV<br />
1.7-2.7 eV<br />
500 ps<br />
100-150 /iJ<br />
10 Hz<br />
< lO^Vcm^<br />
300 ps<br />
750 MHz<br />
1.8 nm/mm<br />
100 ps
CHAPTER in<br />
DATA ANALYSIS<br />
3.1 Calibration of the system<br />
For extracting the actual luminescence spectrum C(A) from the raw spectrum<br />
Craiy(A) of a Sample, it is necessary to correct Crou;(A) for the response of the PMT and<br />
the monochromator used. In order to obtain the system spectral response, a caUbration<br />
procedure is used. A standard lamp of known spectral output (Eppley ES 8615) is used<br />
as the illumination source and the emission spectrum L(A) of the lamp is recorded under<br />
relevant experimental conditions(filters, lenses, etc.). This spectrum is compared with<br />
the known spectrum S(A) of the lamp and the ratio of the two gives the system spectral<br />
response R(A)<br />
RW = ^ y (3.1)<br />
Thus the corrected luminescence spectrum C(A) of a sample is obtained by taking the<br />
ratio<br />
C(A) = ^ . (3.2)<br />
This correction procedure is built into the acquisition software, so that all the CW data<br />
reported in this work have been corrected for the system spectral response. Typically<br />
the CW data are smoothed using a running average routine after correction.<br />
44
45<br />
3.2 Analysis of PL decays<br />
The PL decay M(t) acquired during the experiment is not the actual PL decay I(t)<br />
emitted by the sample, but it is a convolution of the actual PL decay with the temporal<br />
instrument response R(t) and can be represented by the foUowing convolution integral<br />
M{t) = / R{t')I{t - t')dt'. (3.3)<br />
J—oo<br />
The instrument response R(t) contains contributions from the shape of the excitation<br />
laser pulse, the temporal response of the PMT and the response of the digitizer. For a<br />
linear system, all the contributions can be lumped into a single instrument response<br />
function R(t). This temporal instrument response is determined experimentally for each<br />
set of excitations. In Eq. (3.3), if I(t-t') is replaced by a delta function, then the<br />
measured signal M(t) is just the instrument response R(t). Experimentally, a strongly<br />
reflecting surface is equivalent to replacing I(t-t') by a delta function. In these<br />
experiments, the a-Si:H samples themselves have a reflecting surface and can be used to<br />
obtain the instrument response. A typical instrument response obtained in this manner<br />
is shown in Fig. 3.1.<br />
In order to obtain the actual PL decay I(t) emitted by the sample, a deconvolution<br />
procedure is necessary. Although there are a lot of deconvolution techniques, the<br />
technique of iterative reconvolution has been found to give the best results with known<br />
synthetic decay functions [42]. This procedure consists of the foUowing steps:<br />
1. Assume a decay function with some parameters.
46<br />
in<br />
CM<br />
o<br />
cs<br />
CO<br />
^-»<br />
c D<br />
^<br />
h—<br />
CD<br />
>^<br />
4-^<br />
CO<br />
r 0)<br />
o in<br />
'"<br />
q<br />
o<br />
o<br />
IT)<br />
o<br />
0.0 20.0 30.0<br />
Time(ns)<br />
40.0 50.0<br />
Figure 3.1: Typical Instrument Response
47<br />
2. Convolute this decay function with the experimentally acquired instrument<br />
response.<br />
3. Compare the measured decay function with the calculated decay function using the<br />
least squares fitting method.<br />
4. Repeat steps 2 to 4 by adjusting the parameters until the chi-square error sum<br />
given by<br />
^, _ ^ [Af,(t) -Mm? (3 4)<br />
is minimized, where M^{t) is the calculated decay function, N is the total number<br />
of digitizer channels used, and erf is the square of the uncertainty of the<br />
measurement in the i*'' channel.<br />
In these experiments it is difficult to estimate the exact uncertainty cr, for every<br />
channel. The two common ways to obtain cr, are (1) experimental estimation and (2)<br />
modelling. In the first method, the uncertainty tr, is calculated by using standard<br />
statistical relations while averaging the data over a number of pulses during the<br />
acquisition[43]. Even though this technique can give a good estimate of
48<br />
the decay parameters obtained from fits to decays of standard samples using these two<br />
different methods for estimating the experimental uncertainty shows that they yield the<br />
same results within experimental error. The values of x^ error-sums in both of these<br />
cases are different from each other.<br />
In addition to x^, two other quantities, namely weighted residuals and the<br />
autocorrelation function, are evaluated at the end of the fitting to determine the quality<br />
of the fit. The weighted residuals are defined as<br />
W. = ^l^^i^. (3.6)<br />
They are normally plotted as a function of channel number. These weighted residuals<br />
should appear randomly distributed about zero if the PL decay model is adequate. With<br />
sufficient degrees of freedom, the residuals should be uncorrelated. Normally a visual<br />
inspection of the weighted residuals is sufficient to decide whether the residuals are<br />
correlated. Still, an autocorrelation function defined as<br />
can be used to supplement the visual inspection. High frequency oscillations of the<br />
autocorrelation function around the zero baseline is another indication of a good fit.<br />
Minimizing the x^ error sum in an iterative reconvolution process by adjusting the<br />
decay parameters involves much computation, depending on the number of parameters.<br />
As a result, from a computational point of view, an optimum search is essential to<br />
minimize computation time. A method employed to do this efficiently by performing a<br />
gradient search along the x^ hypersurface and linearizing the fitting function was
49<br />
proposed by Marquardt [44]. The software executing Marquardt's algorithm was already<br />
developed [45] and this work involved small modifications to the original software to<br />
execute the PL decay model developed in the foUowing section.<br />
3.3 PL Decay Model<br />
In these experiments, the PL decays in a-Si:H were found to be independent of the<br />
excitation intensity for photogenerated carrier densities < 10^®/cm^. The intensity of<br />
the PL signal at all temperatures and excitation energies was Unearly proportional to<br />
the excitation intensity. When the normalized decays at different excitation intensities<br />
were compared, no change in the shape of the decays was found. This clearly indicated<br />
that the decay kinetics were monomolecular. Under these conditions, the electron-hole<br />
pairs can be treated as non-interacting pairs and the recombination rate of these pairs at<br />
a particular energy follows<br />
dN<br />
— cxN (3.8)<br />
and the corresponding PL decay is exponential. However, in a-Si:H it has been reported<br />
that the PL decay in the nanosecond time scale can not be represented by a single<br />
exponential [31]. We also found that the PL decays in our experimental time window<br />
(0.1-50 ns) indeed can not be represented by a single exponential. If more than one<br />
radiative recombination channel is responsible for the PL decay observed in this time<br />
scale and these channels do not interact, then the PL decay can be represented as a<br />
superposition of all these exponentials given by<br />
n<br />
I{t) = 2a,exp(-t/r,), (3.9)<br />
1=1
50<br />
where a, and r, are the zero-time population and Ufetime of a particular channel,<br />
respectively. This method, also known as the "exponential series" method, was<br />
originally proposed by James and Ware [46] to resolve discrete non-interacting<br />
components or an underlying distribution from the PL decay. The analysis is initially<br />
performed by assuming a set of fixed lifetimes spanning the range of interest and an<br />
associated set of variable pre-exponential factors to fit the PL decay [47]. This forms the<br />
probe function to resolve the underlying lifetime distribution. In this approach, it has<br />
been assumed that the PL decay measurement is carried out at a single emission energy<br />
and for non-interacting processes only the pre-exponential factor is a function of<br />
emission energy. Under this assumption, the total PL spectrum emitted from a sample<br />
at an emission wavelength is given by the sum over time of all the decay components<br />
Using Eq. (3.9), Eq. (3.10) can be written as<br />
/(A)= / I{t,X)dt. (3.10)<br />
Jt=o<br />
" roo<br />
/(A) = y2a^ exp{-t/Ti)dt, (3.11)<br />
which can be further simplified to<br />
n<br />
/(A) = 5^a.(A)r, (3.12)<br />
Hence, the fractional PL intensity from the i*'' component at any emission wavelength is<br />
just given by<br />
/,(A) = a,(A)r„ (3.13)<br />
so<br />
the relative contribution of the m*'^ component in the PL spectrum is given by<br />
^mTm<br />
•« m = ^^:;i • (3.14)
51<br />
The results of this fit are summarized in a "lifetime distribution," in which the relative<br />
contributions of the Ufetimes(Pm) are plotted against the Ufetimes. The total<br />
contribution of a component is approximately proportional to the area under the<br />
particular peak. The mean Ufetime for each peak in the distribution is given by<br />
T^<br />
P m<br />
where i and j are the first and last index, respectively, in the range of lifetimes spanning<br />
the peak. Typically for lifetime distribution analysis, the lifetimes are spaced<br />
logarithmically in the 0.1 to 50 ns range and the number of lifetimes varies anywhere<br />
between 30 to 100. After finding the number of components in the decay and their<br />
approximate mean lifetimes from the lifetime distribution analysis, starting from these<br />
mean values of lifetimes a fit in which both the lifetimes and their pre-exponential<br />
factors are allowed to vary is carried out to get a more accurate estimate of the lifetimes.<br />
This is called the "discrete fit" analysis. If the number of decay components is correct,<br />
then the mean Ufetimes obtained from the lifetime distribution analysis match very<br />
closely to those obtained from the discrete analysis.<br />
Figure 3.2 displays a typical PL decay recorded at an emission energy of 1.54 eV at<br />
25 K along with the fit using Eq. (3.9). The corresponding weighted residuals, which<br />
indicate a good fit, are also shown in the same figure. Figure 3.3 shows the Ufetime<br />
distribution corresponding to the fit shown in Fig. 3.2.<br />
The distribution shows three peaks and a monotonically increasing region in the<br />
long Ufetime range. We found [48] that even if the input Ufetime region is expanded<br />
from 50 ns to 500 ns, the monotonically increasing region is present and dominates the
52<br />
U3<br />
CO »^7<br />
O<br />
tn -<br />
0.0 10.0 20.0 30.0<br />
Time (ns)<br />
40.0 50.0<br />
Figure 3.2: PL decay at 1.54 eV along with the fit using sum of exponentials<br />
and the corresponding weighted residuals
53<br />
10 10<br />
Lifetime (ns)<br />
10<br />
Figure 3.3: Lifetime distribution corresponding to the fit
54<br />
lifetime distribution. This suggests the presence of longer Ufetimes in the decay, which is<br />
consistent with earlier work [19]. The distribution corresponding to slower decay rates<br />
has already been characterized [19] and it has been established that the lifetime<br />
distribution peaks at lxlO"^s and is largely attenuated at lxlO~^s. We are mainly<br />
interested in studying the fastest components of the decay, represented by the three<br />
peaks in Fig. 3.3. In the following, we present an approach for separating the fast<br />
components from the slower components in the decay.<br />
If we express I(t) in Eq. (3.9) in integral form using decay rates {u = 1/r), we can<br />
rewrite Eq. (3.9) as<br />
roo<br />
I{t)= a{u)exp{-i^t)diy. (3.16)<br />
Jo<br />
Then, Eq. (3.16) can be spUt as<br />
/•F<br />
roo<br />
I{t)= a{u)exp{-ut)diy-\- _ a{u)exp{-ut)du, (3.17)<br />
Jo<br />
Ju<br />
where u is chosen such that: Ft < 1 in the time scale 0.1 ns < t < 50.0 ns. If we choose<br />
the value of 17 to be ~ 10^5~\ then in the time regime of the PL decay measured in this<br />
work, we have<br />
exp {-vt) ~ 1, where 0 < v {-t/T,), (3.19)<br />
t=i
55<br />
where r,- = l/i/, is the corresponding decay time. We found that using the discrete fit<br />
approach, the best fits were obtained using a sum of three exponentials given by<br />
I{t) = ao-|-aiexp(-t/ri)4-a2exp(-t/r2)-|-a3exp(-
56<br />
separately because, according to the strict definition of relative contribution (Eq. 3.14),<br />
the contribution of ao is not defined. For comparison between two decays, the value of<br />
ao, normalized to zero time intensity, is used instead of the percentage contribution. The<br />
results of the application of this model to PL decays in a-Si:H and other alloys are<br />
presented in subsequent chapters.
CHAPTER IV<br />
PHOTOLUMINESCENCE IN UNDOPED a-Si:H<br />
Although a number of a-Si:H films were used for PL decay measurements, for the<br />
convenience of presentation and continuity, mainly the results from two glow discharge<br />
(GDI, GD2) and two sputtered (SPl, SP2) films are presented here. Before performing<br />
the PL measurements, these samples were characterized using various techniques<br />
described in Chapter 2. A summary of the parameters obtained is given in Table 4.1. As<br />
can be seen from the ratio of photo-conductivity (at 9 mW/cm"^ illumination intensity)<br />
to dark conductivity, all films were of device quality. The defect densities for the<br />
sputtered films were higher than the glow discharge films, but still the defect densities of<br />
all films were lower than 10^^/cm^, beyond which the quantum efficiency is affected by<br />
the defect density [25].<br />
4.1 CW PL in a-Si:H<br />
As a first check on the PL decay measurements, the CW PL spectra of these films<br />
were recorded as a function of temperature. Figure 4.1 shows such a spectrum recorded<br />
at 25 K for sample GDI. As previously reported [6], we also found that the CW<br />
spectrum consists of a single, featureless broad band with a peak at around ~1.32 eV<br />
and a FWHM of ~0.2 eV. However, in none of the films that we measured did we find a<br />
decrease in PL intensity with a decrease in temperature below 50 K, as reported by<br />
some groups in Uterature [26]. The PL intensity for all films increased with a decrease in<br />
temperature and finally stayed constant at very low temperatures. Since the decrease in<br />
PL intensity at low temperatures has been associated with Auger recombination and we<br />
57
58<br />
Table 4.1: Summary of characterization parameters for a-Si:H films<br />
E,eV<br />
d ^m<br />
Eo meV<br />
N, xlO^Vcm^<br />
a^ X 10-^°/Ohm-cm<br />
(7pc X 10~^/Ohm-cm<br />
GDI<br />
1.64<br />
2.05<br />
55.4<br />
2.6<br />
1.8<br />
2.6<br />
GD2<br />
1.67<br />
1.95<br />
51.8<br />
1.7<br />
2.3<br />
2.8<br />
SPl<br />
1.72<br />
0.8<br />
63.4<br />
1.1<br />
1.4<br />
SP2<br />
1.75<br />
0.75<br />
65.1<br />
5.2<br />
1.8<br />
0.12
59<br />
did not see such a decrease, we believe that our excitation densities were not very high<br />
and most of the recombination was geminate.<br />
The temperature dependence of CW PL was investigated from 25 K to 160 K.<br />
With an increase in temperature, the CW PL intensity was strongly quenched and the<br />
PL intensity became undetectable at room temperature. A plot of the inverse integrated<br />
PL intensity against the temperature is shown in Fig. 4.2. The temperature dependence<br />
of the CW PL intensity obeyed the empirical relationship given by Eq. (1.13). The solid<br />
curve in Fig. 4.2 shows the best fit to the data using Eq. (1.13). The value of the<br />
parameter TL was found to be 21.3±0.5 K, which agrees well with that reported in the<br />
literature. This result serves as a preliminary check for ascertaining the validity of our<br />
further measurements.<br />
4.2 PL Decays in a-Si:H<br />
The PL decays for aU samples were very similar. Figure 4.3 shows a typical<br />
comparison of the decay for sample GDI at 25 K at an emission energy of 1.46 eV, the<br />
fit with Eq. (3.19) and the instrument response. The randomness of residuals shows that<br />
the fit is exceUent over the entire data-set. The corresponding Ufetime distribution is<br />
shown in Fig. 4.4. The Ufetime distributions for all the samples at 25 K are very similar<br />
and show three peaks at fi = 0.8±0.2 ns, f2 = 3.8±0.5 ns and f^ = 18.0±3.0 ns,<br />
respectively. The error-bars on these three mean lifetimes are obtained from averaging<br />
over repetitions of data for aU the samples. The confidence Umits for the Ufetimes<br />
obtained from fits are much smaUer than the error-bars. As explained in the previous
60<br />
1.1 1.2 1.3 1.4<br />
Energy (eV)<br />
Figure 4.1: CW PL spectrum of a-Si:H at 25 K
61<br />
O-<br />
CO<br />
CD<br />
k<br />
o<br />
O-<br />
80.0 100.0 120.0 140.0<br />
Tennperature(K)<br />
Figure 4.2: Temperature Dependence of CW PL intensity.
62<br />
chapter, the total contribution of these three Ufetimes has been normalized to 100%, but<br />
their absolute contribution to the total intensity 1(A) is very small. The absolute<br />
contribution of longer Ufethnes (>100 ns) is larger than 99%. This result is qualitatively<br />
consistent with previous work on PL decays in a-Si:H[19]. The invariance of these three<br />
mean Ufetimes for samples prepared under different deposition conditions and methods<br />
suggests that these recombination processes are intrinsic to the material and not defect<br />
related.<br />
The decay rates {i/ = 1/r) corresponding to the three mean lifetimes are<br />
ui = 12.5 X 10® s-\<br />
U2 = 2.6 X 10® s"^ and 1/3 = 0.6 x 10® s-^ respectively.<br />
According to the radiative tunneUng (RT) model, the fastest radiative decay rate is<br />
given by 10® s~^. The decay rates mentioned above are comparable to 10® s~^. Thus, if<br />
we calculate the separation R between recombining electrons and holes assuming<br />
Eq. (1.18), it turns out to be comparable or smaller than Ro, the Bohr radius. In this<br />
situation, the electrons and holes do not exist in well-separated regions of space. The<br />
overlap of the electron and hole wave functions can be very large and their movements<br />
can be correlated due to their Coulomb interaction. The RT theory can not be applied<br />
in this situation and exciton formation is more Ukely. Kivelson and Gelatt [49] have<br />
proposed a theory of bound excitons in an amorphous semiconductor with an<br />
asymmetric density of bandtail states as in a-Si:H. In the foUowing, a summary of aU the<br />
major assumptions of that theory dong with the physical picture described is presented.<br />
Then, with the help of simple calculations, the possibility of the observed three<br />
recombination processes being excitonic recombination processes is demonstrated.
63<br />
000<br />
o -<br />
TT -<br />
CM -<br />
1<br />
000361<br />
(arb.units)<br />
144000<br />
1......<br />
Intensity<br />
96000<br />
«• 1<br />
• 1<br />
• 1<br />
•<br />
4<br />
A nneasured<br />
•fitted<br />
1 • instrument response<br />
• 1<br />
• 1<br />
• \<br />
• \<br />
• \<br />
• \<br />
48000<br />
1 1 1 1 « 1<br />
i<br />
<<br />
><br />
*<br />
1<br />
•<br />
'v..,.^<br />
. LO<br />
in "^ -<br />
CD<br />
-.<br />
1<br />
^<br />
ir^i<br />
1 t<br />
0.0<br />
: \: • V ':'• ' •""' ':.• '••' '•' '••<br />
10.0 20.0 30.0 40.0 5C<br />
Tinne (ns)<br />
Figure 4.3: PL decay fitted with our model
64<br />
in<br />
d<br />
o<br />
At 1.46 eV<br />
c<br />
O<br />
_SCD<br />
o<br />
CJ lo<br />
CD^<br />
><br />
^-^<br />
JO<br />
CO<br />
m<br />
o<br />
d J<br />
•i«iii>i»iifti<br />
10'<br />
Lifetime (ns)<br />
Figure 4.4: Lifetime distribution corresponding to fit using our model
65<br />
4.2.1 Bound Exciton Theory<br />
The model assumes a simple picture of the density of one-electron states in the gap<br />
such as the one shown in Fig. 1.4. The intensity of the excitation light is assumed to be<br />
sufficiently low that each geminate electron-hole pair is isolated from all others, so the<br />
effects of other photoexcited electrons and holes can be ignored. Due to a high density<br />
of valence bandtail states, the hole becomes trapped in a localized state almost<br />
immediately after excitation. The electron remains free longer than the hole and is<br />
prevented from escaping from the vicinity of the hole due to their mutual Coulomb<br />
attraction. Kivelson and Gelatt [50] have shown that the notion of effective mass can be<br />
extended to disordered systems. Using this they have also shown that the bound states<br />
associated with a charged impurity in a disordered semiconductor are large hydrogenic<br />
states with a radius<br />
m*e^<br />
where K is the dielectric constant and m* is the appropriate average effective mass.<br />
Since the radius of the hole state, in general, is small as compared to Te, the bound state<br />
of the electron in the field of the hole is similar to that of an electron bound to any other<br />
charged impurity or a defect. If the electron orbital is large compared to the correlation<br />
length of the disorder, its nature is rather insensitive to the local variations of the<br />
environment characteristic of disordered systems. Thus, the electron-hole pair forms a<br />
trapped exciton consisting of a tightly bound hole surrounded by a larger hydrogenic<br />
electron orbital and the luminescence results from the radiative recombination of the<br />
electron with the hole to which it is bound.
66<br />
As the Fermi level lies somewhere in the midgap, the valence bandtail states are<br />
normally full and are charged when empty (i.e., when occupied by a hole) while the<br />
conduction band states are normally empty and are charged when occupied. The<br />
presence of a localized positive charge in the soUd introduces an associated electron<br />
bound state into the system. If the radius of the positive charge density is small<br />
compared to the effective Bohr radius, then regardless of the origin of the charge, the<br />
electron bound state will resemble the state of an electron bound to a point charge. The<br />
energy of this electron will be equal to the energy of the bound state associated with any<br />
other charge within some core-correction terms [49].<br />
The exciton formation probability depends on two other probabilities:<br />
(1) The probability that, while relaxing to the mobiUty edges, the electron and hole will<br />
not become too widely separated to permit exciton formation.<br />
(2) The probability that an exciton will form once the electron and hole have relaxed to<br />
the mobility edges.<br />
As electrons and holes are relaxing down in energy, they diffuse apart a<br />
characteristic distance lre/ax(E-E^) which depends on the excess kinetic energy. If we<br />
assume that the electron travels an average distance / with each phonon emission event,<br />
then a crude estimate of Ire/ox can be obtained [49]<br />
Irdax ~ [—^1 ' (4.2)<br />
where n(E) ~ ^^~^^^ is the mean number of phonons emitted, I is expected to be of the<br />
order of an interatomic spacing and U)D is the Debye frequency. An electron and hole<br />
that have relaxed to the mobiUty edge within about re of each other can form an exciton.
In order to conserve energy, the exciton formation must be accompanied by emission of<br />
phonons. A reUable estimate for the rate of formation of excitons is given by [49]<br />
67<br />
Vexc ^ i^De'"", (4.3)<br />
where n~ {Ec - ED)/{hujDO'/re) is the average number of phonons involved in the<br />
transition and ED represents the energy associated with the electron in the exciton. It is<br />
also possible that electron and hole escape from each other via the absorption of a<br />
phonon. If the separation between them is Ire/ax, then the escape process is<br />
characterized by a rate given by<br />
lescape ~
68<br />
of these states as a function of energy difference from E^. This spectral distribution in<br />
turn determines the PL spectrum and the radius of the hole state determines the rate of<br />
radiative recombination.<br />
The radiative transition rate in this model is derived simply from Fermi's golden<br />
rule and is given by [49]<br />
_ ^(fi^)V| < i\x\f > p<br />
where K is the dielectric constant, e is the electronic charge, c is the speed of light, uj is<br />
the frequency of the emitted radiation and < i\x\f > is the dipole matrix element<br />
between the initial and the final state. For this model, the initial state is a large<br />
hydrogenic bound state with radius re and the final state is a trapped hole state with a<br />
much smaller radius r/i. Although the precise value of the dipole matrix element depends<br />
on the details of disorder potential in the vicinity of the hole, the square of the matrix<br />
element will in general consist of an overlap term S, which is approximately proportional<br />
to (2r/i/re)^ times the squared dipole moment of the smaller state. So we approximate<br />
I < i\x\f > P - Sif < f\x^\f > . (4.7)<br />
If the hole wave function is extremely locaUzed, then within an order of magnitude of<br />
uncertainty,<br />
I < '1^1/ > I' ~ K' (4.8)<br />
and the radiative recombination rate is given by<br />
"' ~ 3fic3.3 • (4.9)
69<br />
Therefore, for the radiative decay rates obtained in this work, if we can find possible<br />
values of T^ and le, which satisfy Eq. (4.9) and other requirements of the theory, then<br />
there is a possibiUty that these processes correspond to radiative recombination of<br />
bound excitons.<br />
According to the assumptions of the model, we assume that the electron<br />
wavefunction radius is the same in all three cases and it is the hole wavefunction radius<br />
which changes. If we use K ~ 12 (which is the value we obtain from optical absorption<br />
measurements), hoj= 1.5 eV and re=5 A, then the three mean radiative decay rates<br />
starting from the largest rate correspond to hole wavefunction radii of 3.2 A, 2.2 A and<br />
1.7 A, respectively. Since these numbers are of the order of one or two near neighbor<br />
distances, the holes are very localized as required by the bound exciton theory. The size<br />
of the locaUzed tail states is generally a decreasing function of their binding energies and<br />
can be approximated as<br />
with Et = Ey for holes and Ej = Ec for electrons, where Ec and E^ are the conduction<br />
and valence band energy, respectively, and m* is the effective mass of the carrier. If we<br />
use the band energies as references and the appropriate effective masses for electrons<br />
and holes, then rough estimates of the binding energies for the three hole states using<br />
Eq. (4.10) are .07 eV, 0.15 eV and 0.25 eV, respectively. SimUarly, the binding energy<br />
for the electrons with re '^5 A comes out to be ~0.18 eV. The radius of the electron<br />
wavefunction was chosen to be 5 A to be consistent with the picture described earlier, in<br />
which the energy of the electron in the exciton is approximately equal to the maximum
70<br />
thermalization depth of electrons in a-Si:H. From Fig. 1.5, it can be seen that the<br />
maximum thermalization depth for electrons in a-Si:H is around 0.1-0.2 eV. In this<br />
plausibility argument, the choice of the electron wavefunction radius is arbitrary to a<br />
certain extent. The only restriction is that it should correspond to a binding energy<br />
which lies in the range of possible thermalization energies. Thus, even if the electron<br />
wavefunction radius is as large as 7-8 A the corresponding hole wavefunction radii<br />
calculated using Eq. (4.9) will be still in agreement with the localization requirement of<br />
the bound exciton theory. If we assume that the bandgap of a-Si:H at 25 K is 1.8 eV,<br />
then the differences in energies of electrons and holes in the three cases will be<br />
~1.55 eV, 1.47 eV and 1.37 eV, respectively. From this trend in the energy differences of<br />
the three electron-hole pairs, it is clear that these three recombination processes will<br />
dominate in decreasing order of emission energy. Thus, the shortest lifetime dominates<br />
at higher energies and the longest at lower energies. The peaks in the lifetime<br />
distribution are quite broad and as indicated by the error bars on each lifetime, there is<br />
a spread in the values of lifetimes, which indicates that it is difficult to point to a<br />
discrete level corresponding to each of these recombination processes. At the same time<br />
it can be said that these are the three dominant recombination processes and correspond<br />
to the fastest radiative processes in a-Si:H. Therefore, contrary to previous work, our<br />
results [51] definitely show that the Ufetime distribution in this time range is not<br />
featureless, but has a definite structure associated with it.
71<br />
4.2.2 Emission energy dependence<br />
Figure 4.5 shows the comparison of the deconvoluted PL decays at three different<br />
emission energies for sample GDI at 25 K. These emission energies span the energy<br />
range calculated in the previous section. As can be seen, the overall decay becomes<br />
sharper from low emission energy to high emission energy. The Ufetime distributions<br />
corresponding to these decays are shown in Fig. 4.6.<br />
Within experimental errors, the Ufetimes do not change within this range of<br />
emission energies, but as can be seen from the areas under the peaks, their relative<br />
contributions do change with emission energy. The contribution of shortest lifetime<br />
increases while that of the longest lifetime decreases with an increase in emission energy.<br />
In addition, the value of the parameter ao decreases with an increase in emission energy,<br />
indicating a reduction in the contribution of radiative tunneling recombination to the<br />
decay. This trend is in agreement with the discussion in the previous section. As the<br />
emission energy is increased, the recombination between electrons and holes which are<br />
less locaUzed can only be detected. In the bound exciton explanation, the excitons with<br />
least localized holes have the fastest radiative decay rates, hence with an increase in<br />
emission energy, the fractional contribution of this type of excitons to the decay<br />
increases and the PL decay becomes faster. This result is in qualitative agreement with<br />
Stearns [31], who found a similar behavior of the PL decay with emission energy. The<br />
increase in parameter ao can be explained using the radiative tunneUng explanation, in<br />
which the electrons and holes that are in early stages of thermaUzation are closer to each<br />
other. Thus, the overlap between the wavefunctions is larger and the average Ufetime for
72<br />
Ennission Energy<br />
1.40 eV<br />
1.46 eV<br />
1.54 eV<br />
1D-<br />
0.0 10.0 20.0 30.0<br />
Tinne (ns)<br />
40.0 50.0<br />
Figure 4.5: Comparison of the deconvoluted decays at three different emission<br />
energies
73<br />
d<br />
q<br />
At 25K<br />
•<br />
o<br />
0<br />
1.4 eV<br />
1.46 eV<br />
1.54 eV<br />
ZJ<br />
q<br />
CO*<br />
"c<br />
O<br />
CJ<br />
CD<br />
><br />
ITS<br />
CD<br />
o<br />
CO<br />
la<br />
O<br />
d<br />
2»10' 10'<br />
Lifetime (ns)<br />
Oi,Oi.B,D,Bi<br />
10^<br />
Figure 4.6: Comparison of the lifetime distributions at different emission<br />
energies
ecombination decreases (according to Eq. (1.18)), thus shifting the Ufetime distribution<br />
towards shorter lifetimes and reducing a©.<br />
74<br />
4.2.3 Temperature Dependence<br />
The temperature dependence of the PL decays was investigated in the range 25 K<br />
to 160 K. With increasing temperatures, there was a strong quenching of the PL decay<br />
intensity similar to the CW PL intensity. Beyond 160 K, the PL intensity became<br />
smaller than that needed to extract reliable fitting parameters. Figure 4.7 displays a<br />
comparison of the deconvoluted decays for sample GDI at different temperatures with<br />
normalized peak intensity. With an increase in temperature, the PL decays become<br />
sharper. Figure 4.8 shows the dependence of the three extracted mean lifetimes on<br />
temperature. It can be seen that the dependence is rather weak. We could not fit the<br />
temperature dependence with an activated behavior (r ^ exp{ — Ea/kT))<br />
or with a<br />
functional form reported by Stearns [31] (r ~ Co + Ci exp {T/TQ))<br />
for any of the three<br />
lifetimes. Figure 4.9 shows the change in the relative contribution of the three mean<br />
lifetimes towards the PL decay as a function of temperature. As can be seen from this<br />
figure, the contribution of ri and T2 increases while the contribution of ra decreases with<br />
increasing temperature. The value of the parameter ao decreases considerably over this<br />
temperature range. Again, these results are in qualitative agreement with previous work<br />
[19], which states that the overall Ufetime distribution moves towards shorter times and<br />
narrows with increasing temperature.
75<br />
0.0 10.0 20.0 30.0<br />
Time (ns)<br />
40.0 50.0<br />
Figure 4.7: Comparison of the deconvoluted PL decays at different temperatures
76<br />
CO 00<br />
3d-<br />
0)<br />
E<br />
*a5S<br />
M_ O-<br />
"^<br />
d<br />
o<br />
.—* TT'-<br />
co<br />
3 U3<br />
« »<br />
n<br />
i •<br />
<<br />
T2<br />
•<br />
1<br />
I<br />
•<br />
1<br />
1<br />
•<br />
1<br />
1<br />
o<br />
•<br />
1<br />
k<br />
•<br />
1 *<br />
•<br />
1<br />
•<br />
1<br />
• 1<br />
q<br />
'^ d-<br />
c ^<br />
"o o<br />
E JO-<br />
^^<br />
05 ^<br />
M— O<br />
LJ c^jq<br />
< i<br />
'^3<br />
t<br />
1<br />
» 1<br />
• 1<br />
1<br />
1<br />
20.0 60.0 100.0 140.0<br />
Temperature(K)<br />
( »<br />
< t<br />
1 1<br />
t<br />
1<br />
1<br />
180.0<br />
Figure 4.8: Comparison of the temperature dependence of lifetimes
I I<br />
20.0 60.0 100.0<br />
Temperature(K)<br />
140.0 180.0<br />
Figure 4.9: Temperature dependence of the relative contributions of the<br />
three lifetimes
78<br />
Although the three mean lifetimes change by less than a factor of two, the overall<br />
PL intensity goes down by almost a factor of five or six over this temperature range.<br />
This can be attributed to thermal quenching. With increasing temperature, due to an<br />
increase in the available thermal energy, most of the carriers can find new states in<br />
which they either recombine radiatively or non-radiatively at the longer times. In the<br />
exciton picture, the probability of exciton formation will decrease because the electron<br />
can diffuse away from the hole to a larger distance and recombine through other<br />
recombination channels. This decrease in the initial number of excitons is responsible for<br />
the quenching of the PL signal directly.<br />
The overall Ufetime for competing radiative and non-radiative processes is given by<br />
- = - + —, (4.11)<br />
r Tr Tnr<br />
where Tr and Tnr are radiative and non-radiative Ufetimes, respectively. A mild<br />
temperature dependence of the Ufetime r thus would suggest a competing slow<br />
non-radiative recombination channel. We now proceed to investigate, with a few simple<br />
calculations, if there are any such possible non-radiative recombination processes.<br />
Kivelson and Gelatt [49] have predicted that at higher temperatures, the electron in an<br />
exciton can be thermally activated to the mobiUty edge E^ where it can escape from the<br />
vicinity of the hole. The rate of ionization Uac is given approximately by the<br />
semiclassical expression<br />
Uac - v,xce-'^^''^'^\ (4.12)<br />
where Vexc is the rate of exciton formation, Ex is the binding energy of the exciton and<br />
the temperature dependent factor represents the probabiUty of a thermal fluctuation of
79<br />
sufficient magnitude to elevate the electron to Ec. As mentioned before, the temperature<br />
dependence of none of the three mean lifetimes shows an activated behavior expected for<br />
such an ionization process. If we assume [49] Uexc ~ lO^^-lO^^^-i ^nd E^ ~ 0.1 - 0.15eV,<br />
then at lower temperatures (160 K), ionization can<br />
dominate over all three recombination processes, but we could not carry out the decay<br />
measurements at these temperatures due to very low PL intensities.<br />
Another possibility for nonradiative recombination of excitons is multiphonon<br />
emission. A simple expression for the non-radiative recombination rate i/nr of a bound<br />
exciton due to multiphonon emission in a-Si:H is given by [49]<br />
i^nr ~ 10^'*(2rjre)^e-". (4.13)<br />
Here, n is the number of emitted phonons, given by<br />
n > E/huJo, (4.14)
80<br />
where E is the energy of the exciton and u;o is the maximum phonon frequency. If we<br />
use the same values as before for r^ and TC, the rate of nonradiative recombination due<br />
to multi-phonon emission can be anywhere between ~ lO^s"^ to negligibly small,<br />
depending on the phonon energies. Thus, multiphonon emission is one of the possible<br />
processes that can compete with the two fast recombination processes corresponding to<br />
Tl and T2 and can contribute towards the reduction in lifetimes.<br />
Tunneling to defects is another possible nonradiative recombination process. It has<br />
been found by Street et al. [25] that the relative luminescence intensity decreases with<br />
increasing defect concentration. However, they have also reported that the decrease is<br />
significant only after the density of defects increases above 10^^/cm^.<br />
For our films the<br />
density of defects is ~ lO^^/cm"^; hence, this path of recombination should not affect the<br />
PL decay significantly. The average separation between an electron and a hole in an<br />
exciton will be much smaller than the average distance to a defect with such a low defect<br />
concentration: this means that the rate of tunneling to a defect will be much smaller<br />
than the rate of radiative recombination and will not affect the overall recombination<br />
significantly over this time range.<br />
4.2.4 Excitation energy dependence<br />
Figure 4.10 shows a comparison of the deconvoluted decays for five excitation<br />
energies in the range from 1.7 eV to 2.7 eV at 25 K for GDI at an emission energy of<br />
1.46 eV. From the best fits, we find no change in the mean Ufetimes or the relative<br />
contributions of the three radiative processes at a constant temperature, although the
81<br />
Excitation Energy<br />
2.68 eV<br />
2.13 eV<br />
2.02 eV<br />
1.80 eV<br />
1.70 eV<br />
0.0 10.0 20.0 30.0<br />
Time (ns)<br />
40.0 50.0<br />
Figure 4.10: Comparison of the deconvoluted PL decays at different excitation<br />
energies
82<br />
relative contribution of the longer Ufetimes (parameter ao) increases with an increase in<br />
excitation energy. After correcting the PL intensities for changes in excitation intensities<br />
and changes in absorption coefficient, we found that the overall intensity of the PL<br />
decay signal decreased from low excitation energies to high excitation energies. Below<br />
1.7 eV, which is very close to the bandgap, the PL intensities were below the level<br />
needed to extract reliable fitting parameters. This was due to a combination of low<br />
excitation intensities and lower absorption coefficients at those energies. Due to the<br />
increase in the parameter OQ, the overall decay seems to become slower with higher<br />
excitation energies. This indicates that the distribution of decay times is shifting to<br />
longer times. This result is in agreement with Stearns [31] and Shah, Bagley and<br />
Alexander [52]. Therefore, we can adopt their explanation in terms of the average initial<br />
separation of the electron hole pair to explain the increase in the slower recombination.<br />
This explanation is based upon a model for the thermalization of photogenerated<br />
electron-hole pairs that was first presented by Davis [53], and was further developed by<br />
Knights and Davis [54]. According to this model, a photogenerated pair relaxes into the<br />
bandtail states by emitting phonons of energy ha;o at an average time interval of l/u;o<br />
seconds. Each emission process is considered to be one step in a random walk. Thus the<br />
electrons and holes tend to diffuse in space, so that their relative positions, upon<br />
reaching the locaUzed bandtail states, are described by a Gaussian distribution. The<br />
width ro of this distribution is given by<br />
ro' = [(^ex - E,m) + {ey4irKro)]{D/hujo^). (4.15)
83<br />
Here, Ee^ is the excitation energy, Egm is the PL emission energy, D is the diffusion<br />
coefficient, and K is the dielectric constant. The term in square brackets represents the<br />
total energy lost by an electron-hole pair in the thermaUzation process. This is a<br />
simpUfied description of a very complex process. This shows that the width of the initial<br />
distribution of electron-hole pairs increases with increasing excitation energy for a<br />
constant emission energy. This implies that an average electron is farther away from the<br />
hole for higher excitation energies. According to radiative tunneling theory [6], the<br />
average Ufetime of the electron-hole pair thus becomes longer with higher excitation<br />
energy. In our model this causes an increase in the value of the parameter a©.<br />
As explained before, the electron hole pairs which are very close to the origin of<br />
this distribution of photogenerated pairs form excitons. The formation process is the<br />
only one which depends on the excitation energy and subsequently all the memory of the<br />
excitation is lost. The recombination process does not depend on the excitation energy.<br />
Thus, there is no change in the recombination mechanism of the three recombination<br />
processes with change in excitation energy. However, at higher excitation energies, the<br />
carriers possess excess kinetic energy, hence the probabiUty of an electron diffusing away<br />
from the hole is larger. Therefore, the initial number of excitons formed decreases with<br />
higher excitation energy and consequently the overall PL decay intensity at the same<br />
emission energy decreases as well.
84<br />
4.2.5 Electric Field Dependence<br />
Previous work [55, 56, 57, 58, 59] on electric field dependence of the PL in a-Si:H<br />
has estabUshed that the CW PL intensity is quenched by electric fields above IO'* V/cm<br />
and the average Ufetime of the integrated PL decay remains unchanged for these fields.<br />
Even though we find quenching of CW PL with electric field (see Chapter VII), we do<br />
not see any change in the PL decay intensity and shape in the 0.1-50 ns time range after<br />
application of the same electric field. The maximum field that we were able to apply<br />
without damaging the samples was around 5x10^ V/cm, and even at that field, we did<br />
not find any change in the PL decay.<br />
This result seems surprising at first, but it is conceivable if we recall that the<br />
recombination in this time regime forms a very small fraction of the total recombination<br />
at a particular wavelength. A considerable change in the CW luminescence intensity<br />
without changes in fast recombination suggests that the electric field affects only the<br />
slower recombination. In terms of the radiative tunneling model [6], this means that the<br />
decay is affected only if the separation between an electron and a hole is large. Thus,<br />
the electric fields required to separate pairs separated by small distances are too large.<br />
In other words, the exciton formation could be inhibited only at unrealisticaUy high<br />
fields. In addition, the contribution to ao mainly comes from Ufetimes around 10~^ s,<br />
since the longer the Ufetime the smaller the probabiUty of it contributing any photons to<br />
the PL decay in the experimental time scale. Since the longer Ufetimes, which get<br />
affected by the electric field, contribute much less than those around 10"^ s to ao at one<br />
emission energy, the changes in ao might be too smaU to affect the intensity. Thus,
85<br />
neither the intensity nor the shape of these nanosecond PL decays is affected at these<br />
electric fields, but still the CW intensity is quenched. The unaffected PL decays,<br />
therefore, indirectly support the model that the electron-hole pairs recombining on this<br />
time scale are separated by very short distances. Our additional results on field<br />
quenching of CW PL and their discussion are presented in Chapter VII.<br />
4.3 Discussion<br />
Wilson et al. [30] have reported a decay time of 8 ± 2 ns, after fitting the first 5 ns<br />
of the PL decay at 15 K by a single exponential, even though the rest of the decay was<br />
nonexponential. However, they have also reported that they do not see any fast<br />
recombination processes as we do in the 1-ns range. We stress here that their study was<br />
based on an integrated PL decay, and as Stearns [31] has pointed out, an integrated<br />
spectrum relates to changes in the average configuration of the entire electron-hole<br />
population. In contrast, the PL decay measured at a particular emission energy is<br />
sensitive to changes in the sub-population of electron hole pairs that occupy states at<br />
that particular energy. We can not directly integrate the emission spectrum due to the<br />
limited energy range of our experiment. Since the fast components we observe are<br />
relatively weak, a single exponential fit to the first 5 ns may not reveal the fast<br />
processes, but only some sort of weighted average of the three mean lifetimes that we<br />
see. The weighted average of these at 25 K is 11 ± 2 ns, which is comparable to that<br />
reported by Wilson et al. [30]. In order to explain their results, they have proposed the<br />
existence of localized excitons similar to the ones discussed here. Using a<br />
first-order
86<br />
approximation, they model the PL as the radiation from an oscillating dipole erj within<br />
a medium of dielectric constant K and estimate r^ to be ~1.6 A. This suggests very<br />
small carrier separations and qualitatively agrees with our explanation.<br />
Stearns [31] has measured PL decays on a-Si:H on almost the same time scale<br />
(0.1-40 ns) with a single photon counting technique. The decays reported here are<br />
comparable to those decays and show the same trends with parameters Uke emission<br />
energy, excitation energy, intensity and temperature. His model assumed [31] that the<br />
distribution of decay rates decreases exponentially for large rates. We find no physical<br />
basis for this assumption. Stearns found empirically[31] that the exponential<br />
distribution best reproduced the measured PL decays. Using this assumption, it was<br />
shown that the early PL decay can be modelled as I{t) = ai -\- a2/{t + To), with ai, a2<br />
and To as fitting parameters. The parameter TQ is the decay time cutoff and represents<br />
the initial inverse slope of the deconvoluted decay, when it is plotted on a<br />
semilogarithmic scale. It also indicates how fast the decay rate distribution attenuates<br />
at large u. Since this ro is obtained from the best fits to the PL decays using the model<br />
described above, it is difficult to quantitatively compare the relationship between ro and<br />
the three mean lifetimes from our results. The decrease in ro with temperature reflects<br />
the movement of the distribution towards shorter times and is supported by the increase<br />
in contribution from ri with increasing temperature. The quenching of ro with increase<br />
in emission energy is consistent with our percentage increase of ri with increasing<br />
emission energy. The increase in ro with increasing excitation energy is in agreement<br />
with the increase in the contribution of the long-time decay (parameter ao) with
87<br />
excitation energy. Therefore, we think that our data are in qualitative agreement with<br />
the work by Stearns [31] but the specific results and interpretations are different because<br />
of the different approaches to modeUing the decay.<br />
The main justification that Stearns has offered for his results is based on the<br />
following reasoning. The time dependent PL intensity I(t) can be written as<br />
I{t) = l7r{t)^{t), (4.16)<br />
where N(t) represents the total population of electron-hole pairs at time t, and i7r{t) is<br />
the average radiative recombination rate of these pairs. It is claimed that the decrease in<br />
intensity is not due to a decrease in N(t), but rather due to decrease in ^v(t). It is<br />
suggested that there are two possible mechanisms which account for the decrease in<br />
i7r{t). The first mechanism is based upon the assumption that the pairs with the<br />
shortest decay times recombine first, leaving behind the pairs with a longer average<br />
decay time, which decreases the average recombination rate, thus decreasing the PL<br />
intensity according to Eq. (4.16). The pairs with the shortest recombination times are<br />
suggested to be bound excitons recombining in a radiative or non-radiative manner. The<br />
second mechanism accounting for a decrease in i'r{t) is that the electron and hole<br />
wavefunctions separate on a nanosecond time scale. As they separate, the overlap of<br />
their wavefunctions decreases, thus increasing their radiative Ufetime and decreasing<br />
i7r{t). We feel that on his experimental time resolution (500 ps), the thermalization of<br />
the carriers is already completed, so that the electron-hole pairs have already attained<br />
their spatial distribution. Thus, the possibility of further separation is quite low and the<br />
validity of his second mechanism is questionable. We feel that the first suggestion is
88<br />
more plausible with one major modification, that is the number of electron-hole pairs or<br />
excitons at a particular emission energy decreases, but the average decay rate due to<br />
these three recombination processes remains the same. The decrease in PL intensity in<br />
the experimental time scale is then due to a decrease in number of electron-hole pairs,<br />
although these pairs form only a small fraction of the overall electron-hole population.<br />
Stearns [31] and Wilson et al. [30] have pointed out that the radiative tunneling<br />
model breaks down when used to try to explain the origin of fast lifetimes (in the<br />
nanosecond range) and both of them have suggested the possibility of the existence of<br />
excitons. As mentioned before, Kivelson and Gelatt [49] have developed a model of<br />
bound excitons in amorphous semiconductors and predicted the existence of such<br />
excitonic processes in a-Si:H. Since the lifetimes that we obtained were in the<br />
nanosecond range, we assumed that these were excitons and tried to apply the<br />
formalism to explain all of our results. The three peaks that we get in the Ufetime<br />
distribution are quite broad and hence there is a possibiUty of a spread of Ufetimes<br />
around the mean Ufetimes (as indicated by the error bars). However, the three mean<br />
lifetimes represent the three dominant channels of recombination on the experimental<br />
time scale. The connection between the radiative rates and the hole localization radii<br />
directly foUows from the bound exciton theory [49]. According to the theory, since the<br />
radiative rate is proportional to a ratio of J^, there is considerable uncertainty in the<br />
determination of the two radii from the radiative rates. Physically, the different hole<br />
radii imply a different size of exciton (different range of electron-hole coupUng), but<br />
there is insufficient information to distinguish between the different possibilities
89<br />
regarding the specific number of peaks. One possibiUty is that these are 3 different<br />
excitons and a second is that all three processes are different excited states of the same<br />
exciton. It is hard to say anything about the expUcit nature of these three processes<br />
without an independent measurement. As a result, we have not given any consideration<br />
to the specific number of peaks, but just considered a general case in which these are the<br />
three dominant excitonic processes.<br />
Excitonic effects in crystals normally produce peaks in the absorption spectrum<br />
just below the bandgap energy. There are no such peaks observable in the absorption<br />
spectra of a-Si:H, because if at all such peaks are present they are broadened by the<br />
disorder. In weakly disordered crystalUne semiconductors, the recombination is<br />
dominated by excitons [60]. Thus, it is possible that as the disorder is increased, a<br />
transition from exciton domination to geminate pair behavior takes place. At the same<br />
time, it is possible that a small population of excitons can co-exist with a large<br />
population of geminate pairs in a-Si:H. The distinction between the two depends upon<br />
whether the electron and hole can be identified with weU-separated regions of space. So<br />
it is certainly possible that there is a continuous range of intermediate possibilities<br />
where the excitation exhibits both electron-hole pair like and exciton-like features.<br />
In our earlier work [48], we had fitted the PL decays with a sum of exponentials<br />
and reported three mean lifetimes in which the value of T3 differs appreciably from the<br />
numbers reported here. In the present work, we have modified our model by adding a<br />
parameter ao which accounts for the contribution of long lifetime components [51]. We<br />
have verified the effect of very long Ufetimes by constructing decays with three
90<br />
comparable lifetimes and a constant and fitting them with a sum of exponentials. The<br />
result always showed a Ufetime distribution similar to that in Fig. 3.3, with three peaks<br />
and a monotonically increasing region in the long Ufetime region. In addition, the<br />
longest lifetime obtained from these fits was always shorter than the known input<br />
lifetime used for constructing the decay. This agrees with what we have found with our<br />
fits to the PL decays. This probably seems to be some Umitation of the sum of<br />
exponentials approach when applied to a combination of discrete lifetimes along with a<br />
very broad continuous distribution of lifetimes. The stronger temperature dependence of<br />
the lifetimes in our earlier approach could also be a manifestation of the decrease in the<br />
contribution of the very long lifetime components summarily reflected in the parameter<br />
ao in the present new approach.<br />
At this point, we would like to address the issue of the uniqueness of the data<br />
reduction scheme that we have employed in this thesis. Anytime a featureless decay is<br />
fitted with a multi-parameter model, one must be cautious about the uniqueness of the<br />
fit. However, at the same time we feel that the physical basis for the particular model is<br />
equally important. Since in our experiments we find that the recombination in a-Si:H is<br />
monomolecular, we can use first-order decay kinetics (^ oc iV), which impUes an<br />
exponential decay for an individual component. Since the overall decay is<br />
non-exponential, we have used the most commonly used extension of first order kinetics<br />
to n non-interacting components, which is a sum of exponentials. The only<br />
simplification involved in the model is assuming the contribution of longer lifetimes to<br />
be constant in the experimental time window (50 ns). However, in an exponential decay
91<br />
model, this assumption is well-justified. We have not tried fitting our decays with any<br />
other model. Therefore, we would Uke to emphasize that the validity of our results is<br />
entirely based on vaUdity of the sum of exponentials approach to represent<br />
non-interacting components. Hence the results should be treated with caution.
CHAPTER V<br />
PHOTOLUMINESCENCE IN a-Sii_:,Cx:H<br />
Hydrogenated amorphous SiC alloys (a-Sii_xCx:H) have attracted much interest<br />
due to their potential appUcations for p-doped window layers in heterojunction solar<br />
ceUs and other optoelectronic devices such as Ught emitting diodes [61, 62, 63, 64].<br />
These appUcations make use of the possibility of widening the energy gap and of shifting<br />
the peak energy of photoluminescence over a wide range with increase in carbon content.<br />
However, the increase in carbon content is accompanied by a degradation of electronic<br />
properties such as photoconductivity and photoluminescence efficiency, due to creation<br />
of additional defects [65, 66]. Various factors such as a tendency of carbon atoms to<br />
bond in three-fold coordination (graphite like) instead of four-fold coordination<br />
(diamond like), difference in bond length and excessive hydrogen incorporation are<br />
considered to be the sources for defect creation.<br />
Photoluminescence measurements can give valuable information about the role of<br />
defects in the recombination mechanism. Previous photoluminescence measurements<br />
[67, 68, 69, 70] in a-Sii_j:Ca::H have been done mostly on samples prepared using the<br />
glow discharge (GD) technique. It has been reported that the CW PL spectra of these<br />
films shift to higher energy and broaden with increasing carbon content. They consist of<br />
one band in the entire composition range. It has been suggested [67, 68, 69, 70] that the<br />
main recombination mechanism is not drastically altered by alloying. This system,<br />
therefore, forms an ideal system to investigate the effect of carbon doping on PL in<br />
a-Si:H. In this chapter, we present our results of CW and time-resolved<br />
photoluminescence measurements on a-Sii_xCx:H alloys prepared using co-sputtering<br />
92
93<br />
[35]. To our knowledge this is the first PL characterization of co-sputtered a-Sii_xCx:H<br />
films [71].<br />
Five films with different carbon contents along with a corresponding undoped<br />
a-Si:H film were used for these experiments. The carbon content in the films was<br />
measured using Secondary Neutron Mass Spectroscopy (SNMS). Table 5.1 gives the<br />
carbon contents for all the films. The hydrogen content for the films was measured using<br />
thermal evolution. The spin densities of the samples, which give the dangling bond<br />
densities, were measured using Electron Spin Resonance (ESR). These three<br />
measurements were done at University of Kaiserslautern by D. Cronauer [35].<br />
5.1 Variation of parameters with carbon content<br />
Figure 5.1 displays the variation of optical gap with carbon content (x) calculated<br />
from optical measurements using the Tauc expression (Eq. (2.2)). With increasing x, the<br />
optical gap E^ increases from 1.7 eV (x=0) to 2.15 eV (x=0.65) and then decreases to<br />
1.97 eV (x=0.99). Due to a substantial difference in the electronegativities of silicon<br />
(1.74) and carbon (2.5), the peak of the Si-C stretching mode in the IR absorption<br />
moves from 680 cm"^ at x=0.1 to 780 cm"^ at x=0.71, as shown in Fig. 5.2. Beyond<br />
x=0.7, the exact peak location could not be determined accurately due to the low<br />
intensity of the peak. The initial increase in E^ (x
94<br />
Table 5.1: Carbon Contents of the films<br />
CO<br />
CI<br />
C2<br />
C3<br />
C4<br />
Co<br />
0.0<br />
0.23<br />
0..33<br />
0.45<br />
0.65<br />
0.99
95<br />
0.0 0.2 0.4 0.6<br />
Composition(x)<br />
Figure 5.1: Variation of band gap with carbon content in the film
96<br />
0.0 0.2 0.4<br />
Composition(x)<br />
Figure 5.2: Change in Si-C stretching mode frequency with carbon content
97<br />
o<br />
O<br />
Oi<br />
M<br />
O<br />
O-<br />
00<br />
o<br />
o-<br />
=? d-<br />
Integrated<br />
20.0 30.0<br />
Absorption"<br />
40.0 50.0<br />
10.0<br />
1<br />
/ •<br />
/<br />
/<br />
/<br />
/<br />
/<br />
/<br />
/<br />
/<br />
•<br />
0.0<br />
1 1<br />
0.0 0.2 0.4 0.6<br />
Composition(x)<br />
0.8 1.0<br />
Figure 5.3: Integrated absorption of Si-C stretching mode versus carbon<br />
content
98<br />
integrated absorption follows this behavior. From this it can be concluded that the<br />
preparation method results in a homogeneous structure of the a-Sii_xCx:H films. In<br />
other words, inhomogeneous structures like clustering of siUcon or carbon as well as<br />
preferential bonding of hydrogen to one of the alloy constituents can be ruled out from<br />
this figure. Even though Si-C bindings decrease for 0.5
99<br />
o<br />
d<br />
CO<br />
o<br />
d<br />
CO<br />
cs<br />
o<br />
d.<br />
.^-^ CM<br />
• Urbach Energy<br />
• B'^O.B<br />
E q<br />
O) cs<br />
c<br />
LU O<br />
CO<br />
3 o<br />
d<br />
cs<br />
o<br />
d-4<br />
CO<br />
o<br />
d<br />
0.0 0.2 0.4 0.6<br />
Composition(x)<br />
Figure 5.4: Variation of Urbach energy and edge width parameter B with<br />
carbon content in the film
100<br />
energy increases monotonically with x in the entire alloy region. The increase is small at<br />
first, but then becomes very large for x>0.5. According to interpretation of Cody et al.<br />
[76], Urbach energy is related to the total disorder in the material which includes<br />
compositional, structural and thermal disorder. The Urbach energies for fUms studied<br />
here are smaller than GD a-Sii_xCx:H films with comparable carbon content. This<br />
would suggest that either the compositional or structural disorder in these fUms is<br />
smaUer than in GD fUms, which is in agreement with our SiC absorption results<br />
discussed in connection with Fig. 5.3. The edge width parameter B stays almost<br />
constant until x=0.5 and then it decreases considerably for very high x. We tend to<br />
agree with Skumanich et al. [73] in interpreting the behavior of B and Eo as follows. At<br />
smaU carbon content, the energy gap widens due to a shift of the conduction band to<br />
higher energies without much change in the curvature of the band. The band tails,<br />
however, do become wider due to an increase in compositional disorder. At higher<br />
carbon content, there is a structural change as the network makes a transition from<br />
siUcon to carbon domination, reflected in large changes in B and EQ.<br />
The spin density determined using ESR measurements for these samples is shown<br />
in Fig. 5.5(a) [35]. With increasing carbon content, there is an increase in the spin<br />
density by 2-3 orders of magnitude. At x=0.65 the spin density peaks with a value of<br />
8xl0^^/cm^ and then decreases to 2xl0^^/cm^ for sample C5. Even though these spin<br />
densities are sUghtly higher than GD samples in the very large and very small carbon<br />
content region [69], there is a good agreement between the spin densities in the<br />
intermediate carbon content range. The g-value decreases continuously with carbon
()<br />
2:<br />
><br />
b£<br />
t'gOOZ 61^00 3 ft'OOZ<br />
9n|BA-6<br />
6C002<br />
t'EOOS<br />
re<br />
><br />
(Q<br />
c£ lO<br />
(£ uj3/l.)Aiisuaa uids
102<br />
content (Fig. 5.5(b)) to almost take on the value for a carbon dangUng bond (~ 2.003)<br />
at the highest carbon content. Thus, the spin density in these samples is comprised of<br />
siUcon and carbon dangUng bonds. The discrepancy in the very small and very large<br />
carbon content region suggests that the carbon dangUng bonds may be poorly saturated<br />
in the co-sputtered films probably due to a lower hydrogen content.<br />
5.2 CW PL in a-Sii-xCx:H films<br />
The CW PL measurements were carried out at 25 K and the same excitation of<br />
2.28 eV was used for all the samples. This excitation energy was larger than the<br />
bandgap E^ for all the samples. Siebert et al. [70] have reported that for GD<br />
a-Sii_xCx:H fUms, there is a red shift in the PL peak energy accompanied by a<br />
narrowing of the PL band if excitation energies below E04 (the energy at which the<br />
absorption coefficient is 10^ cm~^) are used for samples with high carbon content. Since,<br />
for samples with C4 and C5, 2.28 eV excitation was below E04, we also recorded CW<br />
spectra with an excitation of a 2.8 eV Helium-Cadmium laser Une. On comparing the<br />
CW spectra with these two excitations, we did not find any red shift or narrowing of the<br />
spectra. The excitation density was kept less than ~ 10^^/cm^ to ensure monomolecular<br />
recombination kinetics [77]. Figure 5.6 shows normalized CW emission spectra in the<br />
composition range 0< x
103<br />
Energy (eV)<br />
Figure 5.6: NormaUzed CW PL spectra of a-Sii-rCx-H films for various<br />
values of x at 25 K
104<br />
carbon content are shown in Fig. 5.7. For x 0.45 both E^ and AEL change<br />
considerably. The plateau region for x
105<br />
o<br />
O<br />
CD<br />
d<br />
in<br />
• . Peak Emission Energy<br />
• Bandwidth<br />
^<br />
O<br />
LO<br />
>- ^<br />
o<br />
c<br />
LU<br />
g<br />
in<br />
o ^<br />
><br />
CD<br />
CO<br />
E<br />
LU<br />
.^<br />
CD<br />
CD<br />
o<br />
o<br />
CO<br />
d<br />
C<br />
CD<br />
lO<br />
CO<br />
o<br />
CO<br />
0.0 0.2 0.4 0.6<br />
Composition(x)<br />
0.8<br />
LO<br />
i.oo<br />
Figure 5.7: Change in peak energy(EL) and the bandwidth( AEL) of the CW<br />
spectra with carbon content in the film
106<br />
Li this equation, if we assume ( AEL)^,,^,^,, to be very smaU, then there should be a<br />
Unear correlation between AEL^ and (E^ - EL). We did not find any such a Unear<br />
relationship. Thus, the assumption about (AEL)^,,^^^,, being small may not be correct.<br />
In the other extreme, if we assume that the first term in Eq. (5.3) is small in comparison<br />
to the second term, then there should be a Unear correlation between AEL and<br />
(AEL)d„order- Duustau [16] has proposed a model in which (AEL)j„order is<br />
proportional to the Urbach energy of the film. According to this model<br />
{AEL)disorder ~ (2.45)^0. (5.4)<br />
If we plot AEL VS EO, it shows a Unear relationship with a slope of ~ 1.3 if the film C5<br />
is included and a slope of ~ 1.8 if it is excluded from the fit (see Fig. 5.8). The soUd Une<br />
and the dotted Une in the figure show the two fits with slope of 1.8 and 1.3, respectively.<br />
Even though these slopes are smaUer than those predicted by Dunstan [16], there is<br />
definitely a linear correlation between AEL and Eo. The small intercept supports the<br />
fact that electron-phonon interaction is very small and hence the Stokes shift is very<br />
smaU. Since the undoped a-Si:H fUm is included in these results, this supports the view<br />
that the dominant broadening mechanism in the a-Sii_xCx:H alloys and a-Si:H itself is<br />
the static disorder rather than dynamic disorder. Searle and Jackson [18] have shown<br />
that in GD a-Sii_xCx:H alloys (using data from Siebert et al. [70]) the slope of AEL<br />
versus Eo is around 2.9±0.3. This is larger than the values we found, but their films<br />
have larger Urbach energies and larger AEL- Thus, the correlation factor between AEL<br />
and Eo depends on the films, but the Unear relationship holds for aU fUms, indicating a
107<br />
o<br />
o<br />
in<br />
TT<br />
d~<br />
X<br />
^r 0<br />
^ ^ 0<br />
^r 0<br />
^ ^ 0<br />
^ 0<br />
y^ 0<br />
^ 0<br />
^4 0<br />
,-•<br />
><br />
^<br />
^<br />
r"<br />
B J<br />
•a -.<br />
•— o<br />
5 s-<br />
T3 O<br />
CD<br />
c<br />
CD<br />
_t<br />
a.<br />
0^4<br />
4f^^<br />
y^m<br />
y.<br />
^ 0<br />
^ 0<br />
0<br />
^ 0<br />
^ ^ 0<br />
^ 0<br />
^ 0<br />
^4 0<br />
_ ^ 0<br />
^ 0<br />
_ / 0<br />
y^ 0<br />
^ 0<br />
^r^ 0<br />
^ 0<br />
m<br />
•<br />
o<br />
0 ^<br />
0 ^ r<br />
4 ^<br />
0 ^<br />
4 y^<br />
0 ^r<br />
0 _^<br />
0 ^<br />
o<br />
o<br />
d-<br />
0.0 50.0 100.0 150.0 200.0<br />
Urbach Energy(meV)<br />
250.0 300.0<br />
Figure 5.8: Bandwidth of the CW spectra versus Urbach energy of the samples
108<br />
indicating a disorder broadening domination. Further support for disorder broadening of<br />
PL is presented in connection with a-SiNx:H films in Chapter VI.<br />
The change in peak energy and the bandwidth for these fUms is smaller than GD<br />
fUms of the same carbon content. This can be attributed to smaUer changes in bandgaps<br />
and Urbach energies with an increase in x, respectively. The similarity between the CW<br />
spectra of these films and those in a-Si:H indicates that the recombination mechanism in<br />
these materials is not drastically different from a-Si:H. This means than the origin of the<br />
main PL band can be ascribed [6] to radiative recombination between the carriers from<br />
the two bandtails. We also studied the temperature dependence of the CW PL spectra<br />
and found the same behavior as reported [79] in the Uterature. With increasing carbon<br />
content, the temperature dependence of the PL becomes progressively less pronounced<br />
and even vanishes for the highest carbon content.<br />
5.3 PL decays in a-Sii-xCx^H films<br />
In order to study the fast radiative and non-radiative recombination processes in<br />
these samples and compare with the results of a-Si:H, we studied the PL decay in<br />
0.1-50 ns time range. Figure 5.9 shows normaUzed PL decay curves for all the samples<br />
recorded at 25 K at an emission energy of 1.46 eV. As can be seen from the figure, for<br />
x
109<br />
0.0 10.0 20.0 30.0<br />
Time (ns)<br />
40.0 50.0<br />
Figure 5.9: Comparison of PL decays at 1.46 eV for various values of x at<br />
25 K
110<br />
the foUowing discussion we wiU treat the two groups, that is, films with x
Ill<br />
0.0 10.0 20.0 30.0 40.0 50.0<br />
Time (ns)<br />
Figure 5.10: Comparison of deconvoluted PL decays at 1.46 eV
112<br />
in<br />
d<br />
o<br />
ai<br />
At 25K<br />
LEGEND<br />
• x=0.65<br />
o x=0.33<br />
• x=0.00<br />
in<br />
c<br />
o<br />
o<br />
CJ<br />
(D<br />
><br />
^ i ^<br />
CD<br />
(D<br />
DC<br />
in<br />
^<br />
q<br />
in<br />
o<br />
d<br />
2*10'<br />
itf 10'<br />
Ufetime(ns)<br />
itf iiiaai^11<br />
10^<br />
Figure 5.11: Comparison of Ufetime distributions at 1.46 eV
113<br />
Composition(x)<br />
Figure 5.12: Variation in the relative contributions of the three Ufetimes to<br />
the PL decay at 1.46 eV with carbon content at 25 K
114<br />
Table 5.2: Comparison of ao for different x at 1.46 eV<br />
(For normalized intensity l(t=0) = 1)<br />
Carbon Content(x) ao<br />
0.00<br />
(5.0±0.7)E-2<br />
0.23<br />
(9.4±0.5)E-3<br />
0.33<br />
(8.9±0.5)E-3<br />
0.45<br />
(6.3±0.4)E-3<br />
0.65<br />
(2.1±0.2)E-3<br />
0.99<br />
0.0
115<br />
respectively. The comparison of corresponding Ufetime distributions is shown in<br />
Fig. 5.14.<br />
For samples C4 and C3, the contribution due to the third Ufetime is negUgible,<br />
while for sample CO, the third Ufetime dominates the distribution. These curves and<br />
distributions clearly show that the recombination at same thermalization depth is<br />
different for samples with different carbon content. With an increase in carbon content,<br />
the PL decay is dominated by short lifetime components, indicating effective<br />
thermalization of majority carriers to lower energies due to wider bandtails. If we<br />
compare distributions at different emission energies for the same sample, then we find<br />
that, for higher emission energy, the two short components dominate the decay as<br />
compared to the third component and the contribution due to ao decreases. These<br />
results clearly support a thermalization picture in which the efficiency of thermalization<br />
depends on the slope of the bandtails.<br />
Figure 5.15 shows a comparison of the Ufetime distributions obtained by fitting the<br />
PL decays with Eq. (3.19) for sample C5 at emission energies of 1.46 eV and 1.65 eV<br />
(~0.3 eV below the bandgap). The main difference between these distributions and the<br />
distributions for other samples is that the Ufetimes are shorter and there are only two<br />
peaks at both the emission energies. The two mean Ufetimes obtained from the best fits<br />
are given by n = 0.36 ± 0.1 ns and T2 = 1.1 ± 0.1 ns. The relative contribution of the<br />
first Ufetime is much higher (~ 90%) as compared to the second Ufetime (~ 10%) and<br />
the distributions at both the emission energies are very simUar. The contribution from<br />
the parameter ao at both the emission energies is zero, indicating a strong shift of the
116<br />
0.0 10.0 20.0 30.0 40.0 50.0<br />
Time (ns)<br />
Figure 5.13: Comparison of deconvoluted PL decays at a thermalization<br />
depth of ^ 0.3 eV
117<br />
LEGEND<br />
• x=0.65<br />
o x=0.45<br />
• x=0.00<br />
At 25K<br />
2*10<br />
Lifetime(ns)<br />
>#A|M<br />
10^<br />
Figure 5.14: Comparison of lifetime distributions at same thermaUzation<br />
depth
118<br />
in<br />
O<br />
in<br />
in<br />
oi<br />
x=0.99<br />
• At 1.65 eV<br />
• At 1.46 eV<br />
C<br />
o<br />
'^ o<br />
o<br />
CJ<br />
o<br />
><br />
^-^<br />
CD<br />
in<br />
r*<br />
5.0<br />
in<br />
CM<br />
o<br />
d<br />
10^<br />
Lifetime (ns)<br />
• • i^iidipu.a.<br />
10'<br />
Figure 5.15: Comparison of lifetime distributions at different emission energies<br />
for sample C5
119<br />
overall Ufetune distribution to shorter times. Lifetimes in the range of 200-230 ps have<br />
been reported [80] for a-Sii_xCx:H alloys with x=0.85. The strong shift of the overall<br />
distribution for large x has also been observed [70, 79] by other workers. The Urbach<br />
energy for this sample is very high and the edge width parameter value is very low,<br />
suggesting a severe flattening of the bands. As a result, the thermaUzation of carriers is<br />
very efficient and at the measured emission energies, the PL decay is dominated by only<br />
short lifetime components.<br />
Li<br />
Discussion<br />
The results from the previous section clearly show that the decays and the<br />
extracted Ufetime distributions in these a-Sii_xCx:H aUoys are very similar to a-Si:H for<br />
carbon contents lower than x=0.65. This similarity with a-Si:H suggests existence of<br />
similar excitonic recombination processes in these a-Sii_xCx:H alloys. We, therefore,<br />
discuss the results in terms of the model proposed for a-Si:H in the previous chapter.<br />
The main differences between a-Si:H and a-Sii_xCx:H fUms are the changes in<br />
Urbach energy, changes in the defect density and changes in the refractive index. Since<br />
the peak of the CW PL spectrum changes much more slowly than the width of the CW<br />
spectrum, it is quite clear that the electron-hole population maximum does not change<br />
much, but their distribution is much broader as compared to a-Si:H films. This means<br />
that the efficiency of thermalization is much better than in a-Si:H. So the increase in the<br />
bandgap is compensated by an efficient thermaUzation. Thus, bound excitons similar to<br />
a-Si:H can form in a-Sii_xCx:H and eventuaUy recombine radiatively to give nanosecond
120<br />
PL decay at similar emission energies. If we have to assign the three mean Ufetimes that<br />
we get in a-Sii_xCx:H to bound exciton recombination processes, then from Eq. (4.9) we<br />
should be able to justify why the lifetimes are similar to a-Si:H and why they remain so<br />
for the composition range 0
121<br />
For x=0.65, since the dielectric constant decreases by a factor of 2, if we assume the<br />
same hole wavefunction radii as in other fUms with lower carbon content, then to get the<br />
observed radiative rate, the electron wavefunction radius has to decrease by 10%. Such a<br />
small reduction can be easily justified because there is a reduction in the dielectric<br />
constant which increases the Coulomb interaction between the two carriers and reduces<br />
the separation. This means the electron wavefunction radius is reduced. So a sUght<br />
reduction in the electron wavefunction radius can compensate for the reduction in the<br />
dielectric constant for the sample with x=0.65. This results in radiative decay rates<br />
comparable to a-Si:H for the entire range 0
122<br />
needed to affect PL decays in the nanosecond range due to the smaller locaUzation<br />
length as proposed [82] in a-Sii_xGex:H. Since, in these films, we find that the Ufetimes<br />
are the same for 0
123<br />
shifted to high energy, but the CW spectrum consists of only one very broad band. The<br />
presence of a single band alone can not be used to rule out the possibility of clusters.<br />
Thus, the quenching of the overall Ufetime can be due to a quenching of either the<br />
radiative or the non-radiative component (Eq. 4.11). The quenching of the non-radiative<br />
lifetime is possible if the non-radiative tunneUng is enhanced due to a presence of<br />
clusters with a higher density of defects. The radiative lifetime can be quenched if there<br />
is a further decrease in the electron-hole separation due to an increase in the Coulomb<br />
interaction caused by a reduction in dielectric constant. Although this possibiUty has<br />
been suggested by some other workers [70], we feel that at present there is no way of<br />
distinguishing between these two possibilities from our results.<br />
As mentioned before, this is the first PL characterization of co-sputtered<br />
a-Sii_xCx:H films. Even though qualitatively the properties of these films are very<br />
similar to GD fUms, the overall compositional disorder seems to be smaller than in GD<br />
films for the same carbon content as pointed out in the previous section. The disparity<br />
in hydrogen content may be a major factor contributing to these differences. Most of the<br />
previous time-resolved work in a-Sii_xCx:H fUms [80, 85] has concentrated on films with<br />
very high carbon content (x>0.8) and there is only one systematic investigation by<br />
Siebert et al. [70] of PL decays with variation of carbon content. They measured<br />
integrated PL decays and due to the temporal resolution of their measurement, the<br />
investigation was Umited to 0
124<br />
Siebert et al. [70] have found that the peak of the lifetime distribution changes<br />
from ~ 10"^ - 10"® s when carbon content is changed from x=0.0 to x=0.47. In our<br />
results this shift in the distribution is reflected in the increase in the relative<br />
contribution of the shorter two Ufetimes as compared to the third lifetime and a<br />
reduction in the parameter ao. They have suggested that the decrease in Ufetimes is due<br />
to smaller electron-hole separations and proposed faster thermalization of carriers due to<br />
wider bandtails and stronger Coulomb attraction between the carriers as the two<br />
possible causes for smaller separations. Masumoto et al. [85] have studied the PL decay<br />
in a-Sii_xCx:H fUms with x=0.8 and reported a radiative decay rate of 5.5x10® s~* and<br />
proposed an exciton-Uke recombination process. Similarly, Nakazawa et al. [80] have<br />
studied a-Sii_xCx:H fUms with x=0.85 and reported lifetimes in the range of 200-230 ps.<br />
They have suggested very small electron-hole separations to be the origin of such short<br />
Ufetimes, which imply an excitonic recombination.<br />
The most surprising result from this work is that with addition of carbon, upto<br />
x=0.65, there is no significant change in the Ufetimes for the dominant recombination<br />
processes in this time scale (50 ns). If as proposed [51] in a-Si:H, these are excitonic<br />
processes, then our results seem to suggest that these processes are linked to some short<br />
range aspects of the siUcon network and are affected only when the network undergoes<br />
major structural changes. This is consistent with the exciton picture because an electron<br />
and hole in an exciton (separated by a small distance) wiU be very insensitive to changes<br />
in the surroundings until the correlation length of disorder becomes comparable to their<br />
separation. The changes in relative contributions of these components with carbon
125<br />
content indicate different thermaUzation rates due to wider bandtails. One important<br />
point which must not be overlooked is that aU the peaks in the lifetime distribution are<br />
quite broad, so the three processes that we have been referring to are the dominant<br />
processes, but a spread of Ufetimes around these lifetimes is also possible. At present,<br />
our results in a-Si:H and a-Sii_xCx:H seem to indicate that the Ufetime distribution in<br />
the range 0.1-50 ns is not featureless as it is generaUy assumed to be.
CHAPTER VI<br />
PHOTOLUMINESCENCE IN a-SiNx:H<br />
Introduction of nitrogen in a-Si:H allows a wide range of variation of the optical<br />
gap depending on the nitrogen content. So a-SiNx:H alloys can be used as possible wide<br />
gap window layers in solar ceUs or as passivation layers in other electronic devices such<br />
as thin film transistors [86]. Even though nitrogen is a group five element, unUke<br />
phosphorus, it enters the a-Si:H matrix in threefold coordination and does not appear to<br />
be a very effective dopant. It forms a wide range of a-SiNx:H aUoys with a ma^mum x<br />
value given by approximately 1.1 [87]. As a result of this different coordination, the<br />
properties of these alloys are different than the a-Sii_xCx:H alloys discussed in the<br />
previous chapter. Thus, these a-SiNx:H aUoys provide another simple system to explore<br />
the effects of chemical disorder on PL in a-Si:H.<br />
There have been a number of studies of growth and properties of glow discharge<br />
prepared a-SiNx:H alloys [88, 89]. Previous work on PL in these alloys has estabUshed<br />
[68, 87, 90] that the main PL band broadens and exhibits a blue shift with an increase in<br />
nitrogen content. The shift in the peak energy has been shown to scale with the increase<br />
in the bandgap [68] and the increase in PL bandwidth has been attributed to bandtails<br />
broadened by chemical disorder. However, most of these measurements have<br />
concentrated either on steady state measurements or slower time resolved measurements<br />
[91, 92]. The only investigations on nanosecond fast PL decays have been performed on<br />
superlattice structures [93]. In this chapter we report a study of CW PL and<br />
nanosecond PL decays in siUcon-rich a-SiNx:H aUoys [94].<br />
126
127<br />
As mentioned in Chapter II, all the films used in this work were prepared using<br />
glow discharge decomposition of NF3 and SiH4, in which the ratio ^= siH^+NFs ^^<br />
varied from 0 to 0.15 while keeping the total gas flow constant. Four fUms with different<br />
nitrogen contents along with a corresponding undoped a-Si:H film were used for these<br />
measurements. The nitrogen content of the films was determined using Rutherford<br />
Backscattering (RBS) and the hydrogen content in the films was measured using Elastic<br />
Recoil Detection (ERD) at Sandia National Laboratory. Table 6.1 gives the correlation<br />
between the ratio R and the nitrogen as well as hydrogen content. The defect densities<br />
of the samples were measured with samples simultaneously deposited on plain glass<br />
using the constant photocurrent method (CPM).<br />
The nitrogen content in the fUms is the average for the top ~ 1300 A of the films<br />
and at larger depths the signal is obscured by the hydrogen signal. The percentage<br />
content calculations have been based on the standard density of silicon (~5xl0^^/cm''),<br />
but for a-SiNxiH alloys a reduction in density is reported [95], so the exact numbers for<br />
contents may be different. From Table 6.1, it can be seen that the nitrogen content<br />
increases continuously with an increase in R, but apart from the initial increase, the<br />
hydrogen content does not vary much with R. The initial increase in hydrogen content<br />
can be associated with higher deposition rates [34]. High deposition rates are associated<br />
with high defect and microvoid densities due to formation of Si-H„ type bonding. Since<br />
large quantities of hydrogen can be trapped at these sites, the hydrogen content in the<br />
film can be large. The subsequent leveUng off may be due to efficient scavenging of
128<br />
Table 6.1: Correlation between R and N,H content<br />
NFO<br />
NFl<br />
NF2<br />
NF4<br />
NF5<br />
NF3+SiH\<br />
0.0<br />
0.03<br />
0.06<br />
0.12<br />
0.15<br />
N Content<br />
(%)<br />
0.0<br />
5.0<br />
7.0<br />
10.0<br />
13.0<br />
H Content<br />
(%)<br />
11.0<br />
25.0<br />
26.3<br />
25.0<br />
29.5
129<br />
hydrogen by fluorine. The amount of fluorine in the films was low and could not be<br />
determined using ERD.<br />
6.1 Variation of parameters with nitrogen content<br />
Figure 6.1 shows the variation of the optical gap with an increase in nitrogen<br />
content. As previously observed, the bandgap increases with an increase in nitrogen<br />
content [90]. The bandgap increased from 1.67 eV for sample NFO to 2.08 eV for NF5.<br />
Since nitrogen is more electronegative than siUcon, the silicon atom forming a Si-N bond<br />
becomes positively polarized. Due to this polarization, the Si-Si bonding energy<br />
increases, which results in a upward shift of the antibonding state causing an increase in<br />
the bandgap. On comparing these results with co-sputtered a-Sii_xCx:H films (see<br />
section 5.1), we find that, for similar bandgap changes, a much higher carbon content is<br />
required. Changes in the Urbach energy and the edge width parameter with nitrogen<br />
content are depicted in Fig. 6.2. Similar to the a-Sii_xCx:H samples, the Urbach energy<br />
of these samples increases with an increase in nitrogen content. Thus, introduction of<br />
nitrogen broadens the bandtails and increases the compositional disorder. In this case<br />
again, for the same changes in Urbach energy, much larger carbon content is required<br />
than nitrogen content. The increase in Urbach energy is accompanied by a reduction in<br />
the edge width parameter (see Fig. 6.2), suggesting a flattening of the bands with<br />
increasing nitrogen content. This result is sUghtly different from co-sputtered<br />
a-Sii_ C :H films, where the edge width parameter first stays constant and then<br />
decreases at higher carbon content. The refractive index derived from absorption
130<br />
0.00 0.03 0.06 0.09<br />
Composition(x)<br />
0.15<br />
Figure 6.1: Variation of optical gap with nitrogen content
131<br />
o<br />
d<br />
(O<br />
o<br />
o<br />
.•<br />
o<br />
L<br />
• '<br />
o<br />
[meV)<br />
120.0<br />
Energyl<br />
Urbach<br />
80.0<br />
•<br />
•<br />
^"x^^<br />
^•.^^<br />
_.•<br />
Lo «^<br />
CO<br />
o<br />
O<br />
S<br />
LTD<br />
><br />
(D<br />
I<br />
E<br />
o<br />
^<br />
ID<br />
GO<br />
o<br />
o<br />
(<br />
...•'<br />
• Urbach Energy(meV)<br />
r • Edae Width Darameter<br />
0.00 0.03 0.06 0.09<br />
Composition(x)<br />
0.12<br />
O<br />
CO<br />
o<br />
o<br />
LD<br />
O.lS<br />
Figure 6.2: Change in Urbach energy and the edge width parameter with<br />
nitrogen content
132<br />
measurements shows a continuous reduction by a factor of two across the five samples<br />
studied here. These results suggest that the roles of nitrogen and carbon are different in<br />
their respective alloys with a-Si:H and that nitrogen introduces more disorder than<br />
carbon for the same concentration.<br />
The variation of defect density with nitrogen content is shown in Fig. 6.3. There<br />
may be some uncertainty in the absolute defect densities due to use of the same scaling<br />
constant as undoped a-Si:H films, for converting excess absorption into defect densities.<br />
However, we expect the trends in defect densities to be correct. Thus, in the films<br />
studied here, the defect density increases with an increase in nitrogen concentration.<br />
This is consistent with previous measurements [86]. The increase is normally assigned to<br />
an increase in silicon dangling bonds and not to nitrogen dangling bonds [96].<br />
6.2 CW PL in a-SiNx:H films<br />
Figure 6.4 shows a comparison of CW spectra of the five fUms used in this work. It<br />
can be seen that the peak energy increases with an increase in nitrogen content. The<br />
variation of the PL peak energy and the PL bandwidth as a function of nitrogen content<br />
is shown in Fig. 6.5. The PL bandwidth increases by a factor of three as x increases<br />
from 0 to 0.13. These results are consistent with blue shift and broadening of the<br />
spectra reported by other groups in the Uterature [87].<br />
A plot of the CW bandwidth as a function of the Urbach energy of the films is<br />
shown in Fig. 6.6. The soUd Une shows the best fit using a Unear relation between these<br />
two quantities. The slope of this Une is 2.7, which is very close to the value proposed by
133<br />
0.00 0.03 0.06 0.09<br />
Composition(x)<br />
0.12 0.15<br />
Figure 6.3: Defect density versus nitrogen content
134<br />
CM<br />
d<br />
LEGEND<br />
x=0.00<br />
x=0.05<br />
'x=0.07"<br />
x=o:io'<br />
x=0.i3<br />
CO<br />
c<br />
JO<br />
S CO<br />
^^ d<br />
*C0<br />
o<br />
c<br />
CO<br />
d<br />
o<br />
d<br />
1.1 2.1<br />
Energy (eV)<br />
Figure 6.4: Comparison of CW PL spectra for films with different nitrogen<br />
content
i.T)<br />
in<br />
in<br />
00<br />
d<br />
Peak Emission Energy<br />
Bandwidth<br />
><br />
CD<br />
CO<br />
(D<br />
C<br />
LU<br />
><br />
(D<br />
CO<br />
CO<br />
LU in<br />
CO<br />
CO<br />
Q.<br />
CN<br />
d<br />
C<br />
CD<br />
in<br />
CM<br />
0.00 0.03 0.06 0.09<br />
Composition(x)<br />
0.12 o.iP<br />
Figure 6.5: Change in PL peak energy and PL bandwidth with nitrogen<br />
content
136<br />
0.04 0.08 0.12<br />
Urbach Energy(eV)<br />
0.16<br />
Figure 6.6: Correlation between CW PL bandwidth and Urbach energy
137<br />
Dunstan [16]. As discussed in section 5.2, the Unear correlation between the Urbach<br />
energy and CW PL bandwidth and a smaU intercept of this Une on the y-axis, indicate<br />
that in these alloys static disorder broadening is dominant over the phonon broadening.<br />
Since the corresponding undoped a-Si:H film also obeys this correlation, it is quite<br />
possible that the same static disorder is dominant even in undoped a-Si:H. The exact<br />
relationship between the PL bandwidth and the Urbach energy seems to depend on the<br />
type of fUms and the deposition conditions, but the Unear correlation exists. These<br />
results, along with similar results in a-Sii_xCx:H fUms, reported in the previous chapter,<br />
seem to support Searle and Jackson's [18] explanations of disorder broadening.<br />
For all samples, the PL intensity reduces with an increase in temperature, but the<br />
temperature dependence becomes progressively less pronounced as the nitrogen content<br />
is increased. This is very similar to the behavior of a-Sii_xCx-H films and is consistent<br />
with previous measurements [87].<br />
6.3 PL decays in a-SiNx:H films<br />
In order to compare with the results of a-Si:H and a-Sii_xCx:H, we recorded the<br />
PL decays in these samples in the 0.1-50 ns time range. Figure 6.7 shows normalized PL<br />
decay curves for all the samples recorded at 25 K at an emission energy of 1.46 eV. The<br />
decay curves show small but systematic changes with nitrogen content, but the general<br />
form of the curve remains similar to that of a-Si:H (x=0) confirming that recombination<br />
kinetics are not too different even after alloying in this nitrogen content range. Since it<br />
has been reported [91] that the Ufetime distributions in these alloys also span a wide
138<br />
O<br />
o<br />
o<br />
CD<br />
O<br />
o<br />
GO<br />
CM<br />
x=0.00<br />
x=0.05<br />
x=0.07"<br />
x=0.13<br />
i2o<br />
•p o<br />
§ o<br />
H CD<br />
o en<br />
CD<br />
si<br />
o<br />
CM<br />
CO<br />
J<br />
0.0 10.0 20.0 30.0<br />
Time (ns)<br />
40.0 50.0<br />
Figure 6.7: Comparison of decays for different nitrogen contents at 1.46 eV
139<br />
range from 10~® -10~^ s, similar to a-Si:H, we can use the same approach to model these<br />
decays in the nanosecond time range and use Eq. (3.19) to fit the decays. A comparison<br />
of lifetime distributions obtained by fitting with Eq. (3.19) for samples NFl, NF4 and<br />
NF5 is shown in Fig. 6.8. As can be seen from the distributions, the best fits to the PL<br />
decay using Eq. (3.19) yield three peaks corresponding to dominant channels of<br />
recombination with mean Ufetimes given by ri = 0.8 ± 0.2 ns, T2 = 3.5 ± 0.5 ns and<br />
T3 = 14 ± 3 ns for all the samples in this composition range. These mean Ufetimes are<br />
comparable to the ones found in a-Si:H as well as a-Sii_xCx:H films. So we propose that<br />
there are similar excitonic processes in these alloys. As in the a-Sii_xCx:H alloys, with<br />
an increase in nitrogen content, the dielectric constant of the films decreases and the<br />
Coulomb interaction between the thermaUzing electrons and holes increases. This can<br />
reduce the electron wavefunction radius sufficiently to account for the decrease in<br />
dielectric constant. In this situation, the mean lifetimes of the three components do not<br />
change with nitrogen content according to Eq. (4.9).<br />
The mean lifetimes do not change over this composition range, but the relative<br />
contributions of the three lifetimes are sUghtly different for different nitrogen content.<br />
The relative contribution of ri decreases, while that of the other two Ufetimes increases<br />
with an increase in nitrogen content. This trend is opposite to the one seen in<br />
a-Sii-xCx^H alloys, in which at the same emission energy with an increase in carbon<br />
content the contribution of the first Ufetime increases and the longer Ufetime decreases.<br />
In addition, the changes themselves are very small as compared to a-Sii_xCx:H alloys.<br />
This indicates that the thermalization in a-SiNx:H aUoys is not as eflficient as in
140<br />
LEGEND<br />
x=0.05<br />
x=^o:io<br />
• x=0.13<br />
2*10 10<br />
Lifetime(ns)<br />
Figure 6.8: Comparison of Ufetime distributions for samples NFl, NF4 and<br />
NFS
141<br />
a-Sii_xCx:H alloys. The increase in band gap and the increase in Urbach energy<br />
compete with each other as far as the thermaUzation of carriers is concerned. The<br />
increase in bandgap means that at a fixed emission energy, we are looking at carriers<br />
which have thermaUzed to different thermalization depths. The thermalization depth<br />
increases with an increase in bandgap and the carriers are more locaUzed. As a result,<br />
the recombination processes with longer Ufetimes dominate the faster processes.<br />
With an increase in nitrogen content, the bandgap as well as Urbach energy of<br />
these films increase considerably and this is clearly reflected in the blue shift and<br />
broadening of the CW spectra. However, the PL decays in the nanosecond time range<br />
do not reflect similar substantial changes with respect to each other. Thus, it seems as if<br />
the electron-hole population which recombines on this time scale is not affected much by<br />
an increase in nitrogen content. It has been suggested that at higher nitrogen content<br />
there are anti-parallel bandgap fluctuations in these aUoys [87, 97, 98]. Thus, there are<br />
different bandgaps and bandtails at different spatial locations and what is measured<br />
with optical absorption measurements is an average over all such locations. At some of<br />
these locations these alloys are more a-Si:H-Uke than others. At a particular emission<br />
energy, the contribution to PL might be from different regions. For the emission energy<br />
in question, it is possible that we are tuning to a-Si:H-rich regions and as a result, the<br />
PL is very similar to a-Si:H in the nanosecond region. The total CW PL is more<br />
representative of the average over all such different locations and hence shows<br />
substantial changes with a change in nitrogen content.
142<br />
Another possibility for the insensitivity of the nanosecond PL decays to nitrogen<br />
content may be that at these nitrogen contents, the disorder length is stiU not<br />
comparable to the small separations between the recombining electron-hole pairs in the<br />
excitons. As in a-Sii_xCx:H films, at higher nitrogen contents, when the entire network<br />
undergoes substantial changes, these fast recombination processes might be affected<br />
significantly. An unknown variable in this is the role of fluorine in these alloys. Although<br />
we know that the fluorine content in the films is very small, we can not be sure that it<br />
does not play any part in making the fast PL decays insensitive to nitrogen content.
CHAPTER Vn<br />
ELECTRIC FIELD QUENCHING OF CW PL IN a-Si:H<br />
As discussed in Chapter I, there is a controversy about whether the recombination<br />
in a-Si:H is geminate or non-geminate. In the geminate pair model, it is assumed that<br />
diffusion during thermalization does not separate the photoexcited electrons and holes,<br />
so the recombination occurs between geminate pairs [6]. In the non-geminate pair<br />
model, it is assumed that the carriers are able to diffuse and are trapped at random in<br />
the bandtail states [16]. In this case, the carriers recombine with the nearest available<br />
partner, which is a non-geminate process. Common to both models is that the<br />
recombination occurs by radiative tunneUng and that, therefore, the distribution of<br />
intra-pair separations causes a broad distribution of lifetimes. However, the two models<br />
lead to distinctively different consequences for the transport of carriers. A geminate pair<br />
does not contribute to the photoconductivity (PC) whereas a non-geminate pair does. It<br />
is therefore a typical feature of the geminate pair model that PL and PC are competing<br />
processes; only those carriers can contribute to photoconduction which escape geminate<br />
recombination. In order to be able to decide between these two possibiUties, it is<br />
necessary to study the relation between PL and PC in more detail by measuring them<br />
simultaneously.<br />
7.1 Results and Interpretation<br />
Figure 7.1 shows the variation of PL intensity and PC as a function of temperature.<br />
As can be seen from the figure, the PL and PC show opposite trends with temperature.<br />
The PL increases while the PC decreases with a decrease in temperature. This trend<br />
143
14-1<br />
f<br />
1.00<br />
'co<br />
4—»<br />
'E<br />
Zj<br />
CD<br />
d-<br />
1) to<br />
>»°<br />
*-*<br />
*><br />
"5<br />
3<br />
Photocond<br />
0.2 0.4<br />
1 1<br />
•<br />
• /<br />
* /<br />
•-. /<br />
1 \<br />
I \<br />
•.._<br />
A<br />
>....<br />
• Photoconductivity<br />
• PL Intehsitv<br />
o<br />
- 00<br />
d<br />
o - CD<br />
d<br />
20 0.40<br />
o<br />
CO<br />
'E<br />
•55<br />
CO<br />
c<br />
(D<br />
o<br />
d_<br />
(<br />
D.005 0.015<br />
0.025 0.035 0 C<br />
)4S)<br />
1/T(1/K)<br />
o<br />
- o<br />
Figure 7.1: Variation of PL and PC with temperature
145<br />
with temperature can be explained with geminate as well as the distant pair model.<br />
With increasing temperature, the carriers can become more mobile, which can lead to a<br />
loss of electron-hole correlation, thus decreasing the PL intensity in the geminate pair<br />
model. However, the probability of a carrier finding a center for non-radiative<br />
recombination also increases with an increase in temperature, so the PL intensity<br />
according to the distant pair model can also decrease. Thus, with temperature<br />
dependence alone it is diflScult to decide between the two types of processes and a field<br />
dependence measurement is necessary.<br />
For this study, undoped a-Si:H films of high quality were deposited by the<br />
glow-discharge technique. The electric field was varied from 10^-4x10^ V/cm. The<br />
excitation energy used for these measurements was 1.96 eV. An excitation intensity of<br />
3xl0^^/cm^ was used in these experiments. Figure 7.2 shows a comparison of the PL<br />
spectrum before and after appUcation of the electric field (3x10'* V/cm) at 100 K. As<br />
can be seen, there is a significant quenching of CW PL intensity with electric field. The<br />
quenching is not the same at aU emission energies as can be seen from the comparison of<br />
the normalized PL spectrum before and after applying electric field (see Fig. 7.3).<br />
In order to quantitatively compare between the PL intensities before and after<br />
applying an electric field, we use the area under the PL spectrum (integrated intensity)<br />
and define a quantity<br />
AI IPL{F) - IPL{0) ._^.<br />
ITL' IPL{0) ' ^'-'^<br />
where F is the appUed electric field and IPL is the integrated PL intensity. Since there is<br />
a reduction in intensity with electric field, this quantity is negative. So in further
146<br />
O<br />
d<br />
in<br />
O<br />
d<br />
CO<br />
• ^M^<br />
c<br />
3<br />
x><br />
^»<br />
3<br />
>^<br />
^^<br />
CO<br />
c<br />
CD<br />
O<br />
O<br />
CO<br />
o<br />
CM<br />
o<br />
d<br />
o<br />
d<br />
1.4<br />
Energy (eV)<br />
Figure 7.2: Comparison of un-normaUzed CW PL spectra with(bottom<br />
curve) and without(top curve) electric field at 100 K
147<br />
1.1 1.2 1.3 1.4 1.5<br />
Energy (eV)<br />
1.6 1.7<br />
Figure 7.3: Comparison of normaUzed CW PL spectra with(dotted Une) and<br />
thout(solid line) electric field at 100 K<br />
wi
148<br />
discussion we wiU use --^<br />
for convenience. Figure 7.4 shows a plot of-;p^ agsunst the<br />
electric field on a log-log scale at three different temperatures. The quantity -^<br />
exhibits a power law dependence of the form<br />
^ oc F^, (7.2)<br />
for electric fields in the range of lO'^V/cm < F < 4xlO'*V/cm. The value of 7 that fits<br />
the results at aU the three temperatures is ~1.3. For a constant field, -^ increases<br />
with an increase in temperature. The largest change that we see at 100 K is of the order<br />
of 45-50%. These results are different from those of Fuhs et al. [56] who have reported<br />
changes of 10-15% for the same field and temperature range. They also find a power-law<br />
dependence on field, but the exponent they found was '^ 2. The variation of PC with<br />
electric field in the same temperature range is shown in Fig. 7.5, while the changes in<br />
PC ( ^^fnO are plotted against the field in Fig. 7.6.<br />
The quantity ^ ^<br />
also exhibits a power-law dependence on electric field, but the<br />
exponent decreases with an increase in temperature. The changes in the PC are plotted<br />
against the changes in PL at the three temperatures in Fig. 7.7. They show a good<br />
Unear correlation with the slopes of the Unes decreasing with increasing temperature.<br />
This indicates that PC and PL are competing processes. As discussed before, this type<br />
of behavior is typical of geminate recombination, where radiative recombination occurs<br />
between correlated electron-hole pairs and photoconduction occurs only when pairs are<br />
broken which can be achieved either thermally or with appUcation of an electric field.<br />
Figure 7.8 shows the excitation intensity dependence of the PL intensity with and<br />
without electric field. The intensity used in this work corresponds to 1 in this figure.
149<br />
Field(V/cm)<br />
Figure 7.4: --^ versus Field for 60 K(fiUed circles), 80 K(open circles),<br />
100 K(fiUed squares)
150<br />
10 10*<br />
Field{V/cm)<br />
Figure 7.5: PC versus Field for 60 K(filled circles), 80 K(filled squares),<br />
100 K(open squares)
151<br />
3*10<br />
Field(V/cm)<br />
Fi
152<br />
0.1 0.2 0.3 0.4<br />
Relative Change in PL(arb.units)<br />
7 ,. ^^r.versus --^for 60 K(filled circles), 80 K(open circles),<br />
Figure
153<br />
CO<br />
'c<br />
3<br />
JD<br />
CO<br />
•co O<br />
c ^<br />
o<br />
•p-<br />
?^<br />
6*10<br />
Excitation Intensity(arb.units)<br />
Figure 7.8: PL intensity versus excitation intensity with 0 V/cm(fiUed circles)<br />
and with 3xlO''V/cm(filled squares)
154<br />
The two curves exhibit a linear dependence on excitation intensity until 3Io, but after<br />
that they have different slopes, indicating a dependence of--^^ on excitation intensity.<br />
The change in slope in this figure indicates a monomolecular to bimolecular change in<br />
recombination kinetics. Our measurements are cleariy in the monomolecular region and<br />
scale linearly with excitation intensity.<br />
7.2 Discussion of Results<br />
Paesler et al. [55] suggested that in sputtered a-Si:H, the field quenching of PL<br />
occurs by a Poole-Frenkel (PF) effect. In the PF effect, the potential energy of a system<br />
of a positively charged donor and an electron in the presence of an electric field can be<br />
written as<br />
U{r) = --^ efr, (7.3)<br />
47re€or<br />
where r is the separation between the donor and the electron and F is the appUed<br />
electric field. The applied electric field lowers the activation energy required for the<br />
electron to be excited to the mobiUty edge. The maximum lowering occurs at the<br />
maximum of this potential energy which occurs at<br />
rm<br />
V 4W€€oF'<br />
The maximum lowering in activation energy is equal to<br />
AU = J— = 0^^• (7.5)<br />
V 7r€€o<br />
In order to verify this, in Fig. 7.9, the change - ^<br />
is plotted as a function of inverse<br />
temperature with and without field. The value of IPL(O) for the two curves is equal to
155<br />
0.005 0.010 0.015 0.020 0.025 0.030<br />
1/Temperature(1/K)<br />
Figure 7.9: -^ versus<br />
3xlO''V/cm(filled squares)<br />
1/T with 0 V/cm(filled circles) and with
156<br />
IpL (T=25 K,F=0). In the region between 50 K to 100 K, there is a decrease in the<br />
activation energy, as can be seen from the slopes of the two curves. Although this is in<br />
qualitative agreement with the PF effect, the change in activation energy is only 4 meV.<br />
This is much smaUer than the theoreticaUy expected value from the PF effect. In<br />
addition, if the change -^ is plotted as a function of \/F (see Fig. 7.10), it gives a<br />
Unear correlation in the high field region, but the slopes of the Unes do not decrease with<br />
an increase in temperature as predicted by the PF model. The PF model expects the<br />
slope at a constant temperature to be inversely proportional to temperature (oc ;^).<br />
Since this is not the case, an explanation based on a one-dimensional PF effect seems<br />
unUkely. Another condition for the PF effect to occur is that the states from which<br />
electrons are emitted should be charged when empty. This is not the case for the<br />
tail-states in a-Si:H. Therefore, alternative explanations must be sought.<br />
In order to explain the temperature dependence of the CW PL intensity in a-Si:H,<br />
Park et al. [99] have proposed the presence of radiative centers with a negative charge.<br />
They suggest that these centers have very large hole capture cross-sections at<br />
temperatures below 100 K. They further propose that the capture cross-sections for the<br />
radiative centers decrease rapidly with increasing temperatures as T"'''. In this model,<br />
the quantum efficiency of PL is governed by the proportion of holes captured initially by<br />
the radiative centers and by the process of the release of holes from these centers. The<br />
captured holes then recombine with electrons from conduction bandtails. The rate of loss<br />
of holes from the radiative centers rises in accordance with ~ exp {T/To). This leads to<br />
IPL<br />
I{T)<br />
- 1 (X exp {T/To) T > 100 A', (7.6)
15:<br />
90.0 115.0 140.0 165.0 190.0 215.0<br />
Field''0.5((V/cm)''0.5)<br />
Figure 7.10: -^^ versus F^/^ for60 K(filled circles), 80 K(open circles),<br />
100 K(filled squares)
and<br />
158<br />
j~r - 1 a r^ T < 100 K. (7.7)<br />
Equation (7.6) is the same as Eq. (1.18) in Chapter I written sUghtly differently. They<br />
have reported that the exponent 7 was between 3-4 for undoped a-Si:H samples. If we<br />
plot the quantity on the left hand side of Eq. (7.7), we get a value of 7 of 3.5 which is in<br />
agreement with their results (see Fig.7.11). In the two curves the quantity (;^ - 1) was<br />
calculated with two different IPL(O) values to isolate field and temperature quenching<br />
effects. For the first case, in which no field was appUed IPL(0)=IPL (T=25 K,F=0) and<br />
in the second case IPL(0)=IPL (T=25 K,F=3xlO'*V/cm). This shows that at constant<br />
field, the temperature quenching is not affected and exhibits the same form as that<br />
without field. The quantity j ^ - 1 shows a power-law behavior with an exponent in<br />
the range 3-4 for all the samples with and without field.<br />
The quantity j ^ - 1 is sUghtly different from the change -^ defined earlier. This<br />
becomes obvious if the PL intensity is expressed as<br />
where Ip^ is the value of PL intensity at lowest temperature (where it is almost<br />
constant), and P^ and Fnr are the radiative and non-radiative recombination<br />
probabilities, respectively. Then the quantity on the left hand side of Eq. (7.7) is<br />
and the change -pJ- is<br />
'''' - 1 = ^ (7.9)<br />
I{T) Pr<br />
l l = P ^ - (^-^O)<br />
nr
159<br />
4*10<br />
Temperature(K)<br />
Figure 7.11: - j ^ - 1 versus temperature with 0 V/cm(filled circles) and<br />
with 3xlO'*V/cm(filled squares)
160<br />
Thus, these two quantities are related to each other, but depending on the ratio ^,<br />
they could be similar or very different. For low defect density samples at lower<br />
temperatures where the ratio ^ is smaller than 1, ;^ and ( ^ - 1) show different<br />
temperature dependence. The field dependence of ( ^<br />
- 1) shows a power-law with an<br />
exponent of 1.6-1.7 for all three temperatures (see Fig.7.12).<br />
We propose an addition to the model of Park et al. [99] that the capture<br />
cross-section of these radiative centers changes with the appUcation of an external<br />
electric field. Since these centers possess a charge, the capture mechanism involves<br />
Coulomb attraction of holes. With the appUcation of electric field, there is a reduction<br />
in the capture cross-section of these radiative centers or the probability of emission of<br />
holes from these centers is enhanced. The microscopic mechanism for this process can be<br />
an equivalent of the PF effect for the acceptor-hole system instead of donor-electron<br />
system. With an increase in the external field, the number of holes trapped in these<br />
centers decreases and so does the quantum efficiency of PL. Then the capture coefficient<br />
in the model proposed by Park et al. [99] obeys<br />
PL{F,T) ex T-'''F-'^ (7.11)<br />
where 71 is between 3-4 and 72 is ~ 1.6-1.7. In this model, the final recombination can<br />
be still between geminate pairs, i.e., the hole captured by the radiative center can still<br />
recombine with its geminate partner electron from the conduction bandtail states as is<br />
necessary to explain the competition between PL and PC.<br />
Even without detailed knowledge of field effect or phototransport, Fuhs et al. [56]<br />
have proposed an argument to determine the quantum efficiencies of various processes.
161<br />
Field(V/cm)<br />
Figure 7.12: -jf^ - 1 versus electric field for 60 K(filled circles), 80 K(open<br />
circles), 100 K(filled squares)
162<br />
We think that this argument holds in the temperature and field range of our<br />
experiments. Therefore, we wiU adopt their argument for explanation of the<br />
proportionality of changes in PL and PC. At low temperatures, the PL quantum<br />
efficiency of high quality a-Si:H amounts to about 0.3. If the non-radiatively recombining<br />
pairs were all non-geminate and thus contributed to photoconduction, rjpc would have to<br />
be as large as 0.7. In this case, field quenching of the entire PL intensity could cause an<br />
enhancement of CTpc by 50% only. The results of our experiments show that the smaller<br />
changes in PL are related to much larger changes in PC. This suggests an alternative<br />
explanation in which the quantum efficiency for generation of geminate pairs, T/^, is near<br />
1 and Tjpc is very small at low temperatures. Since the PL quantum efficiency is not<br />
more than 30%, the recombination of geminate pairs must have a radiative path and a<br />
non-radiative path, rjg = Tjg^ •{• T/J"*". Then the following expressions are appUcable<br />
V + %"' + V = l' (7-12)<br />
I = rj/G, (7.13)<br />
(Tpc = erjpcGfjLT, (7.14)<br />
where G is the generation rate and /xr the mobiUty-Ufetime product. The main<br />
assumption is that the PL intensity and Opc vary with temperature and electric field by<br />
changes of the quantum eflftciencies. In addition, if it is assumed that the electric field<br />
does not influence the fiT product and the ratio rjg^/Vg'^'' then it can be shown that<br />
_A^^_(1-V)A/^ (7.15)<br />
^pc(O) rjpc JpL
163<br />
which relates the changes between PC and PL Unearly as required by our results. So<br />
from the slopes of ^ ^ vs ^ curves at different temperatures, the quantum efficiency<br />
of PC can be estimated. It increases with temperature which is consistent with our<br />
results.<br />
In this derivation, it is important that the mobiUty-Ufetime product should not be<br />
affected by the appUed electric field. At very high fields (>5xl0'* V/cm), this<br />
assumption may not be valid. In a-Si:H it has been reported [100] that the mobiUty<br />
becomes a function of electric field at higher fields. In this case Eq. (7.15) is not vaUd<br />
and the thermalization of carriers in bandtails is affected, which can affect the transport<br />
of carriers first which changes the recombination in turn. In this situation, the<br />
anti-correlation between PL and PC does not necessarily imply that the recombination<br />
is geminate.<br />
The nature of these radiative centers determines the exponents of the capture<br />
coefficient. With different dopants and higher defect densities the properties of these<br />
radiative centers could be different, which may change the observed temperature and<br />
field dependence of field and temperature quenching. The result that the PL on the high<br />
emission energy side is more affected than the low emission energy side could indicate<br />
that the radiative centers are shallow centers. With a significant increase in defect<br />
density, the direct non-radiative transition rate may increase, thus decreasing the<br />
number of holes getting captured at the radiative centers and the changes in PL with<br />
electric field could be different.
CHAPTER Vm<br />
CONCLUSIONS<br />
In this work we have studied the PL decays in intrinsic hydrogenated amorphous<br />
siUcon and its carbon and nitrogen doped alloys in the 0.1-50.0 ns time scale. We have<br />
proposed a model decay function to quantitatively analyze these PL decays and resolve<br />
the fastest recombination processes in these materials. We have also studied the CW<br />
spectra of the carbon and nitrogen doped alloys as a function of composition to<br />
investigate the origin of the PL band in these materials. Finally, we have performed<br />
concomitant measurements of PL and PC in intrinsic a-Si:H to address the issue of<br />
geminate or non-geminate recombination.<br />
The model decay function that we have proposed has a functional form given by<br />
I{t) = Co + ^a, exp {—t/Ti), where a, is the zero time intensity of the i"* component, r,<br />
is the recombination lifetime corresponding to that process and the parameter a© is the<br />
contribution of slower decay components to the experimental time scale. On fitting the<br />
decays with this function, we obtain 3 distinct dominant peaks in the Ufetime<br />
distributions of the undoped and doped a-Si:H. These peaks correspond to mean<br />
lifetimes given by 0.8±0.2 ns, 3.5±0.8 ns and 16.5±4 ns, respectively. The relative<br />
contributions of these three processes depend on the thermalization efficiency of the<br />
electron-hole pairs in the material and the thermalization depth at which the decay is<br />
recorded. The thermalization efficiency depends on the Urbach energy of the sample.<br />
The radiative tunneUng model which accounts for the majority of recombination in<br />
a-Si:H fails to explain the origin of these three Ufetimes. We suggest that these processes<br />
present bound exciton recombination in which the electrons and holes are in bound or<br />
re<br />
164
165<br />
localized bandtziil states of a-Si:H. The hole in the exciton is more localized than the<br />
electron due to asymmetry in the density of states. Thus, the radius of the hole<br />
wavefunction is smaller than the electron wavefunction radius. According to the bound<br />
exciton model, the radius of the hole wavefunction determines the radiative<br />
recombination rate. We, therefore, propose that the three mean radiative decay rates<br />
correspond to three types of excitons with the depth of the hole different in the three<br />
cases. In the doped aUoys, the reduction in dielectric constant causes enhancement in<br />
the Coulomb attraction, which results in reduction of the radius of the electron<br />
wavefunction. These two compensate for the changes in each other and the radiative<br />
rate does not change with doping. The Urbach energies increa.se with an increase in<br />
(carbon or nitrogen) doping, but the bandgaps also increase with doping. This causes<br />
variations of the relative contributions of the three components to the decay.<br />
We find that the nanosecond decays at low temperatures are very insensitive to<br />
defect densities of the fUms. This supports the presence of excitons. Only when the<br />
disorder in the system becomes large enough to cause structural changes, are the<br />
excitonic processes affected. In undoped fUms, the mean Ufetimes are quenched with an<br />
increase in temperature due to enhancement of the non-radiative channel of<br />
recombination. Out of the several possibilities of non-radiative processes, it it difficult to<br />
identify a specific process based on our data.<br />
The CW spectra of a-Sii_xCr:H and a-SiNx:H films exhibit a blue shift and<br />
broadening with an increase in carbon and nitrogen content, respectively. The FWHM<br />
of the PL band in both the cases shows good Unear correlation with Urbach energy.
166<br />
This supports the disorder broadening of the PL band rather than phonon broadening,<br />
which is conventionally associated with the Stokes shift. The proportionalit>- constant of<br />
the relation between the PL bandwidth and Urbach energy depends on the dopant and<br />
does not support a universal relationship, as proposed by the original disorder<br />
broadening model.<br />
The concomitant measurement of PL and PC in the low field (< 5 x lO^V/cm) and<br />
low temperature range (< 100 A') shows an anti-correlation between the two quantities.<br />
Since this behavior is typical for geminate recombination of carriers, we suggest that<br />
under the low field, low temperature and low excitation intensity experimental<br />
conditions, majority of the recombination in a-Si:H is geminate. The one-dimensional<br />
Poole-Frenkel effect can not explain the origin of the field quenching of PL. We propose<br />
the presence of shaUow, negatively charged radiative centers in a-Si:H, which have<br />
temperature and field dependent capture cross sections for holes. These experiments<br />
suggest that the electric field changes the quantum efficiency of geminate recombination,<br />
which in turn changes the quantum efficiency of photoconductivity.<br />
In summary, the photoluminescence studies in a-Si:H and its alloys yield the<br />
foUowing physical picture of recombination. When electron-hole pairs are<br />
photogenerated, they thermaUze within a few picoseconds into the localized bandtail<br />
states. Due to the asymmetry in the density of bandtail states, the holes thermaUze<br />
faster than the electrons. The initial separation of the pairs is described by a probability<br />
distribution that depends on the excitation energy. After thermalization, the electrons<br />
and holes, which are very close to each other in space, have very large wavefunction
167<br />
overlaps. These pairs can remain as geminate pairs or form excitons. The number of<br />
electrons and holes forming excitons is a very smaU fraction of the total population of<br />
photogenerated carriers. The pairs which do not form excitons are captured by the<br />
negatively charged radiative centers and they recombine with their geminate partner<br />
either radiatively or non-radiatively. With an increase in temperature, the carriers<br />
become more mobile, they can overcome the Coulomb attraction and recombine in a<br />
non-radiative manner. With an increase in the electric field, the process of hole emission<br />
from the radiative centers is enhanced and the PL intensity is quenched.<br />
8.1 Recommendations for further research<br />
Our results indicate that the nanosecond decays in the main PL band are<br />
insensitive to the defect density of the sample. We have not, however, investigated PL<br />
decays in the defect band at 0.9 eV seen in the samples. Thus, it might be of interest to<br />
study the fast decays in the defect PL band and obtain some clues on the insensitivity of<br />
fast processes in the main band to defect density. In order to obtain sufficiently strong<br />
signals, it might be a good idea to use high defect density samples such as phosphorus<br />
doped, boron doped or Ught soaked samples.<br />
The carbon doped films used in this work were prepared using co-sputtering, and<br />
our results have shown that they exhibit much less disorder than glow discharge films<br />
with the same carbon content. The recombination kinetics in these films can be<br />
described using the same mechanism as in undoped a-Si:H up to a carbon content of<br />
0 65. Thus, it might be interesting to study the nanosecond PL decays in glow discharge
168<br />
prepared a-Sii_xCx:H fUms and compare them with our results. Similarly, in this work<br />
we concentrated on siUcon-rich a-SiNx:H fUms, so the fast recombination in nitrogen rich<br />
fUms remains to be investigated. Due to larger bandgaps of these films, the emission<br />
energy region where excitonic processes might be seen will be different than the films<br />
studied in this work.<br />
Although the investigation of fast recombination processes in these alloys is<br />
interesting from basic physics point of view, it is not very useful from an appUcation<br />
point of view. The reason for this is that these recombination channels are very weak in<br />
the overall Ufetime distribution. Thus, the slower recombination channels tend to<br />
dominate the carrier Ufetimes from a device perspective. As a result, the study of slower<br />
recombination with parameters such as electric field can be very important for device<br />
appUcations. A study of integrated decay in slower time scales (50 /is-1 ms) may,<br />
therefore, be useful in finding the effect of electric field on the mean Ufetime of the<br />
overall Ufetime distribution.<br />
Our results on CW PL quenching show a much larger decrease than that reported<br />
in the Uterature for comparable fields and temperatures. In order to find out the reasons<br />
behind this, a more comprehensive study which extends this work to higher fields<br />
(> 4x10'' V/cm) needs to be undertaken. Since, at these fields, the mobiUty of the<br />
carriers is affected, it might be possible to identify the transition from recombination<br />
Umited transport to transport Umited recombination. The effect of these higher fields on<br />
nanosecond PL decays also needs to be investigated. Study of the main PL band with<br />
sub-bandgap excitation may help identify the origin of the non-uniformity of PL
169<br />
quenching. In addition, the study of the PL quenching of the main band as well as the<br />
defect band in doped samples may help soUdify the relationship between transport and<br />
recombination.<br />
Since the simultaneous measurements of PL and PC are important from a device<br />
point of view, it may be interesting to perform them on sandwich geometry samples.<br />
This may be especiaUy important, since there is a significant difference of opinion about<br />
the nature of transport in sandwich and coplanar geometry samples. In a sandwich<br />
geometry, it will be easier to apply higher electric fields, but particular attention has to<br />
be paid to the currents flowing through the samples. In addition, it is extremely<br />
important to ascertain that there are no substrate effects (i.e., ground or plain glass) in<br />
these studies. Thus, with these added measurements, it should be possible to determine<br />
the exact relationship between transport and recombination in these alloy systems.<br />
In the CW PL spectra of some carbon fUms, we saw some structure which needs to<br />
be investigated further. It is necessary to first make sure that the peaks are not due to<br />
interference effects and then to identify them by monitoring the changes in them with<br />
different parameters. The theory of disorder broadening of PL in these alloys can be<br />
developed further by systematicaUy studying the relationship between the PL<br />
bandwidth and the Urbach energy for more composition points and examining the<br />
change in this relationship as a function of excitation energy.
REFERENCES<br />
[1] Carison, D.E., and Wronski, CR. Appl. Phys. Lett. 28, p.671, 1976.<br />
[2] Snell, A.J., Mackenzie, K.D., Spear, W.E., Lecomber, P.G., and Hughes, A.J. J.<br />
Appl. Phys. 24, p.357, 1981.<br />
[3] Kaneko, S., Kajiwara, Y., Okumara, F., and Ohkubo, T. MRS Symp. Proc. 49,<br />
p.423, 1985.<br />
[4] Perez Mendez, V., Cho, G. Fujeda, I., Kaplan, S.N., Qureshi, S., and Street, R.A.<br />
MRS Symp. Proc. 149, p.621, 1989.<br />
[5] Engemann, D., and Fischer, R. Amorphous and Liquid Semiconductors, edited by<br />
J. Stuke and W. Brenig(London: Taylor k Francis Ltd. ), p.947, 1974.<br />
[6] Street, R.A. Adv. Phys. 30, p.593, 1981.<br />
[7] Searle, T.M., Nashashibi, T.S., Austin, I.G., Devonshire, R., and Lockwood, G.,<br />
PhU. Mag. B39, p.389, 1979.<br />
[8] Thorpe, M.F. and Weaire, D. Phys. Rev. Lett. 26, p.l581, 1971.<br />
[9] Anderson, P.W. Phys. Rev. 109, p.l492, 1958.<br />
[10] Mott, N.F. and Davis, E.A. Electronic Processes in Non-crystalline materials<br />
(Oxford University Press, Oxford), 1979.<br />
[11] Tauc, J. Festkorperprobleme, 22, p.85, 1982.<br />
[12] Fauchet, P.M., HuUn, D., Migus, A., Antonetti, A., Kolodzey, J., and Wagner, S.<br />
Phys. Rev. Lett. 57, p.2438,1986.<br />
[13] Monroe, D. Phys. Rev. Lett. 54, p.146, 1985.<br />
[14] Tiedje, T. and Rose, A. SoUd State Commun. 37, p.49, 1980.<br />
[15] Street, R.A. Phi. Mag. B37, p.35, 1978.<br />
[16] Dunstan, D.J. and BouUtrop, F.J. de Physique, 42, Suppl.lO, p.C4-331, 1981.<br />
170
171<br />
17] Dunstan, D.J. and BouUtrop, F.J. Phys. Rev. B30, p.5945, 1984.<br />
18] Searle, T.M. and Jackson, W.A. Phil. Mag. B60, p.237, 1989.<br />
19] Tsang, C. and Street, R.A., Phys. Rev. B19, p.3027, 1979.<br />
20] Dunstan, D.J. Phi. Mag. B52, p.lll, 1984.<br />
21] Onsager, L. Phys. Rev. 54, p.554, 1938.<br />
22] Street, R.A. and Biegelsen, D.K. SoUd State Commun. 33, p.1159, 1980.<br />
23] Stoneham, A.M. Phil. Mag. 33, p.983, 1977.<br />
24] CoUins, R.W., Paesler, M.A., and Paul, W. SoUd State Commun. 34, p.833, 1980.<br />
25] Street, R.A., Knights, J.C., and Biegelsen, D.K. Phys. Rev. B18, p.1880, 1978.<br />
26] Street, R.A. Phys. Rev. B23, p.861, 1981.<br />
27] Dunstan, D.J. J. Phys. C. 14, p.1363, 1981.<br />
28] Thomas, D.G., Hopfield, J.J., and Augustiniak, W.M. Phys. Rev. 140, p.202, 1965.<br />
29] Williams, F. Phys. Stat. Sol. 25, p.493, 1987.<br />
30] Wilson, B.A., Hu, P., Jedju, T.M., and Harbison, J.P. Phys. Rev. B28, p.5901, 1983.<br />
31] Stearns, D.G. Phys. Rev. B30, p.6000, 1984.<br />
32] Orlowski, T.E. and Scher, H., Phys. Rev. Lett. 54, p.220, 1985.<br />
33] Schmidt, U., M.S. Thesis, Universitat Kaiserslautern, 1990.<br />
34] Goh, Freddy H.C., Tan, S.M., Ng, K., Naseem, H.A., Brown, W.D., and Hermann,<br />
A.M'. MRS Proc. 192, p.75, 1990.<br />
35] Cronauer, D., M.S. Thesis, Universitat Kaiserslautern, 1991.
172<br />
[36] Tauc, J., Grigorovici, R. and Vancu, A. Phys. Stat. Sol. 15, p.627, 1966.<br />
[37] Vanecek, M., Kocka, J., Stuchlik, J., Kozisek, Z., Stika, 0. and Triska, A., Solar<br />
Energy Mat. 8, p.411, 1983.<br />
[38] Jackson, W.B. and Amer, N.M. Phys. Rev. B25, p.5559, 1982.<br />
[39] Urbach, F. Phys. Rev. 92, p.l324, 1953.<br />
[40] Lucovsky, G., Nemanich, R.J., and Knights, J.C. Phys. Rev. B19, p.2064, 1979.<br />
[41] Shanks, H., Fang, C.J., Ley, L., Cardona, M., Demond, F.J., and Kalbitzer, S.<br />
Phys. Stat. Sol. (b)lOO, p.43, 1980.<br />
[42] SulUvan, G. Master's Thesis, 1983.<br />
[43] Chang, T.L. Ph. D. Thesis, 1990.<br />
[44] Marquardt, D. W. J. Soc. Ind. Appl. Math., 11, p.431, 1963.<br />
[45] Kher, A.R. Master's Thesis, 1990.<br />
[46] James, D.R. and Ware, W.R. Chem. Phys. Lett., p.l26, 1986.<br />
[47] Borst, W., Gangopadhyay, S. and Pleil, M. W. in Proceedings of SPIE on<br />
Fluorescence Detection{S?lE, Washington, 1987), p.l5.<br />
[48] Gangopadhyay, S., Palsule, C. and Borst, W. J. Non-Cryst. Sol. 137&138, p.539,<br />
1991.<br />
[49] Kivelson, S. and Gelatt, CD. Phys. Rev. B26, p.4646, 1982.<br />
[50] Kivelson, S. and Gelatt, CD. Phys. Rev. B19, p.5160, 1979.<br />
[51] Palsule, C, Gangopadhyay, S., Kher, A., Borst, W., Schmidt, U., Schehr, B. and<br />
Schroder, B. in press.<br />
[52] Shah, J., Bagley, B.C. and Alexander, F.B., Sol. State Comm. 36, p.199, 1980.<br />
[53] Davis, E.A. J. Non-cryst. Solids 4, p.l07, 1970.
173<br />
[54] Knights, J.C. and Davis, E.A. J. Phys. Chem. SoUds 35, p.543, 1974.<br />
[55] Paesler, M.A. and Paul, W. Phi. Mag. 43, p.393, 1980.<br />
[56] Fuhs, W. and Jahn, K. in Amorphous SiUcon and Related Materials(Worid<br />
Scientific, Singapore, 1988), p.767.<br />
[57] Jahn, K., Carius, R. and Fuhs, W. J. Non-Cryst. Sol., 97/98, p.575, 1987.<br />
[58] Nashashibi, T.S., Austin, I.G. and Searle, T.M. Phil. Mag. 35, p.831, 1977.<br />
[59] Stachowitz, R., Fuhs, W. and Jahn, K. Phil. Mag. B62, p.5, 1990.<br />
[60] Cohen, E. and Sturge, M.D. Phys. Rev. B25, p.3828, 1982.<br />
[61] Munekata, H. and Kukimoto, H., Appl.Phys.Letters 42, p.432, 1983.<br />
[62] Kruangham, D., Endo, T., Guang-Pu, W., Nonomura, S., Okamoto, H. and<br />
Hamakawa, Y. J. Non-cryst. SoUds 77/78, p.l429, 1985.<br />
[63] Tawada, Y., Tsuge, K., Kondo, M., Okamoto, H. and Hamakawa, Y. J. Appl.<br />
Phys.53, p.5273, 1982.<br />
[64] Lecomber, P.G. J. Non-cryst. SoUds 115, p.l, 1989.<br />
[65] Morimoto, A., Miura, T., Kumeda, M. and Shimizu, T. J. Appl. Phys.53, p.7299,<br />
1982.<br />
[66] BuUot, J., Gauthier, M., Schmidt, M., Catherine, Y. and Zamouche, A. PhU. Mag.<br />
B49, p.489, 1984.<br />
[67] Sussman, R. and Ogden, R. Phil. Mag. B44, p.137, 1981.<br />
[68] Carius, R., Jahn, K., Siebert, W. and Fuhs, W. J. Lum.31/32, p.354, 1984.<br />
[69] Liedtke, S., Jahn, K., Finger, F. and Fuhs, W. J. Non-cryst. Sol.97&98, p.l083,<br />
1987.<br />
[70] Siebert, W., Carius, R., Fuhs, W. and Jahn, K. Phys. Stat. Sol.(b) 140, p.311, 1987.
174<br />
[71] Palsule, C, Gangopadhyay, S., Cronauer, D. and Schroder, B., to be published.<br />
[72] Katayama, Y., Usami, K. and Shimada, T. PhU. Mag. B43, p.283, 1981.<br />
[73] Skumanich, A., Frova, A. and Amer, N. M. SoUd State Comm., 54, p.597, 1985.<br />
[74] Catherine, Y. and Turban, G. Thin SoUd Films, 60, p.193, 1979.<br />
[75] Beyer, W., Wagner, H. and MeU, H. Mat. Res. Symp. Proc.,49, 1985.<br />
[76] Cody, G. D., Tiedje, T., Abeles, B., Brooks, B. and, Goldstein, Y. Phys. Rev.<br />
Letters 47, p.1480, 1981.<br />
[77] Rehm, W. and Fischer, R. Phys. Stat. Sol.(b), 94, p.595, 1979.<br />
[78] Markham, J.J., F-centres in Alkali Halides, New York, Academic, 1966.<br />
[79] Sussaman, R. and Lauder, H. J. Physique 42, C4-1029, 1981.<br />
[80] Nakazawa, E., Munekata, H. and Kukimoto, H. Sol. Stat. Commun. 45, p.925, 1983.<br />
[81] Saito, N., Tanaka, N. and Nakaaki, I. Appl. Phys. A38, p.37, 1985.<br />
[82] Street, R. A., Tsai, C C, Stutzmann, M. and KakaUos, J. PhU. Mag. B56, p.289,<br />
1987.<br />
[83] Robertson, J. and O'Reilly, E. P. Phy Rev. B35, p.2946, 1987.<br />
[84] Kaplan, S., Jansen, F., Machonkin, M. Appl. Phys. Lett. 47, p.750, 1985.<br />
[85] Masumoto, Y., Kunitomo, H., Shinoya, S., Munekata, H. and Kumkimoto, H. J. of<br />
Non-cryst. Sol. 59 & 60, p.345, 1983.<br />
[86] Kanicki, J., Warren, W.L., Seager, C.H., Crowder, M.S. and Lenahan, P.M. J.<br />
Non-crystaUine Sol., 137&138, p.291, 1991.<br />
[87] Austin, I.G., Jackson, W.A., Searle, T.M., Bhat, P.K. and Gibson, R.A. PhU. Mag.<br />
B52, p.271, 1985.<br />
[88] Anderson, D.A. and Spear, W.E. Phil. Mag. 35, p.l, 1976.
1/0<br />
[89] Furukawa, S. and Matsumato, N. J. Non-crystalline Sol., 63, p.121, 1984.<br />
[90] Kurata, H., Hirose, M. and Osaka, Y. Jap. J. Appl. Phys., 20, p.L811, 1981.<br />
[91] Siebert, W., Jahn, K. and Fuhs, W. J. Non-crystalline Sol., 77-78, p.869, 1985.<br />
[92] Ogihara, C, Takenaka, H. and Morigaki, K. Sol. State Comm, 61, p.431, 1987.<br />
[93] Guang, H.X., Zhou, W.H., Xin, Y.Z., Bo, J. and Shaoqi, P. J. Non-cryst. Sol. 114,<br />
p.576, 1989.<br />
[94] Palsule, C, Gangopadhyay, S., Yi, S., Shen, J.M., Naseem, H.A. and Goh, Freddy,<br />
H.C in Proceedings of MRS on Amorphous Insulating Thin Ft7m5,(MRS,<br />
Pittsburgh, 1992).<br />
[95] Kanicki, J. and Wagner, P. in Proc. Symp. 'SiUcon Nitride and SiUcon Dioxide Thin<br />
Insulating Films', eds. V.J. Kapoor and K.T. Hankins (The Electrochemical<br />
Society, Pennington, 1987) p.261.<br />
[96] Druesedau, T., Jaeger, St., Fiedler, H., Sobotta, H., Riede, V., Boettcher, R. and<br />
Witzmann, A. J. Non-cryst. Sol. 127, p.165, 1991.<br />
[97] Jackson, W.A., Searle, T.M., Austin, LG. and Gibson R.A. J. Non-cryst. Sol. 77-78,<br />
p.909, 1985.<br />
[98] Searle, T.M., Jackson, W.A. and Austin, I.G. J. Non-cryst. Sol. 97-98, p.991, 1987.<br />
[99] Park, G.L., Kong, H.S., Lee, C and Jang, J. Phys. Rev. B38, p.l3200, 1988.<br />
[100] Nebel, C.E., Street, R.A. and Johnson, N.M. Phys. Rev. B46, p.6789, 1992.