NO BORDER
NO BORDER
NO BORDER

You also want an ePaper? Increase the reach of your titles
YUMPU automatically turns print PDFs into web optimized ePapers that Google loves.
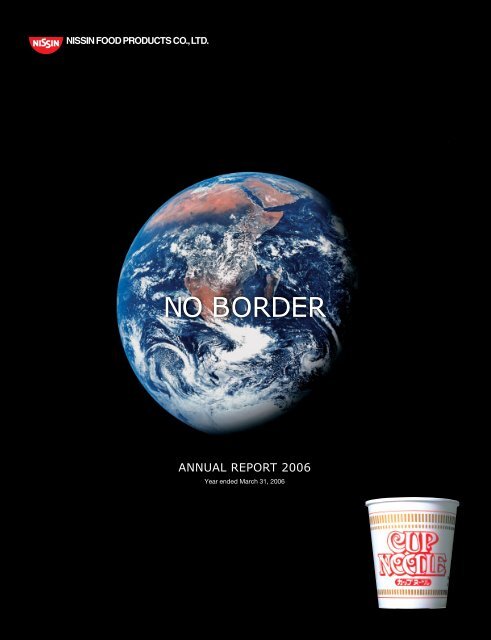
<strong>NO</strong> <strong>BORDER</strong><br />
ANNUAL REPORT 2006<br />
Year ended March 31, 2006
THE WORLD HAS<br />
<strong>NO</strong> <strong>BORDER</strong>S TO<br />
THE ENJOYMENT OF<br />
A GOOD MEAL<br />
— PHILOSOPHY<br />
THIS YEAR’S THEME “<strong>NO</strong> <strong>BORDER</strong>” REFLECTS NISSIN FOODS’ PHILOSOPHY<br />
THAT, JUST AS THERE ARE <strong>NO</strong> <strong>BORDER</strong>S TO THE ENJOYMENT OF DELICIOUS<br />
FOOD, THERE SHOULD BE <strong>NO</strong> <strong>BORDER</strong>S IN HUMAN HEARTS. NISSIN FOODS<br />
WAS FOUNDED IN PART ON THE PRINCIPLE THAT WORLD PEACE WILL COME<br />
MORE EASILY WHEN EVERY PERSON HAS E<strong>NO</strong>UGH TO EAT. WE HOPE THAT<br />
PEOPLE EVERYWHERE ARE REMINDED OF THIS WHENEVER THEY EAT CUP<br />
<strong>NO</strong>ODLE. THAT WISH IS EXPRESSED IN THE WORDS “<strong>NO</strong> <strong>BORDER</strong>.” AS A<br />
LEADING JAPANESE FOOD MANUFACTURER ACTIVE IN 11 COUNTRIES<br />
AROUND THE WORLD, NISSIN FOODS HAS SOLD CUMULATIVELY MORE<br />
THAN 25 BILLION OF ITS FAMOUS CUP <strong>NO</strong>ODLE BRAND PRODUCTS.<br />
The instant noodle industry Nissin Foods pioneered in 1958 produced around<br />
the world 85.66 billion meals in 2005.<br />
Nissin foods' market share is over 40% in Japan, where over 5.4 billion<br />
servings of instant noodles are consumed annually (42.7 servings<br />
per capital).<br />
Nissin Foods seeks to improve its business structure and maximize<br />
corporate value by building a stronger, globally competitive brand.<br />
ANNUAL REPORT 2006<br />
1
FIRST ON EARTH,<br />
FIRST IN SPACE AND<br />
FIRST ON THE TABLE<br />
—FROM A COMPANY THAT MAKES FOOD SAFETY<br />
ITS NUMBER-ONE PRIORITY<br />
— HISTORY<br />
LIMITLESS IN<strong>NO</strong>VATION HAS MADE NISSIN FOODS THE LEADING<br />
MANUFACTURER OF INSTANT <strong>NO</strong>ODLES AROUND THE WORLD—AND IN<br />
SPACE. TO BRIGHTEN THE LIVES OF PEOPLE EVERYWHERE WITH MEALS<br />
THAT ARE QUICKLY PREPARED, NISSIN FOODS IS DEVELOPING NEW FOOD<br />
PRODUCTS AND PROMOTING GOOD HEALTH THROUGH THE HIGHEST<br />
DEDICATION TO TECHNICAL IN<strong>NO</strong>VATION, PRODUCT QUALITY AND SAFETY.<br />
1958: Chicken Ramen, the world’s first instant noodle product<br />
1971: Cup Noodle, the world’s first instant noodles packaged in a cup<br />
1971: Top Ramen heads overseas, starting with the U.S.A.<br />
1992: Nissin Rao, a fresh-noodle product suitable for long-term storage<br />
at room temperatures<br />
2002: Nissin GooTa, with premium noodles and toppings<br />
2005: Space Ram, the first ramen consumed in space, developed on<br />
earth for use on the space shuttle Discovery<br />
NISSINANNUAL REPORT 2006<br />
3
Instant Noodle Markets and Nissin Foods Group’s Share<br />
(Calendar year 2005)<br />
Annual demand for<br />
instant noodles total * 1 Servings per capita<br />
(Millions of servings)<br />
Nissin Foods<br />
Group’s share * 2<br />
(Volume basis %)<br />
Asia 75,150 24.0 13.4%<br />
North America 4,080 10.3 34.6%<br />
Latin America 2,280 11.1 32.9%<br />
Europe* 3 730 2.3 14.0%<br />
Others 3,420<br />
Total 85,660 14.4%<br />
Notes:<br />
1. Source: International Ramen Manufacturers Association (http://www.instantramen.or.jp/IRMA/)<br />
2. Including Hebei F&N Industry Group Co., Ltd.<br />
3. Excluding Russia<br />
Nissin Foods Consolidated Sales by Category<br />
(Years ended March 31)<br />
(Millions of yen) 2006 2005 2004<br />
Instant Noodles<br />
Operational Highlights<br />
Pillow-type Instant Noodles 48,919 44,023 45,511<br />
Cup-type Instant Noodles 204,864 203,689 203,338<br />
Chilled and Frozen Foods 40,727 39,859 39,701<br />
Other Business 27,190 29,402 31,483<br />
Total 321,700 316,973 320,033<br />
Nissin Foods Consolidated Sales by Geographic Area (Excluding Intersegment Sales)<br />
(Years ended March 31)<br />
(Millions of yen) 2006 2005 2004<br />
Japan 269,765 273,936 276,398<br />
North America 29,903 23,911 23,943<br />
Others 22,032 19,126 19,692<br />
Total 321,700 316,973 320,033<br />
4 ANNUAL REPORT 2006
Financial Highlights<br />
(Years ended March 31) 2006 2005 2004 2006 (%)<br />
For the year<br />
Net sales ¥ 321,700 ¥ 316,973 ¥ 320,033 $ 2,738,571 1.5<br />
Operating income 31,979 28,963 23,203 272,231 10.4<br />
Net income 15,389 16,612 14,051 131,004 7.4<br />
At year-end<br />
Millions of yen<br />
Thousands of<br />
U.S. dollars<br />
Total assets ¥ 366,801 ¥ 361,105 ¥ 343,645 $ 3,122,508 1.6<br />
Shareholders’ equity 263,199 258,139 244,439 2,240,564 2.0<br />
* 1<br />
Percent<br />
change<br />
Per share<br />
Yen<br />
U.S. dollars<br />
Percent<br />
change<br />
Net income ¥ 125.09 ¥ 134.36 ¥ 113.61 $ 1.06 6.9<br />
Cash dividends applicable to earnings of the year 30.00 30.00 30.00 0.26 —<br />
Shareholders’ equity 2,167.81 2,091.16 1,980.14 18.45 3.7<br />
Value & performance indicators<br />
Operating margin (%) * 2 9.9 9.1 7.3<br />
Return on assets (%) * 3 4.2 4.7 4.2<br />
Return on equity (%) * 4 5.9 6.6 5.9<br />
Inventory turnover (Times) * 5 12.6 12.9 13.6<br />
Notes:<br />
1. U.S. dollar amounts represent translations of yen, for convenience only, at US$1 = ¥117.47, the approximate rate prevailing on March 31, 2006.<br />
2. Operating margin = Operating income / Net sales<br />
3. Return on assets = Net income / Average total assets<br />
4. Return on equity = Net income / Average total shareholders’ equity<br />
5. Inventory turnover = Cost of sales / Average total inventory<br />
> Net Sales<br />
(Billions of yen)<br />
Operating Income<br />
(Billions of yen)<br />
308.5 315.3 320.0 317.0 321.7 32.0<br />
29.0<br />
24.8 26.4 23.2<br />
’02 ’03 ’04 ’05 ’06<br />
’02 ’03 ’04 ’05 ’06<br />
><br />
><br />
Net Income<br />
(Billions of yen)<br />
11.9<br />
14.4 14.1<br />
16.6<br />
15.4<br />
’02 ’03 ’04 ’05 ’06<br />
Forward-looking Statements<br />
This report contains forward-looking<br />
statements regarding the Company’s<br />
plans, outlook, strategies and results for<br />
the future that are based on management's<br />
estimates, assumptions and projections<br />
at the time of publication.<br />
Certain risks and uncertainties could<br />
cause the Company’s actual results to<br />
differ materially from any projections presented<br />
in this report. These risks and<br />
uncertainties include, but are not limited<br />
to, the domestic and international economic<br />
circumstances surrounding the<br />
Company’s businesses, competitive<br />
activity, related laws and regulations,<br />
product development programs and<br />
changes in exchange fluctuations.<br />
Contents<br />
Philosophy . . . . . . . . . . . . . . . . . . . . . . 1<br />
History . . . . . . . . . . . . . . . . . . . . . . . . . 3<br />
Operational Highlights . . . . . . . . . . . . . 4<br />
Financial Highlights . . . . . . . . . . . . . . . . 5<br />
President’s Letter . . . . . . . . . . . . . . . . . 6<br />
Review of Operations . . . . . . . . . . . . . . 9<br />
Quality and Safety . . . . . . . . . . . . . . . 16<br />
Environmental Activities . . . . . . . . . . . 18<br />
Corporate Governance . . . . . . . . . . . . 19<br />
Founder Momofuku Ando:<br />
Father of an Industry . . . . . . . . . . . . . . 20<br />
Board of Directors . . . . . . . . . . . . . . . 22<br />
Financial Section . . . . . . . . . . . . . . . . 23<br />
Worldwide Network . . . . . . . . . . . . . . 48<br />
Corporate Data . . . . . . . . . . . . . . . . . . 50<br />
Investor Information . . . . . . . . . . . . . . 51<br />
ANNUAL REPORT 2006<br />
5
PRESIDENT<br />
Koki Ando<br />
President’s Letter<br />
Chicken Ramen<br />
Due to consistently high<br />
ingredient quality and constant<br />
product improvements,<br />
the world’s first instant noodles<br />
will soon celebrate its<br />
50th anniversary.<br />
To Our Shareholders<br />
In the year ended March 31, 2006 (fiscal 2006),<br />
slower sales of high-priced products were offset<br />
by positive factors, including the effect of a<br />
weaker yen on overseas sales. Nissin Foods<br />
recorded consolidated net sales of ¥321,700<br />
million ($2,739 million), a year-on-year increase<br />
of 1.5%. Consolidated operating income was<br />
10.4% higher year on year at ¥31,979 million<br />
($272 million). Factors contributing to this<br />
growth included a reduction in the cost of retirement<br />
benefit payments, and higher sales.<br />
However, there was an extraordinary loss resulting<br />
from adoption of a new accounting standard<br />
for the imparement of fixed assets in fiscal 2006,<br />
and consolidated net income was 7.4% lower<br />
year on year at ¥15,389 million ($131 million).<br />
Instant Noodles as<br />
“Glocal” Products<br />
According to data published by the International<br />
Ramen Manufacturers Association (IRMA), total<br />
world demand for instant noodles stood at 85.7<br />
billion servings in 2005. A feature of instant<br />
noodle products is their simplicity. Pillow-type<br />
instant noodles consist of noodles, soup and<br />
the packet, while cup-type instant noodles consist<br />
of noodles, soup, topping ingredients and<br />
the cup. This simplicity and the ease with which<br />
products can be arranged to reflect local tastes<br />
and dietary customs are key reasons for the<br />
emergence of instant noodles as a global dish.<br />
Instant noodles are both global and local foods.<br />
For example, in Thailand noodles are flavored<br />
with traditional tom yam kung soup, while in<br />
Indonesia products are arranged to suit mi<br />
goreng, a local form of fried noodles. In<br />
America, instant noodles are eaten in chicken<br />
soup, and in Brazil tomato or cheese flavored<br />
noodles are preferred. Because noodles combine<br />
both global and local characteristics, we<br />
call them “glocal” products.<br />
6 ANNUAL REPORT 2006
Basis of the Brand—<br />
Food Safety<br />
Food safety is the foundation of our reputation<br />
and takes priority over all else, including flavor.<br />
In Japan, the Food Safety Research Institute,<br />
an organization specializing in food safety and<br />
environmental measures, conducts stringent<br />
and detailed analyses of our quality management<br />
systems. In preparation for the introduction<br />
of the Positive List* system in May 2006,<br />
the Institute developed a unique inspection system<br />
for raw materials used by Nissin Foods. We<br />
are fully equipped to detect residues from hundreds<br />
of agricultural chemicals in general agricultural<br />
products, cereals, livestock products<br />
and marine products.<br />
We plan to establish a Food Safety<br />
Research Institute in Shanghai in the fall of<br />
2006 to carry out pre-export checks of the<br />
growing quantities of raw materials that we<br />
source from China. Our policy calls for further<br />
reinforcement of our safety measures through<br />
the creation of a system under which we will<br />
restrict our imports to products that have<br />
passed rigorous pre-export inspections.<br />
*The Positive List is a list of approved agricultural chemicals<br />
and pharmaceutical products, together with standards for<br />
these substances.<br />
Brand Assets and<br />
Our Responsibilities as<br />
a Manufacturer<br />
Our basic management strategy in managing<br />
the brand is to emphasize brand development<br />
and the maximization of brand value. We believe<br />
that the strength of a brand consists of consumer<br />
support and a long-established reputation<br />
for reliability. Nissin Foods has a number of<br />
brands that have remained popular for decades.<br />
Chicken Ramen has been on sale for 48 years,<br />
and Cup Noodle for 35 years, while Nissin no<br />
Donbei and Nissin Yakisoba U.F.O. have both<br />
been on the market for 30 years. We attribute<br />
the prolonged popularity of these products to<br />
our efforts to develop our brands as assets.<br />
In recent years, there has been growing<br />
public interest in the concept of corporate<br />
social responsibility (CSR). We interpret this<br />
term as meaning that we should develop and<br />
protect our brands as a manufacturer that<br />
takes full responsibility for its products from the<br />
time of sale to the disposal of packaging. We<br />
are responsible for the impact of our activities<br />
on the global environment at all stages from<br />
the manufacturing process through to the disposal<br />
of containers by the consumers who buy<br />
our products.<br />
Developing New Demand—<br />
From Instant Noodles<br />
to Soups<br />
In May 2006, we launched a new vegetableflavored<br />
product line in Japan, Yasai Soup<br />
Noodle. As consumers become more healthconscious,<br />
we anticipate sustained growth in<br />
the market for cup-type instant noodle and cup<br />
soup products that satisfy hunger without providing<br />
excessive calories. The new products<br />
are filled with delicious vegetables prepared<br />
using our exclusive compression and air drying<br />
technology. The result is crispier vegetables<br />
with an enhanced sense of volume. All products<br />
have 140 kcal or less, making them ideal<br />
as a meal accompaniment for male consumers<br />
and as a meal for female consumers.<br />
This new soup category represents a significant<br />
departure from our traditional noodle products.<br />
However, product categories and dietary<br />
customs are determined by consumers. For<br />
example, rice balls have traditionally been eaten<br />
with miso (bean paste) soup in Japan, but<br />
today’s young people are also consuming rice<br />
with Mini-Cup Noodle. We need to adapt to<br />
these changes and these new preferences.<br />
Cup Noodle<br />
Cup Noodle has been the<br />
largest instant noodle brand<br />
in the world. In 2006,<br />
aggregate sales in major<br />
markets surpassed<br />
25 billion servings.<br />
Nissin no Donbei<br />
Nissin no Donbei Japanesestyle<br />
cup-type instant noodles<br />
have evolved since<br />
1976, through cooking<br />
improvements, addition of<br />
tempura, and later, use of<br />
100% soybeans. Over 7.7<br />
billion servings have been<br />
sold.<br />
Nissin Yakisoba U.F.O.<br />
Nissin Yakisoba U.F.O.<br />
(pan-fried noodles) delivers<br />
authentic yakisoba taste.<br />
They are cooked in their<br />
own bowl and are drained<br />
through a built-in strainer.<br />
ANNUAL REPORT 2006<br />
7
President`s letter<br />
Yasai Soup Noodle<br />
The many vegetables get<br />
their crunchiness from<br />
Nissin Foods’ original technology<br />
for compressing and<br />
heat drying to significantly<br />
improve texture and volume.<br />
CHOW MEIN<br />
A Chinese-style pan-fried<br />
noodle product with noodles<br />
that fully absorb the liquid,<br />
providing a hearty and zesty<br />
alternative to pillow-type or<br />
cup-type instant noodles.<br />
Souper Meal<br />
Our increasingly popular<br />
Souper Meal range,<br />
launched in the U.S. market<br />
in 2004 by Nissin Foods<br />
(U.S.A), offers large portions<br />
in a variety of flavors.<br />
North America<br />
In the North American market, purchasing<br />
behavior is increasingly influenced by product<br />
characteristics and quality rather than the traditional<br />
influence of price. This trend has been<br />
reflected in consistently strong sales of CHOW<br />
MEIN, an instant fried noodle product that can<br />
be prepared in a microwave oven, ever since its<br />
market launch in 2004. In the past, we only<br />
offered regular-size products, but recently we<br />
have achieved sales growth with the Souper<br />
Meal range of large-serve products in various<br />
types of containers, including bowls and dishes.<br />
Another factor that has brought growth in<br />
sales volumes was the restructuring of our<br />
sales channels, which now include leading<br />
mass retailers and club stores. We have<br />
reduced production costs by installing the<br />
world’s fastest instant noodle production line,<br />
and we are also working to reduce distribution<br />
costs. These efforts have brought a steady<br />
improvement in earnings.<br />
China<br />
China is one of the fastest growing markets in<br />
the world. Total demand in 2005 was estimated<br />
at 44.3 billion servings, which, on the basis of<br />
China’s population of 1.3 billion, is simply calculated<br />
as equivalent to 34 servings per person<br />
per year. Previously we sold our products mainly<br />
in Chinese cities, but we are now distributing<br />
several Nissin Foods brands, including Cup<br />
Noodles, Nissin Yakisoba U.F.O. and Chao Mian<br />
Da Wang, throughout China through the sales<br />
channels of Nissin Hualong Foods Co., Ltd.,<br />
which we established in partnership with a major<br />
Chinese noodle manufacturer. There are plans<br />
for closer collaboration with Nissin Hualong<br />
Foods Co., Ltd., including support for product<br />
development and technology development.<br />
Maximizing Shareholder<br />
Value by Considering<br />
All Stakeholders<br />
Our key management priorities are to supply<br />
products that are safe and will continue to<br />
attract consumer support, to protect the environment,<br />
to contribute to society, and to maximize<br />
shareholder value.<br />
We currently aim to maintain a non-consolidated<br />
dividend payout ratio of 30%. In fiscal<br />
2007, we plan to pay a ¥20 commemorative<br />
dividend to mark the 35th anniversary of the<br />
launch of Cup Noodle. This will be in addition<br />
to the ordinary interim dividend of ¥15 per<br />
share. In the previous year we also returned<br />
profits to shareholders by buying back shares<br />
worth ¥6,922 million (US$59 million), or 1.59%<br />
of all shares. We will continue our efforts to<br />
raise the medium-term and long-term value of<br />
Nissin Foods for our shareholders and all<br />
stakeholders.<br />
Instant noodles offer many advantages,<br />
including good taste, food safety, convenience,<br />
reasonable price and long-term storage. As a<br />
world food, instant noodles also have an important<br />
role to play in relation to health, food crises<br />
and famines. We are confident that demand will<br />
continue to expand in the world market. As the<br />
leader in the instant noodles industry, Nissin<br />
Foods is determined to implement its corporate<br />
philosophy and reach its management targets,<br />
while helping to enhance food lifestyles<br />
throughout the world.<br />
In presenting this report, I would like to<br />
express our gratitude to our shareholders,<br />
investors and suppliers for their ongoing patronage.<br />
We look forward to your continuing support<br />
and guidance in the future.<br />
PRESIDENT Koki Ando<br />
8 ANNUAL REPORT 2006
Review of Operations<br />
Nissin Foods’ Consolidated Sales by Category<br />
(Year ended March 31, 2006)<br />
12.7%<br />
8.4%<br />
15.2%<br />
les<br />
63.7%<br />
Total: ¥321,700 million<br />
Instant Noodles<br />
Pillow-type Instant Noodles<br />
Cup-type Instant Noodles<br />
Chilled and Frozen Foods<br />
Other Business<br />
THE GROUP’S INSTANT <strong>NO</strong>ODLE CATEGORY, COMPRISING PILLOW-TYPE<br />
AND CUP-TYPE PRODUCTS, BRINGS IN 78.9% OF NET SALES. SALES IN<br />
JAPAN ACCOUNT FOR 83.9% OF THIS SEGMENT. WHILE STRENGTHENING<br />
ITS OTHER LINES, NISSIN FOODS IS MOVING AGGRESSIVELY TO<br />
INCREASE INSTANT <strong>NO</strong>ODLE SALES OVERSEAS, WHICH IS SEEN AS THE<br />
NEXT ARENA FOR GROWTH.<br />
In Japan: We successfully developed a new, health-conscious all-vegetable<br />
line showcasing a new food preparation technology. These products are a<br />
strong response to shifting consumer needs.<br />
Expanding Overseas: Marketing innovations to promote premium-quality<br />
products in North America and production and distribution expansion in the<br />
fast-growing China market helped boost overseas sales by 20.7% year on<br />
year to ¥51,935 million (US$442 million).<br />
ANNUAL REPORT 2006<br />
9
Review of Operations<br />
Instant Noodles<br />
Instant noodles in pillow-type or cup-type<br />
packaging are the core products for Nissin<br />
Foods. Domestic and overseas sales of<br />
these products account for around 80% of<br />
consolidated net sales.<br />
> Consolidated Instant Noodle Sales<br />
(Billions of yen)<br />
’02<br />
’03<br />
’04<br />
’05<br />
’06<br />
43.7<br />
43.3<br />
45.5<br />
44.0<br />
48.9<br />
201.1<br />
202.6<br />
203.3<br />
203.7<br />
204.9<br />
Pillow-type noodles<br />
Cup-type noodles<br />
Italian Seafood Noodle<br />
Top Ramen<br />
Nissin Rao<br />
Nissin GooTa<br />
> Review of Performance<br />
In the year ended March 31, 2006, the<br />
Japanese instant noodle industry continued to<br />
face challenging business conditions. On the<br />
demand side, the consumer base continued to<br />
shrink because of Japan’s falling birthrate and<br />
expanding aged population. Selling prices also<br />
remained under pressure, reflecting the fact<br />
that cut-price selling has become standard<br />
practice in the retail distribution sector. At the<br />
industry level, sales were slightly below the<br />
previous year’s level.<br />
Nissin Foods continued to take full advantage<br />
of the potential of its long-selling brands,<br />
including Chicken Ramen and Cup Noodle. In<br />
addition to aggressive marketing activities, we<br />
introduced Italian-style and Mediterranean-style<br />
products to coincide with the Winter Olympic<br />
Games in February 2006. By responding to<br />
consumer needs, we were able to record strong<br />
sales. Sales of high-added-value products,<br />
such as Nissin Rao and Nissin GooTa, declined,<br />
reflecting a falling trend in this entire segment.<br />
Trends in overseas markets were encouraging.<br />
Our flagship products, such as Cup<br />
Noodles and Top Ramen, sold well in the North<br />
American market, and we also succeeded in<br />
expanding the in-store presence of new-category<br />
products, including CHOW MEIN. In the Hong<br />
Kong market, there was a substantial increase in<br />
sales of the Demae Itcho series and other products.<br />
The contribution of overseas sales to total<br />
revenues was further enhanced by the weak yen<br />
against other currencies.<br />
As a result of these trends, consolidated<br />
sales of instant noodles, including both pillowtype<br />
and cup-type products, increased by 2.5%<br />
year on year to ¥253,783 million (US$2,160 million).<br />
Sales of instant noodles accounted for<br />
78.9% of total consolidated net sales.<br />
Detailed information on the performance of<br />
instant noodles in overseas markets is provided<br />
in Overseas Operations (Page 14).<br />
Pillow-type Instant Noodles<br />
After remaining static for several years, the<br />
domestic market for pillow-type noodles began<br />
to contract in the year ended March 31, 2006.<br />
However, we were able to maintain steady<br />
growth in sales of our flagship Chicken Ramen<br />
series by generating market interest with special<br />
products. These included a limited-edition<br />
set combining a mini-size Chicken Ramen with<br />
a lidded mug bearing a picture of Hiyoko-chan,<br />
a cartoon chick character used in Nissin Foods<br />
promotional materials. In the year ended March<br />
31, 2006, non-consolidated sales of pillowtype<br />
noodles increased by 4.8% year on year<br />
to ¥31,069 million (US$264 million).<br />
Cup-type Instant Noodles<br />
Consumer preferences in this segment were<br />
characterized by a return to the basics. We<br />
10 ANNUAL REPORT 2006
were able to maintain strong sales of our longselling<br />
flagship products, such as Cup Noodle,<br />
Japanese-style products, such as Nissin no<br />
Donbei, and fried-noodle products, including<br />
Nissin Yakisoba U.F.O.<br />
However, high-added-value products, such<br />
as Nissin Rao and Nissin GooTa were affected<br />
by a general slowdown in demand for high-end<br />
products, and sales were lower than in the previous<br />
year. We aggressively introduced new<br />
types of products, including Nissin Kentaro for<br />
health-conscious consumers, and non-wheat<br />
Nissin Pho (Vietnamese-style rice noodles) and<br />
Nissin Harusame (bean-starch vermicelli).<br />
Despite these efforts, total sales of cup-type<br />
instant noodles declined by 1.3% year on year<br />
to ¥184,282 million (US$1,569 million).<br />
> Future Direction<br />
Strengthening and Expanding<br />
Brand Assets<br />
We continue to record steady sales of our flagship<br />
Chicken Ramen brand. Sales of this series<br />
set a new record in fiscal 2004, 45 years after<br />
the launch of the first product. In 2008, we will<br />
celebrate the 50th anniversary of this series,<br />
and in 2006 we mark the 35th anniversary of<br />
the launch of Cup Noodle and the 30th<br />
anniversary of Nissin no Donbei and Nissin<br />
Yakisoba U.F.O. These long-selling brands are<br />
growing steadily.<br />
Our most important priority is to develop<br />
these long-selling brands and maximize their<br />
value. We believe that a brand can only be<br />
strong if it has a long-established reputation and<br />
is supported by consumers. The maintenance of<br />
appropriate prices is an important aspect of<br />
brand strength. We have carefully studied the<br />
characteristics and functions of diversified retailing<br />
formats, including the “everyday low price”<br />
(EDLP) system, and retailing systems based on<br />
selling at extremely low prices. Based on our<br />
understanding of these methods, we believe<br />
that the best way to protect the value of our<br />
brands, including their prices, is to use marketing<br />
expenditure appropriately and strategically in<br />
coordination with special sales limited to specific<br />
periods and volumes.<br />
Developing New Demand<br />
with New Products<br />
In May 2006, we launched a new series, Yasai<br />
Soup Noodle. Consumers have become more<br />
health-conscious in recent years, and there<br />
has also been considerable diversification in<br />
the ways in which people take meals. These<br />
changes have been reflected in rapid growth in<br />
the market of low-calorie products, such as<br />
non-wheat noodles (harusame and pho) and<br />
cup soups that satisfy hunger while helping to<br />
control the calorie intake. The Yasai Soup<br />
Noodle products contain approximately 100g<br />
of fresh vegetables, which are compressed<br />
and air dried using exclusive Nissin Foods’<br />
technology. Vegetables processed in this way<br />
maintain their crispness and provide a greater<br />
sense of volume than was previously possible<br />
in products of this type. These healthy products<br />
contain 140 kcal or less. There are three<br />
types: Suanlatang, Jitang and Minestrone. All<br />
are expected to attract wide consumer support,<br />
especially among women and health-conscious<br />
people.<br />
Nissin Foods will<br />
continue to explore<br />
challenges in new food<br />
categories in 2006.<br />
Demae Itcho<br />
Chicken Ramen<br />
with a lidded mug<br />
Nissin Kentaro<br />
Nissin Pho and<br />
Nissin Harusame<br />
ANNUAL REPORT 2006<br />
11
Review of Operations<br />
Chilled and Frozen Foods<br />
As an integrated noodle manufacturer,<br />
Nissin Foods supplies not only room-temperature<br />
products, such as instant noodles,<br />
but also chilled and frozen products.<br />
Under our brand extension strategy, these<br />
products are sold under the same brand<br />
as instant noodle products.<br />
> Consolidated Chilled and<br />
Frozen Foods Sales<br />
(Billions of yen)<br />
’02 37.0<br />
’03<br />
’04<br />
’05<br />
’06<br />
39.1<br />
39.7<br />
39.9<br />
40.7<br />
> Review of Performance<br />
> Future Direction<br />
Nissin Yakisoba<br />
Gyoretsu-no-Dekiru-<br />
Mise-no-Ramen<br />
Frozen version of<br />
Nissin GooTa<br />
In the year ended March 2006, consolidated<br />
sales of chilled and frozen foods increased by<br />
2.2% year on year to ¥40,727 million (US$347<br />
million).<br />
Our flagship Nissin Yakisoba line continued<br />
to sell well, but sales of summer products, such<br />
as Hiyashi Chuka, were slow. As a result, sales<br />
of chilled foods declined by 7.1% year on year<br />
to ¥13,805 million (US$118 million).<br />
Domestic sales of frozen foods were 7.7%<br />
higher at ¥26,922 million (US$229 million),<br />
reflecting strong domestic sales of the frozen<br />
versions of Nissin Spa-O and Nissin GooTa.<br />
Growth of frozen foods contributed to the overall<br />
increase in sales of chilled and frozen foods.<br />
Sales of chilled and frozen foods accounted for<br />
12.7% of total consolidated net sales.<br />
We will continue to supply<br />
a wide variety of products<br />
to meet the increasingly<br />
diverse preferences of<br />
consumers.<br />
Chilled Foods<br />
Our main focus in the year ending March 31,<br />
2007 will be the revitalization of our high-added<br />
value brand that recreates ramen from a gourmet<br />
ramen restaurant, the Gyoretsu-no-Dekiru-<br />
Mise-no-Ramen series. It was launched 10 years<br />
ago and is our flagship product in the chilled<br />
food segment. We will give new impact to this<br />
range by launching an exciting new chicken-flavored<br />
product in two styles that are popular in<br />
restaurants, soy sauce and salty broth. We will<br />
also update key products in the series.<br />
Frozen Foods<br />
In the year ending March 31, 2007 we will further<br />
refine our highly successful spaghetti and<br />
noodles-with-toppings lines, which have seen<br />
significantly expanded sales. Our aim is to<br />
develop these items into products that combine<br />
the convenience of frozen foods with<br />
authentic taste. We will also target further sales<br />
growth by launching new products based on<br />
innovative concepts that have the potential to<br />
stimulate new demand. Another focus will be<br />
the supply of high-added-value products,<br />
including noodle-related items, takoyaki and<br />
okonomiyaki. At the same time, we will work to<br />
maximize profits through cost-cutting measures,<br />
including the centralization of production<br />
operations, and the rationalization of logistics.<br />
12 ANNUAL REPORT 2006
Consolidated Other Business Sales<br />
(Billions of yen)<br />
’02 26.7<br />
’03<br />
’04<br />
’05<br />
’06<br />
27.2<br />
30.3<br />
31.5<br />
29.4<br />
Through its group companies, Nissin Foods<br />
manufactures and sells cereal foods, confectionery<br />
and dairy products. Peripheral<br />
business areas include logistics and the<br />
manufacture and sale of containers.<br />
Review of Operations<br />
Other Business<br />
> Review of Performance<br />
> Future Direction<br />
Food products in this segment include cereal<br />
foods, confectionery, such as biscuits, cookies<br />
and chocolate, and dairy products, such as<br />
lactobacillus beverages, jellies and yogurt.<br />
Our cereal products, including Ciscorn Big,<br />
from Nissin Cisco Co. Ltd, which makes and<br />
markets confectionery, and the dairy product<br />
Pilkul, a lactobacillus beverage approved as a<br />
Food for Specified Health Use* and manufactured<br />
by Nissin York Co., Ltd., continued to<br />
enjoy strong consumer support, and sales<br />
were encouraging. However, there was a<br />
decline in sales in peripheral business areas,<br />
such as the manufacture and sale of containers.<br />
As a result, total sales in this segment in<br />
the year ended March 31, 2006 were 7.5%<br />
lower year on year at ¥27,190 million (US$232<br />
million). This segment contributed 8.4% of total<br />
consolidated net sales.<br />
Nissin Cisco launched new cereal products for<br />
seniors and women, Kurogo Cereal and Rye<br />
Flakes, made from healthy ingredients. In biscuit<br />
products, it developed Hotcake Fumi no Biscuit<br />
and Cocoa Fumi no Biscuit as products to enjoy<br />
at teatime. Nissin York also launched Choshoku<br />
Style Cheese Yogurt, a novel thickened yogurt<br />
product suggested for spreading on bread at<br />
breakfast or serving on crackers. These new<br />
product developments in emerging areas of consumer<br />
demand will contribute to sales growth<br />
and maintenance of healthy profit margins.<br />
Ciscorn Big<br />
Choshoku Style<br />
Cheese Yogurt<br />
*A "Food for Specified Health Use" has been designated by<br />
Japan’s Ministry of Health, Labor and Welfare as being useful<br />
in prevention of lifestyle-related diseases and has passed<br />
strict examinations of its effects in addition to its safety.<br />
We will work to<br />
strengthen group<br />
companies involved in<br />
these other activities.<br />
Pilkul<br />
Hotcake Fumi no<br />
Biscuit<br />
ANNUAL REPORT 2006<br />
13
Overseas Operations<br />
Nissin Foods has steadily expanded its international presence, starting<br />
with the establishment of Nissin Foods (U.S.A.) Co., Inc. in 1970. Today its<br />
global network encompasses 29 companies in 11 countries. The priority<br />
overseas markets are North America, which is our main overseas market,<br />
and China, where demand is expanding dramatically. We are also building<br />
global market share by aggressively expanding our activities in other consumer<br />
markets where growth is predicted, including Brazil and Russia.<br />
“No Border”<br />
—The activities of<br />
Nissin Foods are<br />
steadily expanding<br />
throughout the world<br />
U.S.<br />
Cup Noodles<br />
Mexican<br />
Cup Noodles<br />
Brazilian<br />
Cup Noodles<br />
European<br />
Cup Noodles<br />
Total world demand for instant noodles has<br />
continued to grow, from 53.3 billion servings in<br />
2001, to 85.7 billion in 2005.<br />
In the year ended March 31, 2006, our overseas<br />
sales increased by 20.7% year on year to<br />
¥51,935 million (US$442 million), excluding<br />
intersegment sales. By geographic area, factors<br />
contributing to growth include an increase in<br />
sales volumes in North America, the expansion<br />
of sales in Hong Kong, and a weak yen.<br />
> The Americas<br />
U.S.A.<br />
In addition to strong sales of our flagship Top<br />
Ramen and Cup Noodles series, there was also<br />
a contribution from two new categories of<br />
microwavable products, the CHOW MEIN and<br />
Souper Meal series, which were launched in<br />
2004. In volume terms, sales increased by 12%<br />
year on year. There was also sustained profit<br />
improvement, thanks to higher production efficiency<br />
following the installation of a large-scale<br />
production line in 2003. We also improved sales<br />
efficiency following a review of our sales systems.<br />
Mexico<br />
The Mexico Branch of Nissin Food Products<br />
Co., Ltd. was restructured as a local subsidiary,<br />
Nissin Foods de Mexico S.A. de C.V.<br />
We also commenced production at a local<br />
plant. This will significantly reduce logistics<br />
costs. We are also working to improve our<br />
income structure in Mexico by using local procurement<br />
to avoid foreign exchange risk, and<br />
by normalizing sales prices.<br />
Brazil<br />
Activities in Brazil are handled by Nissin-<br />
Ajinomoto Alimentos Ltda., a joint venture<br />
between Nissin Foods and Ajinomoto Co., Inc.<br />
This company has an approximately 60%<br />
share of the Brazilian market, in which there is<br />
demand for 1.3 billion servings. We are actively<br />
developing new product categories in Brazil. In<br />
March 2005, we launched the Yakissoba<br />
series, consisting of four pillow-type instant<br />
noodle products.<br />
> Europe<br />
In Europe, interest in Asian food has intensified<br />
in recent years. In April 2004, we established<br />
Nissin Foods Kft. in Hungary in preparation for<br />
the future expansion of our activities in Europe.<br />
This low-cost production base is now fully<br />
operational. We are also focusing on Russia as<br />
a new market for our products, and we are<br />
currently developing a marketing strategy<br />
designed to establish a market position.<br />
> People’s Republic of China<br />
The Chinese market for instant noodles has<br />
14 ANNUAL REPORT 2006
continued to expand rapidly, increasing from<br />
21.2 billion servings in 2001 to 44.3 billion in<br />
2005. In 2004, Nissin Foods acquired a capital<br />
interest in Hebei Hualong F&N Industry Group<br />
Co., Ltd., a major Chinese noodle manufacturer,<br />
and established a local subsidiary, Nissin<br />
Hualong Foods Co., Ltd. In 2005, Nissin<br />
Hualong Foods sold 7 billion servings. Its main<br />
sales areas are northern and northeastern China.<br />
Nissin Foods also has local subsidiaries in<br />
Shanghai and Guangdong and is building a<br />
network capable of covering major markets in<br />
China. We see China as our most important<br />
market, and we will continue to expand our<br />
operations there. In Hong Kong, the Nissin<br />
Foods Group and Winner Group control<br />
around 75% of the market for instant noodles<br />
and continue to achieve success in terms of<br />
both sales and profit.<br />
> Elsewhere in Asia<br />
In Asia, Nissin Foods has established local<br />
subsidiaries in India, Indonesia, Thailand and<br />
the Philippines. These companies manufacture<br />
and sell products designed to match local<br />
dietary preferences and customs.<br />
India<br />
India is seen as an important market for<br />
instant noodles, like other BRIC countries<br />
(Brazil, Russia, and China). Although noodles<br />
have not been so popular, with its population<br />
of 1.1 billion, India has major potential for<br />
future market growth. Indo Nissin Foods Ltd.<br />
is working to expand its market by focusing<br />
its marketing efforts on low-priced products<br />
costing 5 rupees (¥12–13) for a 50g serving.<br />
In the previous fiscal year, this strategy was<br />
reflected in a massive 160% year-on-year<br />
increase in sales.<br />
Indonesia<br />
Indonesia is a large market with demand for<br />
around 12.4 billion servings. However, competition<br />
is fierce. PT. NISSINMAS has been able<br />
to expand its sales through a differentiation<br />
strategy based on cost minimization and marketing<br />
efforts focused on low-priced products.<br />
NISSINMAS manufactures halal products, and<br />
in addition to sales within Indonesia, it is also<br />
working to expand exports, especially of the<br />
Top Ramen series, to other countries with large<br />
Islamic populations.<br />
Thailand<br />
Nissin Foods (Thailand) Co., Ltd. has taken<br />
advantage of a Japanese food boom in<br />
Thailand to introduce differentiated products.<br />
These include the Cup Noodles Japan Cup<br />
series, which are available in spicy pork and<br />
tempura soy sauce flavors, and the Yakisoba<br />
Cup series. This product features a high-speed<br />
strainer in the lid and is available in Japanese<br />
sauce and Thai curry flavors. The Yakisoba<br />
Cup series with the high-speed strainer lid has<br />
been especially popular, and the concept won<br />
a technology award in Thailand.<br />
The Philippines<br />
The original flavors of the Cup Noodles series<br />
have been very popular in the Philippines, and<br />
products featuring seafood flavors created in<br />
Japan account for over 30% of the sales of<br />
Nissin-Universal Robina Corporation. In the<br />
year ended March 31, 2006, we launched cuptype<br />
and pillow-type versions of harusame<br />
(bean-starch vermicelli) products, which were<br />
marketed as the Sotanghon series. These<br />
products were introduced in response to the<br />
increasing health-consciousness of consumers.<br />
They were extremely successful and<br />
made a major contribution to the expansion of<br />
our market share in the Philippines.<br />
Hong Kong<br />
Cup Noodles<br />
Indonesian<br />
Cup Noodles and<br />
Top Ramen<br />
Thai<br />
Cup Noodles and<br />
Yakisoba<br />
Indian<br />
Cup Noodles and<br />
Top Ramen<br />
Philippine<br />
Cup Noodles and<br />
Pancit Canton<br />
ANNUAL REPORT 2006<br />
15
Quality and Safety<br />
> Quality and Safety<br />
As the owner of its brands, Nissin Foods is determined to<br />
earn the confidence of consumers by consistently supplying<br />
safe and delicious products. As a food manufacturer,<br />
we believe that we have a mission to comply with all laws<br />
and regulations, and to provide consumers with safe products.<br />
We established a specialist quality control organization,<br />
the Food Safety Research Institute, to carry out stringent<br />
food safety checks.<br />
We are continually working to strengthen our qualitycontrol<br />
systems, and we have gained certification under<br />
the ISO 9000 series of international quality-control and<br />
quality assurance standards established by the<br />
International Organization for Standardization (ISO).<br />
Certification has been achieved at not only all of our plants<br />
and group companies in Japan and our overseas plants,<br />
but also at 35 sites operated by our suppliers.<br />
> The Food Safety Research Institute<br />
We established the Food Safety Research Institute in June<br />
2002. Its mission is to ensure the quality and safety of<br />
products supplied to consumers through quality assurance<br />
based on scientific methods. This food safety role<br />
involves a wide range of tasks, including raw material<br />
quality checks, inspections of suppliers’ facilities, the management<br />
of quality assurance systems in the Nissin Foods<br />
Group’s manufacturing plants, the development of new<br />
inspection and analysis methods, and safety checks relating<br />
to new product development. To ensure that the<br />
results of this work, including analyses, inspections and<br />
development activities, can immediately be reflected in<br />
management decisions, the Food Safety Research<br />
Institute operates independently of other organizational<br />
units and reports directly to the President.<br />
> Effective Checks for<br />
Residual Agricultural Chemicals<br />
Nissin Foods uses a wide range of raw materials in its products,<br />
including vegetables, cereals, livestock products and<br />
marine products. We have developed our own analysis systems<br />
to ensure the safety of these ingredients. A particular<br />
priority has been the development of effective methods for<br />
the detection of residual agricultural chemicals and veterinary<br />
pharmaceuticals. The Food Safety Research Institute is using<br />
our vast resource of accumulated analysis data to enhance<br />
the analysis systems that we have developed. In March<br />
2006, we introduced NASRAD-550, a new inspection system<br />
designed to accommodate requirements under the<br />
“Positive List” system that took effect in May 2006 under an<br />
amendment to Article 11 of the Food Sanitation Law.<br />
NASRAD-550 consists of three high-speed analysis systems<br />
capable of detecting a wide range of agricultural chemicals.<br />
NASRAC-450 can analyze approximately 450 chemicals<br />
in all types of agricultural products, while NASRAC-<br />
G250 can detect around 250 chemicals in cereals.<br />
NASVED-100 covers approximately 100 different veterinary<br />
pharmaceuticals in livestock products and marine products.<br />
16 ANNUAL REPORT 2006
Fishing grounds<br />
Inspection of the<br />
surroundings and<br />
veterinary-use<br />
pharmaceuticals<br />
Farms<br />
Inspection of the<br />
surroundings and<br />
residual agricultural<br />
chemicals<br />
Breeders<br />
Inspection of the surroundings<br />
and veterinary-use<br />
pharmaceuticals, management<br />
of animal growth status and<br />
water control<br />
Feed plants<br />
Management of hygiene and<br />
manufacturing process, and<br />
safety inspection,<br />
improvement and instruction<br />
Inspection of residual agricultural chemicals,<br />
veterinary-use pharmaceuticals, cancercausing<br />
substances, genetically modified<br />
organisms and microbe levels in ingredients<br />
Quality control between plants<br />
and inspection of analysis gap<br />
and correction<br />
Ingredient plants<br />
Food Safety Research Institute<br />
Consumers<br />
Nissin and Plants<br />
> Policy on Genetically<br />
Modified Crops<br />
Food Safety Research Institute to<br />
be Established in Shanghai<br />
In September 1999, Nissin Foods announced that it would<br />
not use genetically modified (GM) crops in its products and<br />
completed the transition in February 2000. We took this<br />
step to respect the wishes of those consumers who are<br />
concerned about GM crops. Specifically, we switched to<br />
non-GM soybeans used to make the fried tofu for Nissin no<br />
Donbei Kitsune and the miso (bean paste) for Nissin no<br />
Ramen-ya-san Sapporo Miso Fumi. We also switched to<br />
non-GM potatoes and corn for use as topping ingredients.<br />
> Allergy Labeling<br />
In April 2001, Japan introduced an allergy labeling system<br />
covering 24 ingredients (the number has since been<br />
increased to 25 ingredients). Eggs, milk, buckwheat, wheat<br />
and peanuts are classed as a “specified ingredients” for<br />
which allergy labeling is compulsory. Allergy labeling is recommended<br />
for the other 20 ingredients.<br />
Labels on the packaging of Nissin Foods products list<br />
not only the five specified ingredients, but also any of the<br />
other 20 ingredients for which labeling is recommended, if<br />
these are used in its products.<br />
Nissin Foods plans to open a Food Safety Research<br />
Institute in Shanghai in the fall of 2006. In recent years<br />
we have imported increasing volumes of Chinese raw<br />
materials into Japan, and we have therefore decided<br />
to create a new system under which these materials<br />
will be checked by the Food Safety Research Institute<br />
before they are exported. Only products that pass<br />
these checks will be imported into Japan.<br />
All imported raw materials are subject to stringent<br />
safety measures. In addition to quality assurance systems<br />
in the plants of our suppliers, materials also<br />
undergo a range of inspections and analyses conducted<br />
by the Food Safety Research Institute. The establishment<br />
of the Nissin Shanghai Food Safety Research<br />
Institute will allow us to carry out safety inspections<br />
more efficiently and at an earlier stage. We will also be<br />
able to monitor detailed information concerning the<br />
use of chemicals in China and the traceability of livestock<br />
products. The Nissin Shanghai Food Safety<br />
Research Institute will also help to raise the quality of<br />
raw materials by providing process management and<br />
technical guidance to the plants of suppliers in China.<br />
ANNUAL REPORT 2006<br />
17
Environmental Activities<br />
> Harmonious Coexistence<br />
In March 1999, Nissin Foods adopted an Environmental<br />
Charter in which it defined its policies with regard to initiatives<br />
to reduce global environmental loads and promote<br />
recycling. This document was a public statement of our<br />
corporate stance on environmental matters. We have also<br />
worked, as an environmentally concerned company, to<br />
achieve certification under the ISO 14001 standard established<br />
by the International Organization for Standardization<br />
for environmental management and auditing systems.<br />
Through this process, we have continued to design environment-friendly<br />
products, reduce resource losses and<br />
waste and conserve resources and energy. As of June 30,<br />
2006, we had completed certification for all four plants<br />
directly operated by Nissin Food Products Co., Ltd., for our<br />
headquarters in Osaka and Tokyo, ten group companies in<br />
Japan and two overseas companies.<br />
> Considering the Environment<br />
in All Processes<br />
Global warming is a serious problem. It is caused by human<br />
activities that lead to greenhouse-gas emissions.<br />
Environmental protection is a top priority for Nissin Foods,<br />
and we have implemented various initiatives to prevent global<br />
warming. For the boilers used to manufacture noodles, we<br />
plan to switch fuels from heavy oil to natural gas, which emits<br />
less CO2. In each manufacturing facility, we are making<br />
detailed efforts relating to each item we manufacture, such as<br />
revising the steaming machines and drying process, introducing<br />
an automatic control system for ventilators and conveyors<br />
and other measures.<br />
As part of our efforts to maintain the global environment,<br />
we are also reviewing our product designs and production<br />
processes throughout our facilities to ensure that<br />
finite resources are used effectively. For example, we have<br />
reduced water use through water recycling. We have also<br />
reduced the amount of material used to manufacture containers<br />
by reducing the unit weight of cups and the weight<br />
of recycled PET trays. Furthermore, we aim to achieve<br />
zero-emission status by recycling all<br />
waste products, including incinerator<br />
ash and waste plastic.<br />
Nissin Foods publishes an annual<br />
Japanese-language environmental<br />
report, which is also available on the<br />
Company’s web site :<br />
http://www.nissinfoods.co.jp/com/torikumi/greenplan/<br />
PROCESS FLOW<br />
INPUT<br />
Raw Materials<br />
Energy<br />
<br />
Recycling<br />
Packaging<br />
<br />
Production<br />
Water Resources<br />
Effluent<br />
<br />
Fuel<br />
CO2<br />
Distribution<br />
<br />
Consumption<br />
General Waste<br />
OUTPUT<br />
Final Disposal<br />
CO2<br />
18 ANNUAL REPORT 2006
Corporate Governance<br />
General Meeting of Shareholders<br />
Internal Control System<br />
Report<br />
Board of Directors<br />
Consultation/<br />
Recommendation<br />
Selection and<br />
Appointment<br />
Management Committee<br />
Investment and Loan<br />
Strategy Committee<br />
Executive Committee<br />
Audit<br />
Audit Report<br />
Selection and<br />
Appointment<br />
Representative Director<br />
Direction/<br />
Supervision<br />
Report<br />
Audit Report<br />
Direction/<br />
Report<br />
Board of Corporate Auditors<br />
Liaison<br />
Report<br />
Information Security Committee<br />
Environmental Committee<br />
Business Ethics Committee<br />
Selection and<br />
Appointment<br />
Liaison<br />
Internal<br />
Auditing<br />
Office<br />
Audit<br />
Audit<br />
Audit<br />
Report<br />
Liaison<br />
Liaison<br />
Audit<br />
Selection and<br />
Appointment<br />
Independent Auditors<br />
Business Execution<br />
Business Divisions<br />
Advice and<br />
Guidance<br />
Lawyers,<br />
Tax Accountants<br />
and Other<br />
Professionals<br />
Internal Activities<br />
> Basic Stance on Governance<br />
The greatest priorities for Nissin Foods are to supply safe<br />
products and to maximize the benefits to all stakeholders,<br />
including shareholders, consumers, employees and local<br />
communities. The improvement and reinforcement of corporate<br />
governance is another key priority, and we are constantly<br />
working to maintain high standards of objectivity and<br />
transparency in our management activities.<br />
For many years, we have appointed outside directors<br />
and auditors to energize management and ensure transparency<br />
by positively reflecting the views of non-employee<br />
experts in management. In June 1998, we also introduced<br />
an executive officer system to speed up decision making<br />
and separate management from business operations.<br />
> Setting Clear Corporate Functions<br />
Nissin Foods has 11 directors, including two outside directors.<br />
The Board of Directors meets monthly and convenes<br />
special meetings as necessary. The role of the Board of<br />
Directors is to deliberate on matters required by laws, regulations<br />
and the company articles. The directors also monitor<br />
business operations and supervise each other.<br />
Directors also participate in decision making and supervise<br />
operations at regular meetings of the Management<br />
Committee, which consists of full-time directors and standing<br />
auditors, and the Executive Committee, which is made up of<br />
full-time directors, standing auditors and executive officers.<br />
There are four corporate auditors, including two outside<br />
auditors, who audit operations in accordance with standards<br />
established by the Board of Corporate Auditors, the audit<br />
policy for each accounting period, and the audit plan. They<br />
attend important meetings, including meetings of the Board<br />
of Directors, and interview directors and other officers concerning<br />
the state of operations.<br />
The Board of Directors nominates candidates for directorships,<br />
and sets levels of remuneration.<br />
> Status of Internal Control Systems<br />
The development, maintenance and appropriate operation<br />
of internal controls is a critical management task involving<br />
the entire corporate organization. Individual organizational<br />
units have established internal checks and balances covering<br />
day-to-day operations, including procurement, production,<br />
logistics, sales and administration. We are also setting<br />
up checks and balances between organizational units.<br />
The Internal Auditing Office and the corporate auditors<br />
check internal control system effectiveness through operational<br />
audits of each unit and order remedial action if called<br />
for. Corporate auditors also audit internal control systems<br />
relating to management in general.<br />
ANNUAL REPORT 2006<br />
19
Founder Momofuku Ando:<br />
Father of an Industry<br />
Innovative Pioneer<br />
The instant noodle market was launched in Japan by<br />
the 1958 invention of Chicken Ramen by Momofuku<br />
Ando, the founder of Nissin Foods. In 1971, he successfully<br />
brought to market Cup Noodle, the world’s<br />
first cup-type instant noodle product. It was a completely<br />
new food product that could be eaten anytime,<br />
anywhere just by adding boiling water. This innovation<br />
inspired a new market, now a worldwide industry with<br />
demand hovering at 85.7 billion servings in 2005, and<br />
revolutionized eating habits around the globe.<br />
Criteria and Principles Behind<br />
Product Development<br />
Mr. Ando’s concept for Chicken Ramen was underpinned<br />
by five basic criteria—good taste, food safety, convenience,<br />
reasonable price and long-term storage—and this<br />
concept still forms the basis of product development at<br />
Nissin Foods today.<br />
He also put forward three principles, loosely translated<br />
as ”Peace will come to the world when the people have<br />
enough to eat,” “Eating smart will enhance beauty and<br />
health” and “The creation of food will serve society.” These<br />
principles, reinforced by an innovative spirit, laid the foundation<br />
for the business activities and product development<br />
that Nissin Foods currently pursues.<br />
Pursuing a Vision for the Industry<br />
To promote instant noodle industry development, Mr.<br />
Ando founded the Japan Convenience Food Industry<br />
Association (JCFIA) in 1964 and set guidelines for fair<br />
competition and product quality, including early establishment<br />
of Japan Agricultural Standard qualifications and<br />
introduction of production dates on packaging.<br />
Seeking a forum for enhancing the quality of instant<br />
noodles, the JCFIA formed the International Ramen<br />
Manufacturers’ Association (IRMA) in 1997 with Mr. Ando<br />
as chairman and participation from leading instant noodle<br />
manufacturers in Japan and from around the world.<br />
Currently, IRMA comprises major instant noodle makers and<br />
one industry organization representing nine countries.<br />
IRMA hosted the fifth World Ramen Summit in April 2006<br />
in Seoul where the primary topics of discussion were CODEX<br />
standards concerning food safety and quality control.<br />
Space Ram<br />
Mr. Momofuku Ando,<br />
showing Space Ram<br />
In July 2005, Nissin Foods marked a world first with its<br />
Space Ram (space ramen), which was jointly developed<br />
with the Japan Aerospace Exploration Agency (JAXA) to<br />
meet NASA’s strict quality and safety standards. Space<br />
Ram is unique, and not only because it was adopted for<br />
Japanese astronaut Soichi Noguchi’s voyage in the space<br />
shuttle Discovery. For example, the dry noodles reconstitute<br />
with water heated to 70°C (rather than 100°C), since that is<br />
what is available on the space shuttle. In addition, the<br />
soup’s viscosity was increased to better keep the soup and<br />
20 ANNUAL REPORT 2006
Tasting corner at the Instant Ramen Museum<br />
Visitors can experience making Chicken Ramen<br />
from scratch at the Instant Ramen Museum.<br />
noodles together in zero gravity and so as not to spatter.<br />
The flash-frying that was invented for Chicken Ramen by Mr.<br />
Ando was approved for use in Space Ram, further validating<br />
the method. We can now say that Nissin Foods’ instant<br />
noodles are the most widely used not only in the world, but<br />
also in the universe.<br />
Mr. Ando’s ideals have been realized in various ways<br />
beyond the realm of Company activities, the most important<br />
among which are presented below.<br />
Instant Ramen Museum<br />
The Momofuku Ando Instant Ramen Museum opened in<br />
Ikeda, near Osaka, in November 1999, as a symbol of Mr.<br />
Ando’s desire to emphasize the importance of invention and<br />
discovery as well as the fun side of challenge.<br />
The Hands-on Workshop is the only place in the world<br />
where visitors make their own Chicken Ramen, experiencing<br />
the whole process, from kneading to steaming—infusing a<br />
flavor, of course—and flash-frying to dry the noodles.<br />
MY CUP <strong>NO</strong>ODLE FACTORY lets visitors design a cup<br />
and fill it with ingredients of their choice for a Cup Noodle<br />
product like no other. The Instant Ramen Museum provides<br />
a history of postwar food culture in Japan and it has earned<br />
high marks as an extracurricular nutritional education experience<br />
for elementary school children. As of summer 2006,<br />
the museum had welcomed more than 1,000,000 people.<br />
Helping Youth with<br />
the Ando Foundation<br />
Mr. Ando personally provided the funds to establish the<br />
Ando Foundation, which supports sports, such as track and<br />
field for elementary school pupils, and other outdoor events<br />
for children throughout Japan. The foundation’s activities are<br />
based on the principle that food and sports are the two<br />
most important factors in leading a healthy life.<br />
Mr. Ando also led the establishment of the Shokusokai,<br />
“Food Innovation Society,” within the Ando Foundation to<br />
contribute to the improvement and development of world<br />
food culture. It presents an annual award named after Mr.<br />
Ando honoring innovative researchers who contribute to the<br />
creation and development of new food products.<br />
By working together with the Ando foundation to help it<br />
realize its principles through these various projects, Nissin<br />
Foods contributes to society by promoting healthy development<br />
in young people, with whom the future rests.<br />
MY CUP <strong>NO</strong>ODLE FACTORY at the Instant Ramen Museum<br />
Shokusokai award ceremony<br />
ANNUAL REPORT 2006<br />
21
Board of Directors (As of June 29, 2006)<br />
From left: Takahisa Yanagida, Ken Sasahara,Takayuki Naruto, Susumu Nakagawa, Momofuku Ando, Koki Ando, Akihide Matsuo, Taiji Matsumura,<br />
Yasuhiro Matsuyama and Osamu Tetsubayashi<br />
Founder<br />
Momofuku Ando<br />
President & Representative Director<br />
Koki Ando<br />
Managing Director &<br />
Representative Director<br />
Susumu Nakagawa<br />
In charge of Sales<br />
Managing Directors<br />
Akihide Matsuo<br />
General Manager of Corporate Production<br />
Planning Division and in charge of Corporate<br />
Planning<br />
Takayuki Naruto<br />
President of Nissin Foods (U.S.A.) Co., Inc.<br />
Directors<br />
Taiji Matsumura<br />
General Manager of Central Research Institute<br />
Ken Sasahara<br />
General Manager of International Division<br />
Yasuhiro Matsuyama<br />
General Manager of Sales Division<br />
Takahisa Yanagida<br />
General Manager of Financial Division<br />
Osamu Tetsubayashi<br />
General Manager of Marketing Division<br />
Yorihiko Kojima*<br />
President & CEO, Mitsubishi Corp.<br />
Eizo Kobayashi*<br />
President & CEO, ITOCHU Corp.<br />
*Non-executive director<br />
Standing Corporate Auditors<br />
Hayato Togami<br />
Yuichi Terada<br />
Corporate Auditors<br />
Toru Horinouchi<br />
Hiroshi Takano<br />
Corporate Executive Officers<br />
Nobuyuki Akamatsu<br />
Deputy General Manager of Central Research Institute<br />
Masami Nishio<br />
General Manager of Corporate Planning Division<br />
Toshihiro Yamada<br />
General Manager of Food Safety Research Institute<br />
Takashi Takahashi<br />
General Manager of Shizuoka Plant<br />
Takashi Yokogoshi<br />
General Manager of Shiga Plant<br />
Kazumasa Santo<br />
General Manager of Osaka Sales Division<br />
Hideki Hattori<br />
General Manager of Personnel Division<br />
Yoshinori Miura<br />
General Manager of Tokyo Sales Division<br />
Masafumi Miyata<br />
General Manager of CVS Sales Division<br />
Katsumi Tomomasa<br />
General Manager of Sales Planning & Control<br />
Division<br />
22 ANNUAL REPORT 2006
Financial Section<br />
Nissin Food Products Co., Ltd.<br />
Consolidated Six-Year Summary of Selected Financial Data<br />
Millions of yen<br />
(except per share information)<br />
Years ended March 31 2006 2005 2004 2003 2002 2001<br />
For the year<br />
Net sales<br />
¥ 321,700<br />
¥ 316,973<br />
¥ 320,033<br />
¥ 315,279<br />
¥ 308,463<br />
¥ 301,082<br />
Cost of sales<br />
158,209<br />
156,877<br />
161,979<br />
160,258<br />
157,663<br />
152,652<br />
Gross profit<br />
163,491<br />
160,096<br />
158,054<br />
155,021<br />
150,800<br />
148,430<br />
Selling, general and<br />
administrative expenses<br />
131,512<br />
131,133<br />
134,851<br />
128,621<br />
125,984<br />
121,146<br />
Operating income<br />
31,979<br />
28,963<br />
23,203<br />
26,400<br />
24,816<br />
27,284<br />
Other income (expenses)<br />
(2,167)<br />
(1,891)<br />
1,502<br />
(880)<br />
(4,741)<br />
(2,388)<br />
Income before income taxes and<br />
minority interests<br />
29,812<br />
27,072<br />
24,705<br />
25,520<br />
20,075<br />
24,896<br />
Income taxes<br />
14,469<br />
10,244<br />
10,437<br />
10,901<br />
7,613<br />
9,810<br />
Minority interests in earnings of<br />
consolidated subsidiaries<br />
(46)<br />
216<br />
217<br />
197<br />
526<br />
(117)<br />
Net income<br />
15,389<br />
16,612<br />
14,051<br />
14,422<br />
11,936<br />
15,203<br />
Per share<br />
Net income<br />
¥ 125.09<br />
¥ 134.36<br />
¥ 113.61<br />
¥ 115.65<br />
¥ 93.91<br />
¥ 119.32<br />
Cash dividends<br />
30.00<br />
30.00<br />
30.00<br />
30.00<br />
30.00<br />
24.00<br />
Shareholders’ equity<br />
2,167.81<br />
2,091.16<br />
1,980.14<br />
1,892.89<br />
1,835.03<br />
1,812.45<br />
At year-end<br />
Working capital * 1<br />
¥ 82,404<br />
¥ 56,332<br />
¥ 62,017<br />
¥ 60,044<br />
¥ 71,086<br />
¥ 45,175<br />
Property, plant and equipment—net<br />
69,019<br />
75,332<br />
81,243<br />
87,537<br />
82,444<br />
94,568<br />
Total assets<br />
366,801<br />
361,105<br />
343,645<br />
331,994<br />
326,913<br />
326,196<br />
Long-term liabilities<br />
18,975<br />
19,414<br />
16,175<br />
11,739<br />
11,118<br />
9,464<br />
Shareholders’ equity<br />
263,199<br />
258,139<br />
244,439<br />
233,708<br />
230,582<br />
230,930<br />
R&D expenses<br />
¥ 2,727<br />
¥ 2,697<br />
¥ 2,762<br />
¥ 2,757<br />
¥ 2,579<br />
¥ 2,541<br />
Capital expenditures<br />
3,517<br />
3,251<br />
6,766<br />
6,965<br />
6,312<br />
4,891<br />
Value & performance indicators<br />
Operating margin (%) * 2<br />
9.9<br />
9.1<br />
7.3<br />
8.4<br />
8.0<br />
9.1<br />
Return on assets (%) * 3<br />
4.2<br />
4.7<br />
4.2<br />
4.4<br />
3.7<br />
4.8<br />
Return on equity (%) * 4<br />
5.9<br />
6.6<br />
5.9<br />
6.2<br />
5.2<br />
6.8<br />
Inventory turnover (times) * 5<br />
12.6<br />
12.9<br />
13.6<br />
13.6<br />
14.1<br />
14.9<br />
Notes: 1. Working capital = Total current assets – Total current liabilities<br />
2. Operating margin = Operating income / Net sales<br />
3. Return on assets = Net income / Average total assets<br />
4. Return on equity = Net income / Average total shareholders’ equity<br />
5. Inventory turnover = Cost of sales / Average total inventory<br />
ANNUAL REPORT 2006<br />
23
Financial Review<br />
The scope of consolidation for this review of fiscal 2006, ended March 31, 2006, covers Nissin Food<br />
Products Co., Ltd. (the “Company”), 23 consolidated subsidiaries—10 in Japan and 13 overseas—and<br />
one affiliate company accounted for by the equity method (together, the “Group”).<br />
Sales by Geographic Area<br />
(excluding intersegment sales)<br />
(Billions of yen)<br />
308.5 315.3 320.0 317.0 321.7<br />
259.5 268.9 276.4 273.9 269.8<br />
28.3<br />
20.7<br />
26.4<br />
20.0<br />
’02 ’03 ’04 ’05 ’06<br />
Japan<br />
North America<br />
Other Areas<br />
23.9<br />
19.7<br />
23.9<br />
19.2<br />
Pillow-type noodles<br />
Cup-type noodles<br />
Chilled and frozen foods<br />
Others<br />
29.9<br />
22.0<br />
Net Sales by Category<br />
(Billions of yen)<br />
308.5 315.3 320.0 317.0 321.7<br />
43.7 43.3 45.5 44.0 48.9<br />
201.1 202.6 203.3 203.7 204.9<br />
37.0 39.1 39.7 39.9 40.7<br />
26.7 30.3 31.5 29.4 27.2<br />
’02 ’03 ’04 ’05 ’06<br />
INCOME ANALYSIS<br />
Net Sales<br />
The consolidated net sales of the Group for fiscal 2006 rose by 1.5% from ¥316,973 million in the previous<br />
fiscal year to ¥321,700 million (US$2,739 million), which was the record-high performance. This<br />
achievement was partially due to the positive effect of a weak yen on overseas sales, despite the challenged<br />
performance of high-priced products in the domestic market.<br />
Net sales in Japan, excluding intersegment sales, decreased 1.5% to ¥269,765 million (US$2,296<br />
million). Their contribution to the total consolidated net sales dropped as well, by 2.5 percentage points<br />
to 83.9%.<br />
The business environment surrounding the domestic instant noodle market remains intense and<br />
places an even greater drag on sales growth. The shrinking consumer population due to the aging society<br />
and declining birth rate is pushing down demand for the products. Turning to the aspect of product pricing,<br />
retail prices of instant noodle products are consistently low because of discounting by retailers and<br />
severe price competition in the retail trade industry. In order to break through these difficulties, domestic<br />
instant noodle manufacturers proactively introduced new products to the market to fulfill new consumer<br />
needs. From December onward, the severe winter weather throughout much of Japan supported steady<br />
demand, in contrast to the warm winters in previous years. Still, the aggregate sales of the instant noodle<br />
industry did not reach to and, in fact, were slightly lower than in the previous fiscal year.<br />
Amid these circumstances, the Company implemented marketing approaches and sales promotions,<br />
which constructively reflected consumers’ needs. These include the introduction of Cup Noodle Seafood<br />
Italian and other new products in connection with the Turin Winter Olympic Games in February, which successfully<br />
won public favor. Among existing products, Cup Noodle, the Company’s mainstay cup-type noodle<br />
brand, was firmly supported by consumers to record brisk sales under sales promotion with the catchphrase<br />
“<strong>NO</strong> <strong>BORDER</strong>,” and so as Chicken Ramen, the Company’s well-established pillow-type noodles.<br />
Sales of Nissin no Donbei also increased, owing to consumers’ growing fondness for traditional Japanese<br />
flavors. On the contrary however, products in the high price range, such as Nissin GooTa and Nissin Rao,<br />
slowed down, their sales affected by the sluggish performance of their product category as a whole.<br />
Looking at the performance of chilled and frozen foods, the mainstay product of the Company’s<br />
chilled food line Nissin Yakisoba recorded strong sales. Similarly, the aggregate sales of frozen foods<br />
sharply increased from the previous fiscal year, mainly by contributions from easily microwavable Nissin<br />
Spa-O and Nissin GooTa with satisfying volume and high quality ingredients.<br />
On the other hand, global demand for instant noodles has continued to grow. According to the<br />
International Ramen Manufacturers Association (IRMA), the aggregate global demand for instant noodles<br />
for calendar 2005 was estimated at 85.7 billion servings, an increase of 6 billion servings from 2004. In<br />
particular, the market in the People’s Republic of China (PRC) is rapidly expanding, and this created additional<br />
demand of 5.3 billion servings in 2005, which is almost equal to the total annual demand in Japan.<br />
In such a business environment, the Company continued the promotion of its overseas business in North<br />
America, the PRC and other major markets including Asia and European countries. Performance in overseas<br />
markets during fiscal 2006 shows that Top Ramen in North America and Demae Itcho in Hong Kong,<br />
among pillow-type instant noodles, recorded strong sales, while aggregate sales of cup-type instant noodles<br />
also showed strong growth, particularly in the North American markets where fine marketing efforts<br />
for CHOW MEIN and other new category products were rewarded with increased exposure in retail<br />
stores. Moreover, sales overseas (please refer to p. 44, “Information by geographic area”) were favorably<br />
affected by a weak yen, and these factors lifted the total overseas net sales, excluding intersegment sales,<br />
by 20.7% to ¥51,935 million (US$442 million) compared to the previous fiscal year. A breakdown by geographic<br />
area shows net sales in North America of ¥29,903 million (US$255 million), a 25.1% increase from<br />
the previous year. In other areas that figure was ¥22,032 million (US$187 million), a 15.2% increase.<br />
Net sales by business segment are being disclosed from this fiscal year. Net sales of the Company’s<br />
24 ANNUAL REPORT 2006
mainstay business Instant Noodle and Associated Business, excluding intersegment sales, amounted to<br />
¥294,510 million (US$2,507 million) and accounted for 91.5% of total net sales. Net sales of Other Business<br />
was ¥27,190 million (US$231 million), 8.5% of the total net sales. Detailed review of the performance of<br />
Instant Noodle and Associated Business shows that instant noodles, the leading product line, recorded<br />
sound growth in its domestic sales, especially of top-brand products such as Chicken Ramen and Cup<br />
Noodle. Sales of instant noodles also increased steadily in overseas markets, and the instant noodle category<br />
as a whole is showing continuously steady performance as the foundation of the Company’s businesses.<br />
(Please refer to Review of Operations on P.9-13 for details of performance by product category.)<br />
Cost of Sales and Selling, General and Administrative Expenses<br />
Cost of sales increased along with the increase of net sales, by 0.8% on the previous fiscal year to<br />
¥158,209 million (US$1,347 million). However, the cost of sales ratio slightly improved from 49.5% in the<br />
previous year to 49.2%.<br />
Selling, general and administrative (SG&A) expenses amounted to ¥131,512 million (US$1,120 million).<br />
The amount resulted in a small increase of 0.3% on the previous year’s ¥131,133 million, while the ratio of<br />
SG&A expenses to net sales dropped 0.5% year-on-year to 40.9%. Among SG&A items, promotional<br />
expenses (variable expenses) amounted to ¥74,781 million, a year-on-year increase by 2.8%, and its ratio<br />
to net sales also rose by 0.2 points to 23.2%. On the other hand, distribution expenses (variable expenses)<br />
and advertising expenses (fixed expenses) decreased in respects of both amount and ratio to net<br />
sales; distribution expenses edged down by 0.5% year on year to ¥17,418 million, and advertising<br />
expenses dropped to by 5.9% to ¥12,328 million.<br />
Costs and Expenses, and Net Sales Ratio<br />
Millions of yen<br />
2006 2005<br />
Net Sales<br />
Net Sales<br />
Year ended March 31, 2006 and 2005 Ratio Ratio<br />
Cost of sales ¥158,209 49.2% ¥156,877 49.5%<br />
SG&A expenses 131,512 40.9 131,133 41.4<br />
Promotional expenses 74,781 23.2 72,778 23.0<br />
Advertising expenses 12,328 3.8 13,098 4.1<br />
Distribution expenses 17,418 5.4 17,509 5.5<br />
Other expenses 26,985 8.5 27,748 8.8<br />
Operating Income, Other Income (Expenses) and Net Income<br />
As a result of higher net sales, lower cost of sales ratio and a drop in the ratio of SG&A expenses to net<br />
sales, consolidated operating income for fiscal 2006 rose to ¥31,979 million (US$272 million), a 10.4% rise<br />
over the previous year’s figure. The operating margin also edged up by 0.8 percentage point to 9.9%.<br />
Other expenses, net, were ¥2,167 million (US$18 million), a ¥276 million increase over that for the previous<br />
year. Major income factors include the absence of a ¥3,569 million provision for accrued retirement<br />
benefits to directors and statutory auditors posted in the previous fiscal year following revision of the regulations<br />
for retirement benefits to directors and statutory auditors and an increase in gain on sales of marketable<br />
securities from ¥375 million to ¥3,073 million (US$26 million). On the other hand, newly posted<br />
expenses and losses outweighed the above income factors. Such expenses and losses include a ¥5,632<br />
million (US$48 million) loss on impairment of fixed assets recorded due to adoption of new accounting standards<br />
(please refer to Note 3 to the consolidated financial statements), and a ¥2,557 million (US$22 million)<br />
loss on revaluation of investments in two companies in the PRC.<br />
As a result, income before income taxes and minority interests climbed 10.1% year on year to<br />
¥29,812 million (US$254 million).<br />
Income taxes for fiscal 2006 amounted to ¥14,469 million (US$123 million), mainly due to loss on<br />
Operating Income and<br />
Operating Margin<br />
(Billions of yen)<br />
24.8 26.4 23.2<br />
8.0<br />
Interest Coverage Ratio<br />
(Times)<br />
178.9<br />
8.4<br />
471.5<br />
7.3<br />
Operating income<br />
Operating margin<br />
412.6<br />
29.0<br />
9.1<br />
’02 ’03 ’04 ’05 ’06<br />
688.7<br />
’02 ’03 ’04 ’05 ’06<br />
*Interest coverage ratio =<br />
operating cash flow/<br />
interest payments<br />
(%)<br />
32.0<br />
9.9<br />
653.5<br />
ANNUAL REPORT 2006<br />
25
Total Assets and ROA<br />
(Billions of yen)<br />
(%)<br />
361.1 366.8<br />
326.9 332.0<br />
343.6<br />
impairment of fixed assets for business operations and loss on revaluation of investments, for which tax<br />
effects were not allowed to be recognized. Therefore, the adjustments to income taxes increased. And the<br />
effective income tax rate rose to 48.53%.<br />
Net income for fiscal 2006 was ¥15,389 million (US$131 million), a year-on-year decrease by 7.4%. The<br />
ratio of net income to net sales also dropped by 0.4 percentage point, from 5.2% to 4.8%. Net income per<br />
share decreased as well to ¥125.09 (US$1.06), ¥9.27 down from ¥134.36 in the previous fiscal year.<br />
3.7<br />
4.4<br />
4.2<br />
4.7<br />
4.2<br />
LIQUIDITY AND CAPITAL RESOURCES<br />
’02 ’03 ’04 ’05 ’06<br />
Total assets<br />
ROA<br />
Working Capital and<br />
Current Ratio<br />
(Billions of yen)<br />
71.1<br />
’02 ’03 ’04 ’05 ’06<br />
Working capital<br />
Current ratio<br />
Shareholders’ Equity<br />
and ROE<br />
(Billions of yen)<br />
’02 ’03 ’04 ’05 ’06<br />
Shareholders’ equity<br />
ROE<br />
(%)<br />
258.1 263.2<br />
244.4<br />
230.6 233.7<br />
5.2<br />
60.0 62.0 56.3<br />
189.6<br />
175.3 181.2<br />
173.3<br />
6.2<br />
5.9<br />
6.6<br />
5.9<br />
(%)<br />
82.4<br />
205.5<br />
Working capital =<br />
Total current assets - Total current liabilities<br />
Current ratio =<br />
Total current assets / Total current liabilities<br />
Cash Flows<br />
Cash and cash equivalents as of March 31, 2006 amounted to ¥61,570 million (US$524 million), ¥4,756<br />
million lower than the previous year’s ¥66,326 million.<br />
Net cash provided by operating activities was ¥26,636 million (US$227 million), a year-on-year<br />
decrease of ¥3,623 million from the ¥30,259 million of the previous year. Major factors of this drop include<br />
¥3,718 million (US$32 million) paid as provision for accrued retirement benefits to directors and statutory<br />
auditors from the sum of ¥3,877 million, posted in the previous fiscal year following the revision of the regulations<br />
regarding retirement benefits to directors and statutory auditors. Another factor of the decrease<br />
was that, although the amount of income tax paid in the previous year was lower because of a tax deduction<br />
on losses that was not tax-deductible previously, there was no such special factor this fiscal year and<br />
so the amount of income tax paid increased from ¥7,458 million in the previous year to ¥11,001 million<br />
(US$94 million) this year.<br />
Net cash used in investing activities was ¥20,068 million (US$171 million) for fiscal 2006, a ¥10,280<br />
million drop from the figure for the previous fiscal year. Major in-flow factors include proceeds from sales<br />
and redemption of investments in securities and marketable securities, amounting to ¥50,033 million<br />
(US$426 million) and ¥12,453 million (US$106 million), respectively. On the other hand, major out-flows<br />
were payments for purchases of investments in securities and marketable securities, ¥45,834 million<br />
(US$390 million) and ¥31,064 million (US$264 million), respectively.<br />
Net cash used in financing activities jumped to ¥12,940 million (US$110 million), a ¥7,231 million<br />
increase from that of the previous year. This increase was largely due to ¥6,925 million (US$59 million)<br />
repurchase of treasury stocks less sales, as well as ¥5,553 million (US$47 million) cash dividends paid.<br />
Cash Flow Highlights<br />
Millions of yen<br />
Year ended March 31 2006 2005 2004<br />
Net cash provided by operating activities ¥26,636 ¥30,259 ¥22,213<br />
Net cash used in investing activities (20,068) (30,348) (20,453)<br />
Net cash used in financing activities (12,940) (5,709) (3,813)<br />
Cash and cash equivalents at the end of the year ¥61,570 ¥66,326 ¥72,140<br />
Assets, Liabilities and Shareholders’ Equity<br />
Total assets as of March 31, 2006 stood at ¥366,801 million (US$3,123 million), a 1.6% increase compared<br />
with the previous year’s ¥361,105 million. Return on assets (ROA), on the other hand, dropped by<br />
0.5 percentage point from 4.7% to 4.2%, reflecting the decrease in net income.<br />
Total current assets amounted to ¥160,496 million (US$1,366 million), a substantial increase by<br />
20.5% from the previous year. Although cash and deposits decreased by ¥15,841 million year on year,<br />
marketable securities grew by ¥43,867 million.<br />
Net property, plant and equipment decreased by 8.4% to ¥69,019 million (US$588 million), mainly due<br />
to depreciation, as well as ¥5,632 million (US$48 million) impairment loss recorded in accordance with<br />
26 ANNUAL REPORT 2006
adoption of accounting for impairment of fixed assets.<br />
Among investments and other assets, investments in securities decreased ¥9,467 million. Deferred<br />
income taxes on land revaluation as well, which amounted to ¥1,594 million in the previous fiscal year,<br />
was restated as zero as a result of review of recoverability as of March 31, 2006. Other deferred income<br />
taxes also decreased by ¥3,964 million following review of its valuation allowance. As a result, total investments<br />
and other assets declined by 10.1% to ¥137,286 million (US$1,169 million) from ¥152,625 million<br />
in the previous year.<br />
Total liabilities amounted to ¥97,067 million (US$826 million), with an increase by 0.9% on the previous<br />
year’s ¥96,230 million. Of this amount, total current liabilities was ¥78,092 million (US$665 million), a<br />
year-on-year increase of 1.7%. Working capital showed a substantial increase of 46.3% from the previous<br />
fiscal year’s figure, due to the increase of current assets, which overweighed the increase of current liabilities.<br />
The current ratio as well marked a large improvement to 205.5% from 173.3%.<br />
Total shareholders’ equity amounted to ¥263,199 million (US$2,241 million), a 2.0% up on ¥258,139<br />
million in the previous fiscal year. Major increases were a ¥9,870 million rise in retained earnings mainly<br />
due to net income posted, a ¥3,785 million increase in net unrealized holding gain on securities, and a<br />
¥3,524 million change in translation adjustments, from the minus of ¥3,282 million in the previous year to<br />
the plus of ¥242 million in fiscal 2006. Major decreases, on the other hand, included a ¥5,209 million land<br />
revaluation reserve as a result of review of recoverability of related deferred tax assets. Treasury stock also<br />
rose by ¥6,925 million, largely due to purchase in the stock markets.<br />
As a result of the increase in total shareholders’ equity, shareholders’ equity per share also rose by<br />
3.7% to ¥2,167.81 (US$18.45) from the previous year’s ¥2,091.16. However, return on equity (ROE)<br />
dropped by 0.7 percentage point to 5.9%, compared with the previous year’s 6.6%.<br />
ADDITIONAL INFORMATION<br />
Significant Business Agreements<br />
With regard to the Company’s capital participation in Hebei Hualong F&N Industry Group Co., Ltd., (hereafter,<br />
“Hebei Hualong”), a major manufacturer of instant noodles and flour in the PRC, which was undertaken<br />
to expand and thereby reinforce the Company’s instant noodle operations in the PRC, the<br />
Company concluded on May 12, 2004, a joint-venture agreement with Hebei Jinmailang Mianye Co., Ltd.,<br />
the parent company of Hebei Hualong.<br />
Hebei Jinmailang Mianye split Hebei Hualong into two new companies—Nissin Hualong Foods Co.,<br />
Ltd., and Hebei Nissin Hualong Paper Products Co., Ltd.—and through capital increases subscribed to by<br />
its Hong Kong-based subsidiary Nissin Foods Co., Ltd., the Company had as of March 31, 2005,<br />
acquired 14.9% registered equity in each newly established company.<br />
The Company plans to eventually acquire an equity stake equivalent to 33.4% of registered equity.<br />
The investment is expected to reach about ¥20 billion.<br />
(%)<br />
Shareholders’ Equity<br />
Ratio<br />
70.5<br />
70.4<br />
71.1<br />
71.5<br />
’02 ’03 ’04 ’05 ’06<br />
Shareholders’ Equity<br />
per Share<br />
(Yen)<br />
1,835.03<br />
1,892.89<br />
1,980.14<br />
2,091.16<br />
71.8<br />
2,167.81<br />
’02 ’03 ’04 ’05 ’06<br />
Risk Information<br />
Conditions that have the potential to significantly influence the decisions of investors are presented below.<br />
Any conditions with reference to the future are based on information available as of June 29, 2006. The<br />
Company acknowledges the possibility that these risks can arise and will make every effort to prevent<br />
such risks from appearing and address resulting situations if such risks do appear.<br />
(1) Reliance on Certain Business Clients<br />
Mitsubishi Corporation, ITOCHU Corporation, MITSUI & CO., LTD., and Toshoku Ltd. are the primary buyers<br />
of the Company’s products and together account for 77.5% of the Company’s sales. Reliance on<br />
ANNUAL REPORT 2006<br />
27
these specific business clients concentrates transactions among highly creditworthy companies and<br />
thereby reduces the effort expended on credit control and minimizes credit risk. However, the Company’s<br />
own financial position could be negatively affected if the business activities of these sales agents failed,<br />
because the Company would have difficulty collecting accounts receivable.<br />
(2) Increases in Prices of Raw Materials<br />
The primary raw materials used for the Company’s products are agricultural commodities such as flour<br />
and palm oil, and petroleum-based items for packaging and wraps. The Company’s fiscal performance<br />
could be adversely impacted if political unrest or international disputes occur in the countries that produce<br />
these raw materials, or if the price of raw materials skyrockets because of crop failures caused by abnormal<br />
weather and other reasons.<br />
(3) Reduced Brand Value<br />
The Company’s mainstay products, particularly Chicken Ramen and the Cup Noodle series, have become<br />
household items to most consumers, thanks to years of accumulated technical expertise and product<br />
development capabilities. The Company emphasizes the establishment and protection of its brands.<br />
However, new products flood the instant noodle market every year and the relative brand value of the<br />
Company’s products could decline if another company were to achieve a revolutionary breakthrough in<br />
instant noodle development.<br />
(4) Food Safety Issues<br />
The Company’s basic philosophy is to provide safe foods that consumers can enjoy without worry. In<br />
recent years, a high incidence of disquieting developments, such as avian influenza, bovine spongiform<br />
encephalopathy and the problem of residual pesticides in foods, have threatened to undermine food safety.<br />
The needs of consumers in regard to food safety have become more sophisticated. To enhance its<br />
ability to meet this need, the Company established the Food Safety Research Institute and continues to<br />
strengthen its quality control system. However, the Company’s financial position and fiscal performance<br />
could be unfavorably influenced if unusual health-related situations arise in the future that are beyond the<br />
Company’s conjecture, or if rumors mar the image of the Company’s products, even though such rumors<br />
were based on incidents not directly affecting the Company’s products.<br />
(5) Risk of Natural Disasters<br />
The Company has manufacturing facilities in Ibaraki, Shizuoka, Shiga and Yamaguchi prefectures. If a natural<br />
disaster, such as a large-scale earthquake or flooding from a typhoon, were to occur and manufacturing<br />
facilities incurred damage, the Company’s production structure as well as its financial position and fiscal<br />
performance could suffer because, for example, an interruption in operations would reduce output and<br />
repairs to facilities and equipment would raise expenses.<br />
(6) Risk of Product Liability<br />
As a food maker, the Company believes its mission is to provide safe, worry-free products to consumers<br />
and therefore applies strict quality control standards to its manufacturing activities. In addition, the Food<br />
Safety Research Institute studies ways to ensure the safety of raw materials and strives to reinforce quality<br />
control systems at each manufacturing facility. The Company also endeavors to lessen the potential of<br />
product liability claims to affect its financial position, and therefore is insured against product liability.<br />
However, if an accidents occurs through product liability and a situation arises wherein the Company<br />
must recall certain products, the insurance carried by the Company may not be sufficient to cover all<br />
claims. A tarnished reputation in society and a weakened corporate image could erode consumers’ willingness<br />
to buy the Company’s products. This situation could hurt the Company’s financial position and<br />
its fiscal performance.<br />
28 ANNUAL REPORT 2006
(7) Subsidiary and Affiliate Risks<br />
The Company’s overseas operations comprise local production and local marketing companies, which<br />
produce food products including instant noodles, and are run by subsidiaries and affiliates. If political<br />
unrest or international disputes arise in the regions where the Company’s subsidiaries and affiliates operate,<br />
or if issues threaten to undermine food safety, or if legal controls in certain countries create a situation<br />
that hinders production activities, then the financial position and fiscal performance of the Company<br />
could suffer.<br />
(8) Risk Related to Retirement Benefits Accounting<br />
Costs and obligations pertaining to retirement benefits are determined based on discount rates and other<br />
predetermined criteria used in actuarial calculations, and expected rate of return on pension assets. If<br />
actual results differ from predetermined criteria, or if predetermined criteria are amended, the actuarial difference<br />
is charged to the income of the fiscal year following the one in which the difference occurred.<br />
Although the actual return on pension assets has shown its trend of recovery, if a decline in discount rates<br />
and/or returns on the pension assets persists, the Company will have to carry a higher burden of pensionrelated<br />
costs, and this could hurt the Company’s financial position and its fiscal performance.<br />
(9) Risk of Declining Market Values on Marketable Securities<br />
The Company invests in marketable securities to ensure efficient application of funds and thereby maintain<br />
the integrity of principal. However, the Company’s financial position and fiscal performance could be<br />
adversely affected if worsening market conditions cause market values to decline or sluggish performances<br />
by equity investments force the Company to apply the accounting for impairment.<br />
(10) Risk Related to Information Systems<br />
The Company uses computers to process and store information on production, sales and administration.<br />
The Company adopted all possible measures to safeguard these information systems from computer<br />
virus-induced crashes, damage by hackers, and the risk of a breach in information security. However, the<br />
Company’s financial position and fiscal performance could be adversely affected if the Company’s systems<br />
were damaged and/or if data were leaked outside the organization, due to illegal access to the systems<br />
by unauthorized individuals through technologies that the Company has not envisioned, or unknown<br />
computer virus getting through established safeguards.<br />
(11) Risk Related to Accounting for Impairment of Fixed Assets<br />
The Company owns various tangible fixed assets for the purpose of its businesses. These fixed assets<br />
could face in the future the substantial decline in their fair values and/or future cash flows they were to<br />
generate, and thus would have possibility of impairment loss recognition in conformity with accounting for<br />
impairment of fixed assets. Such circumstances could negatively affect the Company’s financial position<br />
and fiscal performance.<br />
ANNUAL REPORT 2006<br />
29
Nissin Food Products Co., Ltd.<br />
Consolidated Balance Sheets<br />
As of March 31, 2006 and 2005<br />
Thousands of<br />
Millions of yen U.S. dollars (Note 1)<br />
2006 2005 2006<br />
ASSETS<br />
Current assets:<br />
Cash and deposits (Note 4)<br />
¥ 45,116<br />
¥ 60,957<br />
$ 384,064<br />
Marketable securities (Note 5)<br />
56,995<br />
13,128<br />
485,188<br />
Receivables:<br />
Trade notes<br />
95<br />
148<br />
809<br />
Trade accounts<br />
37,560<br />
38,743<br />
319,741<br />
Other<br />
1,356<br />
1,409<br />
11,543<br />
Less: Allowance for doubtful receivables<br />
(259)<br />
(338)<br />
(2,205)<br />
Inventories (Note 6)<br />
12,709<br />
12,355<br />
108,189<br />
Deferred income taxes (Note 10)<br />
6,390<br />
6,100<br />
54,397<br />
Other current assets<br />
534<br />
646<br />
4,546<br />
Total current assets<br />
160,496<br />
133,148<br />
1,366,272<br />
Property, plant and equipment:<br />
Land (Note 7)<br />
25,882<br />
28,546<br />
220,329<br />
Buildings and structures<br />
65,622<br />
64,612<br />
558,628<br />
Machinery, equipment and vehicles<br />
81,705<br />
78,579<br />
695,539<br />
Construction in progress<br />
720<br />
350<br />
6,129<br />
Other<br />
585<br />
1,995<br />
4,980<br />
174,514<br />
174,082<br />
1,485,605<br />
Less: Accumulated depreciation<br />
(105,495)<br />
(98,750)<br />
(898,059)<br />
Property, plant and equipment, net<br />
69,019<br />
75,332<br />
587,546<br />
Investments and other assets:<br />
Investments in securities (Note 5)<br />
120,494<br />
129,961<br />
1,025,743<br />
Other investments<br />
10,043<br />
12,611<br />
85,494<br />
Long-term loans to an affiliate<br />
175<br />
200<br />
1,490<br />
Long-term loans<br />
6<br />
15<br />
51<br />
Deferred income taxes (Note 10)<br />
275<br />
4,239<br />
2,341<br />
Deferred income taxes on land revaluation (Note 7)<br />
—<br />
1,594<br />
—<br />
Other assets<br />
6,462<br />
4,168<br />
55,010<br />
Less: Allowance for doubtful receivables<br />
(169)<br />
(163)<br />
(1,439)<br />
Total investments and other assets<br />
137,286<br />
152,625<br />
1,168,690<br />
Total assets<br />
¥ 366,801<br />
¥ 361,105<br />
$3,122,508<br />
30 ANNUAL REPORT 2006
Thousands of<br />
Millions of yen U.S. dollars (Note 1)<br />
2006 2005 2006<br />
LIABILITIES, MI<strong>NO</strong>RITY INTERESTS AND SHAREHOLDERS’ EQUITY<br />
Current liabilities:<br />
Short-term borrowings (Note 8)<br />
¥ 2,854<br />
¥ 3,038<br />
$ 24,295<br />
Payables:<br />
Trade notes<br />
756<br />
837<br />
6,436<br />
Trade accounts<br />
33,911<br />
32,846<br />
288,678<br />
Other<br />
20,107<br />
20,557<br />
171,167<br />
Accrued expenses<br />
7,460<br />
7,325<br />
63,506<br />
Accrued income taxes (Note 10)<br />
8,186<br />
7,565<br />
69,686<br />
Other current liabilities (Note 10)<br />
4,818<br />
4,648<br />
41,014<br />
Total current liabilities<br />
78,092<br />
76,816<br />
664,782<br />
Long-term liabilities:<br />
Deferred income taxes on land revaluation (Note 7)<br />
3,511<br />
—<br />
29,889<br />
Accrued retirement benefits to employees (Note 9)<br />
11,660<br />
13,580<br />
99,259<br />
Accrued retirement benefits to directors and statutory auditors<br />
1,800<br />
5,517<br />
15,323<br />
Other long-term liabilities (Note 10)<br />
2,004<br />
317<br />
17,060<br />
Total long-term liabilities<br />
18,975<br />
19,414<br />
161,531<br />
Minority interests<br />
6,535<br />
6,736<br />
55,631<br />
Contingent liability (Note 17)<br />
Shareholders’ equity (Note 11):<br />
Common stock<br />
Authorized—500,000,000 shares;<br />
Issued—127,463,685 shares at March 31, 2006 and 2005<br />
25,123<br />
25,123<br />
213,867<br />
Capital surplus<br />
48,385<br />
48,370<br />
411,893<br />
Retained earnings (Note 19)<br />
203,797<br />
193,927<br />
1,734,886<br />
Land revaluation reserve (Note 7)<br />
(7,568)<br />
(2,359)<br />
(64,425)<br />
Net unrealized holding gain on securities<br />
9,899<br />
6,114<br />
84,268<br />
Translation adjustments<br />
242<br />
(3,282)<br />
2,060<br />
Less: Treasury stock, at cost—6,061,522 shares at March 31, 2006<br />
4,033,982 shares at March 31, 2005<br />
(16,679)<br />
(9,754)<br />
(141,985)<br />
Total shareholders’ equity<br />
263,199<br />
258,139<br />
2,240,564<br />
Total liabilities, minority interests and shareholders’ equity<br />
¥ 366,801<br />
¥ 361,105<br />
$ 3,122,508<br />
See accompanying notes to consolidated financial statements.<br />
ANNUAL REPORT 2006<br />
31
Nissin Food Products Co., Ltd.<br />
Consolidated Statements of Income<br />
For the years ended March 31, 2006, 2005 and 2004<br />
Thousands of<br />
Millions of yen U.S. dollars (Note 1)<br />
2006 2005 2004 2006<br />
Net sales<br />
¥ 321,700<br />
¥ 316,973<br />
¥ 320,033<br />
$ 2,738,571<br />
Cost of sales (Note 12)<br />
158,209<br />
156,877<br />
161,979<br />
1,346,803<br />
Gross profit<br />
163,491<br />
160,096<br />
158,054<br />
1,391,768<br />
Selling, general and administrative expenses (Note 12)<br />
131,512<br />
131,133<br />
134,851<br />
1,119,537<br />
Operating income<br />
31,979<br />
28,963<br />
23,203<br />
272,231<br />
Other income (expenses) (Note 13):<br />
Interest and dividend income<br />
3,065<br />
2,538<br />
1,846<br />
26,092<br />
Interest expenses<br />
(41)<br />
(44)<br />
(54)<br />
(349)<br />
Equity in earnings of affiliates<br />
485<br />
427<br />
318<br />
4,129<br />
Loss on impairment of fixed assets (Notes 3 and 13 (a))<br />
(5,632)<br />
—<br />
—<br />
(47,944)<br />
Loss on devaluation of investments in securities<br />
(425)<br />
(112)<br />
(14)<br />
(3,618)<br />
Loss on revaluation of investments (Note 13 (b))<br />
(2,557)<br />
—<br />
—<br />
(21,767)<br />
Provision for accrued retirement benefits to directors<br />
and statutory auditors (Note 13 (c))<br />
—<br />
(3,569)<br />
—<br />
—<br />
Gain on sales of marketable securities<br />
3,073<br />
375<br />
980<br />
26,160<br />
Gain on sales of investments in securities<br />
194<br />
—<br />
—<br />
1,651<br />
Other, net<br />
(329)<br />
(1,506)<br />
(1,574)<br />
(2,801)<br />
Income before income taxes and minority interests<br />
29,812<br />
27,072<br />
24,705<br />
253,784<br />
Income taxes (Note 10):<br />
Current<br />
11,569<br />
11,629<br />
8,901<br />
98,485<br />
Deferred<br />
2,900<br />
(1,385)<br />
1,536<br />
24,687<br />
14,469<br />
10,244<br />
10,437<br />
123,172<br />
Income before minority interests<br />
15,343<br />
16,828<br />
14,268<br />
130,612<br />
Minority interests in (loss) earnings of consolidated subsidiaries<br />
(46)<br />
216<br />
217<br />
(392)<br />
Net income<br />
¥ 15,389<br />
¥ 16,612<br />
¥ 14,051<br />
$ 131,004<br />
See accompanying notes to consolidated financial statements.<br />
32 ANNUAL REPORT 2006
Nissin Food Products Co., Ltd.<br />
Consolidated Statements of Shareholders’ Equity<br />
For the years ended March 31, 2006, 2005 and 2004<br />
Thousands of<br />
Millions of yen U.S. dollars (Note 1)<br />
2006 2005 2004 2006<br />
Common stock:<br />
Balance at begining and end of the year<br />
¥ 25,123<br />
¥ 25,123<br />
¥ 25,123<br />
$ 213,867<br />
Capital surplus:<br />
Balance at begining of the year<br />
Add:<br />
Merger reserve<br />
Balance at end of the year<br />
¥ 48,370<br />
15<br />
¥ 48,385<br />
¥ 48,370<br />
—<br />
¥ 48,370<br />
¥ 48,370<br />
—<br />
¥ 48,370<br />
$ 411,765<br />
128<br />
$ 411,893<br />
Retained earnings:<br />
Balance at begining of the year<br />
Add:<br />
Net income<br />
Reversal of land revaluation reserve due to the<br />
adjustment to deferred tax assets<br />
Deduct:<br />
Cash dividends paid<br />
Bonuses to directors<br />
Decrease resulting from initial consolidation of a subsidiary<br />
Transfer to land revaluation reserve<br />
Balance at end of the year<br />
¥ 193,927<br />
15,389<br />
61<br />
(5,553)<br />
(27)<br />
—<br />
—<br />
¥ 203,797<br />
¥ 180,877<br />
16,612<br />
167<br />
(3,702)<br />
(27)<br />
—<br />
—<br />
¥ 193,927<br />
¥ 175,366<br />
14,051<br />
—<br />
(3,702)<br />
(61)<br />
(272)<br />
(4,505)<br />
¥ 180,877<br />
$ 1,650,864<br />
131,004<br />
520<br />
(47,272)<br />
(230)<br />
—<br />
—<br />
$ 1,734,886<br />
Land revaluation reserve (Note 7):<br />
Balance at begining of the year<br />
Transfer from retained earnings<br />
Decrease resulting from adjustments to deferred<br />
tax assets on land revaluation reserve<br />
Balance at end of the year<br />
¥ (2,359)<br />
—<br />
(5,209)<br />
¥ (7,568)<br />
¥ (2,192)<br />
—<br />
(167)<br />
¥ (2,359)<br />
¥ (6,700)<br />
4,508<br />
—<br />
¥ (2,192)<br />
$ (20,082)<br />
—<br />
(44,343)<br />
$ (64,425)<br />
Net unrealized holding gain on securities:<br />
Balance at begining of the year<br />
Net change during the year<br />
Balance at end of the year<br />
¥ 6,114<br />
3,785<br />
¥ 9,899<br />
¥ 4,631<br />
1,483<br />
¥ 6,114<br />
¥ 1,407<br />
3,224<br />
¥ 4,631<br />
$ 52,047<br />
32,221<br />
$ 84,268<br />
Translation adjustments:<br />
Balance at begining of the year<br />
Net change during the year<br />
Balance at end of the year<br />
¥ (3,282)<br />
3,524<br />
¥ 242<br />
¥ (2,623)<br />
(659)<br />
¥ (3,282)<br />
¥ (115)<br />
(2,508)<br />
¥ (2,623)<br />
$ (27,939)<br />
29,999<br />
$ 2,060<br />
Treasury stock, at cost:<br />
Balance at begining of the year<br />
Net change during the year<br />
Balance at end of the year<br />
Total shareholders’ equity<br />
¥ (9,754)<br />
¥ (6,925)<br />
¥ (16,679)<br />
¥ 263,199<br />
¥ (9,747)<br />
¥ (7)<br />
¥ (9,754)<br />
¥ 258,139<br />
¥ (9,743)<br />
¥ (4)<br />
¥ (9,747)<br />
¥ 244,439<br />
$ (83,034)<br />
$ (58,951)<br />
$ (141,985)<br />
$ 2,240,564<br />
See accompanying notes to consolidated financial statements.<br />
ANNUAL REPORT 2006<br />
33
Nissin Food Products Co., Ltd.<br />
Consolidated Statements of Cash Flows<br />
For the years ended March 31, 2006, 2005 and 2004<br />
Thousands of<br />
Millions of yen U.S. dollars (Note 1)<br />
2006 2005 2004 2006<br />
Cash flows from operating activities:<br />
Income before income taxes and minority interests<br />
Depreciation and amortization<br />
Loss on impairment of fixed assets<br />
(Decrease) increase in allowance for doubtful receivables<br />
(Decrease) increase in accrued retirement benefits to employees<br />
(Decrease) increase in accrued retirement benefits<br />
to directors and statutory auditors<br />
Interest and dividend income<br />
Interest expenses<br />
Foreign currency exchange (gain) loss<br />
Equity in earnings of affiliates<br />
Loss on disposal and sales of property, plant and equipment<br />
Gain on sales of marketable securities and<br />
investments in securities and others<br />
Loss on valuation of marketable securities and<br />
investments in securities and others<br />
Decrease (increase) in trade notes and accounts receivable<br />
Decrease (increase) in inventories<br />
Increase (decrease) in trade notes and accounts payable<br />
Increase (decrease) in accrued consumption tax<br />
Bonuses to directors<br />
Other, net<br />
Subtotal<br />
Interest and dividends received<br />
Interest paid<br />
Collection of receivables written-off<br />
Income taxes paid<br />
Net cash provided by operating activities<br />
¥ 29,812<br />
5,977<br />
5,632<br />
(93)<br />
(2,144)<br />
(3,718)<br />
(3,065)<br />
41<br />
(103)<br />
(485)<br />
280<br />
(3,079)<br />
3,791<br />
2,052<br />
322<br />
233<br />
156<br />
(27)<br />
(644)<br />
34,938<br />
2,740<br />
(41)<br />
—<br />
(11,001)<br />
26,636<br />
¥ 27,072<br />
6,675<br />
—<br />
122<br />
(644)<br />
3,877<br />
(2,538)<br />
44<br />
1<br />
(427)<br />
238<br />
(349)<br />
1,192<br />
560<br />
(502)<br />
(497)<br />
(424)<br />
(27)<br />
704<br />
35,077<br />
2,683<br />
(44)<br />
1<br />
(7,458)<br />
30,259<br />
¥ 24,705<br />
7,079<br />
—<br />
37<br />
4,455<br />
—<br />
(1,846)<br />
54<br />
157<br />
(318)<br />
608<br />
(1,087)<br />
48<br />
(2,982)<br />
(367)<br />
(995)<br />
478<br />
(61)<br />
2,114<br />
32,079<br />
2,092<br />
(54)<br />
—<br />
(11,904)<br />
22,213<br />
$ 253,784<br />
50,881<br />
47,944<br />
(792)<br />
(18,251)<br />
(31,650)<br />
(26,092)<br />
349<br />
(877)<br />
(4,129)<br />
2,384<br />
(26,211)<br />
32,272<br />
17,468<br />
2,741<br />
1,983<br />
1,328<br />
(230)<br />
(5,482)<br />
297,420<br />
23,325<br />
(349)<br />
—<br />
(93,649)<br />
226,747<br />
Cash flows from investing activities:<br />
Increase in time deposits<br />
Payment for purchases of marketable securities<br />
Proceeds from sales and redemption of marketable securities<br />
Payment for purchases of property, plant and equipment and others<br />
Proceeds from sales of property, plant and equipment and others<br />
Payment for purchases of investments in securities<br />
Proceeds from sales and redemption of investments in securities<br />
Payment for purchases of additional shares of<br />
consolidated subsidiaries and others<br />
Decrease in loans receivable<br />
Net cash used in investing activities<br />
(2,615)<br />
(31,064)<br />
12,453<br />
(3,125)<br />
50<br />
(45,834)<br />
50,033<br />
—<br />
34<br />
(20,068)<br />
(1,646)<br />
(1,000)<br />
3,790<br />
(3,062)<br />
1,502<br />
(38,006)<br />
8,308<br />
(265)<br />
31<br />
(30,348)<br />
(2,309)<br />
(6,001)<br />
16,804<br />
(7,364)<br />
4,190<br />
(57,345)<br />
31,547<br />
—<br />
25<br />
(20,453)<br />
(22,261)<br />
(264,442)<br />
106,010<br />
(26,603)<br />
426<br />
(390,176)<br />
425,922<br />
—<br />
289<br />
(170,835)<br />
Cash flows from financing activities:<br />
Proceeds from short-term borrowings<br />
Repayment of short-term borrowings<br />
Proceeds from issuance of long-term debt<br />
Repayment of long-term debt<br />
Repurchase of treasury stocks less sales<br />
Cash dividends paid<br />
Cash dividends paid to minority shareholders<br />
Net cash used in financing activities<br />
Effect of exchange rate changes on cash and cash equivalents<br />
Net decrease in cash and cash equivalents<br />
Cash and cash equivalents at beginning of the year<br />
Increase in cash and cash equivalents arising from<br />
initial consolidation of subsidiaries<br />
Increase in cash and cash equivalents resulting from merger<br />
of a consolidated subsidiary with an unconsolidated subsidiary<br />
Cash and cash equivalents at end of the year (Note 4)<br />
839<br />
(1,204)<br />
—<br />
(84)<br />
(6,925)<br />
(5,553)<br />
(13)<br />
(12,940)<br />
1,500<br />
(4,872)<br />
66,326<br />
110<br />
6<br />
¥ 61,570<br />
—<br />
(2,071)<br />
87<br />
—<br />
(9)<br />
(3,702)<br />
(14)<br />
(5,709)<br />
(16)<br />
(5,814)<br />
72,140<br />
—<br />
—<br />
¥ 66,326<br />
434<br />
(534)<br />
10<br />
—<br />
(7)<br />
(3,702)<br />
(14)<br />
(3,813)<br />
(1,375)<br />
(3,428)<br />
73,882<br />
1,686<br />
—<br />
¥ 72,140<br />
7,142<br />
(10,249)<br />
—<br />
(715)<br />
(58,951)<br />
(47,272)<br />
(111)<br />
(110,156)<br />
12,769<br />
(41,475)<br />
564,621<br />
937<br />
51<br />
$ 524,134<br />
See accompanying notes to consolidated financial statements.<br />
34 ANNUAL REPORT 2006
Nissin Food Products Co., Ltd.<br />
Notes to Consolidated Financial Statements<br />
1. Basis of Preparation<br />
The accompanying consolidated financial statements of Nissin Food<br />
Products Co., Ltd. (the “Company”) and consolidated subsidiaries (collectively,<br />
the “Group”) are prepared on the basis of accounting principles<br />
generally accepted in Japan, which are different in certain respects as to<br />
the application and disclosure requirements of International Financial<br />
Reporting Standards, and are compiled from the consolidated financial<br />
statements prepared by the Company as required by the Securities and<br />
Exchange Law of Japan.<br />
The translation of yen amounts into U.S. dollars is included solely for<br />
the convenience of readers outside Japan and has been made at<br />
¥117.47=U.S.$1.00, the exchange rate prevailing on March 31, 2006.<br />
This translation should not be construed as a representation that yen can<br />
be converted into U.S. dollars at the above or any other rate.<br />
2. Summary of Significant Accounting Policies<br />
(a) Principles of consolidation and accounting for investments in<br />
unconsolidated subsidiaries and affiliates<br />
The accompanying consolidated financial statements include the<br />
accounts of the Company and the significant companies which it controls<br />
directly or indirectly. Companies over which the Company exercises significant<br />
influence in terms of their operating and financial policies have<br />
been included in the consolidated financial statements on an equity basis.<br />
The assets and liabilities of the newly consolidated subsidiaries are stated<br />
at fair value as of their respective dates of acquisition.<br />
The balance sheet date of overseas subsidiaries is December 31.<br />
Any significant differences in intercompany accounts and transactions<br />
arising from intervening intercompany transactions during the period from<br />
January 1 through March 31 have been adjusted, if necessary.<br />
The differences between the cost and the underlying net equity in the<br />
net assets at the dates of acquisition of the consolidated subsidiaries and<br />
companies accounted for by the equity method have been amortized by<br />
the straight-line method over periods not exceeding 20 years. The minor<br />
differences have been charged to and credited to income as incurred.<br />
The number of consolidated subsidiaries and affiliates accounted for<br />
by the equity method, for the years ended March 31, 2006, 2005 and<br />
2004, are as follows:<br />
2006 2005 2004<br />
Consolidated subsidiaries 23 22 23<br />
Affiliate accounted for by the<br />
equity method 1 1 1<br />
(b) Cash and cash equivalents<br />
For the purposes of the consolidated statements of cash flows, cash and<br />
cash equivalents comprise cash on hand, deposits held at call with banks<br />
and all highly liquid investments with insignificant risk of changes in value<br />
and with maturities of three months or less.<br />
(c) Securities<br />
The accounting standard for financial instruments requires that securities<br />
be classified into three categories: trading, held-to-maturity or other securities.<br />
Trading securities are carried at fair value and held-to-maturity debt<br />
securities are carried at amortized cost. Marketable securities classified as<br />
other securities are carried at fair value with any changes in unrealized<br />
holding gain or loss, net of the applicable income taxes, included directly<br />
in shareholders’ equity. Cost of securities sold is determined by the moving<br />
average method. Non-marketable securities classified as other securities<br />
are carried at cost based on the moving average method.<br />
(d) Inventories<br />
Finished goods and merchandise are principally stated at cost by the periodic<br />
average method. Raw materials and supplies are principally stated at<br />
cost by the last purchase price method.<br />
(e) Hedging activities<br />
Receivables and payables hedged by forward foreign exchange contracts<br />
which meet certain conditions are translated at the corresponding foreign<br />
exchange contract rates.<br />
(f) Property, plant and equipment<br />
Depreciation is computed principally by the declining-balance method<br />
over the useful lives of respective assets in conformity with the<br />
Corporation Tax Law of Japan. Certain consolidated subsidiaries apply<br />
the straight-line method. The straight-line method is also applied for the<br />
head office building of the Company (Osaka) and the buildings and structures<br />
of the Central Research Institute. In addition, the straight-line<br />
method is applied for buildings (except for the attachments to the buildings)<br />
acquired on or after April 1, 1998.<br />
(g) Intangible assets<br />
Intangible assets are included in “other assets” in “investments and other<br />
assets” presented in the accompanying consolidated balance sheets and<br />
depreciated by the straight-line method. Purchased software is depreciated<br />
by the straight-line method over the five-year period, the estimated<br />
useful life in the Groups.<br />
(h) Accrued retirement benefits to employees<br />
Accrued retirement benefits to employees have been provided principally<br />
at an amount calculated based on the retirement benefit obligation and<br />
the fair value of the pension plan assets, as adjusted for net unrecognized<br />
actuarial gain or loss and unrecognized prior service cost. The estimated<br />
benefit is attributed to each period by the straight-line method over the<br />
estimated years of service of the eligible employees.<br />
Net unrecognized actuarial gain or loss is charged or credited to<br />
income in the year following the year in which the gain or loss was incurred.<br />
Effective April 1, 2005, the Company adopted “Partial Amendments<br />
ANNUAL REPORT 2006<br />
35
to the Accounting Standard for Retirement Benefits” (Financial Accounting<br />
Standard No.3 of March 16, 2005) and “Application Guidelines for Partial<br />
Amendment to Accounting Standard for Retirement Benefits” (Application<br />
Guidelines for Financial Accounting Standard No.7 of March 16, 2005).<br />
The effects of the adoption of these standards on operating income and<br />
income before income taxes and minority interests for the year ended<br />
March 31, 2006 were not material.<br />
(i) Accrued retirement benefits to directors and statutory auditors<br />
Subject to approval at a shareholders’ meeting, directors and statutory<br />
auditors of the Company were entitled to lump-sum payments under<br />
unfunded retirement benefit plans. The provision for retirement benefits for<br />
directors and statutory auditors has been made at an estimated amount<br />
based on the Company’s internal rules.<br />
(l) Business scale taxation<br />
In accordance with the law on amendment of local tax laws and so forth,<br />
effective April 1, 2004, business scale taxation went into effect. A<br />
domestic corporation with capital in excess of ¥100 million is subject to<br />
business scale taxation on the basis of the total amount of value added,<br />
the size of its capital and its taxable income. Based on the new accounting<br />
standard on the business scale taxation, the Company and certain<br />
domestic consolidated subsidiaries had accounted for business scale<br />
taxation with respect to the value added and capital as a component of<br />
selling, general and administrative expenses. Consequently, selling, general<br />
and administrative expenses for the year ended March 31, 2005<br />
increased by ¥387 million and operating income and income before<br />
income taxes and minority interests for the year ended March 31, 2005<br />
decreased by the same amount.<br />
(j) Allowance for doubtful receivables<br />
The allowance for doubtful receivables is calculated based on the historical<br />
experience with bad debt and an estimate of certain uncollectible<br />
amounts determined after an analysis of specific individual<br />
doubtful receivables.<br />
(k) Income taxes<br />
Deferred income taxes are provided for temporary differences between<br />
the balances of assets and liabilities reported for financial purposes and<br />
the corresponding balances for tax reporting purposes.<br />
(m) Leases<br />
Finance leases other than those which transfer the ownership of the<br />
leased property to the lessee are accounted for as operating leases.<br />
(n) Appropriation of retained earnings<br />
Under the Commercial Code of Japan, the appropriation of retained<br />
earnings with respect to a given financial period is made by resolution of<br />
the sharoholders at a general meeting held subsequent to the close of<br />
the financial period. The accounts for that period, therefore, do not<br />
reflect such appropriations.<br />
3. Change in Method of Accounting<br />
Effective the year ended March 31, 2006, the Group has adopted a new<br />
accounting standard for the impairment of fixed assets which requires<br />
that tangible and intangible fixed assets be carried at cost less depreciation,<br />
and be reviewed for impairment whenever events or changes in circumstances<br />
indicate that the carrying amount of an asset may not be<br />
recoverable. The Group is required to recognize an impairment loss in its<br />
statement of income if certain indicators of asset impairment exist and if<br />
the book value of an asset exceeds the undiscounted sum of its future<br />
cash flows. The standard states that impairment losses are to be measured<br />
as the excess of the book value over the higher of (1) the fair market<br />
value of the asset, net of disposition costs, and (2) the present value of<br />
future cash flows arising from ongoing utilization of the asset and from its<br />
disposal after use. The standard covers land, factories, buildings and<br />
other forms of property, plant and equipment as well as intangible assets.<br />
Fixed assets are to be grouped at the lowest level for which there are<br />
identifiable cash flows which are independent of the cash flows from other<br />
groups of assets.<br />
As a result of the adoption of this new accounting standard, a loss on<br />
impairment of fixed assets in the amount of ¥5,632 million (US$47,944<br />
thousand) was recognized and income before income taxes and minority<br />
interests decreased by the same amount for the year ended March 31,<br />
2006 from the corresponding amount which would have been recorded<br />
under the previous method.<br />
4. Cash and Cash Equivalents<br />
A reconciliation of cash and cash deposits in the consolidated balance sheets and cash and cash equivalents in the consolidated statements of cash<br />
flows at March 31, 2006 and 2005 is as follows:<br />
Thousands of<br />
Millions of yen<br />
U.S. dollars<br />
2006 2005 2006<br />
Cash and deposits ¥ 45,116 ¥ 60,957 $ 384,064<br />
Time deposits with maturities exceeding three months (2,645) (2,030) (22,516)<br />
Marketable securities redeemable within three months 19,099 7,399 162,586<br />
Cash and cash equivalents ¥ 61,570 ¥ 66,326 $ 524,134<br />
36 ANNUAL REPORT 2006
5. Securities<br />
(a) Information regarding marketable securities classified as other securities at March 31, 2006 and 2005 is summarized as follows:<br />
Millions of yen<br />
Thousands of U.S. dollars<br />
Acquisition Carrying Unrealized Acquisition Carrying Unrealized<br />
March 31, 2006 costs value gain (loss) costs value gain (loss)<br />
Securities whose carrying value exceeds their acquisition costs:<br />
I. Equity securities<br />
II. Bonds<br />
National government<br />
Corporate<br />
Other<br />
III. Other<br />
Subtotal<br />
¥ 26,550<br />
—<br />
7,602<br />
—<br />
113<br />
¥ 45,548<br />
—<br />
7,620<br />
—<br />
130<br />
¥ 34,265 ¥ 53,298<br />
Securities whose carrying value does not exceed their acquisition costs:<br />
I. Equity securities<br />
II. Bonds<br />
National government<br />
Corporate<br />
Other<br />
III. Other<br />
Subtotal<br />
Total<br />
¥<br />
¥<br />
¥<br />
9,396<br />
21,077<br />
58,002<br />
102<br />
880<br />
89,457<br />
123,722<br />
¥<br />
¥<br />
¥<br />
8,734<br />
21,051<br />
56,361<br />
96<br />
879<br />
87,121<br />
140,419<br />
¥ 18,998<br />
—<br />
18<br />
—<br />
17<br />
¥ 19,033<br />
¥ (662)<br />
(26)<br />
(1,641)<br />
(6)<br />
(1)<br />
¥ (2,336)<br />
¥ 16,697<br />
$ 226,015<br />
—<br />
64,714<br />
—<br />
962<br />
$ 291,691<br />
$ 79,986<br />
179,425<br />
493,760<br />
868<br />
7,492<br />
$ 761,531<br />
$ 1,053,222<br />
$ 387,742<br />
—<br />
64,868<br />
—<br />
1,106<br />
$ 453,716<br />
$ 74,351<br />
179,203<br />
479,791<br />
817<br />
7,483<br />
$ 741,645<br />
$ 1,195,361<br />
$ 161,727<br />
—<br />
154<br />
—<br />
144<br />
$ 162,025<br />
$ (5,635)<br />
(222)<br />
(13,969)<br />
(51)<br />
(9)<br />
$ (19,886)<br />
$ 142,139<br />
Millions of yen<br />
Acquisition Carrying Unrealized<br />
March 31, 2005 costs value gain (loss)<br />
Securities whose carrying value exceeds their acquisition costs:<br />
I. Equity securities<br />
II. Bonds<br />
National government<br />
Corporate<br />
Other<br />
III. Other<br />
Subtotal<br />
¥<br />
¥<br />
27,559<br />
300<br />
27,253<br />
5,759<br />
3,843<br />
64,714<br />
¥<br />
¥<br />
38,550<br />
301<br />
27,416<br />
5,859<br />
5,060<br />
77,186<br />
¥<br />
¥<br />
10,991<br />
1<br />
163<br />
100<br />
1,217<br />
12,472<br />
Securities whose carrying value does not exceed their acquisition costs:<br />
I. Equity securities<br />
II. Bonds<br />
National government<br />
Corporate<br />
Other<br />
III. Other<br />
Subtotal<br />
Total<br />
¥<br />
¥<br />
¥<br />
1,103<br />
—<br />
20,449<br />
22,471<br />
—<br />
44,023<br />
108,737<br />
¥<br />
¥<br />
¥<br />
1,028<br />
—<br />
20,067<br />
20,824<br />
—<br />
41,919<br />
119,105<br />
¥<br />
¥<br />
¥<br />
(75)<br />
—<br />
(382)<br />
(1,647)<br />
—<br />
(2,104)<br />
10,368<br />
ANNUAL REPORT 2006<br />
37
(b) Sales of investments in securities classified as other securities for the years ended March 31, 2006, 2005 and 2004 are summarized as follows:<br />
Thousands of<br />
Millions of yen<br />
U.S. dollars<br />
March 31, 2006 2005 2004 2006<br />
Proceeds from sales<br />
Aggregate gains<br />
Aggregate losses<br />
¥ 43,206<br />
3,267<br />
188<br />
¥ 8,179<br />
375<br />
25<br />
¥ 30,571<br />
980<br />
5<br />
$ 367,805<br />
27,811<br />
1,600<br />
(c) The carrying value of principal non-marketable other securities at March 31, 2006 and 2005 is summarized as follows:<br />
Thousands of<br />
Millions of yen<br />
U.S. dollars<br />
March 31, 2006 2005 2006<br />
Other securities<br />
Unlisted equity securities ¥ 3,486 ¥ 3,993 $ 29,676<br />
Beneficial interests in trade receivable trust 6,499 2,999 55,325<br />
Jointly operated designated money trust 7,000 2,000 59,590<br />
Commercial paper 6,241 2,400 53,128<br />
Preferred equity securities 11,000 11,000 93,641<br />
Other 510 555 4,342<br />
(d) The redemption schedule for securities with maturity dates classified as other securities as of March 31, 2006 is summarized as follows:<br />
I. Bonds<br />
National government<br />
Corporate<br />
Other<br />
II. Other<br />
Total<br />
I. Bonds<br />
National government<br />
Corporate<br />
Other<br />
II. Other<br />
Total<br />
Millions of yen<br />
Due within Due after one year Due after five years Due after<br />
one year through five years through ten years ten years<br />
¥ 19,966<br />
17,138<br />
—<br />
19,891<br />
¥ 56,995<br />
¥ 1,085<br />
25,259<br />
96<br />
1,340<br />
¥ 27,780<br />
¥ —<br />
14,115<br />
—<br />
—<br />
¥ 14,115<br />
¥ —<br />
6,388<br />
—<br />
—<br />
¥ 6,388<br />
Thousands of U.S. dollars<br />
Due within Due after one year Due after five years Due after<br />
one year through five years through ten years ten years<br />
$ 169,967<br />
145,893<br />
—<br />
169,328<br />
$ 485,188<br />
$ 9,237<br />
215,025<br />
817<br />
11,407<br />
$ 236,486<br />
$ —<br />
120,158<br />
—<br />
—<br />
$ 120,158<br />
$ —<br />
54,380<br />
—<br />
—<br />
$ 54,380<br />
6. Inventories<br />
Inventories as of March 31, 2006 and 2005 are summarized as follows:<br />
Thousands of<br />
Millions of yen<br />
U.S. dollars<br />
2006 2005 2006<br />
Finished goods and merchandise ¥ 7,500 ¥ 7,767 $ 63,846<br />
Raw materials and supplies 5,209 4,588 44,343<br />
Total ¥12,709 ¥12,355 $108,189<br />
38 ANNUAL REPORT 2006
7. Land Revaluation Reserve<br />
Based on the Land Revaluation Law and the Amended Land Revaluation<br />
Law, the Company revalued the land it holds for use in the course of<br />
ongoing operations. The resulting land revaluation difference represents an<br />
unrealized devaluation of land and is debited directly, as net of income<br />
taxes, under “Adjustment due to land revaluation” in shareholders’ equity.<br />
There is no effect on the statement of income. Land for own-use was<br />
revalued in accordance with the law on March 31, 2002. Deferred income<br />
taxes on land revaluation were shown in the accounts for the year ended<br />
March 2005. Analysis indicated that there was an opportunity to recover<br />
these deferred tax assets in the year ended March 2006, and the amount<br />
was not therefore liquidated and shown in the accounts as Adjustment<br />
due to land revaluation.<br />
The market value of the land, as of March 31, 2006 and 2005,<br />
declined by ¥6,522 million (US$55,521 thousand) and ¥6,227 million<br />
compared with the carrying value of the land revalued as of March 31,<br />
2002, respectively.<br />
8. Short-term Borrowings<br />
Short-term borrowings, which amounted to ¥2,854 million (US$24,295<br />
thousand) and ¥3,038 million as of March 31, 2006 and 2005, respectively,<br />
generally represent notes payable to banks.<br />
The average interest rates on these borrowings were 0.955% and<br />
0.864% at March 31, 2006 and 2005, respectively.<br />
9. Accrued Retirement Benefits to Employees<br />
The Company and domestic consolidated subsidiaries have defined benefit<br />
plans, i.e., welfare pension fund plans, tax qualified pension plans and<br />
lump-sum payment plans, covering substantially all employees who are<br />
entitled to lump-sum or annuity payments, the amounts of which are<br />
determined by reference to their basic rates of pay, length of service, and<br />
the conditions under which termination occurs. The Company transformed<br />
tax qualified pension plans to welfare pension fund plans in 1989.<br />
The following table sets forth the funded and accrued status of the<br />
plans and the amounts recognized in the consolidated balance sheets at<br />
March 31, 2006 and 2005 for the Company’s and the consolidated subsidiaries’<br />
defined benefit plans:<br />
(a) Retirement benefit obligation<br />
(b) Plan assets at fair value<br />
(c) Unfunded retirement benefits obligation (a+b)<br />
(d) Unrecognized actuarial gains<br />
(e) Accrued retirement benefits to employees, net (c+d)<br />
(f) Prepaid pension cost<br />
(g) Accrued retirement benefits for employees (e-f)<br />
Notes: 1. The above amounts include a substitutional portion of the employees’ pension fund.<br />
2. Domestic consolidated subsidiaries apply the simplified method to calculate pension benefits obligation.<br />
Thousands of<br />
Millions of yen<br />
U.S. dollars<br />
2006 2005 2006<br />
¥ (38,481) ¥ (36,665) $ (327,582)<br />
31,682 23,753 269,703<br />
(6,799) (12,912) (57,879)<br />
(4,637)<br />
(668) (39,474)<br />
(11,436) (13,580) (97,353)<br />
224<br />
—<br />
1,906<br />
(11,660) (13,580) (99,259)<br />
The components of retirement benefit costs for the years ended March 31, 2006, 2005 and 2004 were as follows:<br />
(a) Service cost (Notes 1 and 2)<br />
(b) Interest cost<br />
(c) Expected return on pension assets<br />
(d) Amortization of actuarial (gains) losses<br />
Total net periodic pension cost<br />
Millions of yen<br />
Thousands of<br />
U.S. dollars<br />
2006 2005 2004 2006<br />
¥ 1,201<br />
841<br />
(540)<br />
(668)<br />
834<br />
¥ 1,760<br />
801<br />
(454)<br />
584<br />
2,691<br />
¥ 1,259<br />
824<br />
(424)<br />
4,799<br />
6,458<br />
Notes: 1. Employees’ contributions to the welfare pension fund have been excluded.<br />
2. Retirement benefit costs of certain domestic consolidated subsidiaries, which have been calculated by a simplified method are included in service cost in the above table.<br />
$ 10,224<br />
7,159<br />
(4,597)<br />
(5,687)<br />
7,099<br />
The assumptions used in accounting for the above plans were a discount rate of 2.5% and an expected rate of return on plan assets of 2.5% for the<br />
years ended March 31, 2006, 2005 and 2004.<br />
ANNUAL REPORT 2006<br />
39
10. Income Taxes<br />
Income taxes applicable to the Company and its domestic subsidiaries 2004. Overseas subsidiaries are subject to the income taxes of the countries<br />
comprise corporate tax, inhabitants’ tax and enterprise tax which, in the<br />
in which they operate.<br />
aggregate, resulted in statutory tax rates of 40.33% for the years ended The effective tax rates for the years ended March 31, 2006 and 2005<br />
March 31, 2006 and 2005 and 40.27% for the year ended March 31, differ from the Company’s statutory tax rate for the following reasons:<br />
2006 2005<br />
Statutory tax rate 40.33% 40.33%<br />
Corporate tax credit (1.48) —<br />
Permanently non-deductible expenses such as entertainment expenses — 0.61<br />
Equity in earnings of an affiliate (0.66) (0.64)<br />
Loss on revaluation of investments in affiliates 6.28 (5.91)<br />
Loss on impairment of fixed assets 5.93 —<br />
Valuation allowance — 2.52<br />
Difference in consolidated subsidiaries’ applicable tax rate (1.76) —<br />
Other (0.11) 0.93<br />
Effective tax rates 48.53 37.84<br />
Reconciliation of the statutory tax rate to the effective tax rate for the year<br />
ended March 31, 2004 was not presented, since the difference was less<br />
than five percent of the statutory tax rate.<br />
The tax effects of temporary differences which gave rise to significant<br />
portions of the deferred tax assets at March 31, 2006 and 2005 are presented<br />
below:<br />
Deferred tax assets:<br />
Unrealized losses on securities<br />
Accrued retirement benefits to employees<br />
Accounts payable<br />
Loss on impairment of fixed assets<br />
Accrued retirement benefits to directors and statutory auditors<br />
Accrued bonuses<br />
Allowance for doubtful receivables<br />
Depreciation and amortization<br />
Tax loss carry forwards of consolidated subsidiaries<br />
Other<br />
Total gross deferred tax assets<br />
Less: Valuation allowance<br />
Deferred tax assets<br />
Millions of yen<br />
Thousands of<br />
U.S. dollars<br />
2006 2005 2006<br />
¥ 6,084<br />
4,701<br />
3,263<br />
1,208<br />
726<br />
1,134<br />
1,062<br />
627<br />
6,080<br />
1,318<br />
26,203<br />
(12,196)<br />
14,007<br />
¥ 4,604<br />
5,462<br />
3,119<br />
—<br />
2,225<br />
996<br />
1,038<br />
608<br />
7,463<br />
1,831<br />
27,346<br />
(9,581)<br />
17,765<br />
$ 51,792<br />
40,019<br />
27,777<br />
10,283<br />
6,180<br />
9,654<br />
9,040<br />
5,338<br />
51,758<br />
11,220<br />
223,061<br />
(103,822)<br />
119,239<br />
Deferred tax liabilities:<br />
Deferred capital gain on properties<br />
Unrealized holding gain on securities<br />
Other<br />
Deferred tax liabilities<br />
Net deferred tax assets<br />
¥<br />
(1,984)<br />
(6,746)<br />
(483)<br />
(9,213)<br />
4,794 ¥<br />
(1,985)<br />
(4,187)<br />
(1,307)<br />
(7,479)<br />
10,286 $<br />
(16,890)<br />
(57,427)<br />
(4,112)<br />
(78,429)<br />
40,810<br />
Note: Deferred income tax –non-current liabilities of ¥1,871 million (US$15,927 thousand) and ¥51 million were included in the other long-term liabilities presented in the consolidated balance sheets as<br />
of March 31, 2006 and 2005, respectively.<br />
Deferred income tax –current liabilities of ¥2 million was included in the other current liabilities presented in the consolidated balance sheet as of March 31, 2005.<br />
Effective April 1, 2003, the statutory tax rate for the calculation of deferred<br />
income taxes had changed from 40.27% to 40.33%. The effect of this<br />
change on the deferred income taxes and income taxes deferred was<br />
minor for the year ended March 31, 2004.<br />
40 ANNUAL REPORT 2006
11. Shareholders’ Equity<br />
The Commercial Code of Japan (the “Code”) provides that an amount<br />
equivalent to at least 10% of cash dividends paid and bonuses to directors<br />
and statutory auditors, and exactly 10% of interim cash dividends<br />
paid be appropriated to the legal reserve until the sum of additional paidin<br />
capital and the legal reserve equals 25% of stated capital. The Code<br />
also provides that additional paid-in capital and the legal reserve are not<br />
available for dividends, but may be used to reduce a capital deficit by resolution<br />
of the shareholders or may be capitalized by resolution of the<br />
Board of Directors. The Code also stipulates that, to the extent that the<br />
sum of the additional paid-in capital account and the legal reserve<br />
exceeds 25% of the common stock account, the amount of any such<br />
excess is available for appropriation by resolution of the shareholders.<br />
Additional paid-in capital and the legal reserve are included in capital surplus<br />
and retained earnings, respectively, in the accompanying consolidated<br />
balance sheets and statements of shareholders’ equity. The legal<br />
reserve of the Company was ¥6,280 million (US$53,460 thousand) at<br />
March 31, 2006, 2005 and 2004.<br />
The new Corporation Law of Japan (the “Law”), which superseded<br />
most of the provisions of the Code, went into effect on May 1, 2006. The<br />
Law stipulates requirements on distribution of earnings similar to those of<br />
the Code. Under the Law, however, such distributions can be made at<br />
any time by resolution of the shareholders, or by the Board of Directors if<br />
certain conditions are met.<br />
12. Research and Development Expenses<br />
Expenses relating to research and development activities are charged to<br />
income as incurred. Reserch and development expenses included in cost<br />
of sales and selling, general and administrative expenses totaled ¥2,727<br />
million (US$23,214 thousand), ¥2,697 million and ¥2,762 million for the<br />
year ended March 31, 2006, 2005 and 2004, respectively.<br />
13. Other Income (Expenses)<br />
(a) Loss on impairment of fixed assets<br />
The Group recognized loss on impairment of fixed assets for the year<br />
ended March 31, 2006 as follows:<br />
Location Usage Asset type<br />
Uji City, Kyoto<br />
Buildings, land<br />
Golf course<br />
Prefecture<br />
and other<br />
Natori City, Miyagi Prefecture,<br />
Idle land<br />
Land<br />
and six other locations<br />
The Group groups fixed assets by manufacturing unit or usage. The<br />
Group also groups idle fixed assets individually.<br />
Consequently, the Group has written down the operating fixed<br />
assets whose profitability declined and idle fixed assets whose fair value<br />
declined compared with their book values to their net recoverable value<br />
and the Group recorded loss on impairment of fixed assets of ¥5,632<br />
million ($47,944 thousand) in the consolidated statement of income for<br />
the year ended March 31, 2006. This impairment loss was consisted of<br />
losses on golf course and land not in use which had been included in<br />
land of ¥4,872 million (US$41,474 thousand) and ¥760 million<br />
(US$6,470 thousand), respectively. The impairment loss on golf course<br />
was consisted of loss on buildings and structures of land and others of<br />
¥1,346 million (US$11,458 thousand), ¥2,058 million (US$17,519 thousand)<br />
and ¥1,468 million (US$12,497 thousand), respectively.<br />
The recoverable value of the fixed assets presented in the above<br />
table has been measured primarily at net realizable value based on<br />
appraisals conducted by real estate appraisers for the significant assets<br />
and tax assessment value after reasonable adjustments for other assets.<br />
(b) Loss on revaluation of investments<br />
Loss on revaluation of investments recognized in the consolidated<br />
statement of income for the year ended March 31, 2006 represented<br />
the revaluation losses on investments in Nissin Hualong Foods Co., Ltd.<br />
and Hebei Nissin Hualong Paper Products Co., Ltd.<br />
(c) Provision for accrued retirement benefits to directors<br />
Provision for accrued retirement benefits for directors and statutory<br />
auditors represented the additional provision due to the revision of the<br />
internal rules for the retirement benefits for directors, which was made<br />
during the year ended March 31, 2005.<br />
ANNUAL REPORT 2006<br />
41
14. Leases<br />
The following pro-forma amounts represent the acquisition costs, accumulated<br />
depreciation and net book value of the property leased to the<br />
Group at March 31, 2006 and 2005, which would have been reflected in<br />
the consolidated balance sheets if finance leases accounted for as operating<br />
leases had been capitalized:<br />
Millions of yen<br />
Thousands of U.S. dollars<br />
Acquisition Accumulated Net book Acquisition Accumulated Net book<br />
2006 cost depreciation value cost depreciation value<br />
Machinery<br />
Equipment<br />
Total<br />
¥ 1,259<br />
448<br />
¥ 1,707<br />
¥ 662<br />
265<br />
¥ 927<br />
¥ 597<br />
183<br />
¥ 780<br />
$ 10,717<br />
3,814<br />
$ 14,531<br />
$ 5,635<br />
2,256<br />
$ 7,891<br />
$ 5,082<br />
1,558<br />
$ 6,640<br />
Millions of yen<br />
Acquisition Accumulated Net book<br />
2005 cost depreciation value<br />
Buildings and structures<br />
Machinery<br />
Equipment<br />
Total<br />
¥<br />
¥<br />
10<br />
1,292<br />
472<br />
1,774<br />
¥<br />
¥<br />
10<br />
606<br />
256<br />
872<br />
¥<br />
¥<br />
0<br />
686<br />
216<br />
902<br />
Future minimum payments subsequent to March 31, 2006 for finance leases accounted for as operating leases are summarized as follows:<br />
Thousands of<br />
Years ending March 31 Millions of yen U.S. dollars<br />
2007 ¥ 287 $ 2,443<br />
2008 and thereafter 493 4,197<br />
Total ¥ 780 $ 6,640<br />
Note: The acquisition costs and future minimum lease payments under finance leases presented in the above tables include the imputed interest expense.<br />
Lease payments relating to finance leases accounted for as operating<br />
leases in the accompanying consolidated financial statements amounted<br />
to ¥333 million (US$2,835 thousand), ¥346 million and ¥378 million,<br />
which were approximately equal to the depreciation of the leased<br />
assets computed by the straight-line method over the respective lease<br />
terms assuming residual value for the years ended March 31, 2006,<br />
2005 and 2004, respectively.<br />
15. Derivative Financial Instruments<br />
The Group utilizes forward foreign exchange contracts to avoid risks<br />
of adverse effect of fluctuation foreign currency exchange. The Group<br />
does not enter into derivatives contracts for speculative or short-term<br />
trading purposes.<br />
The Group has established policies which were approved by the<br />
management meeting of the Company. In accordance with these policies,<br />
the Financial Division controls and executes the forward foreign<br />
exchange contracts. The valuation for the effectiveness of the hedging<br />
has been omitted since the significant conditions of the hedging instruments<br />
and hedging items were same and the risk of changes in cash<br />
flows was completely avoided.<br />
The Group enters into the forward foreign exchange contracts with<br />
financial institutions with high credit ratings to avoid the risk of credit loss<br />
in the event of non-performance by the counterparties to the contracts.<br />
Disclosure of fair value information on derivatives has been omitted<br />
because all open positions qualified for hedge accounting at March 31,<br />
2006 and 2005.<br />
42 ANNUAL REPORT 2006
16. Amounts per Share<br />
Amounts per share at March 31, 2006, 2005 and 2004 and for the years then ended were as follows:<br />
Yen<br />
U.S. dollars<br />
2006 2005 2004 2006<br />
Net assets ¥2,167.81 2,091.16 1,980.14 $ 18.45<br />
Net income<br />
Basic 125.09 134.36 113.61 1.06<br />
Cash dividends applicable to the year 30.00 30.00 30.00 0.26<br />
The amount per share of net assets has been computed based on the<br />
net assets available for distribution to shareholders of common stock and<br />
the number of shares of common stock outstanding at the year end. Net<br />
income per share has been computed based on the net income available<br />
for distribution to shareholders of common stock and the weighted-average<br />
number of shares of common stock outstanding during the year.<br />
Diluted net income per share has not been presented because there were<br />
no potentially dilutive shares at March 31, 2006, 2005 and 2004.<br />
Cash dividends per share represent the cash dividends proposed by<br />
the Board of Directors as applicable to the respective years together with<br />
the interim cash dividends paid.<br />
17. Contingent Liability<br />
The company has concluded an agreement with a financial institution to<br />
guarantee the borrowing of an unconsolidated overseas subsidiary within a<br />
limit of US$1,600 thousand (¥188 million). The borrowing of this subsidiary<br />
amounted to US$1,300 thousand (¥153 million) as of March 31, 2006.<br />
18. Segment Information<br />
The Group classifies its business into two segments principally based<br />
on the product types and characteristics: the instant noodle and associated<br />
business and other business. The instant noodle and associated<br />
business includes pillow-type instant noodles, cup-type instant noodles,<br />
chilled foods and frozen foods. Other business includes confectionary<br />
and beverages.<br />
The following tables present the business and geographic segment<br />
information and the overseas sales of the Group for the years ended<br />
March 31, 2006, 2005 and 2004:<br />
(a) Information by business segment<br />
Millions of yen<br />
Instant noodle and Other<br />
Year ended March 31, 2006 associated business business Eliminations Consolidated<br />
I. Sales<br />
Sales to third parties<br />
Intersegment sales<br />
Total<br />
Operating expenses<br />
¥ 294,510<br />
7<br />
294,517<br />
264,428<br />
¥ 27,190<br />
5,586<br />
32,776<br />
30,886<br />
¥ —<br />
(5,593)<br />
(5,593)<br />
(5,593)<br />
¥ 321,700<br />
—<br />
321,700<br />
289,721<br />
Operating income<br />
¥ 30,089 ¥ 1,890 ¥ — ¥ 31,979<br />
II. Assets, depreciation and amortization, loss on impairment<br />
of fixed assets and capital investment<br />
Assets<br />
Depreciation and amortization<br />
Loss on impairment of fixed assets<br />
Capital investment<br />
¥ 350,864<br />
5,476<br />
760<br />
3,120<br />
¥ 17,137<br />
501<br />
4,872<br />
397<br />
¥ (1,200)<br />
—<br />
—<br />
—<br />
¥ 366,801<br />
5,977<br />
5,632<br />
3,517<br />
ANNUAL REPORT 2006<br />
43
Thousands of U.S. dollars<br />
Instant noodle and Other<br />
Year ended March 31, 2006 associated business business Eliminations Consolidated<br />
I. Sales<br />
Sales to third parties<br />
Intersegment sales<br />
Total<br />
Operating expenses<br />
Operating income<br />
II. Assets, depreciation and amortization, loss on impairment<br />
of fixed assets and capital investment<br />
Assets<br />
Depreciation and amortization<br />
Loss on impairment of fixed assets<br />
Capital investment<br />
$<br />
$<br />
$<br />
2,507,108<br />
60<br />
2,507,168<br />
2,251,026<br />
256,142<br />
2,986,839<br />
46,616<br />
6,470<br />
26,560<br />
$<br />
$<br />
$<br />
231,463<br />
47,552<br />
279,015<br />
262,926<br />
16,089<br />
145,884<br />
4,265<br />
41,474<br />
3,380<br />
$<br />
$<br />
$<br />
—<br />
(47,612)<br />
(47,612)<br />
(47,612)<br />
—<br />
(10,215)<br />
—<br />
—<br />
—<br />
$<br />
$<br />
$<br />
2,738,571<br />
—<br />
2,738,571<br />
2,466,340<br />
272,231<br />
3,122,508<br />
50,881<br />
47,944<br />
29,940<br />
As the percentage of the instant noodle and associated business exceeded<br />
90% of total assets, sales and operating income at March 31, 2005<br />
and 2004 and for the years then ended, the disclosure of business segment<br />
information for these years has been omitted.<br />
(b) Information by geographic area<br />
Millions of yen<br />
North<br />
Other<br />
Year ended March 31, 2006 Japan America Areas Eliminations Consolidated<br />
I. Sales<br />
Sales to third parties<br />
Intersegment sales<br />
Total<br />
Operating expenses<br />
Operating income (loss)<br />
II. Assets<br />
¥<br />
¥<br />
269,765<br />
1,172<br />
270,937<br />
240,279<br />
30,658<br />
344,531<br />
¥<br />
¥<br />
29,903<br />
—<br />
29,903<br />
30,367<br />
(464)<br />
16,188<br />
¥<br />
¥<br />
22,032<br />
394<br />
22,426<br />
20,548<br />
1,878<br />
28,794<br />
¥<br />
¥<br />
—<br />
(1,566)<br />
(1,566)<br />
(1,473)<br />
(93)<br />
(22,712)<br />
¥<br />
¥<br />
321,700<br />
—<br />
321,700<br />
289,721<br />
31,979<br />
366,801<br />
Thousands of U.S. dollars<br />
North<br />
Other<br />
Year ended March 31,2006 Japan America Areas Eliminations Consolidated<br />
I. Sales<br />
Sales to third parties<br />
Intersegment sales<br />
Total<br />
Operating expenses<br />
Operating income (loss)<br />
$ 2,296,459<br />
9,977<br />
2,306,436<br />
2,045,450<br />
260,986<br />
$ 254,558<br />
—<br />
254,558<br />
258,508<br />
(3,950)<br />
$ 187,554<br />
3,354<br />
190,908<br />
174,921<br />
15,987<br />
$ —<br />
(13,331)<br />
(13,331)<br />
(12,539)<br />
(792)<br />
$ 2,738,571<br />
—<br />
2,738,571<br />
2,466,340<br />
272,231<br />
II. Assets<br />
$ 2,932,928 $ 137,805 $ 245,118 $ (193,343) $ 3,122,508<br />
Millions of yen<br />
North<br />
Other<br />
Year ended March 31, 2005 Japan America Areas Eliminations Consolidated<br />
I. Sales<br />
Sales to third parties<br />
Intersegment sales<br />
Total<br />
Operating expenses<br />
Operating income (loss)<br />
II. Assets<br />
¥<br />
¥<br />
¥<br />
273,936<br />
1,109<br />
275,045<br />
246,629<br />
28,416<br />
342,079<br />
¥<br />
¥<br />
¥<br />
23,911<br />
—<br />
23,911<br />
24,890<br />
(979)<br />
15,356<br />
¥<br />
¥<br />
¥<br />
19,126<br />
173<br />
19,299<br />
18,500<br />
799<br />
25,754<br />
¥<br />
¥<br />
¥<br />
—<br />
(1,282)<br />
(1,282)<br />
(2,009)<br />
727<br />
(22,084)<br />
¥<br />
¥<br />
¥<br />
316,973<br />
—<br />
316,973<br />
288,010<br />
28,963<br />
361,105<br />
44 ANNUAL REPORT 2006
Millions of yen<br />
North<br />
Other<br />
Year ended March 31, 2004 Japan America Areas Eliminations Consolidated<br />
I. Sales<br />
Sales to third parties<br />
Intersegment sales<br />
Total<br />
Operating expenses<br />
¥ 276,398<br />
1,373<br />
277,771<br />
254,114<br />
¥ 23,943<br />
—<br />
23,943<br />
25,222<br />
¥ 19,692<br />
—<br />
19,692<br />
18,872<br />
¥ —<br />
(1,373)<br />
(1,373)<br />
(1,378)<br />
¥ 320,033<br />
—<br />
320,033<br />
296,830<br />
Operating income (loss)<br />
¥ 23,657 ¥ (1,279) ¥ 820 ¥ 5 23,203<br />
II. Assets<br />
¥ 320,187 ¥ 17,234 ¥ 22,213 ¥ (15,989) ¥ 343,645<br />
(c) Overseas sales<br />
Overseas sales, which include export sales of the Company and its<br />
domestic subsidiaries and sales (other than exports to Japan) of the overseas<br />
consolidated subsidiaries, for the years ended March 31, 2006,<br />
2005 and 2004 are summarized as follows:<br />
Millions of yen<br />
Thousands of U.S. dollars<br />
North Other North Other<br />
Year ended March 31, 2006 America Areas Total America Areas Total<br />
Overseas sales<br />
Consolidated sales<br />
Ratio of overseas sales to consolidated sales<br />
¥ 30,226<br />
—<br />
9.4%<br />
¥ 22,471<br />
—<br />
7.0%<br />
¥ 52,697<br />
321,700<br />
16.4%<br />
Millions of yen<br />
North<br />
Other<br />
Year ended March 31, 2005 America Areas Total<br />
Overseas sales<br />
Consolidated sales<br />
Ratio of overseas sales to consolidated sales<br />
¥ 24,177<br />
—<br />
7.6%<br />
¥ 19,553<br />
—<br />
6.2%<br />
¥ 43,730<br />
316,973<br />
13.8%<br />
Millions of yen<br />
North<br />
Other<br />
Year ended March 31, 2004 America Areas Total<br />
Overseas sales<br />
Consolidated sales<br />
Ratio of overseas sales to consolidated sales<br />
¥ 24,774<br />
—<br />
7.8%<br />
¥ 20,902<br />
—<br />
6.5%<br />
¥ 45,676<br />
320,033<br />
14.3%<br />
$ 257,308<br />
—<br />
—<br />
$ 191,292<br />
—<br />
—<br />
$ 448,600<br />
2,738,571<br />
—<br />
19. Subsequent Event<br />
The following appropriations of retained earnings of the Company were approved at the general meeting of shareholders held on June 29, 2006.<br />
Thousands of<br />
Millions of yen<br />
U.S. dollars<br />
Cash dividends (¥15=US$0.13 per share) ¥1,821 $15,502<br />
Bonuses to directors 20 170<br />
Total ¥1,841 $15,672<br />
ANNUAL REPORT 2006<br />
45
Report of Independent Auditors<br />
The Board of Directors<br />
Nissin Food Products Co., Ltd.<br />
We have audited the accompanying consolidated balance sheets of Nissin Food Products Co., Ltd. and consolidated<br />
subsidiaries as of March 31, 2006 and 2005, and the related consolidated statements of income, shareholders’<br />
equity, and cash flows for each of the three years in the period ended March 31, 2006, all expressed in yen. These<br />
financial statements are the responsibility of the Company’s management. Our responsibility is to express an opinion<br />
on these financial statements based on our audits.<br />
We conducted our audits in accordance with auditing standards generally accepted in Japan. Those standards<br />
require that we plan and perform the audit to obtain reasonable assurance about whether the financial statements<br />
are free of material misstatement. An audit includes examining, on a test basis, evidence supporting the amounts and<br />
disclosures in the financial statements. An audit also includes assessing the accounting principles used and significant<br />
estimates made by management, as well as evaluating the overall financial statement presentation. We believe<br />
that our audits provide a reasonable basis for our opinion.<br />
In our opinion, the financial statements referred to above present fairly, in all material respects, the consolidated<br />
financial position of Nissin Food Products Co., Ltd. and consolidated subsidiaries at March 31, 2006 and 2005, and<br />
the consolidated results of their operations and their cash flows for each of the three years in the period ended March<br />
31, 2006 in conformity with accounting principles generally accepted in Japan.<br />
Supplemental Information<br />
As described in Note 3, the Company and consolidated subsidiaries have adopted a new accounting standard for<br />
the impairment of fixed assets.<br />
The U.S. dollar amounts in the accompanying consolidated financial statements with respect to the year ended<br />
March 31, 2006 are presented solely for convenience. Our audit also included the translation of yen amounts into<br />
U.S. dollar amounts and, in our opinion, such translation has been made on the basis described in Note 1.<br />
June 29, 2006<br />
46 ANNUAL REPORT 2006
Business Areas of Consolidated Subsidiaries and Affiliate (As of March 31, 2006)<br />
Company Capital Business Area Equity Ownership<br />
Consolidated Subsidiaries<br />
Sapporo Nissin Co., Ltd. ¥250 million Cup- and pillow-type noodle manufacturing and marketing 100.0%<br />
Nissin F.D. Foods Co., Ltd. ¥100 million Freeze-dried food manufacturing and marketing 100.0 (1)<br />
Nissin Plastics Co., Ltd. ¥450 million Container manufacturing and marketing 100.0<br />
Nissin Frozen Foods Co., Ltd. ¥98 million Frozen food manufacturing and marketing 100.0<br />
Gran Foods Co., Ltd. ¥80 million Frozen food manufacturing and marketing 100.0<br />
(Wholly-owned subsidiary of Nissin Frozen Foods Co., Ltd.)<br />
Nissin York Co., Ltd. ¥870 million Beverage and dairy product manufacturing and marketing 72.8<br />
Nissin Enterprise Corporation ¥300 million Shipping and warehousing 100.0<br />
Nissin Cisco Co., Ltd. ¥2,600 million Confectionery manufacturing and marketing 63.8<br />
Uji Kaihatsu Development Co., Ltd. ¥850 million Golf course management 70.7 (2)<br />
Ajinihon Co., Ltd. ¥95 million Soup manufacturing and marketing 46.4<br />
Nissin Foods (U.S.A.) Co., Inc. US$83,500 thousand Cup- and pillow-type noodle manufacturing and marketing 90.0<br />
Camino Real Foods, Inc. US$4,700 thousand Frozen food manufacturing and marketing 100.0 (3)<br />
Nissin Foods Kft. HUF1,000,000 thousand Cup- and pillow-type noodle manufacturing and marketing 100.0<br />
Nissin Foods GmbH EUR 25 thousand Cup- and pillow-type noodle marketing 100.0 (4)<br />
Nissin Foods Co., Ltd. HK$575,140 thousand Cup- and pillow-type noodle manufacturing and marketing 100.0<br />
Miracle Foods Co., Ltd. HK$21,000 thousand Container manufacturing and marketing 70.0<br />
(70%-owned subsidiary of Nissin Foods Co., Ltd.)<br />
Guangdong Shunde Nissin Foods Co., Ltd. HK$130,000 thousand Cup- and pillow-type noodle manufacturing and marketing 100.0 (5)<br />
(Wholly-owned subsidiary of Nissin Foods Co., Ltd.)<br />
Winner Food Products Ltd. HK$29,975 thousand Cup- and pillow-type noodle and frozen food manufacturing 74.0<br />
and marketing<br />
Zhuhai Golden Coast Winner HK$84,000 thousand Cup- and pillow-type noodle manufacturing and marketing 70.5<br />
Food Products Ltd.<br />
(70.5%-owned subsidiary of Winner Food Products Ltd.)<br />
Guangyougnan Food Products HK$11,000 thousand Frozen food manufacturing and marketing<br />
(Shenzhen) Co., Ltd. (Wholly-owned subsidiary of Winner Food Products Ltd.) 100.0<br />
Shanghai Nissin Foods Co., Ltd. US$25,000 thousand Cup- and pillow-type noodle manufacturing and marketing 100.0<br />
(Wholly-owned subsidiary of Nissin Foods Co., Ltd.)<br />
Nissin Foods (China) Holding Co., Ltd. US$40,500 thousand Invests in businesses in the PRC 100.0<br />
(Wholly-owned subsidiary of Nissin Foods Co., Ltd.)<br />
Indo Nissin Foods Ltd. INR 697,500 thousand Cup- and pillow-type noodle manufacturing and marketing 74.8<br />
Affiliate Accounted for by the Equity Method<br />
Nissin-Ajinomoto Alimentos Ltda. BRL 12,688 thousand Cup- and pillow-type noodle manufacturing and marketing 50.0<br />
Notes: 1. Indirect equity ownership through Sapporo Nissin Co., Ltd. 20.0%.<br />
2. Indirect equity ownership through Nissin F.D. Foods Co., Ltd. 5.7%<br />
3. Camino Real Foods, Inc. was excluded from consolidation on June 7, 2006.<br />
4. Indirect equity ownership through Nissin Foods Kft. 99.0%<br />
5. Indirect equity ownership through Nissin Foods Co., Ltd. 50.0% and Nissin Foods (China) Holding Co., Ltd. 11.7%.<br />
ANNUAL REPORT 2006<br />
47
Worldwide Network<br />
[Americas]<br />
Nissin Foods (U.S.A.) Co., Inc.<br />
(Corporate Office & Gardena Plant)<br />
2001 West Rosecrans Avenue, Gardena, CA 90249 U.S.A.<br />
Telephone: 1-323-321-6453 Fax: 1-310-515-3751<br />
(Lancaster Plant)<br />
Masako Place 2901, Hempland Road, Lancaster, PA 17601 U.S.A.<br />
Telephone: 1-717-291-5901 Fax: 1-717-291-9737<br />
Nissin Foods de Mexico S.A. de C.V.<br />
(Corporate Office & Plant)<br />
Av. de las Partidas S/N<br />
Fracc. Industrial Cerrillo ll<br />
Lerma, Edo. de Mexico 52000 Mexico<br />
Telephone: 52-728-282-8950 Fax: 52-728-285-0703<br />
(Sales Office)<br />
Georgia 120 Despacho 3A.<br />
Col. Napoles Deleg. Benito Juarez<br />
Mexico D.F., C.P. 03810 Mexico<br />
Telephone: 52-55-5543-2364 Fax: 52-55-5543-8807<br />
Nissin-Ajinomoto Alimentos Ltda.<br />
(Head Office)<br />
Rua Alves Guimaraes, 1297<br />
Jardim America CEP 05410-926<br />
Sao Paulo, SP Capital Brazil<br />
Telephone: 55-11-3094-5900 Fax: 55-11-3094-5901<br />
(Ibiuna Plant)<br />
Rodovia Bunjiro Nakao, Km 57 - Bairro Votorantim,<br />
Caixa Postal No. 57, Ibiúna - SP - Brazil CEP 18 150-000<br />
Telephone: 55-15-3249-1100 Fax: 55-15-3249-1255<br />
[Asia]<br />
Nissin Foods (HK) Management Co., Ltd.<br />
9-13, Dai Cheong Street, Tai Po Industrial Estate,<br />
Tai Po, N.T. Hong Kong<br />
Telephone: 852-3406-6888 Fax: 852-2666-5173<br />
Nissin Foods Co., Ltd.<br />
(Head Office & Main Plant)<br />
21-23, Dai Shing Street, Tai Po Industrial Estate,<br />
Tai Po, N.T. Hong Kong<br />
Telephone: 852-2665-0032 Fax: 852-2664-4189<br />
(Wing On Plant)<br />
9-13, Dai Cheong Street, Tai Po Industrial Estate,<br />
Tai Po, N.T. Hong Kong<br />
Telephone: 852-2664-6818 Fax: 852-2664-2201<br />
(Singapore Branch)<br />
31 Jurong Port Road #02-11M,<br />
Jurong Logistics Hub, Singapore 619115<br />
Telephone: 65-6-2681309 Fax: 65-6-2682758<br />
Winner Food Products Ltd.<br />
(Winner Plant)<br />
11-13, Dai Shun Street, Tai Po Industrial Estate,<br />
Tai Po, N.T. Hong Kong<br />
Telephone: 852-2667-3766 Fax: 852-2666-5173<br />
(Wintai Plant)<br />
20, Dai Kwai Street, Tai Po Industrial Estate,<br />
Tai Po, N.T. Hong Kong<br />
Telephone: 852-2663-3992 Fax: 852-2664-7559<br />
Miracle Foods Co., Ltd.<br />
19, Dai Shing Street, Tai Po Industrial Estate, Tai Po, N.T. Hong Kong<br />
Telephone: 852-2666-0812 Fax: 852-2666-0600<br />
Nissin Foods (China) Holding Co., Ltd.<br />
10F, Dongying Bld. 2570 Xietu Road, Xuhui District,<br />
Shanghai, 200030 The People’s Republic of China<br />
Telephone: 86-21-6468-7176 Fax: 86-21-6468-3295<br />
Nissin Hualong Foods Co., Ltd.<br />
(Head Office)<br />
Hualong Food Market of Longyao, Hebei,<br />
055350 The People’s Republic of China<br />
Telephone: 86-319-6598866 Fax: 86-319-6591358<br />
(Beijing Office)<br />
17F, Blue Castle International Centre, Xi Dawang Road, Chaoyang<br />
District,<br />
Beijing, 10026 The People’s Republic of China<br />
Telephone: 86-10-8599-9898 Fax: 86-10-8599-9898<br />
Shanghai Nissin Foods Co., Ltd.<br />
(Head Office & Plant)<br />
No. 1, Xinqiao Zhen,<br />
Songjiang District, Shanghai, 201612 The People’s Republic of China<br />
Telephone: 86-21-5764-4070 Fax: 86-21-5764-4073<br />
48 ANNUAL REPORT 2006
(Shanghai Office)<br />
11F, Dongying Bldg., 2570 Xietu Road,<br />
Xuhui District, Shanghai, 200030 The People’s Republic of China<br />
Telephone: 86-21-6468-8476 Fax: 86-21-6468-3325<br />
Guangdong Shunde Nissin Foods Co., Ltd.<br />
(Head Office & Plant)<br />
13, Gang Qian Road, Beijiao Industrial Park, Beijiao County,<br />
Shunde District, Foshan City, Guangdong Province, 528311<br />
The People’s Republic of China<br />
Telephone: 86-757-2633-0482 Fax: 86-757-2665-2778<br />
(Guangzhou Office)<br />
7th Floor, Golden Lake Building, No. 2, Dong Hu Road, West,<br />
Guangzhou, 510100 The People’s Republic of China<br />
Telephone: 86-20-8384-4362 Fax: 86-20-8385-6181<br />
Nissin Foods (Huabei) Co., Ltd.<br />
Lang Fang Economic & Technical Development Zone, Hebei 065001,<br />
The People’s Republic of China<br />
Telephone: 86-316-608-8652/8651/8654/7545 Fax: 86-316-608-7505<br />
Shandong Winner Food Products Co., Ltd.<br />
No. 86, Haiqu Mid Road, Rizhao City,<br />
Shandong, 276800 The People’s Republic of China<br />
Telephone: 86-633-822-3504 Fax: 86-633-822-3504<br />
Zhuhai Golden Coast Winner Food Products Ltd.<br />
Golden Coast Food Industry City, Zhuhai,<br />
Guangdong, 519040 The People’s Republic of China<br />
Telephone: 86-756-776-4138 Fax: 86-756-776-4198<br />
Guangyougnan Food Products (Shenzhen) Co., Ltd.<br />
3rd Floor, No. 8, Road 5, Qingshuihe,<br />
Shenzhen, Guangdong Province, The People’s Republic of China<br />
Telephone: 86-755-244-5649 Fax: 86-755-244-5649<br />
Nissin-Universal Robina Corporation<br />
(Head Office)<br />
2nd Floor, CFC Administration Building,<br />
E. Rodriguez Jr. Ave., Bagong Ilog, Pasig City, 1600 Philippines<br />
Telephone: 63-2-671-7176 Fax: 63-2-671-3978<br />
(Cavite Plant)<br />
Block 7, Lot 8, First Cavite Industrial Estate,<br />
Bo. Langkaan, Dasmariñas Cavite, 4140 Philippines<br />
Telephone: 63-46-402-0662/1241 Fax: 63-46-402-0824<br />
(Delhi Plant)<br />
91 Kms, Delhi-Jaipur Road, Village Deodhai, Tehsil Bawal,<br />
District Rewari-123401 Haryana, India<br />
Telephone: 91-1284-264032 Fax: 91-1284-264032<br />
Accelerated Freeze Drying Co., Ltd.<br />
(Head Office)<br />
Amalgam House, Bristow Road,<br />
Willingdon Island, Cochin-682 003, Kerala, India<br />
Telephone: 91-484-2668680 Fax: 91-484-2668130<br />
(Cochin Plant)<br />
EP/IV/513, Ezhupunna P.O. Alleppey District-688 548, Kerala, India<br />
Telephone: 91-478-2872012 Fax: 91-478-2873016<br />
(Bangalore Plant)<br />
Plot No. 18-A1, Jigani Industrial Area, Anekal Taluk,<br />
Bangalore-562 106 Karnataka, India<br />
Telephone: 91-8078-25282 Fax: 91-8078-25283<br />
PT. NISSINMAS<br />
Jl. Jababeka Raya Blok N/1, Cikarang Bekasi, 17530 Indonesia<br />
Telephone: 62-21-893-4130 Fax: 62-21-893-4129<br />
Nissin Foods (Thailand) Co., Ltd.<br />
(Head Office & Plant)<br />
631 Moo 11, Sukapiban 8, Sriracha Chonburi 20280, Thailand<br />
Telephone: 66-38-481-351 Fax: 66-38-481-353<br />
(Bangkok Office)<br />
802 Bangkok Tower, 2170 New Petchburi Road,<br />
Bangkok 10320, Thailand<br />
Telephone: 66-2-308-0360 Fax: 66-2-308-0363<br />
[Europe]<br />
Nissin Foods Kft.<br />
H-6000 Kecskemet, Buzakalasz ut20., Hungary<br />
Telephone:36-76-485-702 Fax:36-76-485-704<br />
Nissin Foods GmbH<br />
Am Hohenstein 3-5<br />
65779 Kelkheim, Germany<br />
Telephone: 49-6195-6927 Fax: 49-6195-910019<br />
Indo Nissin Foods Ltd.<br />
(Head Office)<br />
3rd Floor, Centenary Building, 28, M.G. Road, Bangalore 560 001, India<br />
Telephone: 91-80-2532-7900 Fax: 91-80-2559-9087<br />
ANNUAL REPORT 2006<br />
49
Corporate Data<br />
Nissin Food Products Co., Ltd.<br />
Head Office<br />
1-1, 4-chome, Nishinakajima, Yodogawa-ku<br />
Osaka 532-8524, Japan<br />
Telephone: 81-6-6305-7711<br />
Fax: 81-6-6304-1288<br />
Web Site: http://www.nissinfoods.co.jp<br />
Tokyo Head Office<br />
28-1, 6-chome, Shinjuku, Shinjuku-ku<br />
Tokyo 160-8524, Japan<br />
Telephone: 81-3-3205-5111<br />
Fax: 81-3-3205-5059<br />
Branches<br />
Hokkaido (Sapporo), Tohoku (Sendai),<br />
Chubu (Nagoya), Chugoku (Hiroshima),<br />
Shikoku (Takamatsu), Kyushu (Fukuoka)<br />
Local Offices<br />
Aomori, Morioka, Akita, Koriyama, Kita-kanto, Chiba,<br />
Yokohama, Niigata, Nagano, Kanazawa, Shizuoka, Tsu,<br />
Kyoto, Osaka-minami, Kobe, Yonago, Okayama, Yamaguchi,<br />
Matsuyama, Kochi, Kita-kyushu, Kumamoto, Kagoshima,<br />
Okinawa, Obihiro<br />
Plants<br />
Kanto, Shizuoka, Shiga, Shimonoseki<br />
Research Institutes<br />
Central Research Institute, Food Safety Research Institute<br />
(As of March 31, 2006)<br />
History<br />
1948 Chukososha Co., Ltd., established.<br />
1958 Chicken Ramen, the world’s first instant ramen product, introduced;<br />
Company name changed to Nissin Food Products Co., Ltd.<br />
1963 Listed on the Second Section of the Tokyo and Osaka Stock<br />
Exchanges.<br />
1970 Nissin Foods (U.S.A.) Co., Inc., the Company’s first overseas operation,<br />
established in Gardena, California.<br />
1971 Cup Noodle introduced; Kanto Plant began operation.<br />
1972 Listed on the First Section of the Tokyo, Osaka and Nagoya Stock<br />
Exchanges.<br />
1973 Shiga Plant and General Research Center began operation.<br />
1975 Shimonoseki Plant began operation;<br />
Nissin-Ajinomoto Alimentos Ltda. established in São Paulo, Brazil.<br />
1977 Construction of new headquarters completed;<br />
main office moved to its present location in Yodogawa-ku, Osaka.<br />
1978 Lancaster, Pennsylvania Plant of Nissin Foods (U.S.A.) Co., Inc.,<br />
began operation.<br />
1984 Nissin Foods Co., Ltd., established in Hong Kong.<br />
1988 Construction of Tokyo Head Office building completed;<br />
Central Research Institute began operation.<br />
1989 Acquired Hong Kong company Winner Food Products Ltd.<br />
1990 Capital participation in Yoke Co., Ltd. (now Nissin York Co., Ltd.).<br />
1991 Capital participation in Pegui Foods Co., Ltd. (now Nissin Frozen<br />
Foods Co., Ltd.) and Cisco Co., Ltd. (now Nissin Cisco Co., Ltd.).<br />
1992 Long-life fresh noodles developed; Nissin Rao introduced;<br />
P.T. NISSINMAS established in Indonesia.<br />
1994 Zhuhai Golden Coast Winner Food Products Ltd., the Company’s<br />
first production base in China, began operation in Guangdong.<br />
1995 Nissin Spa-O introduced; sales of Cup Noodle surpassed 10<br />
billion units.<br />
1996 Shizuoka Plant began operation; Shanghai Nissin Noodles Foods<br />
Co., Ltd. (now Shanghai Nissin Foods Co., Ltd.) began operation.<br />
1997 International Ramen Manufacturers Association established in<br />
Tokyo, and Momofuku Ando elected chairman.<br />
1998 Nissin Cofco Foods Co., Ltd., began operation in Beijing.<br />
1999 Delhi Plant of Indo Nissin Foods Ltd. began operation;<br />
The Momofuku Ando Instant Ramen Museum in Ikeda City, Osaka<br />
Prefecture, the world’s first instant ramen museum, opened.<br />
2001 Consolidated net sales exceeded ¥300 billion for the first time;<br />
contracted as official supplier to the 2002 FIFA World Cup TM ;<br />
Nissin Foods (China) Holding Co., Ltd., established in Shanghai.<br />
2002 Food Safety Research Institute established;<br />
Nissin GooTa series introduced.<br />
2003 Aggregate sales of Cup Noodle brand since launch in 1971 top 20<br />
billion servings.<br />
2004 Capital alliance with Hebei Hualong F&N Industry Group Co., Ltd.,<br />
gives Nissin Food Group the No. 1 global share.<br />
2005 Nissin Foods marked a world first with its Space Ram, developed<br />
for the space shuttle Discovery.<br />
2006 Aggregate sales of Cup Noodle brand 25 billion servings in the<br />
world.<br />
50 ANNUAL REPORT 2006
Investor Information (Parent company)<br />
As of March 31, 2006 (US$1=¥117.47)<br />
Date of Establishment<br />
September 1948<br />
Number of Employees<br />
6,216 (consolidated basis)<br />
1,411 (parent company)<br />
Common Stock<br />
Authorized: 500,000,000 shares<br />
Issued: 127,463,685 shares<br />
Number of Shareholders: 16,397<br />
(Excluding owners of odd-lot shares)<br />
Paid-in Capital<br />
¥25,123 million ($214 million)<br />
Stock Listings<br />
Tokyo and Osaka stock exchanges<br />
Ticker Code<br />
2897<br />
Independent Auditors<br />
Shin Nihon & Co.<br />
Transfer Agent<br />
Mizuho Trust & Banking Co., Ltd.<br />
2-1, Yaesu 1-chome, Chuo-ku, Tokyo, Japan<br />
Distribution of Ownership among Shareholders*<br />
Principal Shareholders<br />
● Financial Institutions 30.98%<br />
● Other Corporations 31.78%<br />
● Foreign Corporations 23.57%<br />
● Individuals and Other 13.40%<br />
● Securities Companies 0.27%<br />
*Excluding owners of odd-lot shares<br />
Number of Percentage of<br />
Shares Held Total Shares<br />
Name (Thousands) Outstanding<br />
Ando Foundation 7,747 6.08%<br />
Steel Partners Japan Strategic Fund (Offshore), LP 7,400 5.81<br />
Mitsubishi Corp. 6,400 5.02<br />
Ando International Y.K. 4,100 3.22<br />
Morgan Stanley and Company Inc. 4,006 3.14<br />
Mizuho Corporate Bank, Ltd. 4,000 3.14<br />
Japan Trustee Services Bank, Ltd. (trust account) 3,924 3.08<br />
The Bank of Tokyo-Mitsubishi UFJ, Ltd. 3,650 2.86<br />
Japan Trustee Services Bank, Ltd. (Portion of ITOCHU<br />
Corporation Retirement Benefits Trust Account placed<br />
in trust by The Sumitomo Trust & Banking Co., Ltd.) 3,630 2.85<br />
ITOCHU Corporation 2,770 2.17<br />
Note: In addtion to the above, the Company holds 6,034,938 shares of treasury stock.<br />
Per Share Data (Years ended March 31)<br />
2002 2003 2004 2005 2006<br />
EPS (Earnings Per Share) (Yen) ¥ 79.05 ¥ 99.67 ¥ 101.61 ¥ 114.38 ¥ 130.23<br />
BPS (Book-value Per Share) (Yen) ¥1,716.82 ¥1,770.26 ¥1,867.97 ¥1,964.30 ¥ 2012.48<br />
PER (Price Earnings Ratio)* (Times) 30.4 24.7 26.1 24.5 28.0<br />
PBR (Price Book-value Ratio)* (Times) 1.4 1.4 1.4 1.4 1.8<br />
Dividend (Yen) 30.00 30.00 30.00 30.00 30.00<br />
Payout Ratio (%) 37.5 30.1 29.5 26.2 23.0<br />
Notes: 1. From the fiscal year ended March 31, 2003, number of issued shares excludes the numbers of treasury stocks at term-end.<br />
2. PER and PBR are calculated based on the stock price at year-end.<br />
Further Information<br />
For further information, please contact:<br />
Corporate Communications Division (Tokyo Head Office)<br />
Tel.: 81-3-3205-5252 Fax: 81-3-3205-5259<br />
Regularly updated IR information in English is also available<br />
on Nissin Foods’ web site at http://www.nissinfoods.co.jp<br />
Share Price Range and Trading Volume on Tokyo Stock Exchange<br />
5,000 (Yen)<br />
(Shares)<br />
4,000<br />
Share Price (Left)<br />
Trading Volume (Right)<br />
15,000,000<br />
12,000,000<br />
9,000,000<br />
3,000<br />
6,000,000<br />
3,000,000<br />
2,000<br />
4<br />
2005<br />
5 6 7 8 9 10 11 12 1<br />
2006<br />
2 3 4 5 6<br />
0<br />
ANNUAL REPORT 2006<br />
51
28-1, 6-chome, Shinjuku, Shinjuku-ku, Tokyo 160-8524, Japan<br />
Telephone : 81-3-3205-5111<br />
Fax : 81-3-3205-5059<br />
http://www.nissinfoods.co.jp<br />
<strong>NO</strong> <strong>BORDER</strong><br />
COVER PHOTO: THERE ARE <strong>NO</strong> <strong>BORDER</strong>S IN SPACE. AND FROM<br />
SPACE, <strong>NO</strong> <strong>BORDER</strong>S ARE VISIBLE ON THE JEWEL-LIKE EARTH THAT IS<br />
OUR NATURAL ENDOWMENT. THIS IS THE ULTIMATE “<strong>NO</strong> <strong>BORDER</strong>”<br />
MESSAGE FOR HUMANITY.<br />
This Report is Printed on recycled paper with soy-based ink for waterless printing.<br />
Printed in Japan