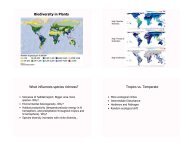
Biodiversity Data Analysis: Testing Statistical Hypotheses
Biodiversity Data Analysis: Testing Statistical Hypotheses
Biodiversity Data Analysis: Testing Statistical Hypotheses

You also want an ePaper? Increase the reach of your titles
YUMPU automatically turns print PDFs into web optimized ePapers that Google loves.
A. Determining the significance level of a parametric statistic<br />
If were to perform an independent sample t- test on the Fat-B-Gon data listed previously,<br />
we might obtain values equal to those listed in Table 2, with a t-statistic equal to 4.05. The<br />
next step is to interpret what this statistic tells us about the difference in mean weight loss<br />
between the treatment and control groups. Is the difference significant, suggesting that Fat-B-<br />
Gon tm is that mysterious factor "other than chance?" Or is the melting of unsightly cellulite at<br />
the pop of a pill just another poor biologist's fantasy of early retirement? The answer lies in the<br />
table of critical values for the t-statistic, part of which is illustrated in Table 3.<br />
Table 2. Treatment and control group statistics and overall statistics for weight<br />
loss in the Fat-B-Gon experiment.<br />
statistic control treatment<br />
mean (x) 4.74 7.34<br />
sum of squares (SS) 27.9 29.9<br />
variance (s2) 2.79 2.99<br />
standard deviation (s) 1.66 1.82<br />
overall statistics<br />
s 2 p<br />
3.21<br />
sxt - s xc<br />
0.642<br />
t 4.05<br />
degrees of freedom (df) 19<br />
P value (significance)<br />
P ><br />
The Fat-B-Gon tm t statistic (4.05) is larger than the greatest value for (df = 19) on the table<br />
of critical values. Thus, the probability that the weight difference in treatment and control<br />
groups is due to chance is less than 0.001 for our two-tailed hypothesis. This is highly<br />
significant. It means that the likelihood that the weight loss difference between the treatment<br />
and control is due to Fat-B-Gon (and not just random chance) is greater than 99%. We thus<br />
can reject our original two-tailed hypothesis and accept the alternative hypothesis:<br />
"There is a difference in the rate of weight loss between members of the<br />
population who use Fat-B-Gon tm and those who do not use Fat-B-Gon tm ."<br />
Notice that the t-value calculated for the Fat-B-Gon tm data indicates rejection of even onetailed<br />
hypothesis. However, because all honest researchers state their hypotheses before<br />
<strong>Biodiversity</strong> – <strong>Data</strong> <strong>Analysis</strong> 6