Orange River Integrated Water Resources Management Plan Report
Orange River Integrated Water Resources Management Plan Report
Orange River Integrated Water Resources Management Plan Report

Create successful ePaper yourself
Turn your PDF publications into a flip-book with our unique Google optimized e-Paper software.
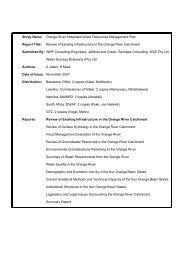
Study Name:<br />
<strong>Report</strong> Title:<br />
<strong>Orange</strong> <strong>River</strong> <strong>Integrated</strong> <strong>Water</strong> <strong>Resources</strong> <strong>Management</strong> <strong>Plan</strong><br />
Environmental Considerations Pertaining to the <strong>Orange</strong> <strong>River</strong><br />
Submitted By: WRP Consulting Engineers, Jeffares and Green, Sechaba Consulting, WCE Pty Ltd,<br />
<strong>Water</strong> Surveys Botswana (Pty) Ltd<br />
Authors:<br />
R Heath, C Brown<br />
Date of Issue: August 2007<br />
Distribution:<br />
Botswana: DWA: 2 copies (Katai, Setloboko)<br />
Lesotho: Commissioner of <strong>Water</strong>: 2 copies (Ramosoeu, Nthathakane)<br />
Namibia: MAWRD: 2 copies (Amakali)<br />
South Africa: DWAF: 2 copies (Pyke, van Niekerk)<br />
GTZ: 2 copies (Vogel, Mpho)<br />
<strong>Report</strong>s:<br />
Review of Existing Infrastructure in the <strong>Orange</strong> <strong>River</strong> Catchment<br />
Review of Surface Hydrology in the <strong>Orange</strong> <strong>River</strong> Catchment<br />
Flood <strong>Management</strong> Evaluation of the <strong>Orange</strong> <strong>River</strong><br />
Review of Groundwater <strong>Resources</strong> in the <strong>Orange</strong> <strong>River</strong> Catchment<br />
Environmental Considerations Pertaining to the <strong>Orange</strong> <strong>River</strong><br />
Summary of <strong>Water</strong> Requirements from the <strong>Orange</strong> <strong>River</strong><br />
<strong>Water</strong> Quality in the <strong>Orange</strong> <strong>River</strong><br />
Demographic and Economic Activity in the four <strong>Orange</strong> Basin States<br />
Current Analytical Methods and Technical Capacity of the four <strong>Orange</strong> Basin States<br />
Institutional Structures in the four <strong>Orange</strong> Basin States<br />
Legislation and Legal Issues Surrounding the <strong>Orange</strong> <strong>River</strong> Catchment<br />
Summary <strong>Report</strong>
TABLE OF CONTENTS<br />
1 INTRODUCTION ................................................................................................................ 7<br />
1.1 Future demands on the <strong>Orange</strong> <strong>River</strong> ..................................................................... 9<br />
2 ENVIRONMENTAL ISSUES IN LESOTHO ..................................................................... 14<br />
2.1 Conservation Areas ............................................................................................... 14<br />
2.2 Cultural and Historical Heritage ............................................................................. 17<br />
2.3 Biodiversity in Lesotho ........................................................................................... 25<br />
2.4 Impacts of Dams on Lesotho ................................................................................. 36<br />
3 ENVIRONMENTAL ISSUES IN SOUTH AFRICA ........................................................... 46<br />
3.1 Introduction ............................................................................................................ 46<br />
3.2 Flow Changes in <strong>Orange</strong> <strong>River</strong> ............................................................................. 48<br />
3.3 <strong>Water</strong> Quality Changes ......................................................................................... 54<br />
3.4 Trajectory of Change in <strong>Orange</strong> <strong>River</strong> .................................................................. 57<br />
3.5 Habitat Integrity of Upper <strong>Orange</strong> <strong>River</strong> ................................................................ 58<br />
3.6 Ecological Consequences of Flow Changes ......................................................... 60<br />
3.7 Macroinvertebrates in Lower <strong>Orange</strong> <strong>River</strong> .......................................................... 63<br />
3.8 Conservation Areas in <strong>Orange</strong> <strong>River</strong> .................................................................... 64<br />
3.9 National Heritage Sites .......................................................................................... 68<br />
4 ENVIRONMENTAL ISSUES IN BOTSWANA ................................................................. 69<br />
4.1 Environmental Overview of the Molopo <strong>River</strong> Basin ............................................. 69<br />
4.2 Environmental Protection and Conservation ......................................................... 87<br />
4.3 Conservation Areas ............................................................................................... 91<br />
4.4 Archeological and Cultural Heritage <strong>Resources</strong> ................................................... 95<br />
4.5 Ecological Sensitivity ............................................................................................. 97<br />
4.6 Environmental Impacts from Previous Developments in the Molopo <strong>River</strong> Basin<br />
and other Concerns ............................................................................................... 98<br />
5 ENVIRONMENTAL ISSUES IN NAMIBIA ..................................................................... 102<br />
5.1 Background .......................................................................................................... 102<br />
5.2 Conservation Areas ............................................................................................. 106<br />
5.3 Environmental Challenges .................................................................................. 107
5.4 A Focus on the <strong>Orange</strong> <strong>River</strong> .............................................................................. 119<br />
5.5 The Ecological Importance and Sensitivity of the Lower <strong>Orange</strong> <strong>River</strong><br />
Downstream of 20º Longitude to the <strong>Orange</strong>-Fish Confluence .......................... 120<br />
5.6 <strong>Orange</strong> <strong>River</strong> Mouth Development <strong>Plan</strong> ............................................................. 121<br />
5.7 Heritage Sensitivity .............................................................................................. 122<br />
5.8 Sendelingsdrif Proposed Irrigation Scheme ........................................................ 122<br />
5.9 Land Capability and Alternative Options ............................................................. 123<br />
5.10 Conclusion ........................................................................................................... 129<br />
6 COMMON ENVIRONMENTAL ISSUES ........................................................................ 130<br />
7 ENVIRONMENTAL FLOWS ........................................................................................... 133<br />
7.1 Background to Environmental Flows ................................................................... 133<br />
7.2 Lesotho and Environmental Flows ...................................................................... 136<br />
7.3 South Africa and Environmental Flows. .............................................................. 138<br />
7.4 Botswana ............................................................................................................. 149<br />
7.5 Namibia ................................................................................................................ 150<br />
7.6 Possible international implications related to environmental flows ..................... 150<br />
8 DATA AVAILABLE AND GAPS ...................................................................................... 152<br />
9 RECOMMENDATIONS AND CONCLUSIONS ............................................................. 156<br />
10 REFERENCES ............................................................................................................... 158<br />
11 APPENDIX A .................................................................................................................. 188<br />
LIST OF FIGURES AND TABLES<br />
Figure 1-1: <strong>Orange</strong> <strong>River</strong> ............................................................................................................ 7<br />
Figure 1-2: Approximate <strong>Water</strong> Balance for Natural Runoff in the <strong>Orange</strong> <strong>River</strong> Basin<br />
(ORASECOM Inception report 2004) ................................................................................. 8<br />
Figure 1-3: Major <strong>Water</strong> Demands along the Lower <strong>Orange</strong> <strong>River</strong>. ........................................ 11<br />
Figure 1-4: Major <strong>Water</strong> Transfer Schemes from Gariep and Vanderkloof dams. ................. 12<br />
Figure 1-5: Phase 1 of the Lesotho Highlands <strong>Water</strong> Project. ................................................ 13<br />
Figure 2-1: Locality of Lesotho National Parks, Nature reserves and Transfrontier National<br />
park. ................................................................................................................................... 15
Table 2-1: Legal Instruments and Special Events as Driving Forces for environmental<br />
change. .............................................................................................................................. 18<br />
Table 2-2: Biological Diversity in Lesotho ................................................................................ 27<br />
Table 2-3: Numbers of known Lesotho <strong>Plan</strong>t taxa ................................................................... 27<br />
Table 2-4: Mammals which are found in Lesotho’s checklist .................................................. 30<br />
Table 2-5: Red Data Book Checklist of bird species occurring in Lesotho ............................ 32<br />
Table 2-6: Checklist of Lesotho’s reptiles ................................................................................ 33<br />
Table 2-7: Checklist of Lesotho amphibians ............................................................................ 34<br />
Table 2-8: Checklist of Lesotho fish. ........................................................................................ 36<br />
Table 3-1: Details of main reservoirs and weirs on the <strong>Orange</strong> <strong>River</strong> ..................................... 48<br />
Figure 3-1: Box and whisker plots of the average monthly flows for weir D1H003 for the<br />
period 1959 to 1998 .......................................................................................................... 51<br />
Figure 3-2: Box and whisker plots of the average monthly flows for weir D1H003 for the<br />
period 1999 to 2003 .......................................................................................................... 52<br />
Figure 3-3: MAR for 10-Year Periods of the Observed Records from D7H008 ...................... 53<br />
Figure 3-4: Seasonal Distribution of Flows (Monthly Averages) for Each 10-Year Period ..... 53<br />
Figure 3-5: Mean monthly flows measured at Boegoeburg Dam before and after upstream<br />
dam regulation. .................................................................................................................. 54<br />
Figure 3-6: Box and whisker plots of pH for the different weirs before and after 1998 (B =<br />
before 1998; A = After 1998) ............................................................................................ 55<br />
Figure 3-7: Box and whisker plots of electrical conductivity concentration for the different<br />
weirs before and after 1998 (B = before 1998; A = After 1998) ....................................... 56<br />
Figure 3-8: Habitat Integrity for Riparian and Instream habitats for segments of the Upper<br />
<strong>Orange</strong> <strong>River</strong> ..................................................................................................................... 59<br />
Figure 3-9: Index of Habitat Integrity scores for Upper <strong>Orange</strong> <strong>River</strong> ..................................... 59<br />
Figure 3-10: National Parks of South Africa ............................................................................ 65<br />
Figure 3-11: Trans frontier National Parks within the Vaal And <strong>Orange</strong> <strong>River</strong> Catchment<br />
areas. ................................................................................................................................. 66<br />
Table 3-2: List of red data species of fish per province in South Africa and Lesotho. ............ 67
Table 4-1: A summary of the dune types present in the Kalahari ........................................... 70<br />
Figure 4-1: Linear Sand Dunes on a Landsat TM Satellite Image in the Kalahari .................. 71<br />
Figure 4-2: Sand dunes encroaching into the Molopo Valley at Welewerdierd (Source:<br />
Roughton International, 2001) .......................................................................................... 71<br />
Figure 4-3: The three Major Dunefields of the Kalahari Source: Adapted from Thomas and<br />
Shaw (1984) ...................................................................................................................... 72<br />
Figure 4-4: Lunette dunes on a Landsat TM Satellite Image in the Kalahari .......................... 73<br />
Figure 4-5: Soil map of the Molopo <strong>River</strong> Basin ...................................................................... 77<br />
Figure 4-6: Mean Annual Rainfall of The Molopo <strong>River</strong> Basin ................................................ 79<br />
Figure 4-7: Vegetation Map of The Molopo <strong>River</strong> Basin .......................................................... 82<br />
Figure 4-8: Vegetation Associations in the Molopo <strong>River</strong> Basin .............................................. 84<br />
Table 4-2: Unprotected Wildlife Population by District (1989-1991) ....................................... 85<br />
Table 4-3: Estimates of Wildlife Numbers by Species inside the Gemsbok National Park .... 86<br />
Table 4-4: Conservation Areas in Molopo <strong>River</strong> Basin ............................................................ 91<br />
Figure 4-9: Conservation Areas, Cultural Heritage Sites and Ecologically Sensitive Areas in<br />
the Molopo <strong>River</strong> Basin ..................................................................................................... 92<br />
Figure 4-10: Wildlife Biomass in the Molopo <strong>River</strong> Basin in the Dry Season of 2004 ............ 93<br />
Table 4-5: The National Museum, Monuments and Art Gallery Archeological and Cultural<br />
Sites in the Molopo <strong>River</strong> Basin ........................................................................................ 96<br />
Table 4-6: Archeological sites in Middlepits-Bokspits area after Roughton International (2001)<br />
........................................................................................................................................... 97<br />
Figure 4-12: Gravel road to be up-graded in Molopo <strong>River</strong> Valley at Hoekrans ................... 100<br />
(Source: Roughton International, 2001) ................................................................................. 100<br />
Figure 5-1: The five catchments recognized in Namibia ....................................................... 103<br />
Figure 5-2: National Parks, Recreational areas and Resorts in Western and Southern<br />
Namibia ........................................................................................................................... 104<br />
Figure 5-3: Some of the interlinked issues that underpin unsustainable land and natural<br />
resource management .................................................................................................... 112<br />
Table 5-2: Some costs of land degradation incurred to households per year....................... 115
Figure 6-1: Typical habitat drivers and biological response for rivers. .................................. 130<br />
Table 6-1: Major environmental aspects within the different counties of the <strong>Orange</strong> <strong>River</strong><br />
basin ................................................................................................................................ 131<br />
Figure 7-1: The 8-step Reserve process as used in South Africa ......................................... 140<br />
Figure 7-2: <strong>Water</strong> <strong>Management</strong> Areas and the river systems in the <strong>Orange</strong> <strong>River</strong> catchment<br />
area.................................................................................................................................. 143<br />
Figure 7-3: <strong>Orange</strong> and Vaal <strong>River</strong> quaternary catchments .................................................. 144<br />
Table 7-1: List of all DWAF reserve studies that have been undertaken on the Vaal and<br />
<strong>Orange</strong> <strong>River</strong> catchments ............................................................................................... 145<br />
Table 7-2: Summary of the Present Ecological Status (PES) for each of the disciplines<br />
considered, their predicted trajectory of change for 20 years and an indication of whether<br />
these changes documented/expected are related to changes in the flow regime of the<br />
<strong>Orange</strong> <strong>River</strong>. Colour codes are provided in the key (DWAF 2005). ............................. 147<br />
Table 7-3: Summary of the Present Ecological Status (PES), The Predicted Trajectory of<br />
Change for 20 Years and an Indication of whether These Changes<br />
Documented/Expected are Related to Changes in the Flow Regime of the <strong>Orange</strong> <strong>River</strong>.<br />
......................................................................................................................................... 148
<strong>Orange</strong> IWRMP<br />
Task 7: Environment<br />
1 INTRODUCTION<br />
The <strong>Orange</strong> <strong>River</strong> originates in the Lesotho Highlands and flows in a westerly direction<br />
2 200 km to the west coast where the river discharges into the Atlantic Ocean (see<br />
Figure 1-1). The <strong>Orange</strong> <strong>River</strong> basin is one of the largest river basins south of the<br />
Zambezi with a catchment area of approximately 1 million km 2 (Mckenzie and<br />
Stoffberg, 1994).<br />
Figure 1-1: <strong>Orange</strong> <strong>River</strong><br />
It has been estimated that the natural runoff of the <strong>Orange</strong> <strong>River</strong> basin is in the order<br />
of 11 300 million m 3 /a of which approximately 4 000 million m 3 /a originates in the<br />
Lesotho Highlands and approximately 800 million m 3 /a from the contributing catchment<br />
downstream of the <strong>Orange</strong>/Vaal confluence which includes a small portion in<br />
Botswana feeding the Nossob and Molopo rivers. The remaining 6 500 million m 3 /a<br />
13/11/2007 Final<br />
7
<strong>Orange</strong> IWRMP<br />
Task 7: Environment<br />
originates from the areas contributing to the Vaal, Caledon, Kraai and Middle <strong>Orange</strong><br />
rivers (see Figure 1-2).<br />
It should be noted that much of the runoff originating from the <strong>Orange</strong> <strong>River</strong><br />
downstream of the <strong>Orange</strong> Vaal confluence is highly erratic and cannot be relied upon<br />
to support the various downstream demands unless further storage is provided.<br />
BOTSWANA<br />
NAMIBIA<br />
ORANGE RIVER<br />
BASIN<br />
SOUTH<br />
AFRICA<br />
480 330<br />
3 900<br />
Legend<br />
Annual Runoff from<br />
70 indicated area<br />
in million m 3/a<br />
1 200<br />
4 000<br />
1 400<br />
0<br />
200 400 km<br />
WRP_P0076_Graphics_Fig5.cdr<br />
Figure 1-2: Approximate <strong>Water</strong> Balance for Natural Runoff in the <strong>Orange</strong> <strong>River</strong> Basin<br />
(ORASECOM Inception report 2004)<br />
The water flowing into the <strong>Orange</strong> <strong>River</strong> from the Fish <strong>River</strong> in Namibia (near the river<br />
mouth) could theoretically be used to support some of the downstream demands,<br />
particularly the environmental demands at the river mouth. To date, however, the<br />
contributions from the Fish <strong>River</strong> (in Namibia) cannot be utilised to support any<br />
downstream demands since these demands are currently supplied with water from<br />
Vanderkloof Dam which must be released well in advance since the water takes 2 to 6<br />
weeks to reach the mouth (some 1 400 km away). Any water flowing into the <strong>Orange</strong><br />
<strong>River</strong> from the Namibian Fish <strong>River</strong> will therefore add to the water already released<br />
13/11/2007 Final<br />
8
<strong>Orange</strong> IWRMP<br />
Task 7: Environment<br />
from Vanderkloof Dam since it is currently not possible to stop or store the additional<br />
water once it has been released.<br />
It should be noted that the figures indicated in Figure 1-2 are approximate values<br />
which are provided to highlight the variable and uneven distribution of runoff from east<br />
to west in the <strong>Orange</strong> <strong>River</strong> basin. They refer to the natural runoff which would have<br />
occurred had there been no developments in the catchment. The actual runoff<br />
reaching the river mouth (estimated to be in the order of 5 500 million m 3 /annum) is<br />
considerably less than the natural value (over 11 000 million m 3 /annum). The<br />
difference is due mainly to the extensive water utilisation in the Vaal <strong>River</strong> basin, most<br />
of which is for domestic and industrial purposes. Large volumes of water are also used<br />
to support the extensive irrigation (estimated to be in the order of 1 800 million<br />
m 3 /annum) and some mining demands (approximately 40 million m 3 /annum) occurring<br />
along the <strong>Orange</strong> <strong>River</strong> downstream of the <strong>Orange</strong>/Vaal confluence (see Figure 1-3)<br />
as well as some irrigation in the Lower Vaal catchment and Eastern Cape area<br />
supplied through the <strong>Orange</strong>/Fish Canal (see Figure 1-4) (Eastern Cape Fish <strong>River</strong>).<br />
In addition to the water demands mentioned above, evaporation losses from the<br />
<strong>Orange</strong> <strong>River</strong> and the associated riparian vegetation account for between 500 million<br />
m 3 /a and 1 000 million m 3 /a depending upon the flow of water (and consequently the<br />
surface area) in the river (Mckenzie et al, 1993, 1994 and 1995).<br />
1.1 Future demands on the <strong>Orange</strong> <strong>River</strong><br />
Several new developments have already been commissioned or have been identified<br />
as possible future demand centres for water along the Lower <strong>Orange</strong> <strong>River</strong>.<br />
In Namibia, possible developments include:<br />
• The Skorpion lead and zinc mine, which is earmarked to be the world's lowest<br />
cost zinc producer;<br />
•<br />
The proposed Kudu gas-fired power station at Oranjemund, where seawater<br />
will most probably be used for the cooling operations of the power station.<br />
The only fresh water required from the <strong>Orange</strong> <strong>River</strong> will be the demineralised<br />
water used in the boilers;<br />
• Haib copper mine. The water demand of Haib Mine would overshadow any<br />
other mining enterprises along the <strong>Orange</strong> <strong>River</strong> on the Namibian side.<br />
Estimates of the water which will be needed annually by the mine range from<br />
the initial figure of 60 million m 3 to more recent estimates of approximately 20<br />
13/11/2007 Final<br />
9
<strong>Orange</strong> IWRMP<br />
Task 7: Environment<br />
million m 3/. This high water consumption rate is as a result of the water<br />
intensive processes that the mine intends to use. There is a 25 year life span<br />
for the mine. The viability of the Haib Mine depends to a great extent on the<br />
world copper price which in turn depends upon demand and supply.<br />
• Several irrigation projects for communal and commercial irrigation along the<br />
northern riverbank.<br />
In general, the vast majority of future urban-industrial growth in the <strong>Orange</strong> Basin will<br />
take place in the Upper Vaal area. According to the State of the Cities <strong>Report</strong> (2004),<br />
the urban portion of Gauteng - comprised primarily of the cities of Johannesburg,<br />
Ekurhuleni and Tshwane will be a polycentric urban region with a projected population<br />
of some 14.6 million people by 2015, making it one of the largest cities in the world.<br />
This growth will be a significant source of growing water demand in the future.<br />
Both South Africa and Namibia have identified considerable development opportunities<br />
along the Lower <strong>Orange</strong> <strong>River</strong>. The bulk of the opportunities have been identified in<br />
Namibia, including irrigation projects for both commercial and communal farmers.<br />
The viability of irrigation schemes in the <strong>Orange</strong> <strong>River</strong> Basin can be enhanced through<br />
encouraging the cultivation of high value crops through marketing support incentives to<br />
the farmers. The use of more efficient irrigation systems will also allow a farmer with<br />
the same volume of water allocation to cultivate a larger area (Muir et al., 2004).<br />
Similar potential also exists in South Africa, which has identified a particular need to<br />
develop irrigation opportunities for resource-poor farmers and to support poverty<br />
alleviation. It appears that the only irrigation developments for which new water rights<br />
will be released in South Africa in the <strong>Orange</strong> <strong>River</strong> system will be for small-scale<br />
farming. Three allocations have been made, including 4 000 hectares each for the<br />
Lower <strong>Orange</strong> WMA, the Upper <strong>Orange</strong> WMA and for the Fish to Tsitsikama WMA.<br />
These proposed developments will lead to a substantial increase in water demand.<br />
In Namibia such developments include the Haib copper mine, Skorpion lead and zinc<br />
mine (already developed), the Kudu gas fired power station at Oranjemund.<br />
Similar potential also exists on the South African side of the river with particular need<br />
to develop irrigation for previously disadvantaged farmers. In Lesotho there is<br />
considerable development planned for the Lesotho Lowlands area and also the<br />
potential for further transfers from the Lesotho Highlands <strong>Water</strong> Project. In Botswana,<br />
13/11/2007 Final<br />
10
<strong>Orange</strong> IWRMP<br />
Task 7: Environment<br />
the developments that may influence the <strong>Orange</strong> <strong>River</strong> are restricted mainly to<br />
groundwater abstraction.<br />
Figure 1-3: Major <strong>Water</strong> Demands along the Lower <strong>Orange</strong> <strong>River</strong>.<br />
13/11/2007 Final<br />
11
<strong>Orange</strong> IWRMP<br />
Task 7: Environment<br />
Figure 1-4: Major <strong>Water</strong> Transfer Schemes from Gariep and Vanderkloof dams.<br />
13/11/2007 Final<br />
12
<strong>Orange</strong> IWRMP<br />
Task 7: Environment<br />
In Lesotho, Phase 1 of the Lesotho Highlands <strong>Water</strong> Project represents one of the<br />
largest water transfer schemes in the world. Some details of the scheme are shown in<br />
Figure 1-5.<br />
Figure 1-5: Phase 1 of the Lesotho Highlands <strong>Water</strong> Project.<br />
13/11/2007 Final<br />
13
<strong>Orange</strong> IWRMP<br />
Task 7: Environment<br />
2 ENVIRONMENTAL ISSUES IN LESOTHO<br />
2.1 Conservation Areas<br />
2.1.1 Lesotho National Parks/Nature Reserves (extract from Mokuku et al.,<br />
2002).<br />
National Parks and nature reserves are sites where natural heritage of the country can<br />
be preserved in-situ. Nature reserves have enhanced the protection to aspects of<br />
Basotho natural heritage in terms of conservation of biodiversity and the Basotho<br />
cultural heritage in terms of traditional knowledge in medicinal plants and animals.<br />
Several sites have been proposed for inclusion as nature reserves and national parks<br />
but the following have received official recognition.<br />
• Sehlaba-Thebe National Park. It was proclaimed a “Wild-life Sanctuary and<br />
National park” and therefore a protected Area on 27 th February, 1970 (NES,<br />
2000). It is situated in Qacha’s Nek, has an area of 6, 475 hectares and lies at<br />
an altitude between 2, 300 and 2, 500 meters above sea level. It has<br />
subsequently been established that the Park contains several important rock<br />
art (archaeological) sites.<br />
• Masitise Nature reserve. This also included an archaeological site and historic<br />
mission cave house. It is proclaimed a National Monument in Quthing District.<br />
It is a small reserve of about 20 ha, 3 ha of which is thickly wooded.<br />
• National University of Lesotho (Roma Campus). It was declared a bird<br />
sanctuary by the council of the University on 3 rd April 1965. It has an area of<br />
about 95 ha and is situated in Highveld Grassland Zone, but the area has<br />
been modified by introduction of exotic trees and creation of water areas.<br />
2.1.2 Transfrontier Conservation and Development areas<br />
There are other initiatives to include some areas of biodiversity importance into the<br />
national listing of officially declared national parks and nature reserves. The two<br />
initiatives are along the border with South Africa. The first of these is the Maloti<br />
Drakensberg Area and the second is the wetland area in southern Lesotho.<br />
The Maloti-Drakensberg Transfrontier Conservation and Development area<br />
Programme is a World Bank financed Project intended to put measures in place for the<br />
conservation of the Biodiversity values of the Maloti Drakensberg area as well as<br />
development of the peoples of the adjacent areas along the border between Lesotho<br />
13/11/2007 Final<br />
14
<strong>Orange</strong> IWRMP<br />
Task 7: Environment<br />
an South Africa. The programme is a joint initiative of the Governments of Lesotho<br />
and the Republic of South Africa. It is a transboundary conservation and development<br />
programme aimed at amongst others, establishing protected areas while promoting<br />
sustainable tourism in the Maloti Drakensberg mountains.<br />
Letšeng-la-letsie Protected Area is a wetland area in Southern Lesotho. The current<br />
efforts are to engage support to enable declaration of the area as a protected site.<br />
Financial support for the initiative is through the Conserving Mountain Biodiversity in<br />
Southern Lesotho<br />
project. The project is financed by Global Environment Facility (GEF) and is<br />
implemented by the United Nations Development Programme (UNDP). The National<br />
University of Lesotho has undertaken a comprehensive Environment Impact<br />
Assessment for the establishment of a protected area at Letšeng-la-Letsie.<br />
Figure 2-1: Locality of Lesotho National Parks, Nature reserves and Transfrontier<br />
National park.<br />
As part of the strategy to conserve the environment around the Malibamatšo river at<br />
Katse the Lesotho Highlands <strong>Water</strong> Project established three protected areas.<br />
13/11/2007 Final<br />
15
<strong>Orange</strong> IWRMP<br />
Task 7: Environment<br />
• The Bokong Nature Reserve is about 1970 hectares and lies between 2, 600<br />
and 3, 200 meters above sea level (m.a.s.l.). It is essentially a sub-alpine<br />
grassland with a number of endemic animals and plants species. The<br />
numerous endemic wetlands characterising the highlands region support the<br />
perennial nature of the mountain streams. The nature reserve has a visitor<br />
centre, a bird watching, distinct wetland areas with characteristic vallyhead<br />
fens and a lepaqoa waterfall.<br />
• The Tšehlanyane National Park is over 5, 600 hectares covers a range of<br />
altitudes from 1, 600 to 3, 000m.a.s.l. It is very rugged, with sharp mountains<br />
crests and deeply incised ravines. The plant species within the park include<br />
one of the few indigenous Leucosidea woodlands in Lesotho that are well<br />
preserved there than anywhere else in the country. Activities and facilities<br />
include, bird watching, small game viewing, crafts, swimming in the streams<br />
and picnic sites.<br />
• Liphofung Reserve is 4 hectares in size and has a cave area which was<br />
inhabited by the San and other Stone Age people some 150 years ago. It<br />
also has a historical importance in that the founder of the Basotho nation,<br />
King Moshoeshoe I, used it. It has been created mainly for its historical<br />
importance, but has its own distinctive fauna and flora. Rock art and rich<br />
archaeological deposit of stone age implements are found in the cave.<br />
Activities and facilities provided include bird watching, rock art lectures and<br />
pony rides.<br />
• Muela Nature Reserve is 45 ha around ‘Muela reservoir and is being<br />
developed as a Nature Reserve. The current plans are to fence it and create a<br />
miniature zoo with indigenous plants and animals both terrestrial and aquatic<br />
species. This may include reintroduction of species now extinct in Lesotho<br />
but still found elsewhere.<br />
LHDA engaged the services of Earthplan consultants to develop the three sites in<br />
terms of planning, design, implementation and management for five years. Local<br />
communities were engaged in the development of the reserves and the associated<br />
eco-tourism facilities. The project also drew on the communities’ natural resources<br />
related indigenous knowledge. The local communities benefit directly and indirectly<br />
from the protected areas in many ways and including 1) employment opportunities<br />
during the development and during the subsequent operational stages of the reserves,<br />
13/11/2007 Final<br />
16
<strong>Orange</strong> IWRMP<br />
Task 7: Environment<br />
2) entrepreneurial and business opportunities within park management and the tourism<br />
market and 3) sustainable resource management and use, providing for improved<br />
environmental conditions.<br />
2.1.3 Other Conservation Areas in Lesotho include the following:<br />
• A small botanical garden has been established at Katse, although it does not<br />
yet have formal protection. There are also proposals to establish a botanical<br />
garden in Maseru in the area formerly occupied by the racecourse.<br />
• Range <strong>Management</strong> Areas (RMAs) specifically designated in the mountain<br />
rangelands in which rights to graze one’s livestock have been restricted by the<br />
chief to a specific group of livestock owners who have formed themselves into<br />
a Grazing Association (GA).<br />
• Forest Reserves and <strong>Plan</strong>tation Areas are Government-owned plantations on<br />
non-arable land which have been specifically set aside for the establishment<br />
and sustainable management of exotic tree plantations. They derive from the<br />
Lesotho Woodlot Project, which was set up in 1973. The total area planted to<br />
trees was reported by Maile (1999) to be more than 7 000 ha and tree types<br />
are mainly pines and eucalypts in the Lowlands and Foothills of Lesotho and<br />
few areas in the Maloti.<br />
• Restricted Access Areas (RAAs) are Military Bases and Training Areas, the<br />
fenced area of the Letseng-la-Terae Mine, and the Moshoeshoe 1<br />
International Airport. These RAAs have the ability to conserve biodiversity as<br />
they limit access to the general public who would otherwise utilize the<br />
resources within these areas had they not been fenced off. In so doing they<br />
have removed the pressures on biological resources that the public and to<br />
domestic animals would have on the flora and fauna within them.<br />
• Agricultural Research Station shares a common site of about 230 ha on the<br />
outskirts of central Maseru with the Lesotho Agricultural College. This site<br />
may also be considered as a Managed Resource Area.<br />
2.2 Cultural and Historical Heritage<br />
The cultural and historical heritage in Lesotho is unique to the region and provides<br />
opportunities and interest for regional and international tourism market and scholarly<br />
work. The discussion of the Lesotho cultural and historical heritage will follow a<br />
13/11/2007 Final<br />
17
<strong>Orange</strong> IWRMP<br />
Task 7: Environment<br />
similar pattern as has been established within the previous section, i.e. to state the<br />
driving forces, pressures, states and impacts and the responses.<br />
2.2.1 Driving forces<br />
The driving forces that give rise to changes on the state of the Lesotho’s cultural and<br />
historical heritage are:<br />
a) Development Projects/initiatives: The drive to meet people’s basic needs.<br />
Developments such as construction/upgrading of roads, supply of water and<br />
sanitation, development of agriculture, job creation through industrialisation causes<br />
conditions that pose threat to Lesotho cultural and historical heritage. For example,<br />
the expansion of industry in the attempt to alleviate poverty and to meet the needs of<br />
the people give rise to pollution which sets pressure on natural resources. Rock art<br />
sites have either been blasted away in road construction, or covered in soil debris.<br />
b) Education: The silence of the education curricula and programmes about Lesotho’s<br />
cultural and historical heritage, limit awareness and knowledge about the heritage.<br />
c) Globalisation: The rapidly increasing rate of information exchange, trade,<br />
communication, mobility, transportation across nation states is associated with<br />
potentials for great influences on material conditions and cultures of societies. This<br />
process provides opportunities for improvement of livelihoods but may also adversely<br />
impact on powerless cultures.<br />
Table 2-1: Legal Instruments and Special Events as Driving Forces for environmental<br />
change.<br />
Legal Instrument/Special Event<br />
SADC Tourism Protocol formulated<br />
by Member states in Mauritius.<br />
Stockholm International Conference<br />
on Cultural Policies for Development.<br />
The ‘Draft’ SADC Protocol on<br />
Culture, Information and Sport.<br />
Constitution of Lesotho [Section 36]<br />
World Decade for Cultural<br />
Development<br />
UN International Year for Cultural<br />
Heritage<br />
-<br />
Brief Description<br />
The UNESCO initiated a meeting that resulted in the<br />
establishment of an ‘International Network on Cultural<br />
Policies’ in 1998. Membership is free and open to<br />
interested parties.<br />
SADC Heads of States and Governments signed the<br />
Protocol in 2000 in Malawi. Ratification in Lesotho was to<br />
have been done in 2002.<br />
“Lesotho shall adopt policies designed to protect and<br />
enhance the natural and cultural environment of Lesotho<br />
for the benefit of both present and future generations.”<br />
Involved members states undertaking projects on cultural<br />
development and increasing awareness of the importance<br />
of culture for economic and human development<br />
1992 marked the 30 th anniversary of the adoption of the<br />
World Heritage Convention (1992). Projects and activities<br />
13/11/2007 Final<br />
18
<strong>Orange</strong> IWRMP<br />
Task 7: Environment<br />
Legal Instrument/Special Event<br />
The OAU Cultural Charter for Africa<br />
The Protection of the World Cultural<br />
and Natural Heritage Convention<br />
The World Heritage Convention<br />
The International Copyright<br />
Convention<br />
World Intellectual Property<br />
Organisation<br />
Brief Description<br />
aimed at promoting and protecting the world cultural<br />
heritage will be undertaken.<br />
Concerned with the respect of fundamental right of people<br />
to practice and enjoy their culture and lives in harmony with<br />
their political, economic, social, philosophical and spiritual<br />
ideas.<br />
The foremost international legal instrument aimed at<br />
protecting cultural and natural treasures. Lesotho has not<br />
ratified the Convention<br />
The protocol provides a framework of UNESCO support for<br />
member countries to protect their heritage. Lesotho is in the<br />
process of ratifying the convention.<br />
International Convention relative to the protection of literary<br />
and artistic work. By UK signature.<br />
Concerned with copyrights on musical compositions, book<br />
writing etc. [Lesotho has not signed the convention].<br />
d) Religion: The dominant religious institutions, of European origin, devalue local<br />
belief systems, knowledge and practices. Thus cultural heritage has remained largely<br />
on the periphery of formal mainstream knowledge.<br />
Other Driving Forces are international protocols, conventions and special international<br />
events that Lesotho is a party to (Table 2.1) since once Governments have signed and<br />
ratified the instruments, they are obliged to live by the spirit of the convention, protocol<br />
or special international event.<br />
2.2.2 Pressures<br />
The changes in cultural and historical heritage are exerted by many and varied<br />
pressures but important amongst which are the 1) urban and population growth due to<br />
aligned industrialization, 2) lack of awareness of the inhabitants of the country upon<br />
the cultural and historical heritage and 3) the development projects and initiatives.<br />
a) Urbanisation and Population Growth: More often urbanization and population<br />
growth follow industrial development. Development initiatives and more especially<br />
industrialization, driven by the need to meet people’s basic needs, give rise to<br />
landscape modification due to construction of buildings, roads and other infrastructure.<br />
Often these developments result in the demolition of buildings of historic significance<br />
and destruction of the biophysical environment. Expansion of settlement in urban<br />
centers to accommodate growing population results in loss of endemic plants and<br />
animals and other valuable natural resources.<br />
13/11/2007 Final<br />
19
<strong>Orange</strong> IWRMP<br />
Task 7: Environment<br />
b) Lack of Awareness: A report by Chakela (1997) indicated that school pupils in<br />
Lesotho know very little about Lesotho’s cultural heritage. It is therefore indicative that<br />
people in Lesotho may unknowingly be creating pressure on cultural and historical<br />
heritage of Lesotho, as people who may not be aware of, or are not knowledgeable<br />
about their cultural and historical heritage are likely not to value and protect it. Also<br />
contributing to this condition is lack of developed national cultural infrastructure such<br />
as national museums, national art gallery and national archives.<br />
c) Development projects/initiatives: The assumptions underpinning development<br />
initiatives often disregard the value of local knowledge and often times their orientation<br />
often threaten and destroy the cultural heritage of the people whose livelihoods they<br />
are intending to improve (Quilan, 1995). Similarly, development initiatives that are not<br />
informed in respect of cultural and historical heritage of Lesotho, such as construction<br />
of buildings and roads, are likely to destroy that heritage. There are reported<br />
examples where road constructions and upgrading have destroyed or put under<br />
pressure important cultural and historical heritage of Lesotho. These include rock art<br />
sites that either have been blasted away or covered in soil at the dumping sites.<br />
d) State and impact- trends<br />
The state and impacts of the Lesotho cultural and historical heritage are discussed in<br />
respect of 1) the palaeontological resources which are the remains and prints of<br />
animals that died thousands of years ago, 2) archaeological resources which are the<br />
buried remains of humans who lived many thousands of years ago and their artefacts<br />
such as tools, 3) ancient rock paintings, 4) historic buildings, 5) historic sites, 6)<br />
museums and archives, 7) nature reserves, 8) traditional environmental knowledge<br />
and 9) Arts in the country.<br />
2.2.3 Paleontology<br />
Palaentological discoveries in Lesotho have drawn the world’s attention and made an<br />
important contribution to the understanding of the past forms of life (Ambrose, 1991).<br />
The first recorded fossil footprints in sub-Saharan Africa were discovered at Morija in<br />
the 1880s. Many more palaeontological findings that were considered to be significant<br />
asserts in Lesotho were later discovered. They include discovery of Tritylodon a<br />
mammal-like reptile which is a fossil that was considered as the worlds earliest<br />
‘mammal’ for more than fifty years, Lesothosaurus which is a dinosaur of about a<br />
meter long, Megazostrodon which is about 13 cm in length and is generally<br />
13/11/2007 Final<br />
20
<strong>Orange</strong> IWRMP<br />
Task 7: Environment<br />
considered as the world’s earliest mammal and Erythrotherium which is one of the<br />
earliest known mammals (Ambrose, 1991).<br />
Further discoveries were made during the Lesotho Highlands <strong>Water</strong> Project’s<br />
operations to rescue valuable resources from damage by project activities.<br />
Palaeontological surveys discover some fossils. These include excavations of plant<br />
remains from the road construction survey of Maseru By-pass in 1997 (Prasad, 1998).<br />
The drawbacks to the development of paleontology have been cited by Chakela (1997)<br />
as l) lack of National Museum to facilitate the exploration and storage of fossils, 2)<br />
although the Ministry of Tourism, Environment and Culture has formulated tourism<br />
plans to palaeontological sites, such as the one at Moyeni, these sites are<br />
underutilized and 3) the school curricula do not reflect any content on Lesotho’s<br />
fossils. Fossil sites in Lesotho are better known to school pupils outside Lesotho,<br />
more especially from Europe and America (Ambrose 1991). There are presently no<br />
plans to include paleontology content into the school curricula. Furthermore, there is<br />
no framework for training locals in paleontology. It is expected that the recent signing<br />
of cooperation, in 2002, between the Government of Lesotho and the South African<br />
Government will enable increased interaction between Paleontologists from S.A. and<br />
Lesotho and promote training and research in the field. Since external researchers<br />
coming to do paleontology related work are presently not legally bound to provide the<br />
Ministry of Tourism, Environment and Culture with their research findings, their studies<br />
often remain unknown locally.<br />
2.2.4 Archaeology<br />
Similar to paleontology, archaeology has a great potential in Lesotho but has not been<br />
explored adequately. There are many archaeological sites in Lesotho, but there have<br />
not been any locally initiated excavations. Excavations have however been carried out<br />
by researchers from South Africa and the United Kingdom as there is lack of capacity<br />
to undertake archaeological surveys in the country. In 1997 there was only one<br />
professional in Lesotho trained in archaeology. Formal excavation work may be<br />
traced back to the 1960s, during the colonial rule. Presently, discoveries include the<br />
large rock shelters at Sehonghong which was inhabited for over 50,000 years. The<br />
diggings uncovered stone age and iron age implements.<br />
The LHDA rescue operations have initiated some archaeological excavations. They<br />
include, archaeological excavation at a rock-shelter in ‘Muela in 1993, and within the<br />
Senqunyane river catchment, at Lithakong rock shelter, in 1995 where some stone<br />
13/11/2007 Final<br />
21
<strong>Orange</strong> IWRMP<br />
Task 7: Environment<br />
tools, animal remains, bone tools, pottery and other material were found (Kaplan,<br />
1993, 1996). The material is in Cape Town where it was analysed. A variety of<br />
artefacts, dating from the later Stone and Iron Ages, have also been excavated at<br />
Hololo Valley at the Hololo Crossing rock-shelter in 1990 (Kaplan, 1992). The findings<br />
added to archaeological records of Lesotho and are kept at the University of Cape<br />
Town where they were analysed. The artefacts will be transferred to Lesotho when<br />
appropriate storage facilities have been developed.<br />
The shortcomings inhibiting the development of archaeology in Lesotho are 1) lack of<br />
a National Museum for exhibition of findings, 2) lack of local professional archaeologist<br />
in the country, 3) lack of archaeological content in the school curricula. For example,<br />
the history syllabuses cover about 200 years of Lesotho’s history but are silent about<br />
the 100,000 years of human inhabitation.<br />
2.2.5 Rock Paintings<br />
The San (Baroa) people once inhabited Lesotho and have left an extremely rich rock<br />
art heritage. The paintings they made on rocks and cave walls reflect the ancient<br />
environment and the their beliefs. The total number of rock painting sites is estimated<br />
at 3,000 throughout Lesotho but is diminishing as a result of natural processes and<br />
vandalism. There is much diversity in the San rock paintings but many showed animals<br />
that have now disappeared from Lesotho such as lions, hippopotamus, baboons, bush<br />
pigs, ostriches, elands and many kinds of antelopes. The paintings that reflect aspects<br />
of the religion of Baroa have also been identified (Lewis Williams, 1981). The first rock<br />
paintings to be copied and published in Southern Africa were recorded in Lesotho<br />
(Orpen, 1874).<br />
The Lesotho Highlands <strong>Water</strong> Project rescue operation has conserved a number of<br />
painted rocks that would have been inundated by the impounding of the dam. The<br />
salvage programme recovered painted panels or rocks from the sites affected by the<br />
project at Muela rock-shelter for storage and curation (e.g. Loubser, 1993). Liphofung<br />
project, phofung meaning ‘Place of the eland, has undertaken to protect Bushman<br />
paintings at the site. Liphofung is located in the base of a tributary of the Hololo <strong>River</strong><br />
in the Lesotho highlands. The place has been developed into a tourist site. The<br />
development of Liphofung involves construction of a Basotho village, Rock Art<br />
interpretation centre, protection of paintings and archaeological deposits.<br />
Preservation of the rock art in Lesotho is limited by 1) lack of museum facilities and a<br />
functioning national archives to keep and display the findings and 2) lack of protective<br />
13/11/2007 Final<br />
22
<strong>Orange</strong> IWRMP<br />
Task 7: Environment<br />
measures against natural processes and vandalism. However, the Ministry of<br />
Tourism, Environment and Culture is developing strategies to protect Rock Painting<br />
sites. Furthermore, the Ministry is engaged in making regular visits to such sites and<br />
to raise awareness among communities of the adjacent sites. The Ministry is also<br />
compiling a list of rock painting sites. Most of the Ministry’s activities are at Ha<br />
Baroana, where there are organised visits to the caves and the community participates<br />
in the management and protection of the paintings. Other developments have been<br />
undertaken at Ha Baroana to enhance its tourism potential. The Ha Baroana site has<br />
a nature reserve and cave rock paintings. A bridge and a 4km road from Ha Matela to<br />
Ha Baroana have been established to enable easy access to the site. Offices for<br />
caretakers and structures for a site museum have been built, though the latter is not<br />
yet functioning.<br />
2.2.6 Historic Buildings<br />
Historical buildings are old buildings associated with certain significant historical<br />
developments in the country. They are located mainly in district headquarters or<br />
towns, villages of former principal chiefs Christian missionary stations. Whilst many of<br />
these buildings have been lost and many are threatened, there are some that are still<br />
intact.<br />
The problems of preserving the integrity of the historical building are many but the<br />
most important ones have been identified as firstly, minimal attention is given to<br />
buildings of historical importance as only three historic buildings are legally protected.<br />
These are the Major Bell’s Tower at Hlotse, the remains of a Fort at Fort Hartley in<br />
Quthing District and the Christian Mission Cave House at Masitise. The latest report<br />
indicates that the Major Bell’s Tower has now been affected by the elements and<br />
neglect (Molibeli 2002, Pers.Comm.). Secondly, many buildings of historic significance<br />
have been or are being lost. These are mainly Church buildings and District<br />
Administration buildings in Major towns. Many of these historical buildings have been<br />
lost through developments. The existing development framework does not provide for<br />
the Ministry of Tourism, Environment and Culture to be informed or consulted when<br />
construction of roads or buildings that would affect the buildings of historic importance<br />
is being undertaken. Thirdly, there is no National Museum to guide activities needed<br />
to preserve the historical buildings.<br />
An abbreviated inventory of historic buildings was undertaken in 1987 and since then<br />
none has been undertaken. Therefore, there is a need for an inventory or systematic<br />
13/11/2007 Final<br />
23
<strong>Orange</strong> IWRMP<br />
Task 7: Environment<br />
listing of historic buildings for purposes of preservation in Lesotho. The official listing<br />
was last done in 1969 and has not been updated since (see Legal Notice No.36).<br />
2.2.7 Historic Sites – Proclaimed National Monuments<br />
Historic sites are important places in the history of Basotho. The importance of these<br />
places has let them to be proclaimed as National Monuments in terms of the<br />
Proclamation of Monuments, Relics, Fauna and Flora Legal Notice No.36 of 1969.<br />
The sites may include archaeological and rock art sites, group of buildings, fortresses<br />
and battlefields. There are presently nine legally proclaimed monuments. They are 1)<br />
the rock Painting site at Ha Khotso in Maseru District, 2) the deposits of petrified wood<br />
on the top of the slopes of Thaba-Tšoeu in the Mohale’s Hoek District, 3) the fossil bed<br />
and fossil footprints site of Maphutšeng in the Mohale’s Hoek District, 4) the fossil<br />
footprint site at Moyeni in the Quthing District, 5) the nature reserve archaeological site<br />
and cave house of Masitise Seqhobong in the Quthing District, 6) the top of Thaba-<br />
Bosiu Fortress in the Maseru District, 7) Major Bell’s Tower at Hlotse in the Leribe<br />
District, 8) the remains of the Fort at Fort Hartley in the Quthing District and 9) the top<br />
of the Mount Moorosi Fortress in the Quthing District (Protection and Preservation<br />
Commission, 1983). The Dutch inscription, dating 1868, on the summit of Qeme is a<br />
historic site but it is neither legally protected nor officially recognised.<br />
The listing of historic sites was last made in 1969. However, more information on<br />
possible historic sites is being compiled by the Ministry of Tourism, Environment and<br />
Culture. Compilation of information would also include an evaluation of existing and<br />
officially proclaimed sites for protection and suitability as National Monuments.<br />
2.2.8 Museums and Archives<br />
Lesotho is one of the few African countries without a working National Museum.<br />
Museum development has been undertaken by a mission-promoted enterprise at<br />
Morija, where attractive small displays are both for visitors and schools. The situation<br />
for archives is a little better, thanks to pre-independence efforts by the colonial<br />
administration to keep records satisfactorily. In any-event, their keeping is now<br />
wanting as their access and updating are no longer undertaken. A well functioning<br />
National Museum and National Archives are required. A national Museum should<br />
work hand in glove with the national archives and must participate in the work of the<br />
national Monuments Commission. In their present form these facilities are neither able<br />
to protect and promote Lesotho’s cultural heritage nor compile existing information into<br />
13/11/2007 Final<br />
24
<strong>Orange</strong> IWRMP<br />
Task 7: Environment<br />
a National Museum and Archives system. A lot of valuable data from Lesotho is still<br />
found outside Lesotho due to lack of a National Museum and functioning Archives.<br />
The problems faced by the Museum and Archives facilities are many and varied but<br />
the following represent an abbreviated compilation of these problems. First, temporary<br />
‘museum’ quarters, situated in the Ministry of Tourism Environment and Culture, are<br />
presently used to store items intended for display. The Ministry of Tourism,<br />
Environment and Culture has developed a proposal for building of the National<br />
Museum in Maseru city, but its implementation has not occurred due to lack of<br />
finances. Second, the Museums Act of 1967 does not provide for any direct financial<br />
support from Government for the operation of the museum. Third, the national<br />
archives are not well functioning. The archives were transferred from NUL in 1997 to<br />
Maseru, where they were reported to be inaccessible (Chakela, 1997). Presently the<br />
archives are in the Department of Culture and plans are to move them to the National<br />
Library in Maseru where they will receive more efficient storage and management.<br />
Funding for the construction of the National Museum and Archives as well as the<br />
National Library has been sourced from the People’s Republic of China.<br />
2.3 Biodiversity in Lesotho<br />
2.3.1 Genetic Diversity<br />
Cultivated plants and domestic animals bred for particular selected traits are<br />
genetically less variable than their wild counterparts. An example is the Basotho potato<br />
(Litapole tsa Sesotho), introduced into Lesotho over 160 years ago, before potatoes<br />
began to be cultivated for the market and progressively standardised. Genetic diversity<br />
in livestock kept by Basotho is also low because the government encourages the<br />
rearing of only economically important breeds.<br />
Lesotho has a variety of plants and animals, even if they are not as obvious as those<br />
in other African States that have well-established parks and game reserves (NES,<br />
2000). Recent compilations show that Lesotho has 2961 documented plant species<br />
and at least 132 species of Thallophytes: algae and fungi. The total number of<br />
endemic plant species is estimated at 27 and one subspecies. Similarly, Lesotho has<br />
a limited variety of faunal species. There are 63 mammal species recorded in the<br />
country. However, historical records indicate an additional 19 species formerly present<br />
in Lesotho and are now locally extinct. Unfortunately, two of them are globally extinct.<br />
Table 6.6 shows the total number of species recorded for Lesotho. The vertebrate<br />
fauna includes 318 bird species, 40 reptile species, 19 amphibian species and 14 fish<br />
13/11/2007 Final<br />
25
<strong>Orange</strong> IWRMP<br />
Task 7: Environment<br />
species. For its size, Lesotho exhibits a great diversity of birds and furthermore there<br />
are 22 bird species for which there are only historical records - “Historical Species”<br />
refer to species for which there has been no record in the past 50 years and most were<br />
commonly present in the past and these can be regarded as extinct in Lesotho,<br />
although most still exist in neighbouring countries (NES, 2000). Records also show<br />
three historical reptile species. The fish species include eight indigenous species of<br />
which one, the Maloti minnow (Pseudobarbus quathlambae), is endemic to Lesotho.<br />
Unfortunately this Lesotho endemic fish species is highly threatened by water project<br />
developments. Lesotho invertebrates are likely to be more numerous than all other<br />
animal and plant species put together, but they have been inadequately documented,<br />
and at present there are 1279 species recorded and of which 134 species are<br />
endemic.<br />
Lesotho is an egalitarian society where access to land is unrestricted. As a<br />
consequence, therefore, natural resources and in particular biodiversity are under<br />
constant threat. Threats to Lesotho’s biodiversity resources are many and varied but<br />
all are human induced. Habitat degradation, fragmentation, the impact of introduced<br />
species, and the altered regimes (reservoirs and weirs) are all human induced threats<br />
to biodiversity in Lesotho. Amongst all these threats, habitat destruction is considered<br />
to be the most damaging and in particular threats relating to overgrazing and extensive<br />
land clearing have resulted in the loss and fragmentation of habitat across the country.<br />
Overexploitation of plants used for medicinal purposes is an additional serious threat<br />
to biodiversity because of the destructive nature of harvesting of medicinal plants as<br />
roots form the larger portion of medicines used. However, Lesotho has played a<br />
pivotal role in preserving a genetic strain of wild potatoes (Basotho potatoes, Solanum<br />
tuberosum). These wild Basotho potatoes are found virtually in all districts of the<br />
country and grow amongst wild shrubs or between rocks along river courses.<br />
Threats to Lesotho’s biodiversity resources are not only limited to those in the wild but<br />
are also real to the domestic or agricultural biodiversity. In agriculture, genetic<br />
diversity is very limited as national efforts have over the past years concentrated on a<br />
small number of high yielding varieties or breeds.<br />
13/11/2007 Final<br />
26
<strong>Orange</strong> IWRMP<br />
Task 7: Environment<br />
Table 2-2: Biological Diversity in Lesotho<br />
Group<br />
Number of Current<br />
Species<br />
Number of<br />
Historical Species<br />
Mammals 63 19 82<br />
Birds 318 22 340<br />
Reptiles 40 3 43<br />
Amphibians 19 - 19<br />
Fish 14 - 14<br />
Invertebrates 1 279 - 1 279<br />
<strong>Plan</strong>ts and Thallophytes 3 092 - 3 092<br />
Source: NES (2000)<br />
Total<br />
2.3.2 Flora<br />
The flora of Lesotho, even though it has been profoundly modified by human activities,<br />
contains a diverse range of plants, of which the vascular plants ranging from the<br />
primitive Psilotum to a wide range of flowering plants, of which a significant but<br />
unknown number is Lesotho endemics (Table 2.3). There are 3093 plant species<br />
comprising the thallophytes, bryophytes, pteridophytes, gymnosperms and<br />
agiosperms. It is estimated that there are at least 44 endemic species, including lower<br />
plants, as well as some endemic subspecies. The best known floral endemic is the<br />
spiral aloe (Aloe polyphylla) (Plate 2.1).<br />
Table 2-3: Numbers of known Lesotho <strong>Plan</strong>t taxa<br />
Category<br />
THALLOPHYTES<br />
(Algae and Fungi)<br />
BRYOPHYTES<br />
(Liverworts and<br />
Hornworts)<br />
No. Of<br />
Families<br />
No. Of<br />
Genera<br />
No. Of<br />
Species<br />
No. Of<br />
Subspecies<br />
>32 74 132 - -<br />
>10 39 60 1 1<br />
Mosses >28 102 219 2 6<br />
PTERIDOPHYTES<br />
(Ferns & fern allies)<br />
20 32 85 1 15<br />
GYMNOSPERMS 6 16 62 1 8<br />
ANGIOSPERMS<br />
(Monocotyledons)<br />
24 187 776 43 72<br />
Dicotyledons) 106 466 1759 129 158<br />
TOTALS >226 916 3093 177 260<br />
Source: NES (2000)<br />
No. Of<br />
Varieties<br />
13/11/2007 Final<br />
27
<strong>Orange</strong> IWRMP<br />
Task 7: Environment<br />
The diversity of vegetation types is commonly used to express ecosystem diversity,<br />
since vegetation influences the occurrence and distribution of animals. The grassland<br />
biome is subdivided into three grassland types as has been described in the recent<br />
work of Acocks in the Vegetation of South Africa, Lesotho and Swaziland which<br />
was edited by Low and Rebelo (1996). Probably the most useful work of Low and<br />
Rebelo are the three vegetation types, Highveld Grassland mainly representing the<br />
moist cold highveld grassland extending to some 1800 m.a.s.l, the Afromontane<br />
Grassland representing the Afro Mountain Grassland extending from 1800 to 2500<br />
m.a.s.l and the Afroalpine Grassland representing the Afroalpine Grassland above<br />
2500 m.a.s.l.<br />
Of great significance amongst these grassland biomes is the Afroalpine grassland that<br />
contains the greatest diversity of plant and animals. Descriptively, the sub-alpine<br />
scrub occurring within the sub-alpine belt has a variety of indigenous forest in a<br />
number of deep valleys, where it has survived firewood gatherers. The forests occur<br />
as narrow strips along river banks in remote areas. Thickets of indigenous trees can<br />
exist in favourable areas up to 2,500 m.a.s.l. Some areas are typically dominated by<br />
Rhus (Kolitšane/tšinabele) (Plate 6.9) while others are dominated by Leucosiodea<br />
sericea (cheche), Buddleia salviifolia (lelothoane) and B. loricata (lelora). Tall patches<br />
of herb meadows in wetter areas and drier grassland on the ridges also dominate this<br />
grassland zone. The Buddleia – Leucosidea scrub was sometimes continuous with<br />
shorter Passerina, Cliffortia, Phillipia and Inulanthera scrub species mainly on northern<br />
slopes, which are drier. This vegetation type has apparently been converted into<br />
temperate grassland by fire (Jacot – Guillarmod, 1971; Weiland, 1982).<br />
The alpine belt, which occurs above the sub-alpine scrub at 2, 800 m.a.s.l., contained<br />
numerous spring bogs, wet herb and sedge meadows. Merxmuellera (moseha),<br />
Festuca (letsiri), Pentaschistis (hlokoana) and various heaths of Erica and Helichrysum<br />
dominated the grassland. Heavy grazing of livestock, construction activities and<br />
mining have adversely affected the spring bogs. The grassland of Lesotho appears to<br />
be deteriorating at an alarming rate due to unsustainable range management<br />
practices. At present, approximately 359,680 ha of rangeland have been invaded by<br />
Karoo shrub, Chrysocoma ciliata (sehalahala). This degraded area represents about<br />
16% of the entire rangeland.<br />
The best known and largest endemic is the spiral aloe (A. polyphylla, Kharatsa, Plate<br />
2.1) which grows at heights of 2500 to 2800 m.a.s.l. Its market value is well known and<br />
it has vanished in the past 30 years from virtually all sites in the Front Range of the<br />
13/11/2007 Final<br />
28
<strong>Orange</strong> IWRMP<br />
Task 7: Environment<br />
Maloti and also from sites within a few kilometers of roads. The plant however still<br />
occurs in remote parts of eastern Lesotho where there are still thousands of plants.<br />
Plate 2.1: Spiral aloe (Aloe polyphylla)<br />
2.3.3 Fauna<br />
Although hunting and intensive agriculture have had disastrous impact on the larger<br />
wild mammal species, Lesotho, for its size and more importantly population<br />
distribution, still has an impressive biodiversity with 63 remaining mammal species,<br />
318 birds, 40 reptiles, 19 amphibians, 14 fish and 1279 recorded invertebrates, more<br />
than 100 of which are endemics. The state and impacts of the Lesotho fauna -<br />
mammals, birds, reptiles, amphibians, fish and invertebrates is discussed below.<br />
Mammals<br />
Present knowledge of Lesotho’s mammals is largely derived from Lynch (1994). His<br />
mammalian survey was based on 13 field trips made during the years 1988 to 1992.<br />
He recorded 52 mammal species and for each of them he provided a distribution map.<br />
Eleven additional mammal species, other than those recorded as historical mammals,<br />
were subsequently added to Lynch’s list by Ambrose (1999c). Three of these, the<br />
house mouse, the house rat and the feral domestic cat, may have been omitted by<br />
Lynch because of their close association with man. Other mammalian species in<br />
Ambrose List are the Brown Hyena (phiri), the Silver Jackal or Cape Fox (mopheme),<br />
the Antbear or Aardvark (thakali), the Cape Ground Squirrel, the South African<br />
13/11/2007 Final<br />
29
<strong>Orange</strong> IWRMP<br />
Task 7: Environment<br />
Hedgehog (tlhong), the Klipspringer (sekome), the Small Spotted Cat (qoabinyane)<br />
and the Natal Multimammate Mouse (lephoho).<br />
The overall Lesotho record has mammalian representatives of 11 orders and 26<br />
families. They could however be 27 families if the Springhare is, as suspected, also<br />
present in Lesotho. The Lesotho mammalian biodiversity complex compares well<br />
within Southern Africa as a whole as the region has a total of 15 orders, 2 of them are<br />
marine animals (Skinner and Smithers, 1990).<br />
Table 2-4: Mammals which are found in Lesotho’s checklist<br />
Extinct Vulnerable species Rare species Intermediate species<br />
mammals<br />
Quagga (H) African wild cat (R) S A hedgehog (R) Sciater’s golden mole (U)<br />
Blue antelope<br />
(H)<br />
Honey Badger (H) Aardwolf (H) Lesueur’s hairy or wing-gland<br />
bat (R)<br />
Antbear (S) Brown hyena (S) Winton’s (=De Winton’s) Longeared<br />
bat (S)<br />
Oribi (R)<br />
Leopard (R)<br />
White-tailed mouse<br />
(U)<br />
Caracal (S)<br />
Hippopotamus (H)<br />
Blue duiker (H)<br />
Red duiker (H)<br />
A=Abundant, C=Common, U=Uncommon, R=Rare, S=Single record, H=Historical<br />
Source: NES, 2000<br />
The state of the Lesotho mammals may best be assessed in the regions Red Data<br />
Listing (Table 2.4). The Red Data Book is a convenient mechanism by which public<br />
and scientists are alerted to the status of threatened species of animals. The South<br />
African mammal Red Data Book assesses mammals which are threatened in South<br />
Africa and it includes mammals found in Lesotho.<br />
Birds<br />
Overall, Lesotho has 340 recorded bird species represented by 21 orders and 61<br />
families. Historically, there were 23 orders and 65 families of birds in Lesotho.<br />
Records show that up to 16 bird species that occurred in Lesotho prior to 1940 could<br />
be extinct (Osborne, 1992). This could be due to many factors but the most important<br />
is habitat destruction. The Lesotho bird complex is a complement of the Southern<br />
African bird complex where there is a total of 26 orders and 91 families (Maclean,<br />
13/11/2007 Final<br />
30
<strong>Orange</strong> IWRMP<br />
Task 7: Environment<br />
1993). However, 143 out of the 340 bird species recorded for Lesotho, 42% of the<br />
total have been recorded less than 10 times, and amongst these are 22 species which<br />
are purely historical, i.e. there have been no records during the past 50 years. Fifty-six<br />
other species have not been recorded during the past 15 years. The best known red<br />
data bird is the bearded vulture (Plate 2.2).<br />
Plate 2.2: Bearded vulture<br />
Although a number of records from the distant and more recent past are of vagrants<br />
which never became established in Lesotho, a significant number of species have<br />
vanished because of habitat loss. Amongst these are grassland species such as the<br />
Ostrich and various species of Crane and Bustard. Changes in agricultural practice<br />
and animal husbandry, as well as the extinction of most antelope species have led to<br />
the loss of other species such as the Redbilled Oxpecker. On the other hand,<br />
increasing numbers of trees in towns and woodlots have provided opportunities for<br />
new species, as the Redbreasted Sparrowhawk (which hunts from tree cover) and<br />
species of Barbet, notably the Blackcollared and Crested Barbets (which nest in holes<br />
in trees and have recently become established in Lesotho). Some other species such<br />
as the European Starling and Indian Myna are newest additions to Lesotho territory as<br />
part of their migrations throughout the subcontinent. Six areas in the Maloti have been<br />
designated Important Bird Areas (Barnes, 1998) because of their importance as<br />
nesting or foraging areas for local and migratory birds.<br />
Infrastructure developments can also provide unforeseen opportunities for birds as in<br />
some cases wild fauna advantageously exploit them. The Cape Weaver normally<br />
depends on trees for building its intricate hanging nests but in the early 1980’s, these<br />
13/11/2007 Final<br />
31
<strong>Orange</strong> IWRMP<br />
Task 7: Environment<br />
birds were seen building their nests on electricity wires on the line crossing the Maloti<br />
from Maseru to Thaba Tseka. It was thus able to establish itself in new areas where it<br />
had previously been unable to breed because of lack of trees.<br />
The bald Ibis or Southern Bald Ibis (mokhotlo) was once regarded as ‘vulnerable’<br />
species is endemic to Lesotho, South Africa and Swaziland and has made a<br />
remarkable comeback. The status of many birds is however precarious in Lesotho and<br />
the adjacent territory in South Africa. The Cape Vulture is an increasingly threatened<br />
species and today there are no breeding colonies remaining in the Free State. Table<br />
2.5 shows the red data checklist of birds found in Lesotho.<br />
There are six officially designated Important Bird Areas (IBA) in Lesotho (Barnes<br />
1998). The IBAs have been chosen on the basis of ecosystems enabling the<br />
habitation of the Cape Vulture Gyps coprotheres. Owing to the homogeinity of much<br />
of the Lesotho’s highlands landscape, the Cape Vulture breeding colonies have been<br />
used as a skeleton for IBA selection, so that 64% of Lesotho’s breeding Cape Vultures<br />
fall within an IBA. The six IBAs- Liqobong in Northern Lesotho, Upper Senqu <strong>River</strong> in<br />
the North-Eastern Lesotho, Mafika Lisiu in North-Western Lesotho, the Sehonghong<br />
and Matebeng and Sehlabathebe National Park both in Eastern Lesotho and the<br />
Upper Quthing Valley in Southern Lesotho cover 216 805 ha or 7.15% of Lesotho’s<br />
land area.<br />
Table 2-5: Red Data Book Checklist of bird species occurring in Lesotho<br />
Vulnerable Species<br />
Rare Or Near-<br />
Threatened<br />
Species<br />
Of<br />
Special<br />
Concern<br />
Bald Ibis (C) Bearded Vulture (U) Wattled<br />
Crane<br />
(R)<br />
Intermediate Species<br />
Black stock (U)<br />
Cape Vulture(U) Black Harrier (U) South African Longclawed Lark<br />
(=Rudd’s Lark) (S)<br />
Lesser Kestrel (C)<br />
Yellowbreasted Pipit (U)<br />
Drakensberg Siskin<br />
(C)<br />
Ground<br />
Woodpecker (C)<br />
Mountain Pipit (C)<br />
<strong>Orange</strong>breasted<br />
Rockjumper (C)<br />
A=Abundant, C=Common, U=Uncommon, R=Rare, S=Single record, H=Historical<br />
Source: NES, 2000<br />
13/11/2007 Final<br />
32
<strong>Orange</strong> IWRMP<br />
Task 7: Environment<br />
Reptiles<br />
There has not been any reptile survey in Lesotho comparable to those undertaken for<br />
mammals and birds. However, systematic reptile surveys have only taken place in the<br />
Lesotho Highlands <strong>Water</strong> project Phase 1A and Phase 1B areas, as well as<br />
downstream from the Mohale dam site along the Senqunyane and Senqu <strong>River</strong>s. The<br />
summary Table 2.6 shows a large number of species for which there has so far been<br />
no authenticated record.<br />
Table 2-6: Checklist of Lesotho’s reptiles<br />
Reptile species status<br />
(1999)<br />
Abundant (A) 3<br />
Common (C) 11<br />
Uncommon (U) 1<br />
Rare (R) 16<br />
Single Record (S) 9<br />
Historical (H) 3<br />
TOTAL 43<br />
No Authenticated record (N) 19<br />
Number of<br />
species<br />
Amphibians<br />
There is no published survey of Lesotho amphibians but a Southern African Frog Atlas<br />
project to gather information on the state of the amphibians and to develop a checklist<br />
is being undertaken. There is a possibility that once the Atlas has been produced, the<br />
checklist for Lesotho will exceed 19 as new species maybe recorded particularly in the<br />
lowlands where previous surveys were not as extensive. A couple restricted species -<br />
the aquatic river frog and the Lesotho <strong>River</strong> frog may be noted. In any event, recorded<br />
amphibians for Lesotho are presented in Table 2.7. Lesotho has no newts or<br />
salamanders and all its amphibians belong to the single order Anura, which consists of<br />
frogs and toads. Overall, Lesotho has 19 known anuran species and for its size<br />
compares favourably with approximately 98 species in South Africa and some 1600<br />
species worldwide.<br />
13/11/2007 Final<br />
33
<strong>Orange</strong> IWRMP<br />
Task 7: Environment<br />
Table 2-7: Checklist of Lesotho amphibians<br />
Amphibian Species Status<br />
(1999)<br />
Abundant (A) 6<br />
Common (C) 2<br />
Uncommon (U) 4<br />
Rare (R) 5<br />
Single Record (S) 2<br />
Historical (H) -<br />
TOTAL 19<br />
No Authenticated record (N) 9<br />
Number of<br />
species<br />
Fish<br />
Although worldwide the number of fish species outnumber any other vertebrate<br />
species, Lesotho has a limited number of fish species. The country’s terrain coupled<br />
with poor land management systems and practices have all but driven fish stocks out.<br />
Additionally, the <strong>Orange</strong>-Vaal river system is relatively low in species diversity as it<br />
effectively has just 13 indigenous species, of which 8 species have been recorded in<br />
Lesotho. The best known Lesotho endemic fish species is shown in Plate 2.4.<br />
Apart from the eight indigenous fish species, five species have been introduced; the<br />
common Carp (found in both dams and rivers; and also is farmed commercially in fish<br />
ponds on a small scale), small and wide mouth bass (introduced into Lowlands dams<br />
as part of the nutrition improvement programme) , rainbow and brown trout (introduced<br />
into the Lesotho higlands and now found in the Katse Dam). The checklist of Lesotho<br />
fish species status is presented in Table 2.8.<br />
Red Data Book species occurring in the Lesotho are the endangered species, Maloti<br />
Minnow (U) and rare/intermediate species, Rock Catfish/Rock Barbel (Plate 2.5).<br />
13/11/2007 Final<br />
34
<strong>Orange</strong> IWRMP<br />
Task 7: Environment<br />
Plate 2.3: Maloti minnow (Pseudobarbus quathlambae)<br />
Amongst the two red data book species, the Maloti Minnow is Lesotho’s only known<br />
true endemic vertebrate species. The fish was first discovered in the headwaters of the<br />
Mkhomazana in Kwazulu-Natal (NES, 2000), but was subsequently feared extinct. It<br />
was rediscovered at Sehlabathebe in Lesotho in November 1970. The Maloti Minnow<br />
has subsequently been found to occur in the headwaters of a number of Lesotho<br />
<strong>River</strong>s. Apparently, the survival of the Maloti Minnow is dependent upon the<br />
preservation of the structural integrity of our river systems. On the Senqunyane <strong>River</strong>,<br />
the Semonkoaneng waterfall, 3.5 km downstream from the Mohale Dam, prevents<br />
other fish species from migrating upstream. The Maloti Monnow is consequently the<br />
only species found in the upper Senqunyane and its tributaries. The creation of the<br />
Mohale Reservoir and the possibility of trout being introduced through the tunnel<br />
connecting Mohale and Katse reservoirs are threats to the continued existence of the<br />
Maloti Minnow.<br />
The Rock Catfish (Austroglanis sclateri), although rare downstream in the <strong>Orange</strong>, has<br />
been found to be fairly common in Lesotho. It is considered to be the best indicator<br />
species for instream flow requirements (IFR) need when designing future water<br />
projects even in the Lesotho Highlands <strong>Water</strong> Project.<br />
13/11/2007 Final<br />
35
<strong>Orange</strong> IWRMP<br />
Task 7: Environment<br />
Plate 2.4: Rock catfish (Austroglanis sclateri)<br />
Table 2-8: Checklist of Lesotho fish.<br />
Fish Species Status<br />
(1999)<br />
Abundant (A) 1<br />
Common (C) 8<br />
Uncommon (U) 5<br />
Rare (R) -<br />
Single Record (S) -<br />
Historical (H) -<br />
TOTAL 14<br />
Number of species<br />
Invertebrates<br />
Lesotho has 1279 recorded invertebrate species composed of 835 genera, 242<br />
families and 45 orders. The South African Red Data Book lists butterfly Species and<br />
Lesotho records are included. The list include the Rare species; Torynesis pringlei,<br />
Lepidochrysops loewensteini, Lepidochrysops oosthuizeni and Metisella syrinx. The<br />
Pringle’s Widow, Torynesis pringlei, was discovered in 1977 at Ha Rafolatsane, is a<br />
Lesotho endemic and has since also been found in Sehonghong valley in Mokhotlong<br />
District.<br />
2.4 Impacts of Dams on Lesotho<br />
Broadly speaking an impoundment will impact on (a) the part of the river basin that is<br />
flooded, i.e. upstream of the dam wall; (b) the immediate area surrounding the dam; (c)<br />
the rest of the river downstream of the dam; (d) and any river basin that is linked to the<br />
dam through a transfer system such a tunnel or a pipeline.<br />
Land and water are ecologically linked in a natural system called a catchment. From<br />
the smallest droplet to the mightiest river, water works to shape the land, carrying with<br />
it sediment and dissolved materials downstream (in most cases) to the sea. <strong>River</strong>s are<br />
13/11/2007 Final<br />
36
<strong>Orange</strong> IWRMP<br />
Task 7: Environment<br />
a product of the land they drain; their shape, size, composition and flow are<br />
determined by the types of rocks, soils and vegetation through which they flow. In<br />
each watershed land and water are tied together in unique patterns going back millions<br />
of years, together supporting a complex web of life.<br />
When these ties between the land and the river are broken by a large dam, the<br />
consequences are felt throughout the watershed. Of all the ways to tamper with or<br />
harm a river, a large dam usually has the most immediate and far-reaching<br />
environmental impacts because of the huge changes it causes to river hydrology - the<br />
very circulation system of the watershed. Some 40,000 large dams, most of which<br />
were built in the past 50 years, now obstruct the world's rivers. More than 400,000<br />
square kilometres - an area 13 times the size of Lesotho - have been inundated by<br />
dams worldwide, sometimes with devastating social and environmental consequences.<br />
In order to limit the damage caused by dams it is important to understand the type of<br />
changes an impoundment brings to a river and all the associated life forms. In this<br />
section we look at the most immediate of these. First we consider the likely<br />
environment impacts dam construction that takes place before the water can be<br />
impounded and which may have to be endured for many years, depending on the size<br />
of the dam.<br />
2.4.1 Changes upstream<br />
As soon as water is impounded two things happen: first, the speed at which it flows is<br />
immediately changed as it is transformed from a moving body (‘lotic’) into a still one<br />
(‘lentic’). Second, as the water accumulates it becomes deeper and deeper, forming<br />
different layers or ‘substrata’. Still, deep water is very different from shallow, moving<br />
water. As the water gets deeper it become colder and has less oxygen, conditions that<br />
are not easily tolerated by life forms. Equally important as it slows it is no longer able to<br />
carry small particles of silt (sediment) with it and these slowly drops to the bottom of<br />
impoundment. At the same time these the impounded water, at the warmer up levels,<br />
can encourage the growth of planktons and aquatic plants not usually found in running<br />
water.<br />
By trapping silt dams deprive downstream deltas and estuaries of materials and<br />
nutrients that help to make them productive ecosystems. By filtering out woody debris<br />
they reduce habitats and nutrients that sustain food chains.<br />
The changes in flow, temperature, sediment and oxygen levels result in changes to<br />
water chemistry. In deep water the concentrations of metals (iron, manganese) and,<br />
13/11/2007 Final<br />
37
<strong>Orange</strong> IWRMP<br />
Task 7: Environment<br />
sometimes gasses ( hydrogen sulphide and methane) can be increased. At the upper<br />
levels or surface of the dam nutrients and oxygen stimulate the growth of plants and<br />
algae, accumulate during warm periods.<br />
The amount of sediment that gathers upstream of a dam will be influenced by many<br />
factors, including land use, climate, topography, erodability of soil, rainfall and runoff.<br />
Generally speaking, dams which are constructed in a dominant geology of basalt (such<br />
as the Malibamatšo) will have less sediment than those constructed in a dominant<br />
geology of sandstone watersheds. The river channel of the Mohokare <strong>River</strong> has a<br />
sediment bed, weirs have been inundated with silt and the Welbedacht Dam<br />
downstream of Lesotho has lost 80% to 90% of its storage capacity because of<br />
sedimentation. This section rather on its own our should be with issues relating to<br />
water abstraction from a river.<br />
Not surprisingly the changes brought about by a dam can have profound implications<br />
for the flora and fauna that once depended on a flow river. The increase in algae can,<br />
for example, be toxic to fish. However, within the impoundment certain species of<br />
exotic fish (such as trout) are likely to respond positively to the new environment, and<br />
are quite likely to out-compete local species. This may be of some benefit to local<br />
people or other fishermen, whose catch may increase.<br />
Local species can decline rapidly because, unlike introduced (exotic fish), they usually<br />
require minimum temperatures and depend on ‘special events’ (such as annual floods)<br />
to trigger spawning (the release of eggs). In still water these are not experienced, so<br />
the local fish may no longer produce. Equally important, the dams change the<br />
availability and type of foods that local fish depend on, notably plankton, drifting<br />
invertebrates and fauna found on the bottom of river beds.<br />
Dams are also a physical barrier to any fish migrations, which are often essential for<br />
breeding. Katse Dam, for example, prevents any upstream migration of the Small<br />
Mouth Yellow Fish, which may eventually reduce their number in the Malibamatšo<br />
upstream of Katse. Indeed, globally dams are the main reason that 20% of the world’s<br />
freshwater fish are endangered as they have disrupted migration routes, fragmented<br />
the habitats, and greatly reduced the quantity of nourishing silts flowing onto nursery<br />
areas in floodplains. However, a new dam may attract waterfowl, including migratory<br />
species, which are likely to increase.<br />
13/11/2007 Final<br />
38
<strong>Orange</strong> IWRMP<br />
Task 7: Environment<br />
2.4.2 Impacts to the area around a dam<br />
A recent concern in Southern Africa is reservoir-induced seismic activity, which has<br />
occurred as the result of filling of Katse Reservoir in Lesotho. Current predictions<br />
estimate that seismic events associated with major dams could continue and may<br />
reach magnitude 4 to 4.5 on the Richter Scale. Any earthquake damage to transfer<br />
tunnels and other infrastructure could have severe effects on water supply, and would<br />
present a potential threat to human life and damage property.<br />
The most immediate post construction impact on the local human settlements is the<br />
flooding of a wide variety of buildings and natural resources, some of which may not<br />
be immediately evident. While houses, kraals, graves fields, range lands and trees<br />
can be measured relatively easily it is much harder to assess the loss of shrubs,<br />
medicinal plants, wild vegetables, thatching grass, reeds, river sand, stream crossings<br />
and baptismal sites to inundation (see ‘Social Impact’ and ‘Compensation’ sections for<br />
more details). Equally important are the possible health impacts that a large body of<br />
water is likely to have. Although Lesotho is fortunate not to have many of waterrelated<br />
diseases that plague warmer parts of Africa there are concerns (such as the<br />
increase in certain vectors) that need to be taken into account.<br />
2.4.3 Changes downstream<br />
In the case of the Lesotho Lowlands <strong>Water</strong> Scheme the main objective is to<br />
store/supply water for transfer to needy areas. However, if any dam is used for<br />
hydroelectric power careful consideration will have to be given to the impacts<br />
downstream, as discharges from such reservoirs tend to be highly variable, usually<br />
resulting from the requirements for hydroelectric power and not related to natural<br />
cycles. Flow below hydroelectric dams can rapidly alter from almost standing water to<br />
torrential flows and water depth, velocity, oxygen concentration, temperature,<br />
suspended solids, pollutants and chemical composition can change in a very short<br />
period of time.<br />
By holding back the natural flow of water dams have a profound impact on the river<br />
and all the life forms it supports downstream of the impoundment. In a most extreme<br />
case, if all the water in a river was to be held back, a formerly living environment could<br />
effectively become a long linear desert. Assessing the more likely impacts of reduced<br />
flow is a complex task because the different life forms are so dependent on each other.<br />
13/11/2007 Final<br />
39
<strong>Orange</strong> IWRMP<br />
Task 7: Environment<br />
One of the first attempts to assess all the likely impacts of reduced flow took place in<br />
Lesotho, under the auspices of LHDA (Lesotho Highlands Development Authority). In<br />
brief these can be summarised as follows:<br />
A).<br />
Biophysical Impacts<br />
The main impacts under this heading relate to: streambed geomorphology (the shape<br />
of the river bed), sedimentology, water quality, vegetation, macroinvertebrates, fish,<br />
amphibians, mammals and birds. Very briefly we consider each of these in turn.<br />
Under geomorphology, the scientists noted that the river bed is likely to have<br />
increased sediment. This is because as the speed at which the river flows is reduced<br />
so is its capacity to carry sediment away. As a result the sediment sinks to the river<br />
bed and river pools will decline in depth and number. Small islands can be formed that<br />
encourage the growth of reeds resulting in the rivers flow path changing which can<br />
further result in flooding such as of agricultural lands and houses.<br />
<strong>Water</strong> quality will deteriorate due to the increase in the total suspended sediments as<br />
well as an increase in the mean temperature, both of which are factors affecting fish<br />
and other living organisms. Where river flows include untreated or insufficiently treated<br />
effluent (as for example downstream from factory estates) the reduced river flow will<br />
obviously result in higher levels of pollution.<br />
The larger dry bank zone of trees and shrubs will be reduced but in the aquatic zone<br />
algae and reeds will increase. Sedges and grasses will also increase, some of which<br />
may be beneficial to livestock and people.<br />
The aquatic insects balance will change, with undesirable increases in disease<br />
carrying snails and some blackfly species.<br />
Fish will generally be very severely affected, except for the <strong>Orange</strong> <strong>River</strong> Mudfish,<br />
which is a bottom feeder grazing on algae and organic debris. This is the one species<br />
which will probably increase, although obviously not if the flow regime results in a river<br />
drying up altogether.<br />
There will be probably some decline in river species of frogs such as the Common<br />
<strong>River</strong> Frog, while species capable of living in polluted streams such as the Common<br />
Platanna, will multiply.<br />
Mammals and birds which depend on river fauna (fish and amphibians) for food will<br />
generally be adversely affected. This reduced flow will impact on some species of<br />
kingfisher, duck and heron, but in the case of the Cape Clawless Otter, which depends<br />
13/11/2007 Final<br />
40
<strong>Orange</strong> IWRMP<br />
Task 7: Environment<br />
very largely on eating crabs, reduced river flow might in some areas reduce and in<br />
other areas increase its opportunities to survive.<br />
B).<br />
Social Impacts<br />
The riparian zones of the highland rivers are typically used by villagers on a daily basis<br />
for grazing animals, growing crops, catching fish and harvesting reeds, thatching<br />
grass, grass for handicrafts, wild vegetables, trees, medicinal plants and sand. A<br />
decreased river flow can both decrease and increase available resources. For<br />
example, there may some increase in reeds which flourish in slow moving water that is<br />
not subjected to sudden flooding. However, in most cases, resources used by people<br />
will be reduced by reduced flow.<br />
It was noted that rivers are also used for leisure activities, baptism, casual drinking<br />
(particularly during severe droughts when springs have dried up), for watering animals<br />
and for washing clothes and washing motor vehicles. In most of these cases a reduced<br />
or absent river flow has obviously serious effects in curtailing activities. On the other<br />
hand, communications across a larger river may be facilitated by low flows, particularly<br />
in cases where children on one bank attend school on another bank. There should be<br />
less drownings of humans and animals. But improved communications across a river,<br />
particularly when it is an international boundary (such as the Tele, Makhaleng, Senqu,<br />
or Mohokare) also provide opportunities for transborder crime such as stock theft, with<br />
consequential ongoing feuds between communities on the two sides of the river.<br />
The report noted that stomach illnesses are generally expected to increase as a result<br />
of reduced river flows. Skin and eye diseases are also expected to increase. Amongst<br />
animal diseases likely to be adversely impacted by reduced river flows is Bluetongue<br />
Disease in sheep and goats. Stagnant backwaters and pools are a favorable habitat<br />
for the breeding Bluetongue vector gnats or midges.<br />
2.4.4 Minimising downstream impacts through an environment flow (IFR)<br />
The amount of water to be released is not the only factor to consider. In order to<br />
maintain minimal ecological condition downstream it is essential that water should be<br />
released in ways that mimic (as far as possible) natural patterns. For example, in<br />
order for fish to spawn, flooding is important as this acts as a trigger for new breeding<br />
cycles. Floods are also important to maintain certain habitats (by preventing the<br />
accumulation of sediment) and plant varieties. For this reason dams should be either<br />
be designed to allow for the release of large flows, or else should be situated upstream<br />
of large tributaries.<br />
13/11/2007 Final<br />
41
<strong>Orange</strong> IWRMP<br />
Task 7: Environment<br />
Earlier we pointed out the water in an impoundment is very different from that of<br />
moving river. <strong>Water</strong> that is released from the deeper levels of a dam will have a lower<br />
temperature, little oxygen and different chemistry from that in the river below. For this<br />
reason dams should also be designed to allow for water to be drawn off at various<br />
depths depending on where the best water quality is that is typical of the natural<br />
downstream quality – this statement is not totally true.<br />
Releasing water from a dam constructed directly on a river is one way of providing the<br />
required environment flow. Another way of doing this is by carefully situating dams off<br />
the main river channels, as is the case with the Maqalika Dam (Maseru’s main supply)<br />
which is situated off stream of the Caledon <strong>River</strong> (Mohokare – standardise on name)<br />
but draws water from it. This is the case with the dam that currently provides Maseru’s<br />
water supply; the Maqalika Dam is situated off stream of the Caledon <strong>River</strong> but draws<br />
water from it. Another way is situate dams upstream from major tributaries, so that the<br />
flow from these maintains what is required by the environment (this is one option for<br />
the proposed Metolong Dam on the South Phuthiatsana <strong>River</strong>).<br />
Whatever measures are put in place it is important to recognise that even the most<br />
successful environmental flow programme will only partially mitigate against the effects<br />
of a dam. Nothing is gained at no cost – if flow regimes are manipulated, the targeted<br />
rivers will change and there will be negative impacts. Society decides, pro-actively or<br />
through neglect, on the extent of that change and degree of the impacts. A pro-active<br />
approach offers the opportunity of minimising negative impacts and optimising positive<br />
ones.<br />
Once decisions are made regarding the preferred options for the Lesotho Lowlands<br />
Scheme it will be necessary to carry out an environmental flow assessment for each<br />
river to be damned. However, it is also likely that some of the information already<br />
generated for the Lesotho Highlands <strong>Water</strong> Project could be used to good effect,<br />
particularly that for the sites situated on the middle and lower Senqu <strong>River</strong>. Indeed, for<br />
any water resource developments on the mainstream of the Senqu, Senqunyane or<br />
Malibamatso <strong>River</strong>s, relevant environmental flow studies have been completed and,<br />
provided permission to use the data were forthcoming from LHDA, they would require<br />
relatively little updating and adjustment for use in the Lesotho Lowlands study.<br />
2.4.5 Changes through Interbasin <strong>Water</strong> Transfers<br />
Dams are often built so that water can be transferred from a river basin where there is<br />
adequate water to a basin where there is not enough water to meet the needs of the<br />
13/11/2007 Final<br />
42
<strong>Orange</strong> IWRMP<br />
Task 7: Environment<br />
population in the latter basin, as is the case with the LHWP where water is transferred<br />
from basins that feed the Senqu into one that feeds the Vaal <strong>River</strong>. The invariable<br />
result of such transfers is that both the river that is damned (the donor river) and the<br />
river that receives the transferred water (the recipient river) lose their natural flow<br />
patterns. This can have serious environmental impacts, unless carefully managed.<br />
The characteristics of the recipient river will change according to the way in which the<br />
water is released into it. If the flows are much higher and faster than was previously<br />
the case this can result in rapid erosion in the recipient river system.<br />
Dams slow the flow of rivers and in doing so they prevent sediment (fine particles of<br />
soil and other matter) from being carried down stream. The water that is released,<br />
either downstream of the dam or into the recipient river through an IBT, is usually<br />
sediment free. The clear water moves more freely and rapidly, causing more erosion<br />
than would have been the case had the river maintained its sediment. The result can<br />
be a transformation of the bed of the river as its shape and character are changed.<br />
International experience shows that some vegetation along the recipient river or<br />
upstream from dams will respond to being flooded (inundation) with prolific growth, e.g<br />
willows, other exotic trees and various aquatic plants. Further, as water is taken out of<br />
the donor river some grasses, weeds and poisonous plants are likely to respond by<br />
growing vigorously as waters recede. In some cases this increased growth may be<br />
beneficial (e.g. increased grazing areas), but in many cases this growth is not<br />
desirable (e.g. increased poisonous plants).<br />
If the water levels of the recipient river rise significantly some vegetation types will<br />
experience severely reduced growth rates, or will be killed as a result of the prolonged<br />
inundation. Examples include grasses and most small plants. Even some native tree<br />
species that grow on edge of rivers (riparian varieties) can be killed if completely<br />
inundated for prolonged periods.<br />
A major concern associated with IBTs is the transfer of water quality problems from<br />
donor to recipient catchments. The damning of the donor river changes the water<br />
chemistry of the river by preventing its flow. Transfers in South Africa have been<br />
shown to increase levels of sodium, magnesium, potassium, calcium, sulphate and<br />
chloride. In the Western Cape there have been cases of fish being affected by<br />
chemicals transferred from one basin to another.<br />
13/11/2007 Final<br />
43
<strong>Orange</strong> IWRMP<br />
Task 7: Environment<br />
<strong>Water</strong> transferred from a dam could have a combination of low temperatures and low<br />
levels of oxygen and this would have a detrimental consequences for the various life<br />
forms living in the recipient river, particularly fish.<br />
Certain aquatic insects that inhabit the gravel layers (substratum) of rivers bed can be<br />
seriously impacted by changes in flow resulting in reduced sediment and increased<br />
erosion. As the gravel habitats are destroyed by faster moving water the number of<br />
aquatic insects will decline, as will the number of fish that depend on them.<br />
As water is transferred from one basin to another so are the various life forms<br />
inhabiting the water. In particular, the transfer of phytoplankton, a microscopic<br />
potential food source for invertebrates, facilitates dispersion of species, including<br />
unwanted “nuisance” species, predators, fish diseases and parasites. In the cases of<br />
LHWP there are concerns that trout may be able to cross from the Katse Dam (on the<br />
Malibamatšo <strong>River</strong> basin) through the tunnel to Mohale Dam (on the Senqunyane<br />
basin), thus threatening the survival of the rare Maluti Minnow.<br />
In other words, an important consequence of water transfers is the transfer of diseases<br />
and disease vectors between catchments, or the creation of habitats which are<br />
suitable for the establishment of pests which pose threats to humans and animal<br />
health. For example, as rivers are regulated black fly, an irritating pest of both cattle<br />
and humans, is likely to increase.<br />
IBTs may impact on soil, water logging and groundwater levels as there is evidence<br />
that if water is transferred from one basin to another by way of an unlined transfer<br />
canal this may have impacts on the groundwater in areas adjacent to the canal.<br />
The motivation behind the transfer of water is to provide water to human communities<br />
in order to improve quality of life, or to facilitate further municipal, agricultural, or<br />
industrial development. However, many of the ecological effects of IBT’s will have<br />
detrimental impacts on socio-economic, cultural and political aspects of these human<br />
communities. In some cases, the health of individuals or communities may be affected.<br />
The transferring of water from one basin to another involves tunnels or pipelines. The<br />
main problem associated with tunnels is dealing with the rock and other material that is<br />
extracted from underground.<br />
Pipelines built transfer water can also result in environmental impacts, most of which<br />
can be identified in the environmental impact assessment and mitigated through an<br />
Environmental <strong>Management</strong> <strong>Plan</strong> (see section on Impacts on national heritage for<br />
more details). The impacts of pipelines vary according to whether the pipeline is on the<br />
13/11/2007 Final<br />
44
<strong>Orange</strong> IWRMP<br />
Task 7: Environment<br />
surface or underground. Surface impacts are mitigated by the choice of the best<br />
environmental and economical routing, avoiding, where possible, urban and suburban<br />
settlements, water courses, environmentally sensitive areas and sensitive landscapes<br />
(erosion areas).<br />
In the case of water transported the only major possible impacts after construction<br />
would be associated with a high pressure pipe burst or leak. A water pipe leak can<br />
result in human health risks, flooding of property, erosion and undermining of homes.<br />
If the pipeline is within a residential area a servitude of a certain distance is required by<br />
legislation to reduce the risks associated with potential pipeline breakages. Access<br />
roads and servitudes need to be as far as possible coordinated with existing servitudes<br />
and roads so as to reduce the impacts of building new roads (such as dust, soil<br />
erosion, safety etc). Spill prevention and emergency response plan are important for a<br />
pipeline if it passes under or over major roads or within urban areas. The construction<br />
impacts of a pipeline are short lived relative to the “lifetime” of the pipeline. If<br />
appropriate rehabilitation (EMP) of a buried pipeline is undertaken (top soil replaced<br />
etc) then the long term environmental impacts are minimal.<br />
2.4.6 Impacts of Dams on species diversity on Lesotho<br />
The effects of large dams have also played a role in threatening Lesotho’s biodiversity.<br />
The effects of large dams on Lesotho’s biodiversity was studied when considerations<br />
for the instream flow requirements of LHWP dams were undertaken. The study<br />
predicted that there would be dense algal growths throughout the system, which can<br />
be toxic to fish. Additionally, the study predicted that the encroachment of exotic plants<br />
at the expense of native plants and the species that depend on them would be severe.<br />
Further the study showed that there would be moderate to critically severe increases<br />
of blackfly and other pest populations that would prey on livestock. Other effects of the<br />
dam on the natural resources were reductions in most fish populations, with some<br />
species like the Maloti minnow and trout reaching the point of extinction, declines in<br />
waterfowl and an explosion in rodent populations, which could affect crops along the<br />
riverbanks. Indicative effects were that these changes to the ecosystem will have<br />
major social impacts as many fish and wild vegetable species will be reduced by over<br />
50 % (www.irn.org, 29/11/02).<br />
13/11/2007 Final<br />
45
<strong>Orange</strong> IWRMP<br />
Task 7: Environment<br />
3 ENVIRONMENTAL ISSUES IN SOUTH AFRICA<br />
3.1 Introduction<br />
The <strong>Orange</strong> <strong>River</strong> basin is the largest river basin in South Africa with a catchment area<br />
of more than 1 million km 2 of which almost 600 000 km 2 is within the Republic (Figure<br />
3.1). This catchment covers nearly 50% of the country. The basin incorporates portions<br />
of six of the nine provinces in South Africa as well as three neighboring states namely<br />
Namibia, Lesotho, and Botswana. It stretches 2 300 km from the source to the ORM at<br />
Oranjemund and Alexander Bay where it discharges into the Atlantic Ocean.<br />
The <strong>Orange</strong> <strong>River</strong> is of great importance to South Africa since the natural flow<br />
represents more than 22% of the country's surface water resources. The natural water<br />
resources of the <strong>Orange</strong> <strong>River</strong> basin are estimated to be in the order of 12 000 million<br />
m 3 /annum, although less than half of the available water is currently abstracted by<br />
various developments in the <strong>Orange</strong> and Vaal basins.<br />
The Vaal <strong>River</strong>, which is the main tributary of the <strong>Orange</strong> <strong>River</strong>, provides water to the<br />
Vaal <strong>River</strong> Supply Area. This supply area is the economic powerhouse of South Africa,<br />
producing approximately 60 % of the national GDP. Several major strategic industries,<br />
numerous large mines and most of the country's power stations are located within its<br />
boundaries. As a result of the growing water demands in the area, particularly in the<br />
Gauteng Province (due to population growth and improving living standards), water<br />
must be transferred from various parts of the country where water resources are more<br />
plentiful and demands relatively small. Several transfer schemes already exist but<br />
even these are no longer sufficient to supply the growing demands for water from the<br />
rapidly increasing urban population and associated economic activity in the area. As a<br />
result, the Lesotho Highlands <strong>Water</strong> Project was proposed and the first of five possible<br />
phases has been complete (Phase 1 and b). This scheme transfers water from the<br />
upper reaches of the <strong>Orange</strong> <strong>River</strong> to the Vaal <strong>River</strong> basin. Obviously, such a large<br />
transfer of water from the upper reaches of the <strong>Orange</strong> <strong>River</strong> will have a significant<br />
influence on the water availability further downstream and therefore influences the<br />
supply capabilities of the ORP.<br />
The general topography of the <strong>Orange</strong> <strong>River</strong> rises in the Lesotho Highlands on the<br />
eastern Drakensberg plateau at an altitude of about 3 300 m above mean sea level.<br />
The <strong>Orange</strong> <strong>River</strong> flows through four of the five seasonal rainfall regions. Upstream of<br />
the Gariep Dam summer is the rainy season and the rains come ever later in the<br />
13/11/2007 Final<br />
46
<strong>Orange</strong> IWRMP<br />
Task 7: Environment<br />
summer in a downstream direction, until from the Fish <strong>River</strong> confluence downstream<br />
there is winter rain, if any.<br />
The mean annual precipitation (MAP) is 1 800 mm at the source of the <strong>Orange</strong> <strong>River</strong> in<br />
Lesotho. The upper section of the <strong>Orange</strong> experiences an average annual rainfall of<br />
greater than 400 mm, while the MAP is below 400 mm in the middle and lower <strong>Orange</strong><br />
<strong>River</strong>. This is less than half the world average of 860 mm per annum (DWA&F 1986).<br />
Average yearly rainfall is between 400 mm and 200 mm from Vanderkloof Dam to<br />
Boegoeberg Dam and the rainfall declines the further west the river flows until it is less<br />
than 50 mm per annum. In the Namaqaland sub-section of the river the rainfall is<br />
erratic and provides less than 1% of the flow of the <strong>Orange</strong> <strong>River</strong> .<br />
A major factor in the South African water cycle is that the mean annual evaporation<br />
(MAE) often exceeds the MAP, and the <strong>Orange</strong> <strong>River</strong> catchment is no exception. In<br />
the upper <strong>Orange</strong> the MAE from surface waters is relatively low (1 400 mm and 2 200<br />
mm). However, evaporation increases as the river runs westwards towards the desert<br />
region on the West coast, with the estimated average evaporative loss downstream of<br />
Vanderkloof Dam being about 14% of MAR. The MAE peaks at between 2 000 mm<br />
and 2 400 mm from above Boegoeberg Dam to upstream of Vioolsdrif and then<br />
declines slightly towards the coast. In the Namaqualand section of the river, the<br />
evaporation exceeds rainfall by a factor of 25:1, creating the desert region typical of<br />
that section.<br />
The <strong>Orange</strong> <strong>River</strong> Project (ORP) was first proposed in 1961 to irrigate thousands of<br />
hectares in the Eastern Cape, Northern Cape and Free State areas. It currently utilises<br />
the two largest storage dams in South Africa, namely the Gariep Dam (commissioned<br />
1971) and the Vanderkloof Dam (commissioned 1976, formerly known as the Hendrik<br />
Verwoerd and the PK le Roux Dams respectively). These two dams form the main<br />
storage elements of the ORP with a combined capacity in excess of 8 500 million m 3 .<br />
<strong>Water</strong> is transferred to the Eastern Cape through the 80 km <strong>Orange</strong>-Fish Tunnel from<br />
the Gariep Dam, while the Riet <strong>River</strong> valley is supplied with water from the Vanderkloof<br />
Dam via the <strong>Orange</strong>-Riet Canal. Details of the main reservoirs and weirs in the <strong>Orange</strong><br />
<strong>River</strong> are indicated in Table 3.1.<br />
Presently the main functions of the <strong>Orange</strong> <strong>River</strong> Project are to:<br />
• provide water for irrigation and urban users along the <strong>Orange</strong> <strong>River</strong>;<br />
• provide irrigation water to the fertile, but water deficient, Great Fish and<br />
Sundays <strong>River</strong> valleys in the Eastern Cape;<br />
13/11/2007 Final<br />
47
<strong>Orange</strong> IWRMP<br />
Task 7: Environment<br />
• provide irrigation water to areas in the Riet <strong>River</strong> catchment;<br />
• to alleviate water quality problems in the Vaal <strong>River</strong> at Douglas<br />
• to provide water for mining (Skorpion and zinc mines in Namibia);<br />
• to generate peak clipping hydro-power to the Eskom network from the hydropower;<br />
and<br />
• supply water for urban use to cities and many small towns including<br />
Bloemfontein, Botshabelo, Upington, Prieska, Springbok, Kleinsee, Rosh<br />
Pinah, Oranjemund, Port Elizabeth, Grahamstown, Alexander Bay and Port<br />
Nolloth.<br />
Table 3-1: Details of main reservoirs and weirs on the <strong>Orange</strong> <strong>River</strong><br />
Name of reservoir <strong>River</strong> Purpose Capacity (M m 3 )<br />
Gariep <strong>Orange</strong> Irrigation/hydropower 5 348<br />
Vanderkloof <strong>Orange</strong> Irrigation/hydropower 3 189<br />
Welbedacht Caldedon Urban water supply 20<br />
Knellpoort Rietspruit Urban water supply 137<br />
Boegoeberg <strong>Orange</strong> Irrigation 21<br />
The Gariep and Vanderkloof dams are no longer sufficient to supply the growing<br />
demands for water from the rapidly increasing urban population and associated<br />
economic activity in the area. As a result, the Lesotho Highlands <strong>Water</strong> Project was<br />
proposed and the first of five possible phases has been completed to transfer water<br />
from the upper reaches of the <strong>Orange</strong> <strong>River</strong> to the Vaal <strong>River</strong> basin. Obviously, such a<br />
large transfer of water from the upper reaches of the <strong>Orange</strong> <strong>River</strong> will have a<br />
significant influence on the water availability further downstream and therefore<br />
influences the supply capabilities of the ORP.<br />
3.2 Flow Changes in <strong>Orange</strong> <strong>River</strong><br />
The hydrology of the <strong>Orange</strong> <strong>River</strong> basin is discussed in more detail in Task 4 (Surface<br />
Hydrology).<br />
The Gariep and Vanderkloof Dams, which fall in the Upper <strong>Orange</strong>, are the two largest<br />
conventional hydropower installations in the country and they are also the two largest<br />
storage reservoirs in South Africa. Details of the main Reservoirs are provided in Table<br />
3.1.<br />
13/11/2007 Final<br />
48
<strong>Orange</strong> IWRMP<br />
Task 7: Environment<br />
Another major inter-water management area transfer of water is from the Gariep Dam,<br />
via the 80 km long <strong>Orange</strong>-Fish Tunnel, to the Fish and Tsitsikamma water<br />
management area, while a significant portion of the yield is also released along the<br />
river for use in the Lower <strong>Orange</strong> water management area as well as by Namibia. In<br />
total, close to 70% of the yield released in the Upper <strong>Orange</strong> water management area<br />
and Lesotho together, is used in other water management areas.<br />
A major impact on the water management area is by the Lesotho Highlands <strong>Water</strong><br />
Project. South Africa and Lesotho have only committed to Phase 1 of the Lesotho<br />
Highlands Project but the treaty between the countries allows for a further phase with a<br />
maximum diversion capacity of 2 200 million m 3 per year (Figure 1.3). Other joint<br />
current investigations are to further developments in the Caledon <strong>River</strong> catchment,<br />
which extends over the Lesotho Lowlands and parts of the catchment in South African<br />
territory, which will have an effect on the lower Caledon and the Upper <strong>Orange</strong> water<br />
management area.<br />
The development of 8 000 ha new irrigation for the purposes of rural development,<br />
poverty relief and settlement of emerging farmers has in principle been sanctioned by<br />
the Minister of <strong>Water</strong> Affairs & Forestry. While these developments are likely to be<br />
located in the Lower <strong>Orange</strong> and Fish to Tsitsikamma water management areas, the<br />
water will have to be sourced from the Upper <strong>Orange</strong> water management area. Other<br />
priorities are for urban and industrial use in Bloemfontein/Botshabelo and for<br />
augmenting supplies to the Port Elizabeth area (Fish to Tsitsikamma water<br />
management area). Additional water for use by Namibia may also have to be released<br />
from the Upper <strong>Orange</strong> water management area, via the Lower <strong>Orange</strong> water<br />
management area (Figure 1.4).<br />
Draining the Highlands of Lesotho, the Senqu <strong>River</strong> contributes close to 60% of the<br />
surface water associated with the Upper <strong>Orange</strong> water management area, at the point<br />
where it enters South Africa to become the <strong>Orange</strong> <strong>River</strong>. The climate varies<br />
considerably over the region, and rainfall ranges from over 1000 mm per year in the<br />
foothills of the mountains, to as little as 400 mm per year in the region of Vanderkloof<br />
Dam (DWAF, 2002).<br />
These conflicts will make the task of environmental management increasingly complex<br />
in the years ahead.<br />
Influence of the Phase 1 of the Lesotho Highlands Scheme on the flows at Oranjedraai<br />
upstream of the study area is relatively small at present. If further phases of the<br />
13/11/2007 Final<br />
49
<strong>Orange</strong> IWRMP<br />
Task 7: Environment<br />
Lesotho Highlands Scheme are fully developed however the influence would be<br />
critical. The influence of the Lesotho Highlands Scheme at Gariep Dam inflow is<br />
negligible at present (DWAF, 1998a). The proposed IFR releases from the Katse Dam<br />
will increase the natural seasonal flows in the river once Lesotho Highlands<br />
Development Agency has accepted these recommendations.<br />
It is estimated that the demand for water from the <strong>Orange</strong> <strong>River</strong> will increase by 27.4%<br />
(343.6 million m 3 /a to 473.3 million m 3 /a) from 1994 to 2030. The main increase in<br />
demand is as a result of urban area growth predicted (DWAF, 1998b).<br />
The <strong>Orange</strong> <strong>River</strong> Mouth (“ORM”) is one of very few areas of sheltered shallow water<br />
along southern Africa’s arid Atlantic coastline, and a site considered important primarily<br />
for sustaining substantial numbers of waterbirds, including an appreciable number of<br />
Red Data-listed species such as the Cape Cormorant, Damara Tern and Hartlaub’s<br />
Gull. In recognition of this exceptional ecological significance, the ORM was<br />
designated a Wetland of International Importance in terms of the Ramsar Convention<br />
on Wetlands in 1991. When Namibia designated its portion of the ORM a Ramsar site<br />
in 1995, it created the potential for this wetland to become the first jointly managed<br />
transfrontier Ramsar site in southern Africa.<br />
As a result of severe deterioration of the mouth’s general condition, and especially the<br />
salt-marsh component, the ORM has continued to deteriorate subsequent to its<br />
designation as a Ramsar site. This has resulted in the South African portion of the<br />
ORM being placed on the Ramsar Convention’s Montreux Record, which lists wetlands<br />
in need of urgent conservation action.<br />
The real issue is that relatively little has been done over the years since the salt marsh<br />
degradation began to remedy the situation. The State has failed to ensure compliance<br />
to the Minerals Act and the provisions of the Ramsar convention. The mining company<br />
has not rehabilitated in an appropriate manner, the conservation authorities have been<br />
ineffectual (mainly due to land ownership issues) and even the environmental lobbyists<br />
have failed to alert the world to the environmental damage that has been done.<br />
The causes of the environmental degradation of the <strong>Orange</strong> <strong>River</strong> Mouth and<br />
especially the salt marsh are many and varied. Some of the impacts are directly<br />
associated with the mining activities whilst others occur thousands of kilometres<br />
upstream as a result of water demands for irrigation and hydro-power (see section<br />
3.2.1).<br />
13/11/2007 Final<br />
50
<strong>Orange</strong> IWRMP<br />
Task 7: Environment<br />
3.2.1 Impacts on flow<br />
If the flows in the upper <strong>Orange</strong> <strong>River</strong> (Weir D1H003 <strong>Orange</strong> <strong>River</strong> at Aliwal North<br />
Upstream of Gariep Dam) over the past 5 years are compared to the flows up to 1998,<br />
the following trends can be seen (Figure 3.1 and 3.2):<br />
• The mean monthly flows recorded at each site are similar for both periods<br />
• Higher maximum flows were recorded before 1998<br />
• There is a seasonal summer maximum for both time periods<br />
• The flows from 1998 to 2003 indicate a slightly flatter seasonal flow regime<br />
• There are flow releases from most of the dams all year round (winter Eskom<br />
requirements) (Heath, 2004).<br />
These data indicate that the current water demands and transfers are similar for both<br />
the periods studied. Furthermore data indicate flow deliveries to South Africa that the<br />
Lesotho Highlands <strong>Water</strong> Scheme has not had a marked effect on the flows of the<br />
<strong>Orange</strong> <strong>River</strong> at Oranjedraai over the past 5 years. If and when the Katse Dams’ IFR<br />
releases are activated the flows into South Africa will mimic the natural hydrograph<br />
and have a minimal impact on the flow delivers to South Africa (Heath, 2004).<br />
D1H003.1959-1998<br />
2000<br />
AVERAGE MONTHLY FLOW (MILLION CUBES)<br />
1600<br />
1200<br />
800<br />
400<br />
0<br />
-400<br />
OCT DEC<br />
NOV<br />
JAN<br />
FEB<br />
APR<br />
MAR MAY<br />
JUN<br />
JUL<br />
AUG<br />
SEPT<br />
±Std. Dev.<br />
±Std. Err.<br />
Mean<br />
MONTHS<br />
Figure 3-1: Box and whisker plots of the average monthly flows for weir D1H003<br />
for the period 1959 to 1998<br />
13/11/2007 Final<br />
51
<strong>Orange</strong> IWRMP<br />
Task 7: Environment<br />
D1H003.1998-2003<br />
2800<br />
AVERAGE MONTHLY FLOW (MILLION CUBES)<br />
2200<br />
1600<br />
1000<br />
400<br />
-200<br />
-800<br />
OCT NOV DEC JAN FEB MAR APR MAY JUN<br />
JUL AUG SEP<br />
±Std. Dev.<br />
±Std. Err.<br />
Mean<br />
MONTH<br />
Figure 3-2: Box and whisker plots of the average monthly flows for weir D1H003<br />
for the period 1999 to 2003<br />
The observed flow data from D7H008 (Zeekoebaart-Upington) in the <strong>Orange</strong> <strong>River</strong><br />
were converted to monthly data, divided into c. 10-year periods and analysed for:<br />
(Figures 3.3 and 3.4)<br />
• MAR and Seasonal distribution; and<br />
• Seasonal index.<br />
There has been a gradual decline in the MAR of the river over the period of record<br />
(Figure 3.3). The seasonal distribution of flows (monthly averages) for each ten-year<br />
period is provided in Figure 3.4.<br />
13/11/2007 Final<br />
52
<strong>Orange</strong> IWRMP<br />
Task 7: Environment<br />
Figure 3-3: MAR for 10-Year Periods of the Observed Records from D7H008<br />
Figure 3-4: Seasonal Distribution of Flows (Monthly Averages) for Each 10-Year<br />
Period<br />
Before 1960 there was little damming of the river and the flow regime was natural.<br />
This was marked by strong floods that occurred in the wet summer months, peaking in<br />
March, which alternated with periods of very low flow during the dry winter months<br />
inland. The <strong>Orange</strong> <strong>River</strong> Mouth (ORM) intermittently closed up in August and<br />
September, due to the action of long shore movement of beach sands and settling out<br />
of river sediments at the mouth. This alternating flow pattern gave rise to a very<br />
dynamic system that was most pronounced at the ORM. This pattern included scouring<br />
out of sediments and flushing of the whole area during floods, and slowing down of the<br />
system during the dry season with increases in salinity at the mouth when it closed.<br />
13/11/2007 Final<br />
53
<strong>Orange</strong> IWRMP<br />
Task 7: Environment<br />
With the construction of dams during the late 1960s and early 1970s this flow pattern<br />
have been changed from a 82:18 summer to winter distribution to a 59:41 summer to<br />
winter distribution pattern. This is well illustrated in Figure 3.5 (Boegoeberg Dam),<br />
which shows a reduction in flow variation following impoundments, but no change in<br />
long-term, wet-dry cycles.<br />
350<br />
300<br />
250<br />
200<br />
150<br />
100<br />
50<br />
0<br />
January<br />
February<br />
March<br />
April<br />
May<br />
June<br />
July<br />
August<br />
September<br />
October<br />
November<br />
December<br />
cubic m/s<br />
1933 - 1966<br />
1977 - 1994<br />
Figure 3-5: Mean monthly flows measured at Boegoeburg Dam before and after<br />
upstream dam regulation.<br />
One of the major challenges facing river management worldwide is the allocation of<br />
compensation flows, which not only satisfy the water demands of downstream users,<br />
but also maintain the river as a viable and healthy ecosystem.<br />
3.3 <strong>Water</strong> Quality Changes<br />
A detailed assessment of the water quality issues in the <strong>Orange</strong> <strong>River</strong> Basin can be<br />
seen in Task 9.<br />
The quality of surface water in the Upper <strong>Orange</strong> <strong>River</strong> was considered good,<br />
particularly for water that flow from the Highlands of Lesotho in the Senqu <strong>River</strong>. The<br />
Upper <strong>Orange</strong> <strong>River</strong> is a turbid system (approximate turbidity 232NTU). The Gariep<br />
and Vanderkloof Dams act as sediment traps (DWAF 1999). <strong>Water</strong> in the Caledon<br />
<strong>River</strong> is naturally of high turbidity and carries a concerning high sediment load.<br />
The water quality trends for pH clearly indicate a false trend with the pre 1998 values<br />
being significantly different to the post 1998 values (Figure 3.6). The difference is due<br />
to the analytical methods that were used by DWAF’s analytical laboratories changing<br />
13/11/2007 Final<br />
54
<strong>Orange</strong> IWRMP<br />
Task 7: Environment<br />
consequently no trend can be determined. All that can be said is that all the values of<br />
pH recorded in the <strong>Orange</strong> <strong>River</strong> are alkaline.<br />
There are no turbidity values on the DWAF database that we received but the<br />
electrical conductivity values can be used to determine this trend (Figure 3.7). The<br />
graph indicates that the Gariep and Vanderkloof dams act as sediment sinks as the<br />
electrical conductivity values are lower below these dams. The sodium, magnesium<br />
and Sodium Absorption Ratio (SAR) values indicate an increasing trend down the river<br />
(Heath 2004). These trends are due to the influence of return flows of irrigated lands<br />
down the river.<br />
8.6<br />
pH BEFORE AND AFTER 1998<br />
8.2<br />
pH (pH UNITS)<br />
7.8<br />
7.4<br />
7.0<br />
6.6<br />
D1H005B D1H009B D1H003B D3H013B D3H012B D3H008B<br />
D1H005A D1H009A D1H003A D3H013A D3H012A D3H008A<br />
WEIRS<br />
±Std. Dev.<br />
±Std. Err.<br />
Mean<br />
Figure 3-6: Box and whisker plots of pH for the different weirs before and after<br />
1998 (B = before 1998; A = After 1998)<br />
13/11/2007 Final<br />
55
<strong>Orange</strong> IWRMP<br />
Task 7: Environment<br />
32<br />
ELECTRICAL CONDUCTIVITY BEFORE AND AFTER 1998<br />
ELECTRICAL CONDUCTIVITY (mS/m)<br />
28<br />
24<br />
20<br />
16<br />
12<br />
8<br />
D1H005B D1H009B D1H003B D3H013B D3H012B D3H008B<br />
D1H005A D1H009A D1H003A D3H013A D3H012A D3H008A<br />
WEIRS<br />
±Std. Dev.<br />
±Std. Err.<br />
Mean<br />
Figure 3-7: Box and whisker plots of electrical conductivity concentration for the<br />
different weirs before and after 1998 (B = before 1998; A = After 1998)<br />
If the mean nutrients values (Kjeldahl-N, nitrate and nitrite and ammonia) are<br />
compared down the <strong>Orange</strong> <strong>River</strong> the following can be concluded (Heath 2004):<br />
• Kjeldahl- N values are reduced down the river from Oranjedraai<br />
• Ammonia and nitrate and nitrite values show a marked increase below Gariep<br />
dam hereafter then reduce gain to Marksdrift<br />
• The irrigation return flows impact on salinity is managed by water blending<br />
and water quality management process (DWAF 2003).<br />
The Upper <strong>Orange</strong> <strong>River</strong> could be classified as mesotrophic with algal blooms<br />
occurring occasionally in the dams. Four algal families are mostly present in the Upper<br />
<strong>Orange</strong> <strong>River</strong> namely Cyanobacteria, Bacillariophyceae, Chlorophyceae and<br />
Euglenophyceae (Venter, 2000).<br />
13/11/2007 Final<br />
56
<strong>Orange</strong> IWRMP<br />
Task 7: Environment<br />
3.4 Trajectory of Change in <strong>Orange</strong> <strong>River</strong><br />
The main reasons for the predicted trajectory are:<br />
• Reduction in short interval flow variability through interception by dams<br />
and constant releases. Weirs are causing abnormal pools and are intercepting<br />
small-scale flow variations.<br />
• Marked decrease in summer flows (primarily November to March);<br />
• Marked decrease in magnitude of inter-annual floods – due to flood<br />
attenuation in the system and especially Gariep and Vanderkloof Dams.<br />
• Increase in summer flows (primarily July and August).<br />
• Reduction in water clarity as algal blooms increase from nutrient<br />
enrichment.<br />
• Reduction in scouring of sand as floods are reduced (captured in dams).<br />
• Reduction in the extent of the river channel through vegetation invasion<br />
and increased trapping of sediments.<br />
• Reduction in channel flood retention capacity as the riverbank and<br />
floodplain vegetation is removed, and levees installed, thereby cutting of<br />
access to area that would normally absorb floodwaters.<br />
• Increase in agricultural activity invading the riparian zone (illegally?).<br />
• Increase in Phragmites beds, which are invading into the river channels and<br />
into the Drybank vegetation.<br />
• Increase in fine sediment loads from soil erosion from agriculture.<br />
• Increase in runoff of salt laden (from fertilizers) irrigation water to the river<br />
during lowflows, which negatively affects the Aquatic and Wetbank<br />
communities.<br />
• Increase in erosion where the vegetation along the banks is disturbed.<br />
• Increase in the use of fire to “control” Phragmites invasion.<br />
• Increase in exotic plants as disturbance increases and controls are not<br />
implemented. These plants interfere with the functioning of the indigenous<br />
vegetation and some utilize more water than indigenous species. They<br />
increase biomass and thus temperatures during fires, thereby increasing the<br />
damage done by fires.<br />
13/11/2007 Final<br />
57
<strong>Orange</strong> IWRMP<br />
Task 7: Environment<br />
3.5 Habitat Integrity of Upper <strong>Orange</strong> <strong>River</strong><br />
An assessment on the Habitat Integrity of the Upper Vaal gives a good indication of<br />
the typical changes in the <strong>Orange</strong> <strong>River</strong> (Heath et al, 2004).<br />
3.5.1 Instream Habitat Integrity<br />
The most prominent modification to the instream habitat of the <strong>Orange</strong> <strong>River</strong> is the<br />
channel, bed and flow modification as a result of Gariep and Vanderkloof Dams. Some<br />
abstraction of water for irrigation also has an influence on the flow and water quality in<br />
the river. The upper reach of the <strong>Orange</strong> <strong>River</strong> (from Lesotho border to Kraai/<strong>Orange</strong><br />
confluence) is relatively natural with some modification due to abstraction and erosion<br />
in its catchment area. The middle and lower reaches (from Kraai/<strong>Orange</strong> <strong>River</strong><br />
confluence to Vanderkloof Dam) is critically modified as a result of flow regulation.<br />
<strong>Water</strong> is also released from Gariep Dam for Hydroelectric power generation and these<br />
sporadic releases result in the deterioration of the biota in the river.<br />
The Instream Habitat Integrity Class of the Upper <strong>Orange</strong> <strong>River</strong> varies from a Class B<br />
in Reach 1, Class C in Reach 2 and Class E in Reach 3. The deterioration in Instream<br />
Habitat of the <strong>Orange</strong> <strong>River</strong> from Class C (Reach 2) to E in Reach 3 is the result of the<br />
regulation of flow by Gariep and Vanderkloof Dams. (Figures 3.6 and 3.9)<br />
3.5.2 Riparian Habitat Integrity<br />
Small patches of exotic vegetation occur in the riparian zone of all the reaches of the<br />
Upper <strong>Orange</strong> <strong>River</strong>. Weeping willow (Salix babylonica) and poplars are present along<br />
the whole stretch of the <strong>Orange</strong> <strong>River</strong>. Overgrazing and erosion in the riparian zone of<br />
especially the southern banks of reach 1 has a small to moderate effect on the habitat.<br />
The inundation of the riverbanks by Gariep and Vanderkloof Dams is the largest<br />
modifier of riparian habitat in the Upper <strong>Orange</strong> <strong>River</strong>.<br />
The Riparian Habitat Integrity of the Upper <strong>Orange</strong> <strong>River</strong> is a Class B for Reach 1 & 2<br />
and Class D in reach 3 (Figures 3.8 and 3.9).<br />
13/11/2007 Final<br />
58
<strong>Orange</strong> IWRMP<br />
Task 7: Environment<br />
Figure 3-8: Habitat Integrity for Riparian and Instream habitats for segments of<br />
the Upper <strong>Orange</strong> <strong>River</strong><br />
RIPARIAN AND INSTREAM INTEGRITY<br />
100<br />
90<br />
80<br />
IHI Score<br />
70<br />
60<br />
50<br />
40<br />
30<br />
20<br />
10<br />
0<br />
Riparian Habitat<br />
Instream Habitat<br />
Class A<br />
Class B<br />
Class C<br />
Class D<br />
Class E<br />
1<br />
4<br />
7<br />
10<br />
13<br />
16<br />
19<br />
22<br />
25<br />
28<br />
31<br />
34<br />
37<br />
40<br />
43<br />
Segments<br />
Figure 3-9: Index of Habitat Integrity scores for Upper <strong>Orange</strong> <strong>River</strong><br />
13/11/2007 Final<br />
59
<strong>Orange</strong> IWRMP<br />
Task 7: Environment<br />
3.6 Ecological Consequences of Flow Changes<br />
3.6.1 Conservation of representative ecosystems<br />
There are still parts of the <strong>Orange</strong> <strong>River</strong> in reasonably natural condition which<br />
represent ecosystem types not conserved elsewhere. Areas of particular conservation<br />
importance include:<br />
• Archaeological sites near the confluence with the Vaal <strong>River</strong>.<br />
• Representative example of <strong>Orange</strong> <strong>River</strong> Broken Veld veld type between<br />
Prieska and Boegoeberg.<br />
• Undeveloped floodplains downstream of Kanoneiland.<br />
• Undeveloped floodplains downstream of Blouputs.<br />
• The gorge downstream of Augrabies Falls.<br />
• The Falls at Onseepkans.<br />
• The Richtersveld National Park.<br />
• Archaeological sites at Arrisdrift and Daberas.<br />
• The estuary.<br />
3.6.2 Species conservation<br />
Barbus hospes, the fish found only in the <strong>Orange</strong> <strong>River</strong> downstream of Augrabies<br />
Falls, is a known species which should be considered of special conservation<br />
importance. Within the distribution range of B. hospes, geographically isolated<br />
populations of two fish species, Mesobola brevianalis and Barbus trimaculatus, occur.<br />
These two species are of considerable interest for they may provide evidence of an<br />
ancient link between the drainages of the Okavango system and the <strong>Orange</strong>. Should it<br />
become necessary to develop a dam in the lower <strong>Orange</strong> <strong>River</strong>, the conservation of<br />
these species would best be served by preserving as long an uninterrupted stretch of<br />
the lower river as possible. For example, siting the dam as near the estuary as<br />
possible could do this. The only other thus far recognised endemic species is a<br />
blackfly, Simulium gariepense. The impact of present development on S. gariepense<br />
would, from the little data, available, appear to have resulted in a decline in the<br />
abundance of the species, without the species disappearing over the approximately 20<br />
years that the river has been regulated.<br />
3.6.3 Loss of species diversity<br />
The review of available information has shown that loss of species diversity has taken<br />
place in the riparian vegetation, which is highly modified in many places. This cannot<br />
13/11/2007 Final<br />
60
<strong>Orange</strong> IWRMP<br />
Task 7: Environment<br />
be directly ascribed to development of the water resources of the river. Its importance<br />
lies in the fact that river reaches with natural riparian vegetation are limited and<br />
considered to be of conservation importance. Impacts of proposed new dams on areas<br />
with natural riparian vegetation have to betaken into account. Due to electric power<br />
generation (that is between Gariep and Vanderkloof Dams and below Vanderkloof<br />
Dam for some 200 km) loss of species diversity is severe. The river immediately below<br />
Vanderkloof has been described above as an ecological desert. The creation of further<br />
"ecological deserts" would not be desirable. They would be unacceptable in parts of<br />
the river of particular conservation importance.<br />
3.6.4 Conservation of the river estuary<br />
The <strong>Orange</strong> <strong>River</strong> estuary has been ranked as the sixth most important coastal<br />
wetland in South Africa. It is an important resting site on the migration route of many<br />
aquatic bird species. However, recent studies show significant damage to the wetland<br />
due to reduced flow reach the mouth as well as construction a track on the northern<br />
edge.<br />
3.6.5 Reed encroachment<br />
<strong>Report</strong>s note that reed encroachment of the channel in the middle reaches of the<br />
<strong>Orange</strong> <strong>River</strong> has been considerable, subsequent to the regulation of flow by the<br />
Gariep and Vanderkloof Dams. It is regarded as undesirable for several reasons which<br />
have been described earlier. It has been considered that reed control may be achieved<br />
through flow regulation, though this remains to be proved in the <strong>Orange</strong> <strong>River</strong>.<br />
3.6.6 Blackfly increase<br />
The Team has identified reports showing that flow regulation has been accompanied<br />
by the appearance of major outbreaks of Simulium chutteri, which have resulted in<br />
annual losses to livestock farmers estimated at R 33 million along an 800 km stretch of<br />
the river. As in the case of reed encroachment, these outbreaks are ascribed to the<br />
artificial flow regime and it is considered that other flow regimes may contribute to their<br />
amelioration.<br />
3.6.7 Loss of water through evaporation<br />
Evaporation from the surface of water bodies is one of the major causes of water loss<br />
and, if large enough, can have severe economic implications. As mentioned earlier,<br />
the Lower <strong>Orange</strong> <strong>River</strong> passes through a region, which has high evaporation and low<br />
rainfall. To ensure that evaporation is kept to a minimum, man-made lakes in this<br />
13/11/2007 Final<br />
61
<strong>Orange</strong> IWRMP<br />
Task 7: Environment<br />
region should have a high depth to surface area ratio. Annual evaporative losses for<br />
the river below the Vanderkloof Dam were estimated by BKS and Stewart Scott (1993)<br />
to be as much as 800 million m3. This figure will increase with every new reservoir on<br />
the <strong>Orange</strong> <strong>River</strong>.<br />
3.6.8 Soil and water salinity<br />
Although water quality is dealt with in detail by another task, the Environment Team<br />
has noted that salinisation of irrigated soils will lead to greater salt loads on the river,<br />
ultimately to the point where quality may be impaired and the uses of the water<br />
restricted. It may be predicted that the salt load from the Vaal <strong>River</strong> will increase and<br />
should be taken into account in the siting of future dams.<br />
3.6.9 Sediment transport<br />
Sediment yield is highest in the upper <strong>Orange</strong> catchment. Because of the silt retention<br />
capacity of the two major dams in the <strong>Orange</strong>, silt and sediment loads in the lower<br />
<strong>Orange</strong> have been considerably reduced. Sediment yield potential in the lower <strong>Orange</strong><br />
is low, and it is unlikely that any reservoirs in this area will silt up quickly. This is an<br />
issue favouring the siting of new dams in the lower river. Severe soil erosion in<br />
Lesotho, especially in the Caledon system, is contributing factor.<br />
3.6.10 Turbidity<br />
Studies note that the <strong>Orange</strong> <strong>River</strong> is a turbid river. The growth of benthic algae and<br />
phytoplankton, which include important nuisance organisms, is limited by light<br />
availability which is restricted by the turbidity. New dams, or an increase in the salinity<br />
of the water (with which flocculation and sedimentation of suspended solids is<br />
associated), or both factors acting together, could reduce the turbidity allowing blooms<br />
of algae and phytoplankton.<br />
3.6.11 <strong>Water</strong> temperature<br />
Dams modify the temperature regime of downstream rivers. Broadly speaking in winter<br />
they release warmer water than occurred in the unregulated river and in summer they<br />
release cooler water. The range of variation of temperature over a 24-hour cycle is<br />
reduced below dams. A changed temperature regime has profound impacts on the life<br />
of rivers and can result in conditions totally unsuitable for certain organisms. In the<br />
<strong>Orange</strong> <strong>River</strong> the temperature regime is likely to be modified for some 130 to 180 km<br />
downstream of Vanderkloof Dam.<br />
13/11/2007 Final<br />
62
<strong>Orange</strong> IWRMP<br />
Task 7: Environment<br />
3.6.12 Conflicting demands<br />
In the <strong>Orange</strong> <strong>River</strong>, conflict arises between the:<br />
• demands of agriculture,<br />
• generation of hydro-electricity,<br />
• demands for mining,<br />
• international obligations (increased demands in Namibia); and<br />
• environmental requirements (instream flow requirements, Reserve allocation)<br />
3.7 Macroinvertebrates in Lower <strong>Orange</strong> <strong>River</strong><br />
The invertebrates in the lower <strong>Orange</strong> <strong>River</strong> are largely modified due to the<br />
overwhelming and persistent abundance of filter-feeders, in particular the pest<br />
proportion numbers of the blackfly, Simulium chutteri. The large-scale programme to<br />
control this pest, using aerial applications of insecticides, highlights the extent of the<br />
problem (Palmer, 1997). The outbreaks are attributed to stable flow conditions, in<br />
particular high winter flows, deterioration in water quality and encroachment of<br />
instream vegetation. These changes are explained as follows:<br />
High winter flows. High winter flows allow over-wintering of larval blackfly<br />
populations. Larvae that develop in winter are significantly larger and carry larger fat<br />
reserves than larvae that develop in warm temperatures. As water temperatures rise in<br />
spring, the winter larvae pupate, and the adults that emerge carry large fat reserves<br />
and are suspected to be able to lay their first batch of eggs without the usual need for<br />
a blood meal. These eggs hatch and the larvae develop quickly because of warmer<br />
water temperatures. By the time they emerge as adults, the first generation of winter<br />
adults are still alive, and this leads to an overlapping of generations, which leads to<br />
rapid increases in population size (i.e., pest outbreaks). Under natural conditions this<br />
occurred from time to time, but not persistently every year.<br />
<strong>Water</strong> quality. Deterioration in water quality has provided ideal conditions for filterfeeding<br />
invertebrates. The deterioration is partly attributed to the construction of dams,<br />
which allow the developments of micro-algae not normally associated with river<br />
systems. Increased clarity following impoundment has caused a shift in trophic status<br />
from a dominance of terrestrial-derived organic matter to a dominance of<br />
autochthonous primary production, and this has favoured filter-feeding invertebrates.<br />
Deterioration in water quality is also attributed to the decomposition and burning of<br />
13/11/2007 Final<br />
63
<strong>Orange</strong> IWRMP<br />
Task 7: Environment<br />
Phragmites reeds, which is likely to contribute significant quantities of fine particulate<br />
and dissolved organic material, upon which filter-feeding invertebrates feed. <strong>Water</strong><br />
quality is also likely to have deteriorated from agricultural return flows carrying elevated<br />
nutrients, particularly nitrates.<br />
Phragmites reeds. The encroachment of Phragmites reeds is a recent phenomenon<br />
related primarily to disturbance of riverbanks. Photographs taken as recently as 1976<br />
show an almost complete absence of reeds. There are sections of river, particularly in<br />
the lower reaches, where reeds are absent except where the bank is disturbed.<br />
Upstream of the estuary the riparian vegetation is dominated by the Cape willow (Salix<br />
mucronata), except at a pumping station, where Phragmites sp. are abundant. It is<br />
clear that Phragmites reeds are pioneer plants, quick to colonise disturbed areas. The<br />
extent of bank disturbance may be appreciated when one considers that almost the<br />
entire length of the river between Grootdrink and Kanoneiland (over 110 km) has been<br />
channelised. Reeds trailing in the current significantly increase the surface area<br />
available for blackfly larval attachment. It is likely therefore that the blackfly problem in<br />
the <strong>Orange</strong> <strong>River</strong> has been aggravated by reed encroachment, both because of the<br />
increased surface area for larval attachment, and because of the suspected increase<br />
in fine organic material. The rampant growth of reeds is also likely to have had a<br />
significant impact on particle retention.<br />
Vegetation. Floodplain developments have all but removed the floodplain vegetation<br />
in riparian areas near to Upington, Kakamas and Onseepkans. Similar activities are<br />
also in evidence at Raap and Skraap, but are not serious outside of these areas.<br />
Removal of this vegetation reduces the river’s buffer against nutrients and sediments<br />
being washed off the surrounding farmlands. In the heavily developed areas the<br />
effects of water abstraction are masked by mechanical damage to the riparian zone.<br />
Flow reductions and a more constant flow regime have contributed towards the spread<br />
of Phragmites reeds into the channel. Here again, management of the reed through<br />
burning has increased the damage to the riparian vegetation and promoted the<br />
occurrence of densely rooted reed beds.<br />
3.8 Conservation Areas in <strong>Orange</strong> <strong>River</strong><br />
3.8.1 National Parks<br />
The National parks within South Africa that occur within the <strong>Orange</strong> <strong>River</strong> catchments<br />
are indicated in Figure 3.10. These are:<br />
13/11/2007 Final<br />
64
<strong>Orange</strong> IWRMP<br />
Task 7: Environment<br />
Figure 3-10: National Parks of South Africa<br />
Kgalagadi Transfrontier Park<br />
Together with the adjacent Gemsbok National Park in Botswana, this park comprises<br />
an area of over 3,6 million hectares – one of very few conservation areas of this<br />
magnitude left in the world.<br />
Ai-Ais/Richtersveld Transfrontier National Park<br />
This is a harsh and unpredictable land where water is scarce and life-sustaining<br />
moisture comes in the form of early morning fog which rolls in from the cold waters of<br />
the Atlantic Ocean, sustaining a remarkable range of small reptiles, birds and<br />
mammals. A staggering assortment of plant life, some species occurring nowhere else<br />
in the world, is to be found here.<br />
Augrabies Falls National Park<br />
<strong>Water</strong> plummets 56m over the Augrabies <strong>Water</strong>fall into the <strong>Orange</strong> <strong>River</strong>. The Khoi<br />
people called it ‘Aukoerebis’, or place of Great Noise, as this powerful flow of water is<br />
unleashed from rocky surroundings characterized by the 18-km abyss of the <strong>Orange</strong><br />
<strong>River</strong> Gorge. The 28 000 hectares on both the northern and southern sides of the<br />
<strong>Orange</strong> <strong>River</strong> provide sanctuary to a diversity of species, from the very smallest<br />
succulents, birds and reptiles to springbok, gemsbok and the endangered black rhino.<br />
Golden Gate Highlands National Park<br />
Nestled in the rolling foothills of the Maluti Mountains of the north eastern Free State<br />
lies the Golden Gate Highlands National Park. This 11 600 hectares of unique<br />
13/11/2007 Final<br />
65
<strong>Orange</strong> IWRMP<br />
Task 7: Environment<br />
environment is true highland habitat, providing home to a variety of mammals – black<br />
wildebeest, eland, blesbok, oribi, springbok and Burchell's zebra - and birds, including<br />
the rare bearded vulture (lammergeier) and the equally rare bald ibis, which breed on<br />
the ledges in the sandstone cliffs.<br />
Vaalbos National Park<br />
The Vaalbos National Park is an extraordinary area along the Vaal <strong>River</strong> where wildlife<br />
such as roan antelope, black rhino, white rhino, buffalo, eland, red hartebeest and<br />
tsessebe are to be seen in the former heart of the alluvial diamond diggings near<br />
Kimberley.<br />
3.8.2 Transfrontier National Parks<br />
The Transfrontier National Parks that occur with the <strong>Orange</strong> <strong>River</strong> basin are indicated<br />
in Figure 3.11. For more details on these parks see Chapters 4 and 5.<br />
Figure 3-11: Trans frontier National Parks within the Vaal And <strong>Orange</strong> <strong>River</strong><br />
Catchment areas.<br />
3.8.3 Red data species<br />
The localities of the lists of Red data species of plants and animals that occur with the<br />
<strong>Orange</strong> <strong>River</strong> basin within South Africa can be found in Appendix B. The numbers of<br />
13/11/2007 Final<br />
66
<strong>Orange</strong> IWRMP<br />
Task 7: Environment<br />
red data fish that occur per province in South Africa and Lesotho is indicated in Table<br />
3.2.<br />
Table 3-2: List of red data species of fish per province in South Africa and<br />
Lesotho.<br />
Region<br />
Endemic freshwater fish<br />
Endangered<br />
Vulnerable<br />
Rare<br />
Endemic estuarine fish<br />
Endangered<br />
Vulnerable<br />
Rare<br />
Marginal freshwater fish<br />
Endangered<br />
Vulnerable<br />
Rare<br />
Marginal estuarine fish<br />
Endangered<br />
Vulnerable<br />
Rare<br />
Northern<br />
Cape /Free<br />
state<br />
Gauteng Lesotho Namibia<br />
1<br />
2<br />
2 2 1 3<br />
1<br />
6<br />
2<br />
2<br />
A gap analysis for river ecosystems was done (DEAT 2004) as part of the National<br />
Biodiversity Strategic Action <strong>Plan</strong>. The results tell us that most of South Africa’s river<br />
ecosystems are not protected at all.<br />
There are two important issues to note with respect to the gap analysis of river<br />
ecosystems:<br />
• Even if part of a river (incorporating one or more river-scape signatures) is<br />
well protected, impacts upstream on the same river may mean that the river’s<br />
biodiversity is not effectively protected.<br />
• <strong>River</strong>s are often used to delineate the boundaries of protected areas. About a<br />
third of the river signatures that are “protected” according to this analysis are<br />
actually on the boundaries of protected areas rather than inside them, and are<br />
thus not effectively protected.<br />
13/11/2007 Final<br />
67
<strong>Orange</strong> IWRMP<br />
Task 7: Environment<br />
3.9 National Heritage Sites<br />
A list of national Heritage sites is available per province in South Africa<br />
(www.sahra.org.za).<br />
In 1999 the National Monuments Act was replaced by the National Heritage <strong>Resources</strong><br />
Act, No. 25 of 1999.<br />
Section 58 of the National Heritage <strong>Resources</strong> Act stipulates inter alia that all heritage<br />
resources that were protected as national monuments in terms of the previous Act<br />
shall continue to be protected in terms of the new Act as provincial heritage sites. This<br />
is with the provision that within five years of the commencement of the new Act,<br />
provincial heritage resources authorities in consultation with the South African Heritage<br />
<strong>Resources</strong> Authority (SAHRA) must assess the significance of such sites and SAHRA<br />
must declare any place, which fulfils the criteria for Grade I status a national heritage<br />
site.<br />
13/11/2007 Final<br />
68
<strong>Orange</strong> IWRMP<br />
Task 7: Environment<br />
4 ENVIRONMENTAL ISSUES IN BOTSWANA<br />
4.1 Environmental Overview of the Molopo <strong>River</strong> Basin<br />
4.1.1 Location<br />
The Molopo <strong>River</strong> Basin (Nossop <strong>River</strong> Basin included), which forms part of the<br />
northern portion of the <strong>Orange</strong>-Senqu <strong>River</strong> Basin, is located in the southern part of<br />
Botswana with an area of approximately 71,000 square kilometers. Molopo and<br />
Nossop are the major rivers in the Basin and they form part of the international<br />
boundary with the Republic of South Africa.<br />
4.1.2 Geomorphology and Surface Drainage<br />
Relief<br />
The Molopo <strong>River</strong> Basin is located in the Kalahari, which is a large sand filled basin in<br />
the west of the southern African sub-continent, covering nearly one third of the area<br />
and forming what is probably the largest sand-veld area in the world (National Parks<br />
Board & Department of Wildlife and National Parks, 1997). The physical landscape of<br />
the area is generally flat to undulating. Spot height data from the Department of<br />
Geological Surveys, though limited in terms of spatial distribution, indicate that the<br />
highest point in the Basin is about 22 km to the northwest of Werda, with an elevation<br />
of 1522 meters above sea level. Generally, the relief of the Basin is relatively higher in<br />
the eastern and northern parts and it gently slopes southwestwards towards the<br />
Molopo <strong>River</strong>. The Maiphitwane-Gathwane-Ramatlabama area in the eastern part of<br />
the Basin has an elevation of about 1320 meters above sea level whereas the<br />
elevation along most parts of the Molopo <strong>River</strong> Valley ranges from about 1000 to 1100<br />
meters above sea level. The relief is lowest in the south-western area of the Basin. For<br />
instance the Molopo valley at Rappel’s Pan has an altitude of 850 meters above sea<br />
level, at distance of about 27 Km from the Molopo-Nossop <strong>River</strong> confluence.<br />
Sand dunes<br />
Sand dunes are found in the Molopo <strong>River</strong> Basin, just like in most other parts of the<br />
Kalahari environment, and they contribute to the undulating topography of the area<br />
(See Figure 4.2 and Plate 4.1). The sand dunes are aeolian depositional landforms<br />
though accounting for their development in terms of modern and ancient<br />
environmental conditions is still fraught with difficulty. Thomas and Shaw (1984)<br />
observe that this is a consequence of several factors, including the nature of the<br />
predominant dune types found in the Kalahari and the general question of the climatic<br />
13/11/2007 Final<br />
69
<strong>Orange</strong> IWRMP<br />
Task 7: Environment<br />
and atmospheric conditions conducive to their development, whether some of these<br />
dunes are currently geomorphologically active or relict features, and, in the case of the<br />
latter, considerable problem of dating the time of development. Thomas and Shaw<br />
classify the dunes of the Kalahari into 3 major dunefields namely Northern dunefield,<br />
Southern dunefield and Eastern dunefield. The Molopo <strong>River</strong> Basin falls in the<br />
Southern dunefield as shown in Figure 4.3. A summary of the dune types identified by<br />
Thomas and Shaw in the Kalahari is presented in Table 4.1.<br />
Over 90 per cent of the dunes in the Basin are linear, varying in height between 2<br />
meters to greater than 30 meters above the inter-dunes, with some of the highest<br />
dunes occurring immediately adjacent to the fossil valleys. The barchan dunes trend<br />
NNW whereas the seif dunes trend in NNE direction. Lunette dunes, which are<br />
crescent in shape, are often found on the south or south-south-western margins of<br />
pans in the Southern dunefield. Thomas and Shaw report that Hills (1940) observed<br />
that the lunette dunes and their associated pans share a common origin, with the<br />
location of the dune indicating the prevailing wind direction at the time of their<br />
formation.<br />
Table 4-1: A summary of the dune types present in the Kalahari<br />
Dune Type<br />
Location<br />
Linear dunes (general) All three Kalahari dunefields are dominated by linear dunes (est. 85 %<br />
of the southern dunefield where the Molopo <strong>River</strong> Basin is situated).<br />
These may be divided into linear ridges and seif dunes:<br />
Linear ridges<br />
Low degraded forms dominate the eastern and northern dunefields.<br />
Partially vegetated forms dominate the southern dunefield<br />
Seif dunes<br />
Transverse dunes<br />
(general)<br />
Barchan dunes<br />
Transverse ridges<br />
Parabolic dunes<br />
Lunette dunes<br />
Nested parabolics<br />
Blowouts<br />
Linear forms with sharp sinuous crests: present in the drier parts of<br />
the southern dunefield and where the vegetation of linear ridge crests<br />
has been destroyed e.g. around Bokspits area<br />
Within and beyond the western margin of the Makgadikgadi<br />
Depression:<br />
On the floor of Ntwetwe Pan<br />
West of the Gidikwe Ridge<br />
Southern dunefield and Bakalahari Schwelle:<br />
On downwind margins of pan depressions<br />
Isolated patches in southern dunefield, where vegetation cover is<br />
disturbed<br />
Widespread location, especially in the southern dunefield, where local<br />
vegetation disturbance has occurred. In some places, may evolve into<br />
parabolic and nested parabolic forms<br />
Source: Adopted from Thomas and Shaw (1984)<br />
13/11/2007 Final<br />
70
<strong>Orange</strong> IWRMP<br />
Task 7: Environment<br />
Linear pan in<br />
inter-dune valley<br />
Linear dune<br />
Figure 4-1: Linear Sand Dunes on a Landsat TM Satellite Image in the Kalahari<br />
Figure 4-2: Sand dunes encroaching into the Molopo Valley at Welewerdierd<br />
(Source: Roughton International, 2001)<br />
13/11/2007 Final<br />
71
<strong>Orange</strong> IWRMP<br />
Task 7: Environment<br />
Figure 4-3: The three Major Dunefields of the Kalahari Source: Adapted from<br />
Thomas and Shaw (1984)<br />
13/11/2007 Final<br />
72
<strong>Orange</strong> IWRMP<br />
Task 7: Environment<br />
Pans<br />
Pans are shallow depressions typical of arid and semi-arid environments with low relief<br />
and have been identified as an important component of the southern African<br />
landscape in areas with an annual rainfall of less than 500 mm per year, particularly<br />
where the surficial materials are either shales or unconsolidated sands (Thomas and<br />
Shaw, 1984). In the Molopo <strong>River</strong> Basin, pans of various shapes and sizes can be<br />
found in some parts of the area. The pans are spherical, oval, or elongated in shape.<br />
Linear-shaped (elongate) pans are usually found in inter-dunal valleys of linear sand<br />
dunes. Such pans can have a length of about 5km and a width of 1km, and are visible<br />
on satellite images and aerial photographs especially during rainy seasons when they<br />
may have water. In the Molopo <strong>River</strong> Basin, the elongated pans can be found in the<br />
areas with linear dunes such as to the west of Khakhea Village and in the western part<br />
of the Basin towards the Nossop <strong>River</strong>. Another common and distinctive type of pan in<br />
the region occurs in the Southern Kalahari and on the Bakalahari Schwelle, particularly<br />
between the settlements of Tshane, Kokong and Mabuasehube, around the Nossop-<br />
Molopo confluence and in the vicinity of the Nossop at Aminuis in Namibia (Thomas<br />
and Shaw, 1984). These pans are characterized by a sub-circular, sub-elliptical or<br />
kidney shape, and characteristically display one or more lunette dunes anchored to<br />
their southern or southwestern margin (See Figure 4.4).<br />
Figure 4-4: Lunette dunes on a Landsat TM Satellite Image in the Kalahari<br />
The pans commonly lack surface inflows, though short, poorly developed channels at<br />
times feed into them, supplying run-off to the pans during major rainfall events. The<br />
size of the pans in the area tends to range from 1 to 16 square kilometer, with depths<br />
up to 20 meters at times. Lancaster (1978) observes that the majority of the pans<br />
13/11/2007 Final<br />
73
<strong>Orange</strong> IWRMP<br />
Task 7: Environment<br />
occur in the Kalahari Sand, although where the sand cover is thin, as at Khakhaea and<br />
Mabuasehube, Karoo and Precambrian basement rocks may be exposed. The pans<br />
are also associated with the presence of calcrete, which tends to form a rim around the<br />
pan periphery, and may extend for several hundred meters beyond the pan<br />
depression. Silcretes sometimes occur on the pan surface, or within the calcrete<br />
surround, as a result of calcium replacement or by direct precipitation, while ferricretes<br />
are also present in the eastern Kalahari (Thomas and Shaw, 1984).<br />
Lancaster ascribes the formation of the pans to groundwater controlled aeolian<br />
deflation. The main phase of pan deepening is likely to be an in-situ process. The<br />
present day climate gives rise to sporadic pan flooding and evaporation in an<br />
environment in which chemical dissolution and reprecipitation might be expected.<br />
Wind erosion (deflation) of the fine-grained clays, salts and carbonates is likely to<br />
occur during each drying out phase.<br />
Surface Drainage<br />
The Southern Kalahari is dominated by a broad, featureless interfluve at 1000-1100<br />
meters above sea level, called the Bakalahari Schwelle (Thomas and Shaw, 1984).<br />
This separates the Middle Kalahari, with its endoreic drainage, from the Molopo <strong>River</strong><br />
and its tributaries, which used to drain to the <strong>Orange</strong> <strong>River</strong>, and subsequently into the<br />
Atlantic Ocean. Generally the Molopo <strong>River</strong> Basin is poorly endowed with surface<br />
water as a result of the arid and semi-arid climatic conditions that prevail in the area<br />
and the Kalahari sandy soils, which have poor water retention capacities. The Molopo<br />
and the Nossop <strong>River</strong>s are the major surface drainage features in the area. These<br />
rivers are ephemeral, flowing occasionally after heavy rainfall events. In the area, dry<br />
fossil river valleys which used to drain into the Molopo <strong>River</strong> in the past are found.<br />
These dry fossil river valleys are locally known as mekgacha (single: mokgacha).<br />
Thomas and Shaw argue that the Molopo <strong>River</strong> System, whose major valleys include<br />
the Molopo, Kuruman (in South Africa), Auob (in Namibia) and Nossop, represents a<br />
transitional stage between permanently dry mekgacha and the seasonal rivers typical<br />
of the semi-arid hardveld. All the 4 major river valleys rise on bedrock, and this is<br />
considered to contribute to their unusual hydrological regimes, which vary between the<br />
rivers. The Kuruman is reported to have the most reliable flow and at its upstream end<br />
is a perennial river, fed by a series of dolomite springs, including the famous Eye of<br />
Kuruman, which has yielded a constant 750m 3 per hour since at least 1820 (Thomas &<br />
Shaw, 1984). In most years the water rapidly percolates into the streambed a few<br />
kilometers downstream, but it may flow throughout the length of the river in high rainfall<br />
13/11/2007 Final<br />
74
<strong>Orange</strong> IWRMP<br />
Task 7: Environment<br />
years, in a channel of ‘sand river’ type. The Molopo <strong>River</strong> flows sporadically in its<br />
upper reaches, but the water does not proceed beyond <strong>Water</strong>’s End, between Werda<br />
and Tsabong. Beyond this point, the Molopo is reported to have typical mekgacha<br />
form, as do its tributaries in the Moselebe network (e.g. Khekhe, Malatswana,<br />
Moselebe and Kwi). The Auob and Nossop have partially dune-obscured, broad, flat<br />
beds, which are typical of flash floods in arid environments. Roughton International<br />
(2001) report that after very exceptional rains, localized flows are possible in the<br />
Molopo but their duration is short and flows do not run until ponding occurs in the<br />
lowest points of the valley. From Middlepits to Bokspits, ponding is reported to be<br />
most frequent downstream of Khuis, occurs less frequently at Middlepits, Gakhibane,<br />
De Brak, Inversnaid, Vaalhoek, and Bokspits.<br />
Both the Nossop and Auob rivers have their sources in the Anas Mountains near<br />
Windhoek, Namibia. They flow south easterly, joining in the Kalahari Gemsbok<br />
National Park 6 km north of Twee Rivieren and continue on as the Nossop to the<br />
Molopo and Kuruman rivers 60 km to the south. It is reported that the Molopo <strong>River</strong><br />
with its origin near Mafikeng, no longer reaches the <strong>Orange</strong> <strong>River</strong> as sand dunes near<br />
Noeneput have blocked its course for at least the last 1000 years (National Parks<br />
Board & Department of Wildlife and National Parks, 1997). The rivers are<br />
predominantly dry, only flowing for short periods after abnormally high rainfall. The<br />
intermittent fluvial activity has left terraces and fluvial sediments along the Molopo<br />
<strong>River</strong>. Some of these features have been dated to the late Quaternary while the high<br />
terraces, beyond the confines of the present valley, are presumed to be older (Thomas<br />
and Shaw). Flooding occurs very infrequently in response to very large-scale shortterm<br />
precipitation. Floods have been recorded in the Nossop in 1806, 1963, and<br />
January 1987 and in the Molopo <strong>River</strong> as well in 1934. For the most part these floods<br />
occur in response to rainfall over the upper catchment and are short lived, with the<br />
water being rapidly absorbed into the riverbed. There are no river gauging stations<br />
along the Molopo <strong>River</strong>.<br />
4.1.3 Soils<br />
Detailed soils studies have not yet been carried out in the southwestern part of the<br />
country. The 1: 250,000 Soil map of the Republic of Botswana largely covers the<br />
eastern and northern parts of that country which have comparatively higher crop<br />
farming potential. In the Molopo <strong>River</strong> Basin, the map only covers a small portion in the<br />
east up to longitude 24 o East near Sekoma Village. The 1: 1,000,000 Soil Map of The<br />
Republic of Botswana (Ministry of Agriculture, 1990), reproduced in this report as<br />
13/11/2007 Final<br />
75
<strong>Orange</strong> IWRMP<br />
Task 7: Environment<br />
Figure 4.5, shows that about 90 percent of the soils in the Molopo <strong>River</strong> Basin are<br />
Arenosols. These soils are sandy in texture and they occur on the Kalahari Sandveld.<br />
The soils are generally 100 centimeters in depth or deeper and well drained. As a<br />
result of their low water holding capacities, low organic matter and paucity of plant<br />
nutrients, the Arenosols generally have low agricultural potential for crop production. In<br />
the eastern part the Molopo <strong>River</strong> Basin, residual soils are found in the hardveld<br />
environment. The main soil types in the area are Leptosols, Regosols, Lixisols,<br />
Luvisols and Vertisols. The Leptosols and Regosols are sandy in texture like<br />
Arenosols. They are well drained and have low contents of clay. In terms of crop<br />
production, these soils have low potential in part due to their shallowness (Regosols<br />
are generally less than 100 cm in depth and Leptosols less than 50 cm). The Lixisols,<br />
Luvisols and Vertisols have relatively higher clay contents as compared to the other<br />
soils – thus their water retention capacities are better. Consequently, these soils are<br />
moderately good for crop production.<br />
Areas along river valleys in the Basin have soils whose formation was influenced by<br />
former fluvial activities. For instance the areas along the Nossop <strong>River</strong> have Haplic<br />
Luvisols whereas those along the fossil river valleys such as Khekhe, Moselebe,<br />
Sekhutlane and Malatswana, have Petric Calcisols. These soils have relatively high<br />
silt and clay content. As a result of these characteristics and their relative low<br />
topographic positions (thus acting as sinks for surface runoff and nutrients), the areas<br />
covered with these soils have a good potential for plant growth. The pans in the area<br />
generally have calcareous soils with fairly high clay content. The calcareous soils have<br />
good water holding capacities because of their compact soil structure. As a result the<br />
pans are valuable water sources for the wild animals and domestic livestock in the<br />
Kalahari, particularly after heavy rainfall events.<br />
13/11/2007 Final<br />
76
<strong>Orange</strong> IWRMP<br />
Task 7: Environment<br />
Figure 4-5: Soil map of the Molopo <strong>River</strong> Basin<br />
4.1.4 Climate<br />
The Molopo <strong>River</strong> Basin has a semi-arid to arid climate, which is characteristic of<br />
southern Botswana. The area receives the least amount of rainfall in the country, the<br />
amount generally increasing northwards towards Kasane area. The synoptic systems<br />
controlling Botswana’s climate are dominated by a combination of the seasonal<br />
movement of the large tropical and temperate zonal systems over southern Africa and<br />
their interaction with localised convective processes. North of the 20 o S latitude,<br />
primarily the Inter Continental Convergence Zone (ITCZ) and the Zaire Air Boundary<br />
(ZAB) complex influence the zonal system. The ITCZ attains its most southern position<br />
in January when it approaches the northern border of Botswana. The ZAB lies over<br />
central Zambia during the mid summer period when the low pressure also troughs into<br />
the extreme south of the continent. The rainfall weakens south of latitude 20 o S as the<br />
drought producing sub-tropical anticyclones (high pressure systems) become more<br />
dominant. This is reflected in the more meridional alignment (airflow patterns) of<br />
rainfall isohyets across South Africa, Botswana and Namibia with drier areas to the<br />
west and wetter areas to the east. The latter reflects the differential in rates of<br />
subsidence of the air masses between the east and west coasts of Southern Africa.<br />
13/11/2007 Final<br />
77
<strong>Orange</strong> IWRMP<br />
Task 7: Environment<br />
On the western coast, stronger subsidence occurs as a result of the interaction<br />
between the almost stable Atlantic Ocean anticyclone and cold waters of the Benguela<br />
Current whereas to the east the warm waters of the Agulhas Current, more numerous<br />
rain producing disturbances and the marked eastward displacement of the Indian<br />
Ocean anticyclone during summer result in weaker subsidence.<br />
Rainfall<br />
The mean annual rainfall isohyets of the study area are shown in Figure 4.6. The<br />
Bokspits area receives less than 300mm of mean annual rainfall and this increase<br />
north- and east-wards with the eastern part of the Basin receiving over 500mm of<br />
mean annual rainfall. The rainfall is predominantly convective and comprises instability<br />
showers and thunderstorms (Bhalotra 1987). The rainfall is unreliable and highly<br />
variable in both spatial and temporal terms. Almost all of the rainfall occurs during the<br />
summer period (October to April) with the winter period accounting for only 5% of the<br />
annual total (van der Maas, 1994). Rainfall data from the Department of Meteorological<br />
Services and the spatial distribution of the weather stations in the Molopo <strong>River</strong> Basin<br />
are presented in the Task 6 <strong>Report</strong> on Groundwater.<br />
Temperature<br />
In summer, days are hot and nights warm whereas in winter the days are warm and<br />
the nights cold. Extreme diurnal ranges, which are characteristic of arid and semi-arid<br />
environments, occur in the area. Data from the Department of Meteorology indicate<br />
that the warmest month in Tsabong is December with a mean monthly maximum<br />
temperature of 34.8 0 C and the coolest month is July with a mean minimum<br />
temperature of 4 0 C. Mean monthly maximum temperature in Tsabong varies from<br />
22.1 0 C in June to 34.8 0 C in December. The mean monthly minimum temperature<br />
varies from 4 0 C in July to 19.7 0 C in January. Highest temperatures (+35 o C) are<br />
recorded for November, December and January with minimum temperatures occurring<br />
during June and July (below zero degree centigrade).<br />
Although the western region of Botswana is unsuitable for rainfed farming, the<br />
Tsabong area is considered to be highly suitable for deciduous tree plantation with<br />
very good potential to produce high-quality fruits for the local and the export markets<br />
because of the local climatic conditions (Tahal Consulting Engineers, 2000). The<br />
Engineers estimated in the National Master <strong>Plan</strong> for Agricultural Development<br />
(NAMPAD) that a total of nearly 7,000 tons of apples and over 1,500 tons of grapes<br />
13/11/2007 Final<br />
78
<strong>Orange</strong> IWRMP<br />
Task 7: Environment<br />
could be obtained from this area provided the groundwater potential along the Molopo<br />
<strong>River</strong> (<strong>Water</strong>berg formation) was proven by site investigations. The local climate was<br />
considered to be conducive to this form of horticulture because it is relatively dry,<br />
having low relative humidity levels and relatively cool nights in summer. The rather<br />
high duration of daily sunshine would ensure good growing conditions and no major<br />
disease problems would be expected. The suggested fruit trees in the region<br />
represented by Tshabong meteorological station are: high quality peaches and<br />
nectarines, low-chilling-requiring Japanese plums, low-chilling-requiring apples and<br />
pears, and possibly also low-chilling-requiring apricots. In addition, this area is suitable<br />
for growing table grapes and other Mediterranean fruit trees like figs and olives.<br />
Figure 4-6: Mean Annual Rainfall of The Molopo <strong>River</strong> Basin<br />
The suggested varieties for this region are:<br />
• plums: Methley, Ogden and Santa Rosa;<br />
• peaches: Maravilla, Earligrande, Flordaprince and Flordaglo;<br />
• nectarine: Fiesta Red, Aprilglo and Sunsnow;<br />
• apricot: Canino;<br />
• pear: Spadona, Coscia and Tomer;<br />
• apple: Anna, Dorset Golden, Gala, and Orleans;<br />
13/11/2007 Final<br />
79
<strong>Orange</strong> IWRMP<br />
Task 7: Environment<br />
• Grapes: Muscat of Hamburg, Italia, Superior, Early Superior, Dan Ben Chana<br />
and Thompson seedless;<br />
• Kiwi: Hayward, Bruno.<br />
4.1.5 Vegetation<br />
The Molopo <strong>River</strong> Basin, which is located on the Kalahari Sandveld, is covered with<br />
savanna vegetation. A savanna is a plant community with discontinuous layer of<br />
woody species whose individuals are spaced more than one crown diameter apart,<br />
and with a usually dense ground layer of grasses and forbs. This vegetation occurs in<br />
the tropics and it can be looked at as a transition between the closed tropical forests of<br />
humid areas and the open grasslands of arid areas (Thomas and Shaw, 1984). Like in<br />
any other semi-arid environment, soil moisture availability is one of the key factors that<br />
influences the diversity and spatial distribution of the vegetation in the area. In the<br />
entire country, the diversity and biomass of the Kalahari vegetation generally increases<br />
in a northeasterly direction along the rainfall gradient. In the Molopo <strong>River</strong> Basin, the<br />
vegetation is relatively homogeneous in terms of floristic composition, but different<br />
vegetation structural types may be distinguished on a local scale as a result of<br />
differences in soil types and geomorphological effects, with the ephemeral and relict<br />
river valleys, pan depressions, and intra-dunefield topography being particularly<br />
important. These subtle vegetation differences are difficult to discern on national<br />
vegetation maps covering the Basin. Human activities such as livestock grazing and<br />
fire also influence vegetation structure and dynamics in the area.<br />
There are no detailed vegetation maps covering the entire Molopo <strong>River</strong> Basin. The<br />
study of Weare and Yalala (1971) shows that shrub and tree savanna vegetation<br />
grows in the Molopo <strong>River</strong> Basin. The savanna plant community whose woody<br />
component is predominantly composed of shrubs is classed as shrub savanna<br />
whereas that which is dominated by trees is tree savanna. On the basis of<br />
physiognomic characteristics of the vegetation, Weare and Yalala identified five<br />
vegetation types in the area as follows:<br />
• Arid Shrub Savanna;<br />
• Southern Kalahari Bush Savanna;<br />
• Molopo Thornveld;<br />
• Acacia giraffae Tree Savanna; and<br />
• Arid Sweet Bushveld.<br />
13/11/2007 Final<br />
80
<strong>Orange</strong> IWRMP<br />
Task 7: Environment<br />
The vegetation map of Weare and Yalala is reproduced and presented in this report as<br />
Figure 4.7. From the map, the role of moisture availability in influencing the distribution<br />
of vegetation communities in the area is noticeable. The southwestern part of the<br />
Basin that receives the least amount of annual rainfall is grown with Arid Shrub<br />
Savanna whereas relatively wetter places along the Molopo <strong>River</strong> and in the eastern<br />
part of the area have various forms of Tree Savanna. Thus land use changes or<br />
human developments that can significantly impact on soil moisture availability have the<br />
potential to influence the vegetation dynamics in the area. The extreme eastern area<br />
of the Basin is a transition zone from the sandveld to the hardveld environment, thus it<br />
may be argued that existing soil conditions, as determined by their parent rock<br />
material, may also have an influence on the Acacia giraffae Tree Savanna and the Arid<br />
Sweet Bushveld communities found in this area. Bekker & de Wit (1991) classified the<br />
vegetation of the southern part of the Gemsbok National Park as Dune savannah.<br />
Structurally, dune savannah is an open savannah with scattered shrubs and trees<br />
growing on sand dunes. In some places, the area is covered by seif dunes where<br />
trees and shrubs are commoner on the dune slopes than on the crests or in the interdunal<br />
valleys (also referred to as streets or straats by some scientists). In those areas<br />
covered by barchan dunes the inter-dune streets are a much smaller component of the<br />
landscape and woody species are much more prominent. Where sands are very thin,<br />
the community may grade into grassland with woody species other than low shrubs<br />
almost absent.<br />
13/11/2007 Final<br />
81
<strong>Orange</strong> IWRMP<br />
Task 7: Environment<br />
Figure 4-7: Vegetation Map of The Molopo <strong>River</strong> Basin<br />
Timberlake’s (1980) study shows that there are 6 vegetation associations in the<br />
Molopo <strong>River</strong> Basin as follows:<br />
• Acacia haemotoxylon / Rhigozum trichotomum<br />
• Acacia mellifera, Acacia luedritzii / Boscia albitrunca<br />
• Catosphractes alexandri / Rhus tenuinervis<br />
• Peltophorum africanum, Acacia tortilis, Acacia karro / Ziziphus mucronata<br />
• Terminalia sericea, Acacia tortilis / Ziziphus mucronata<br />
• Terminalia sericea, Lonchocarpus nelsii / Acacia erioloba<br />
Over 70 percent of the area is covered by the Acacia mellifera, Acacia luedritzii /<br />
Boscia albitrunca plant association as shown in Figure 4.8. The Acacia haemotoxylon<br />
/ Rhigozum trichotomum plant association is largely found along the Nossop <strong>River</strong> and<br />
around Khuis Village. The Peltophorum africanum, Acacia tortilis, Acacia karro /<br />
Ziziphus mucronata and the Terminalia sericea, Acacia tortilis / Ziziphus mucronata<br />
plant associations are found in the eastern area, occurring in the transitional zones<br />
13/11/2007 Final<br />
82
<strong>Orange</strong> IWRMP<br />
Task 7: Environment<br />
from the sandveld to the hardveld. Schmidtia kalariensis and Stipagrostis uniplumis<br />
are some of the most common grass species in the area. Erogrostis rigidior and<br />
Stipagrostis amabilis grasses commonly grow on the sand dunes whereas E.<br />
lehmanniana and E. rotifer in the inter-dunal valleys. The pans of the area are known<br />
to have certain vegetation associations. Thomas and Shaw (19984) reports that Van<br />
Straten categorised the pans of the region as follows:<br />
• Grassed pans - pan sediments consist of dark sandy clays, which support a<br />
dominantly grassy cover. Saline concentrations are low and calcrete generally<br />
not well developed<br />
• Un-grassed Pans - pan sediments consist of dark sandy clays, which support<br />
sparse halophyllic vegetation.<br />
• Saline Pans - pan sediments consist of saline and highly alkaline sandy clay<br />
with no plant growth. The pans are commonly deeply eroded into calcrete or<br />
a calcareous sandstone deposit<br />
The National Parks Board-South Africa (NPB) and the Department of Wildlife and<br />
National Parks-Botswana (DWNP) (1997) state that Leistner and Werger observed the<br />
following pan vegetation communities in the Kgalagadi Transfrontier Park (composed<br />
of Kalahari Gemsbok National Park and Gemsbok National Park) in 1973:<br />
• The Sporobolus nervosus - Zygophyllum tenue community was recorded<br />
mainly on the pan-like alluvial flats in the riverbed of the Nossop;<br />
• The Sporobolus coromandelianus community is found on the central parts of<br />
pans which consists normally of very compact and almost impervious clayey<br />
soils. This community is encountered only for a few weeks following rains;<br />
• The Sporobolus rangei community is found along the pan periphery or on<br />
small sand accretions where a thin layer of white calcareous sand covers the<br />
hard pan; and<br />
• The Lycium cinereum community was recorded on small dunes of white or<br />
grey loamy sand usually less than 1 meter high occurring on pan floors, along<br />
the edges of pans and sometimes in or along dry riverbeds.<br />
In addition, the NPB & DWNP observe that the Rhigozum trichotomum community<br />
occurs on fine, compact whitish sand and fine material on the outermost zone of pans<br />
whereas the infrequent Odyssea paucinervis community is only found in pans with<br />
white brackish sand in the Gemsbok National Park.<br />
13/11/2007 Final<br />
83
<strong>Orange</strong> IWRMP<br />
Task 7: Environment<br />
Figure 4-8: Vegetation Associations in the Molopo <strong>River</strong> Basin<br />
4.1.6 Wildlife<br />
Wildlife refers to any form of un-domesticated life. In this context therefore, all forms of<br />
living things such as plants, mammals, birds, reptiles, amphibians and invertebrates<br />
that are not domesticated are Botswana’s wildlife resources. Information on some<br />
forms of wildlife such as invertebrates, reptiles and amphibians is scanty especially in<br />
the southern and western part of the country. The Department of Wildlife and National<br />
Parks (DWNP) under the Ministry of Environment, Wildlife and Tourism is responsible<br />
for conservation and protection of wildlife resources in the country. In this regard, the<br />
Department usually carries out annual aerial wildlife surveys in the country for<br />
monitoring of population trends (Broekhuis, Jan F, DWNP, Pers. comm., 11 th<br />
November 2005). From 1989 to 1991, the DWNP carried out an aerial survey and the<br />
average population for the three years was taken at the end of the survey (Central<br />
Statistics Office, 2000). The findings from the survey indicate that areas outside<br />
protected areas in the districts where the Molopo <strong>River</strong> Basin is situated, i.e. Southern<br />
and Kgalagadi Districts, have relatively less wildlife diversity as compared to the wet<br />
northern parts of the country as shown in Table 4.2. This may be attributed to scarcity<br />
of food resources, water constraints and the nature of habitats found in the area due to<br />
13/11/2007 Final<br />
84
<strong>Orange</strong> IWRMP<br />
Task 7: Environment<br />
the relatively drier climatic conditions and the sandy soils. The animals commonly<br />
found in the area are herbivores that do not rely much on water such as hartebeest,<br />
wildebeest, springboks and gemsbok.<br />
Table 4-2: Unprotected Wildlife Population by District (1989-1991)<br />
Species Central Nort<br />
h<br />
east<br />
Chobe<br />
*Ghan<br />
zi<br />
*Kgalaga<br />
di<br />
Kwenen<br />
g<br />
Ngamilan<br />
d<br />
Souther<br />
n<br />
Elephant 6,744 - 9,798 - - - 30,324 - 46,866<br />
Zebra 2,473 - 1,008 39 - - 15,617 - 19,137<br />
Hippopotamus - - 147 - - - 2,034 - 2,181<br />
Warthog 308 73 8 68 61 - 4,577 - 5,095<br />
Giraffe 883 - 345 - - - 5,511 - 6,739<br />
Eland 1,149 - 227 140 2,923 19 1,213 - 5,671<br />
Kudu 2,479 374 231 2,245 1,332 353 8,154 203 15,371<br />
Sitatunga - - 11 - - - 1,470 - 1,481<br />
Gemsbok 1,216 - 31 6,495 20,912 1,930 9,629 97 40,310<br />
Roan - - 188 - - - 695 - 883<br />
Sable 20 - 1,588 - - - 1,236 - 2,844<br />
<strong>Water</strong>buk - - - - - - 135 - 135<br />
Lechwe - - - - - - 39,988 - 39,988<br />
Reedbuck - - 21 - - - 2,050 - 2,071<br />
Tsessebe - - 112 - - - 8,258 - 8,370<br />
Hartebeest 1,716 - - 2,216 15,054 4,796 547 2,978 27,307<br />
Wildebeest 7,554 - - 4,036 8,549 579 13,992 161 34,871<br />
Impala 18,499 419 85 - - - 17,129 - 36,132<br />
Springbok 16,055 - - 4,299 74,089 488 2,985 9,684 107,600<br />
Duiker 3,966 31 28 5,567 2,559 682 2,947 930 16,710<br />
Steenbok 6,084 70 113 3,967 3,331 1,259 5,381 1,968 22,173<br />
Buffalo 113 - 570 - - - 31,848 - 32,531<br />
Ostrich 19,573 - 76 3,513 11,210 2,853 10,573 3,963 51,761<br />
Crocodile - - - - - - 148 - 148<br />
Lion 105 - - - 50 - 61 - 216<br />
Jackal 393 - - 135 162 29 80 24 823<br />
Baboon - - - - 76 223 474 929 1,702<br />
Hyaena 13 - 14 9 12 - 268 - 316<br />
Source: CSO, 2002. *Districts where Molopo <strong>River</strong> Basin is situated; the other districts<br />
are only included for comparison.<br />
Total<br />
13/11/2007 Final<br />
85
<strong>Orange</strong> IWRMP<br />
Task 7: Environment<br />
The biggest part of the Gemsbok National Park, which is part of the Kgalagadi<br />
Transfrontier Park, falls in the Molopo <strong>River</strong> Basin. The wildlife populations of this Park<br />
as per the surveys carried out by the Department of Wildlife and National Parks in<br />
1989/1991, 1994, and 1996 are presented in Table 4.3. The 1996 census was not<br />
carried out in the former Mabuasehube Game Reserve which now forms part of the<br />
Park, thus the figures presented in the table for that year are not for the entire present<br />
Gemsbok National Park.<br />
Table 4-3: Estimates of Wildlife Numbers by Species inside the Gemsbok<br />
National Park<br />
Species<br />
Period of Wildlife Census<br />
1989 to 1991 1994 1996*<br />
Eland 1,617 1,362 8,877<br />
Kudu 12 96 -<br />
Gemsbok 22,852 35,397 43,684<br />
Hartebeest 3,362 13,026 6,589<br />
Wildebeest 246 4,446 554<br />
Springbok 5,028 15,584 2,326<br />
Duiker 389 765 491<br />
Steenbok 1,490 3,466 3,210<br />
Ostrich 2,630 3,466 -<br />
Lion 25 - -<br />
Hyaena 12 - -<br />
Source: CSO, 2002. * The census was not carried out in the former Mabuasehube<br />
Game Reserve<br />
Analysis of the 1994 wildlife data both inside and outside protected areas (i.e.<br />
Gemsbok National Park) indicates that the Ghanzi and the Kgalagadi Districts are vital<br />
for wildlife conservation in the country. For instance 88 percent of the springboks, 58<br />
percent of the hartebeests, 45 percent of the gemsboks and 35 percent of the<br />
wildebeests that were counted in the entire country in 1994 were found in theses two<br />
districts. This highlights the significance of the Molopo <strong>River</strong> Basin in particular and the<br />
region as a whole as a habitat for wild animal conservation in the country.<br />
13/11/2007 Final<br />
86
<strong>Orange</strong> IWRMP<br />
Task 7: Environment<br />
4.2 Environmental Protection and Conservation<br />
4.2.1 Institutional Framework<br />
The responsibility of environmental protection and conservation of natural resources in<br />
Botswana lies with the Department of Environmental Affairs (DEA), formerly known as<br />
the National Conservation Strategy Co-ordinating Agency (NCSA), in the Ministry of<br />
Environment, Wildlife and Tourism. The NCSA was set up under the National<br />
Conservation Strategy Policy, which was approved by Parliament in December 1990<br />
(Ministry of Finance & Development <strong>Plan</strong>ning, 2003). In addition, a 17-member<br />
National Conservation Strategy Advisory Board chaired by the Minister of Local<br />
Government, Lands and Housing was established under the Policy. During the 8 th<br />
National Development <strong>Plan</strong>, the Ministry of Local Government, Lands and Housing<br />
was divided into two, namely the Ministry of Local Government and the Ministry of<br />
Lands and Housing. The NCSA and the National Conservation Strategy Advisory<br />
Board were assigned to the Ministry of Lands and Housing, which was later re-named<br />
Ministry of Lands, Housing and Environment in recognition of the environmental<br />
coordination mandate. The National Conservation Strategy Advisory Board advised<br />
Government on all matters concerning the implementation of the National<br />
Conservation Strategy by coordinating the various environment and natural resources<br />
institutions of Government whereas the NCSA acted as a secretariat (Ministry of<br />
Finance & Development <strong>Plan</strong>ning, 2003). Recently, the NCSA was transformed into<br />
the Department of Environmental Affairs and the ministry re-named Ministry of<br />
Environment, Wildlife and Tourism.<br />
Given the complexity of the environment and the inter-linkage of its various<br />
components, the DEP works in collaboration with other Government ministries,<br />
departments and stakeholders such as the Ministry of Agriculture, the Ministry of<br />
Lands and Housing and the Botswana National Museum and Art Gallery in order to<br />
appropriately protect the country’s environment and natural resources. The Ministry of<br />
Environment, Wildlife and Tourism’s goals include enhancement of environmental and<br />
ecological quality and serenity; conservation of genetic resources and essential life<br />
support systems; and protection and conservation of country’s natural, scenic,<br />
aesthetic and cultural heritage.<br />
At the district level, institutions such as Land Board, Conservation Committee, District<br />
Land Use <strong>Plan</strong>ning Unit and District Council handle environmental conservation issues<br />
(Kgalagadi District Council, 2003). Thus such institutions in the Kgalagadi and the<br />
13/11/2007 Final<br />
87
<strong>Orange</strong> IWRMP<br />
Task 7: Environment<br />
Southern Districts would be involved in any conservation issue in the Molopo <strong>River</strong><br />
Basin.<br />
4.2.2 Policy and Legal Framework<br />
Botswana Government considers conservation of natural resources and biological<br />
diversity as one of the pillars of sustainable development. In this regard therefore, the<br />
Government has various environmental policies and laws in place, some of which are<br />
discussed below.<br />
National Conservation Policy (1990)<br />
This Policy was formulated by Botswana Government and approved by the National<br />
Assembly on the 17 th December 1990. It aims at promoting conservation of natural<br />
resources in the country such as fresh air, water, vegetation, wildlife, soils and<br />
archeological features. The goals of the Policy are:<br />
• the conservation of all main ecosystems, wildlife and cultural resources;<br />
• the protection of endangered species;<br />
• the maintenance of stocks of renewable resources (e.g. veldt products), whilst<br />
increasing their sustainable yields;<br />
• the control of the depletion of exhaustible resources (e.g. minerals) at optimal<br />
rates;<br />
• the distribution of incomes and rewards more equitably, in the interests of<br />
conserving natural resources;<br />
• the cost-effective restoration of degraded renewable natural resources,<br />
including improved capacity for generation of the veldt; and<br />
• the prevention and control of pollution.<br />
Waste <strong>Management</strong> Act (Cap 40.01 of 1998)<br />
The Department of Sanitation and Waste <strong>Management</strong> is responsible for<br />
implementation of the Act in the country. The Act is intended to guard against pollution<br />
of the environment, to conserve natural resources, to cause the provisions of the Basel<br />
Convention to apply in regulating the trans-boundary movement of hazardous wastes<br />
and their disposal. Section 34 prohibits littering. Subsection 34 (1) states that a person<br />
shall not deposit in any place anything which may contribute to the defacement of any<br />
place by litter, except as authorized by law or done with the consent of the owner or<br />
occupier of that place. Any person who contravenes this section commits an offence<br />
13/11/2007 Final<br />
88
<strong>Orange</strong> IWRMP<br />
Task 7: Environment<br />
and is liable to a fine not exceeding P300 or to imprisonment for a term not exceeding<br />
two months or to both. For purpose of proper waste disposal in the country, each<br />
district is supposed to have a sanitary landfill. Recently the Kgalagadi District Council<br />
constructed a sanitary landfill in Tsabong in the Molopo <strong>River</strong> Basin.<br />
Environmental Impact Assessment Act (2005)<br />
In order to foster sustainable development in the country, the Government of<br />
Botswana enacted the Environmental Impact Assessment (EIA) Act in 2005. The<br />
Department of Environmental Affairs implements the EIA Act, which commenced on<br />
the 27th of May 2005. The Act is intended to assess the potential effects of planned<br />
developmental activities; to determine and to provide mitigation measures for effects of<br />
such activities as may have a significant adverse impact on the environment; to put in<br />
place a monitoring process and evaluation of the environmental impacts of<br />
implemented activities; and to provide for matters incidental to the foregoing. Section 4<br />
states that any person who undertakes or implements an activity in contravention of<br />
the Act commits an offence and is liable to a fine not exceeding P100,000 or to a term<br />
of imprisonment not exceeding 2 years or to both.<br />
Community Based Natural <strong>Resources</strong> <strong>Management</strong> Policy<br />
This policy aims at fostering conservation of natural resources by local communities. It<br />
is intended to promote rural development through community participation and the<br />
creation of economic incentives. In the Kgalagadi District, the Policy has benefited<br />
some communities and trusts such as Khawa, Koinaphu, Maiteko and Ukhwi. These<br />
communities mostly utilize Wildlife <strong>Management</strong> Areas with the exception of Maiteko<br />
which is based on salt harvesting (Kgalagadi District Council, 2003).<br />
Wildlife Conservation and National Parks (1992) Act<br />
The Wildlife Conservation and National Parks Act of 1992 protects any form of<br />
undomesticated life in Botswana and its implementation lies with the Department of<br />
Wildlife and National Parks. The Act is intended to foster conservation, protection and<br />
sustainable management of wildlife in the country. It has provisions for establishment<br />
of national parks, game reserves, sanctuaries, and private game reserves for<br />
protection and preservation of wildlife, vegetation and objects of geological,<br />
archaeological and scientific interest.<br />
13/11/2007 Final<br />
89
<strong>Orange</strong> IWRMP<br />
Task 7: Environment<br />
Herbage Preservation Act no. 27of 1977<br />
This Act deals with control of veld fires and stipulates penalties for offences. According<br />
to the Act, permit for controlled fire is given by the Agricultural Resource Board based<br />
on the purpose of the fire, time of the day and wind speed to anybody that might need<br />
to burn portion of his area.<br />
Monuments and Relics Act of 1970 (as Amended, 2001)<br />
The Monuments and Relics Act protects all archaeological and/or historic monuments<br />
and sites in Botswana, whether they are recorded in National Museum Sites Register<br />
or not. The National Museum, Monuments and Art Gallery implements the Act.<br />
Section 18 of the Act prohibits any alteration, damage or removal from original site of<br />
any national monument, relic or recent artifact. The Act recognizes the fact that<br />
alteration, damage or removal of monuments and relics may occur through<br />
development. Section 19, therefore, provides for pre-development Archaeological<br />
Impact Assessments (AIA) and mitigation where planned developments are likely to<br />
disturb the earth’s surface. The National Museum, Monuments and Art Gallery requires<br />
that Archeologists registered with them carry out such studies in order to ensure that<br />
archeological studies are of acceptable standards. This ultimately ensures that<br />
development takes place in appropriate ways without obliterating the archeological and<br />
cultural resources of the country.<br />
<strong>Water</strong> Act (34:01)<br />
The <strong>Water</strong> Act intends to define ownership of any rights to the use of water and to<br />
provide for grant of water rights and servitude. <strong>Water</strong> in rivers, streams, lakes, pans,<br />
swamps or beneath a watercourse or underground water and in works such as canals,<br />
reservoirs and dams is public water. The use of such water can only be with<br />
permission granted by the <strong>Water</strong> Apportionment Board in the Department of <strong>Water</strong><br />
Affairs. Application for the water user rights to the Board is done through the <strong>Water</strong><br />
Registrar who shall issue a certificate. The Act bars pollution of public water with any<br />
matter derived from such use likely to cause injury either directly or indirectly to public<br />
health, livestock, animal life, fish, crops, orchards or gardens which are irrigated by<br />
such water or to any product in the processing of which such water is used. The holder<br />
of a water right is obligated to take precautions to prevent accumulations in any river,<br />
stream or watercourse of silt, sand, gravel, stones, sawdust, refuse, sewage, waste or<br />
any other substance likely to affect injuriously the use of such water. A holder of water<br />
13/11/2007 Final<br />
90
<strong>Orange</strong> IWRMP<br />
Task 7: Environment<br />
right who contravenes the Act shall be guilty of an offence and liable to a penalty under<br />
the Act.<br />
4.3 Conservation Areas<br />
The Government of Botswana takes conservation of natural resources in high regard.<br />
For instance the national vision (1997), Vision 2016, advocates for use of renewable<br />
resources at rates that are in balance with their regeneration capacity. The Vision<br />
further underlines the importance of good attitudes towards natural resources in order<br />
to have a fair distribution between present and future generations. As part of the<br />
Government’s conservation efforts, some land has been designated for the protection<br />
and conservation of the natural resources of the country. Game reserves and national<br />
parks cover 17 percent of the land area while an additional 22 percent is designated as<br />
Wildlife <strong>Management</strong> Areas (Botswana National Agenda 21 Coordinating Committee,<br />
2002). The conservation areas found in the Molopo <strong>River</strong> Basin are presented in<br />
Table 4.4 and shown in Figure 4.9. There are no other planned protected areas in the<br />
Basin (Broekhuis, Jan F, DWNP, Pers. comm., 11 th November 2005). The significance<br />
of the existing conservation areas may be observed in Figure 4.10, which shows that<br />
during the dry season of the year 2004 the majority of the wildlife biomass observed by<br />
the DWNP in the Basin was in such areas.<br />
Table 4-4: Conservation Areas in Molopo <strong>River</strong> Basin<br />
Name Code District *Estimated<br />
Total Area<br />
(Km2)<br />
Gemsbok National<br />
Park<br />
Khawa Wildlife<br />
<strong>Management</strong> Area<br />
Inalegolo Wildlife<br />
<strong>Management</strong> Area<br />
Corridor Wildlife<br />
<strong>Management</strong> Area<br />
Estimated<br />
Area in Molopo<br />
<strong>River</strong> Basin<br />
KD\4 Kgalagadi 26,208 17,389 66<br />
KD\15 Kgalagadi 7,712 7,573 98<br />
KD\12 Kgalagadi 10,004 2,691 27<br />
SO\2 Southern 2,520 1,627 65<br />
* Area estimated by GIS using DWNP spatial data.<br />
Percentage<br />
of Area in<br />
Molopo <strong>River</strong><br />
Basin<br />
13/11/2007 Final<br />
91
<strong>Orange</strong> IWRMP<br />
Task 7: Environment<br />
Figure 4-9: Conservation Areas, Cultural Heritage Sites and Ecologically<br />
Sensitive Areas in the Molopo <strong>River</strong> Basin<br />
13/11/2007 Final<br />
92
<strong>Orange</strong> IWRMP<br />
Task 7: Environment<br />
Figure 4-10: Wildlife Biomass in the Molopo <strong>River</strong> Basin in the Dry Season of<br />
2004<br />
Gemsbok National Park<br />
The Gemsbok National Park, which forms part of the Kgalagadi Transfrontier Park, is<br />
the biggest and most valuable conservation area in the Molopo <strong>River</strong> Basin. The Park<br />
has an area of about 26,200 Km 2 , with 66 percent of the land area found in the Basin.<br />
The park is protected and managed by Department of Wildlife and National Parks<br />
under the Wildlife Conservation and National Parks Act of 2002. A number of activities<br />
are prohibited in the parks of Botswana under the Act. For instance, Section 8.1 states<br />
that except as provided in subsection 2, no person other than a wildlife officer or a gate<br />
attendant acting in the exercise of his official duties or any other employee of the<br />
Government with the written permission of the Director and acting in the exercise of his<br />
official duties as such employee, shall:<br />
• convey into or be in possession of any weapon, explosive, trap or poison<br />
within a national park;<br />
• without lawful excuse, be in possession of, or kill, hunt, injure, capture or<br />
disturb any animal, or take or destroy an egg or nest, in a national park;<br />
13/11/2007 Final<br />
93
<strong>Orange</strong> IWRMP<br />
Task 7: Environment<br />
• cause any damage to or disturb any object of geological, ethnological,<br />
historical, archaeological or other scientific interest within a national park, or<br />
remove an y such object from a national park;<br />
• introduce any wild or domestic animal or any fish or any vegetation into a<br />
national park, or permit any domestic animal to stray into a national park;<br />
• remove from a national park any animal or part of any animal or any<br />
vegetation, whether alive or dead, other than an animal he has lawfully<br />
introduced into the park;<br />
• cut, damage or destroy any tree or other vegetation in a national park;<br />
• erect any structure, whether permanent or otherwise, or make any road or<br />
airstrip, or otherwise alter the natural environment, except as may be<br />
expressly permitted by the Minister or by a wildlife officer authorized to give<br />
such permission;<br />
• destroy or deface any object, whether animate or inanimate, in a national<br />
park; or<br />
• willfully or negligently cause any veld fire in a national park.<br />
Sections 8.2 and 8.3 empower wildlife officers and park attendants to confiscate or<br />
destroy vegetation and animals brought in the parks unlawfully.<br />
Wildlife <strong>Management</strong> Areas<br />
Wildlife <strong>Management</strong> Areas (WMAs) such as Khawa, Inalegolo and Corridor found in<br />
the Molopo <strong>River</strong> Basin play a significant role in the management of wildlife resources.<br />
The Wildlife Conservation and National Parks Act empowers the President to declare<br />
any area to be a Wildlife management Area, or to abolish existing ones, or amend its<br />
boundaries by deleting or adding new areas, by order published in the Gazette. In the<br />
WMAs, community utilization of wildlife resources is permissible but it is regulated with<br />
a view of ensuring its sustainability. Some of the activities regulated in these areas<br />
under the Wildlife Conservation and National Parks Act (1992) include the following:<br />
• the hunting or capture of animals therein by virtue of any licence or permit to<br />
hunt or capture;<br />
• the erection of any dwelling house or other building therein, or the residence<br />
therein of any person, or the size of any settlement therein;<br />
• the grazing of any stock therein and any conditions or limitations concerning<br />
the husbandry of stock therein;<br />
13/11/2007 Final<br />
94
<strong>Orange</strong> IWRMP<br />
Task 7: Environment<br />
• the cultivation of any land therein, the conditions under which persons may<br />
cultivate, and the allocation of land for cultivation;<br />
• conditions governing the drilling, allocation and use of boreholes;<br />
• conditions governing the use therein of vehicles, aeroplanes, microlight<br />
aircraft and boats;<br />
• the entry or the presence therein of persons other than residents thereof; and<br />
• the culling of animals therein in accordance with any approved game animal<br />
utilization scheme.<br />
Section 15.4 of the Wildlife Conservation and National Parks Act requires the Director<br />
of Wildlife and National Parks to consult with the responsible Land Boards and District<br />
councils when formulating their management plans and carrying out duties relating to<br />
management of these areas.<br />
The Wildlife <strong>Management</strong> Areas in the Molopo <strong>River</strong> Basin are significant to wildlife<br />
conservation in the area because they act as buffer zones to the Gemsbok National<br />
Park. In addition, they act as corridors for migratory animals such as wildebeests and<br />
hartebeests between the Park and the Central Kalahari Game Reserve and the Khutse<br />
Game Reserve to the northeast.<br />
4.4 Archeological and Cultural Heritage <strong>Resources</strong><br />
Archeological investigations in Botswana are quite a recent phenomenon. Unlike in<br />
other African countries where archeological traditions were established in the early<br />
colonial era, the Bechuanaland Protectorate (present Botswana) witnessed remarkably<br />
little archeological development at the time (Lane, P., Reid A and Segobye, A, 1998).<br />
The establishment of the National Museum in the late 1960’s did not immediately<br />
generate interest in archeological research. This only came in the 1970’s with the<br />
recruitment of an archaeologist to the staff of the National Museum, Monuments and<br />
Art Gallery. From this recent development of archaeological work, almost 2000 sites<br />
are now recorded in the sites register of the National Museum, Monuments and Art<br />
Gallery. However, the majority of the sites are found in the eastern part of the country<br />
where most research studies have been undertaken. Thus the archeology of the other<br />
parts of Botswana such as the Molopo <strong>River</strong> Basin is generally poorly understood due<br />
to paucity of information.<br />
13/11/2007 Final<br />
95
<strong>Orange</strong> IWRMP<br />
Task 7: Environment<br />
The majority of the sites in the area are found along the Molopo and the Nossop <strong>River</strong><br />
valleys. The other sites are found near settlements that are close to big pans in the<br />
area such as Sekoma, Tsabong and Khakhea. This seems to indicate that water<br />
availability in the Basin was a significant factor in the influence of human settlement<br />
patterns in the past.<br />
In 2005, Walker carried out an Archeological Impact Assessment (AIA) study for the<br />
proposed Tsabong-Middlepits tar road. In the study, the proposed borrow pits and the<br />
road alignment route was visited. The AIA identified some Stone and Iron Age<br />
archaeological artifacts such as sherds, ostrich eggshell and flakes but none of them<br />
seems to be of high archeological significance. The AIA study for the Middlepits-<br />
Bokspits Road project identified 7 sites ranging from the Palaeolithic (2 million to<br />
120,000 years ago), Mesolithic (120,000 to 40,000 years ago) to the Neolithic era<br />
(40,000 years ago) (Roughton International, 2001). The sites from Roughton<br />
International’s archaeological study are presented below:<br />
Table 4-6: Archeological sites in Middlepits-Bokspits area after Roughton<br />
International (2001)<br />
Site Name<br />
UTM Co-ordinates<br />
Description<br />
(Arc1950)<br />
Easting<br />
Northing<br />
Khuis-Gakhibane 580344 7050356 Lithics, choppers, core,<br />
scrappers<br />
580860 7050717 Hand axes, scrappers<br />
582756 7051324 Scrappers<br />
582748 7051444 Possible abandoned<br />
graveyard<br />
482656 7034088 Graveyard<br />
Hoekrans 482632 7034078 Lithics, faunal remains in cave<br />
context<br />
Rappel’s Pan 473732 7028710 <strong>Report</strong>ed but unvisited site<br />
463479 7042288 <strong>Report</strong>ed but unvisited site<br />
582972 7051362 <strong>Report</strong>ed but unvisited site<br />
Source: Roughton International (2001)<br />
4.5 Ecological Sensitivity<br />
The areas that are considered to be ecologically sensitive in the Molopo <strong>River</strong> Basin<br />
are listed below.<br />
13/11/2007 Final<br />
97
<strong>Orange</strong> IWRMP<br />
Task 7: Environment<br />
• The Gemsbok National Park and the Wildlife <strong>Management</strong> Areas –<br />
considered to be sensitive ecologically due to the wildlife populations that they<br />
support<br />
• The Molopo and Nossop <strong>River</strong>s and their fossil river tributaries – Even<br />
though these palaeo-river systems have no surface water flow nowadays,<br />
groundwater may be flowing underneath them. As a result, soil moisture in the<br />
valleys is comparatively high and as such these areas tend to support<br />
relatively unique habitats and plant species in the region (Monna, S., DEA,<br />
pers. Comm., 7 th November 2005). Unsustainable use of the underground<br />
water resources in these areas may degrade the ecosystems along these<br />
palaeo-river systems.<br />
• The Pans - The Molopo <strong>River</strong> Basin has pans as observed in Section 1.2. In<br />
the Kgalagadi District, some of the villages are built around the pans whereas<br />
the others are even built on the pans such as Tsabong (Kgalagadi District<br />
Council, 2003). This has subsequently resulted into the pans experiencing<br />
gradual degradation, as they become sources of quarry raw materials. The<br />
pans are spectacular geomorphological features in the region and are useful<br />
water sources for wildlife and domestic livestock particularly after heavy<br />
rainfall events due to the compact structure of their calcareous soils.<br />
However, their soil structure is sensitive and susceptible to physical<br />
disturbance.<br />
4.6 Environmental Impacts from Previous Developments in the Molopo <strong>River</strong> Basin<br />
and other Concerns<br />
The 2001 Population and Housing Census data (Central Statistics Office, 2001)<br />
indicate that the Molopo <strong>River</strong> Basin is sparsely populated. The entire area had a<br />
population of 47,661 people in 2001. With an approximate land area of 71,000 square<br />
Kilometers, the population density was thus 1 person per square Kilometer. The<br />
population density is assumed not to have changed significantly since then. The<br />
population centers in the area include Goodhope, Gathwane, Mogojogojowe,<br />
Mmathethe, Digawana, Thareseleele, Ramatlabama, Mokatako, Phitshane-Molopo<br />
Mmakgori, Tshidilamolomo, Mabule, Selokolela, Metlobo, Magoriapitse, Sekoma,<br />
Khakhea, Makopong, Khisa, Omaweneno, Maleshe, Tsabong, Werda, Maralaleng,<br />
Struizendam, Rappelspan, Khuis, Bogogobo, Middlepits, Khawa, Gakhibane and<br />
Bokspits (See Task 10 <strong>Report</strong> for details on demographic characteristics of the area).<br />
13/11/2007 Final<br />
98
<strong>Orange</strong> IWRMP<br />
Task 7: Environment<br />
The area is relatively less developed compared to other parts of Botswana. In part this<br />
may be due to the low population density, scarcity of water resources due to the arid to<br />
semi-arid climate and the low production potential of the sandy soils in the area. Most<br />
of the developments take place in and close to big villages like Tsabong, Goodhope,<br />
Khakhea, Werda and Sekoma. Such developments usually entail construction of public<br />
facilities like clinics, Government offices and residential houses in the villages. The<br />
potential environmental impact from such developments on the general ecology of the<br />
Molopo <strong>River</strong> Basin is generally of low significance.<br />
The Tsabong Groundwater Resource Investigation, Assessment and Development<br />
project (1999) by the Department of <strong>Water</strong> Affairs under the Ministry of Minerals,<br />
Energy and <strong>Water</strong> <strong>Resources</strong> is one of the recent major developmental projects in the<br />
Molopo <strong>River</strong> Basin. The project aimed at identifying and quantifying the groundwater<br />
resources in the exploration area. The overall impact on the environment from the<br />
groundwater exploration activities in the area was minor. Another developmental<br />
project in the area is the proposed Tsabong-Bokspits Tar road by the Department of<br />
Roads under the Ministry of Works, Transport and Communications. Under this<br />
project, it is intended to up-grade the current gravel road from Tsabong up to Bokspits.<br />
Presently, this road is situated in the Molopo <strong>River</strong> valley along much of the area with<br />
the exception at a few places near some villages such as Tsabong and Middlepits<br />
(See Plate 2). The presence of active sand dunes in the areas adjacent to the road<br />
and the absence of water flow in the river over the decades may have influenced its<br />
alignment in the valley. The EIA for the Middlepits-Bokspits section of the proposed<br />
road indicates that the new road will follow the existing gravel road with the exception<br />
of two short sections through the villages of Middlepits and Khuis and the section<br />
between Khuis and Gakhibane, where the new road alignment will be moved out of the<br />
Molopo valley (Roughton International, 2001). Apart from the engineering advantage of<br />
building on an already compacted base, Roughton International argues that the<br />
selected road alignment (amongst 3 options) is advantageous because it would reduce<br />
the need for earthworks and compaction, require less materials and minimize the<br />
amount of virgin ground subjected to disturbance, thus substantially reducing both the<br />
visual impacts of construction of the new road and its overall ‘environmental footprint’.<br />
Two other alternative routes and the “no-project option” were considered and rejected<br />
as they all had much higher environmental impacts and lower benefits as compared to<br />
the selected option. The other options would have involved extensive construction<br />
work in the sand dunes, which would have had major negative environmental impacts<br />
(Roughton International, 2001). The EIA identified a number of potential environmental<br />
13/11/2007 Final<br />
99
<strong>Orange</strong> IWRMP<br />
Task 7: Environment<br />
impacts that could accrue from the road project during the construction and the<br />
operation phases. The construction impacts were considered to be short-term in<br />
nature and related to disruption of established patterns of access to essential assets<br />
and resources, heavy construction traffic, and generation of noise and dust. The<br />
possibility of establishing borrow pits in the Molopo <strong>River</strong> valley was noted by the EIA<br />
as a major project impact. The area of greatest concern was the length of the Molopo<br />
valley between Khuis and Gakhibane, where it was proposed to develop a large<br />
calcrete borrow pit. The study observed that the proposed borrow pit site was situated<br />
in the most spectacular part of the valley (between Middlepits and Bokspits) where<br />
there is no topsoil. It was thus considered by Roughton International that use of the pit<br />
would do irreparable damage to the unique scenic resource of the Molopo <strong>River</strong> valley.<br />
Two other borrow pit sites between Gakhibane and De Brak were expected to have<br />
similar impacts. The study noted that rehabilitation of the borrow pits after use would<br />
be difficult because:<br />
• Calcareous sites are inherently difficult to rehabilitate;<br />
• Rehabilitation is always difficult in an arid and variable climate due to the lack<br />
of soil moisture for plant growth; and<br />
• There is no soil for the plants to grow in.<br />
Figure 4-11: Gravel road to be up-graded in Molopo <strong>River</strong> Valley at Hoekrans<br />
(Source: Roughton International, 2001)<br />
The EIA recommended that no further material for road construction should be<br />
obtained from the Molopo Valley between Khuis and Gakhibane Villages. The risk to<br />
the road infrastructure in case of future water flow in the river was not evaluated in the<br />
13/11/2007 Final<br />
100
<strong>Orange</strong> IWRMP<br />
Task 7: Environment<br />
study nor the vulnerability of underground water resources in the valley to pollution<br />
incase of accidental pollutant release, for instance during a road accident.<br />
Apart from the above road project, there are no other major construction works in the<br />
Molopo <strong>River</strong> Valley or any of its tributaries. Furthermore there are no river<br />
impoundments or inter-basin water transfers because as observed earlier water no<br />
longer flows in the rivers of the Basin.<br />
A significant challenge facing environmental protection and conservation of natural<br />
resources, particularly wildlife resources, is increasing pressure from other forms of<br />
land use. Traditional livestock rearing, which requires large expanses of land, is the<br />
main form of land use for the majority of the people in the Basin. This form of land use<br />
poses a significant challenge especially to wildlife conservation in the area. Data from<br />
the Department of Wildlife and National Parks show that areas with high populations of<br />
livestock have low populations of wild animals. In addition, some people in the area<br />
are of the view that the protected areas (i.e. Gemsbok National Park and the Wildlife<br />
<strong>Management</strong> Areas) deprive them of land, which could have been used for livestock<br />
grazing (Broekhuis, Jan F, DWNP, Pers. comm., 11 th November 2005).<br />
13/11/2007 Final<br />
101
<strong>Orange</strong> IWRMP<br />
Task 7: Environment<br />
5 ENVIRONMENTAL ISSUES IN NAMIBIA<br />
5.1 Background<br />
There are five catchments recognized in Namibia that form part of the <strong>Orange</strong> <strong>River</strong><br />
system. They drain the central and eastern parts of southern and central Namibia<br />
(Figure 5.1), as follows:<br />
• Fish <strong>River</strong> catchment<br />
• Auob system, which joints on the South Africa-Botswana border with the<br />
• Nossob system, and<br />
• Two small catchment areas in the extreme south and south-east of Namibia.<br />
The Fish <strong>River</strong> is the only system that provides any significant volume of water into the<br />
<strong>Orange</strong> <strong>River</strong>, and this is highly variable because of the arid and unpredictable rainfall<br />
in southern Namibia.<br />
The <strong>Orange</strong> <strong>River</strong> catchments drain most of the Karas and Hardap regions (only<br />
omitting the hyper-arid Namib Desert in the extreme west), the south-eastern third of<br />
the Khomas region and the western and southern edge of the Omaheke region.<br />
Median annual rainfall ranges from just on 300 mm in the north-eastern part of the<br />
catchments to less than 50 mm in the extreme south west along the <strong>Orange</strong> <strong>River</strong>.<br />
Most of this zone (about 75%) receives less than 200 mm. Rainfall is also highly<br />
variable (coefficient of variation between 50 and 90%) and the highest evaporation<br />
rates in Namibia are experienced in this zone (2.0-2.7 m per year). This results in an<br />
average water deficit per year of about 1.9 m in the northern of the catchments to<br />
about 2.6 m in the Keetmanshoop area. This zone also records the most extreme<br />
temperature range in Namibia, with the average maximum temperature during the<br />
hottest month being above 36 o C and the average minimum during the coldest month<br />
being less than 2 o C. The Fish and <strong>Orange</strong> <strong>River</strong> basins are particularly hot, with<br />
temperatures in the mid-40 o C not being uncommon.<br />
13/11/2007 Final<br />
102
<strong>Orange</strong> IWRMP<br />
Task 7: Environment<br />
Figure 5-1: The five catchments recognized in Namibia<br />
The southern zone of Namibia contains four desert systems, three of which are<br />
drained by the catchments of the <strong>Orange</strong>, (a) the Succulent Karoo in the extreme<br />
south west, consisting of the “winter rainfall” area from Luderitz south to the <strong>Orange</strong><br />
<strong>River</strong> and on into South Africa, and in fact representing an area where rainfall occurs<br />
with almost equal improbability throughout the year; (b) the Nama Karoo, which<br />
receive mainly summer rainfall and comprises five different vegetation types in this<br />
zone (see Table 5.1); and (c) the Southern Kalahari, consisting of a deep layer of<br />
wind-blown sand, with little run-off from rainfall.<br />
13/11/2007 Final<br />
103
<strong>Orange</strong> IWRMP<br />
Task 7: Environment<br />
Table 5-1: The percentage of vegetation types within the Central-South zone<br />
occurring within different land use categories<br />
Biome<br />
Namib<br />
Succule<br />
nt Karoo<br />
Nama<br />
Karoo<br />
Acacia<br />
Tree-<br />
and-<br />
Shrub<br />
Savanna<br />
Vegetation type<br />
Percentage of vegetation types within different land uses<br />
State<br />
Protected<br />
Areas<br />
Private<br />
Nature<br />
Reserves<br />
Communal<br />
Conservancies<br />
Commercial<br />
Conservancies<br />
Central gravel plains 66.4 0 21.6 0 88.0<br />
Southern sand sea 87.8 1.4 0 1.0 90.3<br />
Succulent Steppe 90.3 0.1 0 0 90.4<br />
West-central<br />
Escarpment Transition<br />
Desert-Dwarf Shrub<br />
Transition<br />
Total<br />
15.8 0 33.3 0 49.1<br />
19.6 4.5 0 3.4 27.5<br />
Dwarf Shrub Savanna 1.8 1.3 12.5 0.2 15.8<br />
Karas Dwarf<br />
Shrubland<br />
Dwarf Shrub-Southern<br />
Kalahari Transition<br />
0.6 0 8.4 0 9.1<br />
0 0 0 0 0<br />
Southern Kalahari 0 0 0 0.4 0.4<br />
Highland Shrubland 0.2 0 0 39.5 39.7<br />
Walvis Bay<br />
Sandwich<br />
Harbour<br />
â<br />
â<br />
Erongo<br />
mountains<br />
Gross Barmen<br />
Hot Springs<br />
Daan Viljoen<br />
Game Park<br />
Von Bach<br />
Recreation Resort<br />
Windhoek<br />
#<br />
Auas<br />
mountains<br />
Namib-Naukluft Park<br />
Hardap Recreation<br />
Resort<br />
National Diamond Coast<br />
Recreation Area<br />
Sperrgebiet<br />
Naute<br />
Recreation Resort<br />
â<br />
Ramsar site<br />
<strong>Orange</strong> river mouth<br />
â<br />
Ai-Ais Hot Springs<br />
Figure 5-2: National Parks, Recreational areas and Resorts in Western and<br />
Southern Namibia<br />
13/11/2007 Final<br />
104
<strong>Orange</strong> IWRMP<br />
Task 7: Environment<br />
In the northern and eastern parts of the catchments the vegetation is semi-arid Acacia<br />
tree-and-shrub Savanna, giving way to Dwarf shrub Savanna southwards. Other<br />
relevant components of the landscape include:<br />
• Inland Wetlands – the only perennial one being the <strong>Orange</strong> <strong>River</strong>, which<br />
forms the international border with South Africa. The <strong>Orange</strong> <strong>River</strong> mouth is a<br />
Ramsar site registered by both Namibia and South Africa as a wetland of<br />
international importance. A number of important ephemeral wetlands occur in<br />
the zone, the largest being the south-flowing Fish <strong>River</strong>. Two main ephemeral<br />
river systems – the Nossob and Auob – drain the Kalahari, running south-west<br />
into the Botswana/South Africa Kalahari Gemsbok Transfrontier Park. The<br />
area from north-east and east of Keetmanshoop, running south mainly within<br />
the Karas Dwarf Shrub Karoo vegetation type, is rich is ephemeral pans. And<br />
finally, two of the largest impoundments in Namibia occur on the Fish <strong>River</strong><br />
catchment, being the Hardap and Naute dams. Because of the aridity of the<br />
south of Namibia, all wetlands have particular importance;<br />
• Inselbergs and escarpments – important for their increased diversity (at<br />
habitat/micro-habitat and species levels), water run-off and refugia for species<br />
heavily utilized on the plains. Dominance inselbergs and other topographic<br />
features in this zone include the volcanic Brukkaros, the Karas and Small<br />
Karas mountains and the Fish <strong>River</strong> Canyon, the second largest canyon in the<br />
world (after the Grand Canyon in the USA).<br />
The human population is generally very small in the Central-South parts of Namibia.<br />
Karas and Hardap regions each have less than 70,000 people, with some 20% and<br />
25% respectively being urban. The Khomas region has a higher population of some<br />
250,000, but over 85% are urban, mainly in Windhoek, and fewer than 10,000 people<br />
in this region live in the catchments of the <strong>Orange</strong> <strong>River</strong>. It is estimated that about<br />
170,000 people live in the various catchments of the <strong>Orange</strong> <strong>River</strong> in Namibia, with<br />
some 25% of these being urban and about 125,000 people being rural.<br />
Namibia’s average per capita income of US$ 1,800 (2004) ranks it as a lower middleincome<br />
country. This categorization, however, masks the large social and<br />
environmental debts that Namibia inherited from 100 years of colonial history and<br />
almost half a century of apartheid. Its Human Development Index is 0.65 (0.75 in<br />
urban and 0.57 in rural areas), its Human Poverty Index is 25 (17 in urban, 29 in rural<br />
areas), and its Gini Coefficient, which provides a measure of equity in society, is 0.67,<br />
13/11/2007 Final<br />
105
<strong>Orange</strong> IWRMP<br />
Task 7: Environment<br />
which is of considerable national concern. In essence, some 0.3% of the population<br />
own 40% of the land, and 5% earn almost 70% of the income. High levels of poverty<br />
exist. In 2003, the estimated level of literacy was 84% (male: 84.4%; female: 83.7%).<br />
life expectancy averaged 43.9 years (male: 44.71 years; female 43.13 years).<br />
Most of the land in the catchments consists of freehold and communal farmland. The<br />
communal areas are centered on Aminuis, Bersiba, near Karasburg and Warmbad.<br />
Apart from some very limited and intensive crop production under irrigation near<br />
Mariental (Hardap Dam), at Naute Dam, along the <strong>Orange</strong> <strong>River</strong> and along the<br />
ephemeral Auob <strong>River</strong> near the village of Stampriet, the vast majority of the land is<br />
extensive rangeland livestock and wildlife farming within indigenous ecosystems.<br />
Cattle predominate in the north around Gobabis, Khomas and Okahandja areas, while<br />
mainly sheep and goats are farmed in the more arid south. The mean carrying<br />
capacity (stocking biomass) of this zone is low, ranging from about 25 kg/ha in the<br />
extreme north and east of the zone to less than 10 kg/ha in the south and west.<br />
Because of the low and highly variable rainfall in this zone, the carrying capacity also<br />
varies considerably from year to year. As a result, over 75% of the Central-South zone<br />
is rated as falling into an area defined as being at “high to very high risk” for<br />
conventional farming.<br />
5.2 Conservation Areas<br />
Land under State Protected Areas (National Parks) in this zone is found mainly in the<br />
extreme western and southern areas (Figure 5.2). These areas were set aside<br />
because they were unsuitable for farming, being too arid and too mountainous. The<br />
largest park in the zone and in Namibia, and one of the largest in the world is the<br />
Namib-Naukluft Park (5.07 million ha), which falls west of the escarpment and thus just<br />
outside the <strong>Orange</strong> <strong>River</strong> catchments. Within the catchment area is the Huns<br />
Mountains/Ai-Ais/Fish <strong>River</strong> Canyon Park complex, the extreme southern part of the<br />
Sperrgebiet National Park (approved by Namibia’s Cabinet as a protected area of<br />
some 2.6 million ha, but still to be formally gazetted), the Naute Dam and Hardap<br />
Resort. The Ai-Ais Complex borders onto the Richtersveld Park in South Africa,<br />
immediately south of the <strong>Orange</strong> <strong>River</strong>, and the governments of South Africa and<br />
Namibia have entered into an agreement to develop them into a transfrontier<br />
conservation area to promote tourism, job creation and conservation.<br />
In addition to the State Protected area network there are a number of community and<br />
private initiatives that enhance biodiversity conservation in the zone. These include<br />
conservancies, both on freehold and communal land, and private nature reserves.<br />
13/11/2007 Final<br />
106
<strong>Orange</strong> IWRMP<br />
Task 7: Environment<br />
There are three registered and one emerging communal conservancies in the Karas<br />
region, and a host of freehold conservancies mainly in the Khomas and Gobabis<br />
areas. In addition, there is one large private reserve adjacent to the Fish <strong>River</strong><br />
Canyon, the Gondwana Cañon Park.<br />
5.3 Environmental Challenges<br />
Over the past five years Namibia has undertaken a plethora of consultations,<br />
assessments and reviews of the main environmental and sustainable development<br />
challenges facing the country, particularly in the semi-arid and arid areas. The results<br />
from these consultative processes have been mutually reinforcing, and the views of<br />
local land and natural resource owners and managers, support agencies (government<br />
and civil society) and various specialists are well known, documented and largely in<br />
agreement. These processes have fed into a range of national planning documents,<br />
including Namibia’s second five-year National Development <strong>Plan</strong>, the National Poverty<br />
Reduction Strategy and Namibia’s 30 year Vision 2030. Recent consultative<br />
assessments in the Fish <strong>River</strong> catchment of the Karas and Hardap regions prioritized<br />
the following challenges:<br />
• Unsustainable land management practices, particularly<br />
• Overgrazing<br />
• “Deforestation” (loss of woody vegetation)<br />
• Limited and limiting water resources, particularly<br />
• Limited sources<br />
• Poor management and infrastructure<br />
• Tenure rights over land and natural resources, with the need for full devolution<br />
to lowest appropriate level being paramount<br />
• Contradictory policy environment over land and natural resources<br />
• Need for diversification in land use, going hand-in-hand with a need for<br />
enhanced entrepreneurial skills<br />
• Limited capacity, skills and access to finances<br />
• HIV/Aids<br />
A clear manifestation of these challenges is poverty and a poor quality of life, and an<br />
inability for rural communities to extract themselves from the poverty trap.<br />
13/11/2007 Final<br />
107
<strong>Orange</strong> IWRMP<br />
Task 7: Environment<br />
5.3.1 Unsustainable land management practices<br />
The following have been distilled and reformulated from the above:<br />
• Ecosystem integrity: Land degradation poses a risk to ecosystem integrity in<br />
fragile dryland environments, defined in terms of health, connectivity and<br />
stability, biotic and abiotic components of ecosystems and the<br />
interconnectedness between them. This is likely to diminish the ability of<br />
dryland environments to supply vital ecological goods and services, including<br />
climate regulation and water regulation. In particular efforts to stem<br />
deforestation (loss of woody vegetation – there are no forests in Namibia, but<br />
rather open to sparse woodlands to dwarf shrubs) are likely to reduce the<br />
expected increase of surface albedo on cleared land. Such efforts coupled<br />
with efforts to reduce the loss of other vegetation cover and soil erosion are<br />
further expected to help maintain the capacity of soils to maintain moisture<br />
and reduce the release of soil particulates into the atmosphere. This will help<br />
to maintain air quality and regulate climate.<br />
• The loss of above- and below-ground biomass as a result of deforestation and<br />
the increase of decaying vegetation matter on cleared land contribute to the<br />
release of Green House Gases (GHG) and the reduced capacity of savannas<br />
to function as a carbon sink. In 1994, Namibia was estimated to be a net sink<br />
for carbon due to the large uptake of CO 2 by trees and its contribution of less<br />
than 0.05% to global CO 2 -equivalent emissions.<br />
• <strong>Water</strong>shed integrity is severely impaired through deforestation and other<br />
forms of degradation. <strong>Water</strong> harvesting places additional stress on Namibia’s<br />
few perennial rivers which are all transboundary. In the long-term,<br />
uncontrolled abstraction is likely to have serious downstream impacts, with<br />
economic and ecological consequences, which are not, limited to Namibia but<br />
extend into the southern African region.<br />
• Land degradation is impairing ecological functions and habitat quality in<br />
critical ecosystems that contain biological diversity of global importance. One<br />
of Namibia’s two ecosystems that are internationally recognized as<br />
biodiversity “hotspots” due to their high degree of endemnicity with respect to<br />
plants and animals, falls partly into the <strong>Orange</strong> <strong>River</strong> catchment. This is the<br />
Succulent Karoo, which represents the only global arid hotspot.<br />
13/11/2007 Final<br />
108
<strong>Orange</strong> IWRMP<br />
Task 7: Environment<br />
Overgrazing<br />
Despite the country’s severe climatic constraints, a significant percentage of the land is<br />
used for agriculture, mainly livestock farming in the south. For a number of reasons,<br />
including overstocking, poor management, lack of mobility due to land be divided into<br />
farming units, past drought subsidies, poor access to markets, etc. there has been<br />
considerable rangeland degradation Rangeland degradation manifests itself in two<br />
contradictory forms: loss of vegetation cover on the one hand and bush encroachment<br />
on the other. In the south of Namibia, the former is by far the dominant expression of<br />
degradation. Loss of vegetation cover is perhaps the most obvious indicator of<br />
rangeland degradation, ranging from the loss of grass species diversity and perennial<br />
grasses, a loss of grass vigor to a loss of ground cover and land productivity,<br />
increasing vulnerability to drought and facilitating encroachment of undesirable plants.<br />
In Namibia there are two interrelated causes for loss of vegetation cover: overstocking<br />
- which describes the situation where more animals are kept on a certain piece of land<br />
than there is fodder available to feed them; and overgrazing – which is caused when<br />
animals are concentrated in one specific area for too long, resulting in over use of the<br />
vegetation with inadequate recovery time. Open access to land and unsuitable<br />
distribution of water and boreholes is one major factor for the latter.<br />
Deforestation<br />
Deforestation is the second major form of vegetation degradation in Namibia, and<br />
refers to the removal of woody vegetation cover. Its consequences are loss of habitats,<br />
changes in hydrological and nutrient cycles, and reduction in carbon sinking<br />
capacities. Deforestation in Namibia is most prevalent in the North and North Central<br />
regions than in the south, but because of the limited woody resources in the south, and<br />
their very slow rates of growth, even modest levels of tree harvesting has a significant<br />
impact. The predominant fuel for cooking still remains fuel wood.<br />
Soil degradation<br />
Another set of threats relate to soils: the predominant factors of soil degradation in<br />
Namibia are soil erosion due to wind and water factors and declining soil fertility and<br />
loss of soil organic matter.<br />
Soil erosion due to wind and water factors occurs when top soil is blown or washed<br />
away by wind or water (i.e. heavy rainfalls) mainly in areas of poor rangeland<br />
management. It leads to the removal of top soil thus decreasing land productivity. It is<br />
13/11/2007 Final<br />
109
<strong>Orange</strong> IWRMP<br />
Task 7: Environment<br />
widespread given Namibia’s naturally thin vegetation cover especially in the central<br />
and southern parts of the country.<br />
Declining soil fertility and loss of soil organic matter refers to the deterioration in the<br />
quality of soils due to loss of nutrient and water retention capacity and leads to loss of<br />
soil fertility and ability to support plant life which in turn exacerbates vulnerability to<br />
wind and water erosion. The soils in Namibia generally have low natural fertility, are<br />
humus-poor, shallow, sandy and stony and have low water retention capacity. These<br />
characteristics impact on the natural soil condition, making it more prone to fertility<br />
degradation. Even those areas classified within Namibia as being of “high” soil fertility<br />
do not rate highly globally. Small-holder cultivation and large scale irrigated agricultural<br />
projects are major causes of soil productivity loss.<br />
Over abstraction of water<br />
In the area of water management, over-abstraction of water has immediate<br />
implications for the natural environment given the intricate relation between nutrient<br />
and water cycles. Disrupting these cycles through, for example, inappropriate irrigation<br />
methods, leads to reduced soil fertility and productivity through loss of nutrients and/or<br />
salinisation and water logging. Lowering of groundwater levels hampers the ability of<br />
plants to take up water and leads to the desiccation of springs and, consequently,<br />
destruction of habitats. Furthermore, it may reduce fluid pressure in confined/artesian<br />
aquifers and cause aquifer deformations through the compaction of geological<br />
material. An essential basic additional ‘use’ of water, often not accounted for in water<br />
consumption breakdowns, is the ecological reserve of water needed to sustain critical<br />
wetland and terrestrial ecosystems. The two major demands on water supply are<br />
urban centres and agriculture. Between them these two sectors account for almost<br />
91% of Namibia’s water demand. Despite its modest contribution to GDP, agriculture<br />
accounts for about 60% of all water used in Namibia. Crop irrigation alone accounts for<br />
almost 40% of all water use, and there are plans to expand this use further. One of the<br />
most pressing problems is the maintenance of the thousands of boreholes in remote<br />
communal areas. Government has not had the resources to maintain all these<br />
boreholes and has introduced a Community Based <strong>Management</strong> programme in which<br />
villagers, led by a <strong>Water</strong> Point Committee, will be expected to pay the recurrent costs<br />
of maintaining water point installations in future.<br />
13/11/2007 Final<br />
110
<strong>Orange</strong> IWRMP<br />
Task 7: Environment<br />
Climate change<br />
The most significant “external factor” to impact of environmental and sustainable<br />
development issues in the south of Namibia is likely to be that of climate change. The<br />
impact of these anthropogenic threats is exacerbated by natural vulnerability in the<br />
form of rainfall variability and drought. This natural vulnerability is likely to be<br />
aggravated by the effects of human induced global climate change. Based on the initial<br />
National Communication to the United Nations Framework Convention of Climate<br />
Change (UNFCCC) (July 2002), in the worst case scenario for the year 2100 predicts<br />
the range of mean annual temperature increase for the central plateau region to be<br />
4.5-6°C above the 1961-1990 mean temperature, while a more optimistic simulation<br />
estimates a rise of 2-3°C. There is less agreement amongst the various models<br />
regarding future rainfall. The greatest impact is projected to occur in the central and<br />
southern areas. Evaporation rates are also estimated to increase by around 5%.<br />
These impacts threaten Namibia’s water supply in general and water dependent<br />
activities such as agriculture and mining, in particular. Namibia’s wetlands have been<br />
identified as the ecosystems most vulnerable to climate change. Although Namibia<br />
itself is a small contributor to greenhouse gas emissions, it has to be able to adapt to<br />
future changes in conditions in order to avoid large economic, social and<br />
environmental costs from climate change.<br />
Two specific projects to be undertaken in livestock and crop production within the<br />
framework of adaptation to climate change. These include, firstly,<br />
development/adaptation and use of agricultural production models for arid-land crops<br />
and livestock in hot and arid environments, and secondly, the testing and<br />
dissemination of heat, drought and salt tolerant crop cultivars and livestock breeds.<br />
In summary, inappropriate land uses and agricultural practices are the main factors<br />
which underlie Namibia’s land degradation; however, these causes are only symptoms<br />
of actual root problems at a structural level, which as the figure below shows, are<br />
tightly interlinked with each other (Figure 5.3). Ultimately, it is poverty mainly on<br />
communal lands, linked to the need for agricultural and industrial expansion at a<br />
national level, but also diversification away from agriculture in the more arid areas that<br />
will alleviate pressure on land and natural resources, combat desertification and start<br />
to counteract poverty.<br />
13/11/2007 Final<br />
111
<strong>Orange</strong> IWRMP<br />
Task 7: Environment<br />
P R E S S U R E<br />
O N L I M I T E D<br />
R E S O U R C E S :<br />
W a t e r , s o i l ,<br />
w i l d l i f e .<br />
P o p u l a t i o n g r o w t h<br />
a n d / o r h i g h<br />
c o n s u m e r i s m<br />
P R E S S U R E<br />
T O E X P A N D<br />
A G R I C U L T U R E<br />
A N D<br />
I N D U S T R Y<br />
P O V E R T Y<br />
a n d r e d u c e d<br />
l i v e l i h o o d<br />
o p t i o n s<br />
R A P I D<br />
U R B A N I S A T I O N<br />
E N V I R O N M E N T A L<br />
D E G R A D A T I O N<br />
s o il e r o s io n , d e s e r t if ic a t io n<br />
b i o d i v e r s i t y l o s s , d e f o r e s t a t i o n ,<br />
d e c l i n i n g w a t e r q u a n t i t y<br />
a n d q u a l i t y<br />
T h r e a t s t o<br />
h u m a n h e a l t h<br />
I n c r e a s i n g<br />
P O L L U T I O N<br />
U n e m p l o y m e n t<br />
a n c r i m e<br />
d<br />
C L I M A T E<br />
h t e m p r a H i g e t u r e s<br />
lo w r a in f a ll<br />
p e r i o d i c d r o u g h t<br />
h i g h v a r i a b i l i t y<br />
Figure 5-3: Some of the interlinked issues that underpin unsustainable land and<br />
natural resource management<br />
5.3.2 Land Degradation on Communal Land<br />
Traditionally, livelihoods have been based on the use of natural resources through<br />
livestock husbandry and cultivation of land. Land management practices had evolved<br />
to adapt to the physical conditions of Namibia’s climate and historically resource use is<br />
considered to have been largely sustainable. Today, people on Namibia’s communal<br />
land still largely lead subsistence lifestyles, due to the absence of employment and<br />
other significant monetary incomes. As affordable alternatives are not available, food,<br />
fuel, housing materials, and even medicines are extracted directly from the land, in<br />
most cases barely covering the needs of the respective resource users. Dependence<br />
on the exploitation of natural resources locks residents into a cycle of short-term overexploitation<br />
of resources. Traditional land use practices are increasingly marginalized:<br />
rainfall, and therefore the availability of fodder in Namibia are highly variable in terms<br />
of time and space. In the past, communities employed a flexible rangeland<br />
management system, moving herds to distant pastures to benefit from better rainfall<br />
and grazing. Given severe demographic pressures, sedentarisation is now a reality in<br />
most of the communal areas of the country, and there is little scope for stock farmers<br />
to return to the more nomadic lifestyles of the past.<br />
Currently the capacities of communities to make informed management decisions are<br />
limited. An easy to operate, locally based decision-support system providing<br />
information on important parameters like rangeland condition, bush densities, carrying<br />
13/11/2007 Final<br />
112
<strong>Orange</strong> IWRMP<br />
Task 7: Environment<br />
capacity, livestock condition and rainfall, is urgently needed. Based on their own<br />
information, collected by themselves, resource users should be able to identify<br />
problem areas and make appropriate mitigation decisions (e.g. marketing of livestock,<br />
movement of livestock to key resource areas, additional fodder supply, etc).<br />
Knowledge is necessary but not sufficient for sustainable land management.<br />
Especially where sustainable land management involves investments of time and<br />
money (even if only initially) favourable (economic) incentives are also required.<br />
Land Tenure<br />
Land tenure issues and ensuing consequences for land management, are pervasive<br />
throughout Sub-Saharan Africa. In Namibia, communal land is owned by the State,<br />
while its residents have usufruct rights over the land and its resources such as grazing.<br />
Heretofore, land use has been governed by traditional leaders. However, group rights<br />
and their enforcement have weakened and this undermines the ability of many<br />
residents to prevent appropriation of their land by wealthy individuals and settlers and<br />
herders from other areas. In the north central regions there are conflicts between<br />
residents wishing to expand their croplands and others who wish to maintain extensive<br />
grazing areas. As government to this date has refrained from introducing a formal land<br />
tenure system for communal lands, previously controlled community management of<br />
land has turned into an open-access system. Open access to resources implies that<br />
the value of a resource is only secured and internalised by individuals through<br />
exploitation, while its preservation or even investment for securing or improving future<br />
productivity is not simply an inter-temporal consumption decision, but induces the risk<br />
that the investor incurs a loss when the respective returns on this investment are<br />
internalised by other resource users - the so called free rider problem. Open access,<br />
its ensuing risks to investments and the inability of communities to coordinate land use<br />
planning at a larger scale is impeding sustainable development in communal areas.<br />
Apart from land tenure, thin or absent markets in the rural economy lead to coping<br />
strategies, which are not often sub-optimal from the perspective of sustainable land<br />
management. Markets and market infrastructure for other indigenous products (e.g.<br />
reeds, crafts, skins) are little developed if existing at all, and participation of the local<br />
communities in these are highly dependent on outside support. Where markets exist<br />
they value pure extraction but not sustainable use, thus again leading to<br />
overexploitation of the resources. In other words, markets which create a present<br />
value to future consumption, i.e. attach a value to the sustainable use of resources and<br />
the preservation of ecosystems hardly exist. The absence of these markets limits the<br />
13/11/2007 Final<br />
113
<strong>Orange</strong> IWRMP<br />
Task 7: Environment<br />
opportunities of rural people to diversify their livelihoods away from livestock<br />
production or extensive dryland cultivation. At the same time, limited rural financial<br />
markets restrict saving and borrowing possibilities. Commercial banks do not provide<br />
adequate banking facilities to communal farmers on a regular basis, which leaves<br />
farmers with few options other than to re-invest their money in livestock; the absence<br />
of insurance markets implies that a strategy of maintaining large livestock numbers is<br />
favoured by farmers to minimise risks in times of external shocks. Thus, the absence<br />
of credit and insurance markets again leads to overstocking on the one hand, and<br />
diminishes the capacity of farmers to invest in their land.<br />
5.3.3 Land Degradation on Commercial Land<br />
Most freehold land is used for livestock farming that was heavily subsidized in the past.<br />
Despite an average size of 7,000 ha, many freehold farms are not economically viable<br />
because of the semi-arid to arid environmental conditions: it has been estimated that<br />
as much as 60% of these farms are not profitable. This is particularly true for the south<br />
of Namibia where, in dry periods, over 50% of farmers leave their land to seek<br />
employment. Again, a number of (economic) reasons can be identified that lead to the<br />
inefficient use of resources (rangeland) on commercial farmland. In the past, livestock<br />
subsidies on commercial farms led to overstocking. Although these subsidies have<br />
largely been phased out, the legacy (land degradation mainly in the form of bush<br />
encroachment and overgrazing) is still apparent. A main challenge is therefore the<br />
rehabilitation of farmland to regenerate their productivity. However, again, there are<br />
various obstacles to sustainable land management. Farmers expecting to sell land<br />
under the Government’s willing buyer willing seller scheme, pursued as part of its land<br />
reform initiative may have little incentive to invest in land rehabilitation, perceiving that<br />
the benefits accruing to them will not outweigh the costs. Second, technologies to<br />
restore degraded land are complex and often require a reduction in stock to allow the<br />
veld to recover, thereby reducing short-term income.<br />
5.3.4 Closing the circle: Poverty, land degradation and eroding livelihoods<br />
The actual impacts on livelihoods of land degradation in communal areas are difficult<br />
to measure given the complex interactions between the bio-physical environment and<br />
socio-economic conditions, and manifold non-monetary goods and services that local<br />
communities derive from natural resources, not to speak of non-use values (e.g.<br />
cultural / spiritual value of resources). However, one cost estimation of losses of the<br />
most basic goods, shows that continuing land degradation severely impacts on rural<br />
livelihoods, as depicted in the Table 5.2.<br />
13/11/2007 Final<br />
114
<strong>Orange</strong> IWRMP<br />
Task 7: Environment<br />
Table 5-2: Some costs of land degradation incurred to households per year<br />
Item Explanation Cost per year (N$)<br />
Lost fuelwood supply<br />
Lost fencing<br />
materials<br />
Lost livestock (lack<br />
of access to grazing,<br />
drought)<br />
Cost of commercially purchased fuelwood 1bundle / day<br />
at N $2<br />
Cost of purchasing wire and poles for replacing 1/5 of<br />
fence around mahangu field<br />
720<br />
Replacement cost of 2 cattle / 3 goats 480<br />
400-640<br />
Lost milk output Cost of purchasing substitute protein plus loss in income 300-600<br />
Total 1,900-2,440<br />
Source: DEA Research Discussion Paper No 3 (1994)<br />
It has been estimated that land degradation on commercial farms leads to a loss of 34<br />
000 tonnes of beef production per year (worth N$ 102 million in 1994 prices ibid). This<br />
loss, of course, has direct national economic impacts regarding the overall level of<br />
output, export and tax revenues.<br />
Opportunity costs arising from the loss of foregone benefits that higher value and<br />
sustainable land uses could derive, could even be more significant however. At this<br />
point these have not been clearly established. Preliminary studies into alternative land<br />
use options show that non-agricultural resource use in Namibia’s communal lands has<br />
significant potential to contribute to economic growth. The aggregate economic value<br />
for four study areas (located in former Damaraland, in the Opuwo District, the Caprivi<br />
Region, and former Bushmanland) was N$8.5 million (Barnes (1995)). With the<br />
realisation of non-agricultural potential (especially wildlife based tourism), this could<br />
increase by 2.5 times. The recently published State of Conservancy <strong>Report</strong> shows that<br />
for the past five years total income from wildlife based conservancies increased from<br />
about N$0.6 million in 1998 to over N$ 8 million in 2003, N$14 million in 2004 and a<br />
projected N$19 million in 2005, comprising cash income as well as non-cash income<br />
derived mainly from wildlife management and wildlife based tourism. Directly and<br />
indirectly, the Namibian economy earned about N$ 111 million from community-based<br />
natural resource management activities in communal areas in 2003. These incomes<br />
are based on wildlife only, while there is more economic potential arising from other<br />
resources such as indigenous plants, e.g. Hoodia species.<br />
As the above analysis shows, the physical impacts of land degradation occur at locallevel<br />
while much of the impetus (or root cause policy failures) is derived at the national<br />
13/11/2007 Final<br />
115
<strong>Orange</strong> IWRMP<br />
Task 7: Environment<br />
level. Some of this is a legacy of the past (land tenure and land distribution) others<br />
arising from present policy preferences which adhere to an economic development<br />
paradigm (agriculture as the engine of growth and poverty eradication to be<br />
implemented through initiatives such as the Green Scheme) which is sub-optimal given<br />
Namibia’s climatic circumstances. At the bottom line however, it clearly shows: poverty<br />
at local and resulting economic aspirations at national level lead to land degradation,<br />
which in turn erodes livelihoods. Given these inter-linkages, combating land<br />
degradation in new and innovative ways must form an integral part of any feasible<br />
poverty reduction strategy as well as any sustainable development strategy.<br />
5.3.5 Barriers to Sustainable Land <strong>Management</strong><br />
From this range of management issues, five key barriers that impede sustainable land<br />
management can be identified.<br />
Systemic capacity<br />
The existence of policies that contradict the objective of sustainable land management<br />
and rural development creates adverse incentives that work against SLM. Specific<br />
issues that need to be addressed through policy review are the lack of tenure rights<br />
over land, management control over natural resources, and rural development/<br />
agriculture policy. However, just as pressing as the review of the current policy set up<br />
is the process of implementing policies – moving from paper to practice: while Namibia<br />
has taken several important steps on paper, these need to be brought to the ground<br />
and strengthened through appropriate enforcement. Finally, where policies are in<br />
place, lack of knowledge and awareness as well as frictions between official and<br />
customary law at the local-level, where many policies need to be executed, create<br />
obstacles.<br />
Institutional capacity<br />
Rural people and communities manage the land and its natural resources. Their<br />
decisions and actions will, to a major extent, determine whether land-use options and<br />
management will be sustainable and optimal – both for the environment and<br />
themselves. Such decisions are taken within various policy settings, knowledge<br />
systems and the day to day modus operandi of the communities and their support<br />
organisations, such as the extension services of government Ministries. The<br />
management effectiveness of these institutions regarding sustainable development is<br />
impeded at several levels. Centralised management of planning and implementation of<br />
activities creates one of the strongest barriers. Land-use planning and natural resource<br />
13/11/2007 Final<br />
116
<strong>Orange</strong> IWRMP<br />
Task 7: Environment<br />
management fall under the jurisdiction of several different Ministries, including Ministry<br />
of Lands and Resettlement (MLR); Agriculture, <strong>Water</strong> and Forestry (MAWF); Regional<br />
and Local Government and Housing and Rural Development (MRLGHRD); and<br />
Environment and Tourism (MET). There are no mechanisms in place to facilitate<br />
integrated multi-sectoral planning, and Ministries often inadvertently undermine one<br />
another’s initiatives. Also, on the few occasions that ministry’s do come together to<br />
plan, the resultant approach is usually heavy-handed, top-down and disempowering<br />
for local communities. Regional and local authorities have weak institutional mandates<br />
and lack the financial resources, skills and equipment necessary to perform their<br />
functions. They consequently fail to provide adequate support to their constituencies.<br />
At the same time, strong institutional mechanisms at local community level for land and<br />
natural resource management are lacking.<br />
Individual Capacity<br />
Namibia has limited human capacity, i.e. skilled individuals capable of turning rhetoric<br />
and goodwill into effective action on-the-ground, particularly in the rural and more<br />
remote areas. At local and regional level, there is an overwhelming need for general<br />
education, while at national level the lack of technical experts such as experienced<br />
water and land technicians and scientists, development specialists and natural<br />
resource economists was identified as a severe constraint. Across sectors,<br />
understanding of the interlinked causes of land and environmental degradation and the<br />
principles of integrated land and resource management are lacking. One critical factor<br />
that aggravates the low availability of specialists is the brain drain, i.e. the loss of<br />
motivated and skilled people to better paying international institutions and businesses,<br />
with the ensuing consequence that the Namibian government is highly dependent on<br />
costly external consultants, donor and NGO expertise. A further barrier to the<br />
continuous learning process necessary to maintain a high calibre workforce stems<br />
from the access to information and technology, which derives partly from the fact that<br />
knowledge is not owned at the level it pertains to but often rather by outsiders and<br />
more importantly, that information systems are generally weak where they exist and<br />
not easily accessible to managers on the ground.<br />
Knowledge and Technology<br />
Related to the lack of individual capacity is the limited availability of M&E systems that<br />
provide information on economically and environmentally efficient land and natural<br />
resource use, and guidelines for adaptive resource management. Especially in a<br />
climatic environment such as Namibia’s where successful sustainable resource<br />
13/11/2007 Final<br />
117
<strong>Orange</strong> IWRMP<br />
Task 7: Environment<br />
management is, to a large extent, dependent on swift adaptation to changes in<br />
weather conditions, the ability to monitor and evaluate the risk of desertification is<br />
critical, as is knowledge about best management practices. A second element that<br />
determines adaptive management is the ability of resource users and managers to<br />
track impacts. Namibia in this regard faces a number of barriers: firstly, information for<br />
adaptive management is not generated on a reliable basis at any level, be it national or<br />
local, scientific or applied; secondly, where information is generated and lessons are<br />
learned, these are not communicated and disseminated across the country and<br />
beyond to facilitate adaptive management and the diffusion of technology and<br />
innovation. Given the uncertainty associated with the impacts of global climate change,<br />
information on changes in resource state becomes even more critical.<br />
HIV/AIDS<br />
Lastly, HIV/AIDS is a new factor that creates a barrier to sustaining institutional and<br />
individual capacity for land and associated resource management. Namibia is one of<br />
the top four countries in the world most affected by HIV/AIDS, with an estimated<br />
prevalence rate of 25% of the adult population. This has enormous social implications:<br />
there are already an estimated 100,000 AIDS orphans and it is predicted that between<br />
1985 and 2020, 26% of the labour force in Namibia will be lost to HIV/AIDS. For every<br />
person lost, traditional knowledge and mechanisms for coping with climatic and<br />
general variability are lost. When this knowledge disappears basic subsistence<br />
becomes more difficult and the risk to people’s livelihoods increases. The loss of<br />
skilled and unskilled personnel within the environmental management sector also has<br />
devastating effects on sustainable natural resource management, reducing its<br />
effectiveness and generally threatening those who rely on natural resources for their<br />
livelihoods. Further, losses in time and personnel due to HIV/AIDS are persistent and<br />
compounding, not random or isolated. Thus they weaken institutional memory,<br />
reducing the long-term integrity of natural resource management.<br />
In environmental terms, the loss in time, skills, experience and finances will result in<br />
degradation of the landscape. As the burden of HIV/AIDS increases, people begin to<br />
look for short-term solutions that often involve methods that are less well suited to the<br />
environment. For example, the loss of labour, and health, means that farmers are less<br />
able to spend time to move herds to distant pastures or to take time-consuming antierosion<br />
measures. Their options to generate income are compromised as they are<br />
forced to take emergency action by, for example, selling livestock at sub-optimal times.<br />
In short, the dual impacts of HIV/AIDS and environmental degradation lead to a<br />
13/11/2007 Final<br />
118
<strong>Orange</strong> IWRMP<br />
Task 7: Environment<br />
complex self-reinforcing cycle detrimental to livelihoods. Poverty and reduced<br />
livelihood options are interlinked factors influencing land degradation.<br />
5.4 A Focus on the <strong>Orange</strong> <strong>River</strong><br />
The estimated natural runoff of the <strong>Orange</strong> <strong>River</strong> Basin is in the order of 11 300 Million<br />
m 3 /a. Much of the runoff originating from the <strong>Orange</strong> <strong>River</strong> downstream of the<br />
<strong>Orange</strong>/Vaal confluence is highly erratic and cannot be relied upon to support the<br />
downstream water requirements unless regulation is provided. The portion of runoff<br />
originating from the Fish <strong>River</strong> in Namibia can support some of the downstream<br />
demands, particularly the environmental demands at the river mouth.<br />
The ecological condition of the river is deemed to be on a negative trajectory. The<br />
<strong>Orange</strong> <strong>River</strong> Mouth Wetland is designated a RAMSAR site and is on the Montreaux<br />
Record. The present Ecological Status of the Estuary is classed as “largely modified”.<br />
In Namibia, the majority of the present and future water demands from the <strong>Orange</strong><br />
<strong>River</strong> are for irrigation, with some increase in demands by mining. The availability of<br />
water along the <strong>Orange</strong> <strong>River</strong> is currently based on the regulation of water from the<br />
Vanderkloof Dam and cannot be guaranteed, especially when drought conditions<br />
prevail in the upper reaches of the <strong>Orange</strong> Basin. <strong>Water</strong> demand in 2002 was 102.3<br />
Mm 3 for irrigation and 23.9 Mm 3 for mining and urban use along the common border of<br />
the river.<br />
The Lower <strong>Orange</strong> common border water demands are likely to increase from 82 to<br />
122 Mm 3 /a on the South African side and 60 to 227 Mm 3 /a on the Namibian side, by<br />
the year 2025.<br />
At 2005-development levels and 2002 irrigation water use, it has been calculated that,<br />
to maintain the estuary at its present ecological status, there is currently a surplus yield<br />
of some 14 Mm 3 /a. To improve the ecological status of the estuary (from a category D<br />
to a C) would put the system into a 500 Mm 3 /a water deficit.<br />
Hydraulic river modelling indicated that the surplus yield in the system can be<br />
increased by 80 Mm³/a when real time modelling is used to optimise inflows from the<br />
Vaal more effectively. An increase in yield of 143 Mm 3 /a can be achieved by the<br />
utilisation of the lower level storage in Vanderkloof Dam below the minimum operating<br />
level defined by the outlets to the irrigation canals. The irrigation sector is the highest<br />
consumer of water in the Lower <strong>Orange</strong> <strong>River</strong> <strong>Management</strong> Study area and it also has<br />
the biggest potential for savings.<br />
13/11/2007 Final<br />
119
<strong>Orange</strong> IWRMP<br />
Task 7: Environment<br />
Investigations into a re-regulating dam at Vioolsdrif, Komsberg or a new dam at<br />
Boegoeberg, to reduce operating losses and therefore increase the allocatable yield<br />
suggests the Vioolsdrif option provides a significantly higher yield and lower unit<br />
reference value. Results from the economic analyses indicated that the Vioolsdrif Dam<br />
is the better option. This site was recommended as the best site for a large storage<br />
dam on the <strong>Orange</strong> <strong>River</strong> downstream of Vanderkloof Dam. It should be considered in<br />
the context of the whole <strong>Orange</strong> <strong>River</strong> Basin and compared with the alternative dam<br />
sites in the Upper <strong>Orange</strong>, which have been considered and provisionally<br />
recommended in other studies. A Vioolsdrif Dam would not be in place until 2015 at<br />
the earliest. The estimated capital cost of a hydropower station at the dam was R30<br />
Million, the maximum generating capacity 4.2 MW and the total annual power<br />
generation was estimated at 21.3 GWh. The estimated income is R 3.4 million/a,<br />
based on a selling rate of R 0.12 per kWh and a carbon emission reduction subsidy of<br />
R 0.04 per kWh.<br />
5.5 The Ecological Importance and Sensitivity of the Lower <strong>Orange</strong> <strong>River</strong><br />
Downstream of 20º Longitude to the <strong>Orange</strong>-Fish Confluence<br />
In an analysis of the median monthly flows in the previously termed middle <strong>Orange</strong><br />
<strong>River</strong>, with Boegoeberg Dam as point of reference, Benade (1993), using data from<br />
1914-01-01 to 1989-04-30, calculated that the natural flow patterns in the system<br />
showed an 82% summer (October to May) versus 18% winter (May to October)<br />
distribution. Minimum flow occurred during August (Wellington, 1933; Chutter, 1973;<br />
Benade, 1993) and maximum flow during February (Tomasson & Allanson, 1983;<br />
Benade, 1993), showing erratic flow peaks coupled with high silt loads (To-masson &<br />
Allanson, 1983). Statistically the ORS appears to display a one in 10 to 15 year<br />
episodic flood cycle (Benade, 1988), but floods can also occur every five to 10 years<br />
(Department of Information, 1971).<br />
Biological information mostly involves fish parasites and/or economically important<br />
organisms, such as the Simuliidae (Blackflies) and the snail intermediate hosts of<br />
Schistosoma (Bilharzia) and Fasciola (Fluke) spp. (Benade, 1993). Ag-new (1965)<br />
undertook a once-off survey of the invertebrates of the <strong>Orange</strong> <strong>River</strong> as a whole. Dr<br />
Rob Palmer documented some recent studies on ORS invertebrates whilst doing<br />
Blackfly control research and the Namibian National Museum compiled a checklist of<br />
freshwater invertebrates found within the Namibian borders.<br />
13/11/2007 Final<br />
120
<strong>Orange</strong> IWRMP<br />
Task 7: Environment<br />
The invertebrate populations appear to be rather homogenous throughout the entire<br />
length of the <strong>Orange</strong> <strong>River</strong> - ascribed to the unpredictable, erratic nature of the system.<br />
The occurrence of freshwater fish being infested by parasites, as well as an increase<br />
in fish parasite diversity, in the study area had been observed during fish surveys<br />
between 1985 and 1989 (Benade, unpublished data). This phenomenon is indicative<br />
of water quality deterioration. The <strong>Orange</strong> <strong>River</strong> system as a whole is relatively poor in<br />
indigenous freshwater fish species diversity. Presently, eight fish families are<br />
represented by 22 species.<br />
Dam construction and river regulation usually lead to increases in riparian agricultural<br />
activities, especially irrigation (catchment utilisation). This, in turn, will inevitably lead<br />
to agricultural pollution resulting in changes to the river oxygen content, pH, turbidity<br />
and conductivity.<br />
<strong>River</strong>bed degradation resulting from suspended solid precipitation caused by the<br />
combination of low flows (river regulation), high evaporation rates and high mineral<br />
content (agricultural and other pollution) leads to aquatic habitat degradation, which<br />
could be detrimental to the survival of certain indigenous, including endemic,<br />
organisms, while promoting the unwanted establishment of other indigenous, as well<br />
as alien, organisms.<br />
Increasing river regulation and catchment utilisation will result in increases in<br />
filamentous Phycophytes and blue-green alga (algal blooms), and will also promote<br />
habitat changes suitable for the encroachment and colonisation of plant species. It can<br />
be expected that further river regulation will enhance habitat possibilities for<br />
economically important invertebrates such as Blackflies, the snail intermediate hosts of<br />
Bilharzia and Fluke spp., mosquito’s, etc.<br />
Five of the six endemic <strong>Orange</strong> <strong>River</strong> fish species occur in this lower river section, of<br />
which one, Barbus hospes, is unique to the <strong>Orange</strong> <strong>River</strong> section between Aughrabies<br />
Falls and the <strong>Orange</strong> <strong>River</strong> Mouth. Three of the five endemic species, B. hospes, B.<br />
kimberleyensis and Austroglanis sclateri are Red Data listed. Although the other two<br />
endemics, B. aeneus and Labeo capensis, are fairly abundant and thus appear not to<br />
be threatened, they remain of concern because of their endemic status.<br />
5.6 <strong>Orange</strong> <strong>River</strong> Mouth Development <strong>Plan</strong><br />
The <strong>Orange</strong> <strong>River</strong> mouth is one of very few areas of sheltered shallow water along<br />
southern Africa’s arid Atlantic coastline, and a site considered important primarily for<br />
sustaining substantial numbers of waterbirds, including an appreciable number of Red<br />
13/11/2007 Final<br />
121
<strong>Orange</strong> IWRMP<br />
Task 7: Environment<br />
Data-listed species such as the Cape Cormorant, Damara Tern and Hartlaub’s Gull. In<br />
recognition of this exceptional ecological significance, the <strong>Orange</strong> <strong>River</strong> mouth was<br />
designated a Wetland of International Importance in terms of the Ramsar Convention<br />
on Wetlands in 1991. When Namibia designated its portion of the <strong>Orange</strong> <strong>River</strong> mouth<br />
a Ramsar site in 1995, it created the potential for this wetland to become the first<br />
jointly managed transfrontier Ramsar site in southern Africa. As a result of severe<br />
deterioration of the mouth’s general condition, and especially the salt-marsh<br />
component, the wetland has continued to deteriorate subsequent to its designation as<br />
a Ramsar site. This has resulted in the South African portion being placed on the<br />
Ramsar Convention’s Montreux Record, which lists wetlands in need of urgent<br />
conservation action.<br />
5.7 Heritage Sensitivity<br />
Any dam site within the region between 20 degrees longitude and the Fish <strong>River</strong><br />
confluence will cause some heritage impacts. The Richtersveld is archaeologically rich.<br />
Any inundation of the river valley will constitute a loss to the National Estate. The<br />
construction of the Vioolsdrif dam option will affect between 219 and 286<br />
archaeological sites. None of these are know to be unique or exceptional, and are<br />
thought to be representative of much of the lower <strong>Orange</strong> <strong>River</strong>.<br />
5.8 Sendelingsdrif Proposed Irrigation Scheme<br />
A 300 ha irrigation project proposed for the cultivation of table grapes and Barhee<br />
dates. The proposed site is located 15 km south east of the mining settlement of Rosh<br />
Pinah and 5 km north west of the <strong>Orange</strong> <strong>River</strong> at Sendelingsdrif.<br />
Expected impacts include:<br />
• Increased human settlement and harvesting within the riparian zone. The<br />
Rosh Pinah population has grown from 2,000 to 7,300 by June 2004. Apart<br />
from the mine, the population is also increasing due to in-migration from all<br />
over the country because of the real and perceived work opportunities offered<br />
by agriculture and, increasingly, tourism ventures in this south western corner<br />
of the country.<br />
• Potential conflict in land use between the proposed irrigation development<br />
and the Transfrontier Conservation Initiative.<br />
• Threats to biodiversity, particularly to endemic vegetation and endemic<br />
invertebrates known to occur in the project area.<br />
13/11/2007 Final<br />
122
<strong>Orange</strong> IWRMP<br />
Task 7: Environment<br />
• Cumulative impacts as a result of this and other existing and new<br />
developments with respect to water abstraction<br />
• The contribution of saline irrigation return flows to a deterioration in the water<br />
quality of the <strong>Orange</strong> <strong>River</strong>, in the absence of mitigation.<br />
5.9 Land Capability and Alternative Options<br />
In areas of low rainfall in Namibia significantly greater financial and economic returns<br />
can generally be earned from land uses and enterprises based on indigenous<br />
biodiversity than from conventional farming. Much of the Central-South lends itself to<br />
(a) tourism, based on scenic landscapes, wildlife, cultures and rural lifestyles, and (b)<br />
wildlife production, based on a suite of species and sometimes integrated with<br />
domestic stock farming. The area is predisposed to expand rapidly in these areas<br />
because:<br />
• national policy supports investment in, and land-use conversion to, wildlife<br />
and tourism, and there is now sufficient confidence in the sector that a critical<br />
mass of land owners/managers have embarked on these changes to good<br />
effect;<br />
• the tourism sector is growing (it is now the second most important contributor<br />
to the national economy, after mining) and so are the associated market<br />
opportunities;<br />
• government shows commitment to expand and open up the protected area<br />
network, which provides the anchor points for tourism and wildlife<br />
conservation and acts as a catalyst and engine for local and national<br />
development;<br />
• government shows strong support to conservancies and community-based<br />
initiatives in the wildlife and tourism sector, as foci for sustainable rural<br />
development.<br />
Special natural features<br />
The Central-South zone has a number of special features which, if linked together in<br />
intelligent and effective ways, would predispose the zone to rapid growth based on its<br />
tourism potential:<br />
• four deserts – the Namib, the Succulent Karoo, the Nama Karoo and the<br />
Kalahari, each with a number of diverse vegetation types;<br />
• the most plant-diverse desert in the world – the Succulent Karoo;<br />
13/11/2007 Final<br />
123
<strong>Orange</strong> IWRMP<br />
Task 7: Environment<br />
• large and linked protected areas, containing a large component of the most<br />
dramatic and diverse landscapes of the zone, including the Namib gravel<br />
plains, the Namib sand sea, the Sperrgebiet, and over 700 km of coastline;<br />
• Transboundary links with the Richtersveld in South Africa, and links via a<br />
continuous set of large coastal Parks into Angola – thereby being part of a<br />
three national protected landscape;<br />
• three Ramsar sites, being wetlands of international importance, at the <strong>Orange</strong><br />
<strong>River</strong> mouth (a site proclaimed in partnership with South Africa), Sandwich<br />
Harbour and Walvis Bay, the last two being the richest coastal lagoons on the<br />
southern African coast based on wetland bird counts;<br />
• the world’s second largest canyon – the Fish <strong>River</strong> Canyon;<br />
• the mystic Sperrgebiet, closed for almost a century, with its diamonds,<br />
dramatic coastline, historic buildings and mining history, and vast untouched<br />
wilderness areas;<br />
• the <strong>Orange</strong> <strong>River</strong>, cutting through deep gorges, on its way from the Lesotho<br />
highlands to the Atlantic Ocean – the next perennial river to the north being<br />
the Kunene 1,400 km away;<br />
• the largest area of sand dunes south of the Sahara stretching over some 350<br />
km and covering over 3.5 million ha;<br />
• spectacular and diverse open landscapes with rich topography, much of it<br />
readily accessible.<br />
The <strong>Orange</strong> <strong>River</strong> catchments in Namibia overlay a large part of the area described<br />
above, and the management and development of these catchments should be aligned<br />
with the larger Vision for the area. In addition, the focal area is particularly well<br />
equipped with respect to the following:<br />
• communications - an extremely good road network, linking to South Africa and<br />
Botswana, as well as to other destinations in Namibia and to the trans-Caprivi<br />
highway, good air links - international, within the country and within the zone,<br />
and good telecommunications and internet links;<br />
• services - ready access to car hire and travel agents, good banking, foreign<br />
exchange and credit card services, and good medical support and back-up;<br />
• established tourism routes and facilities – the main tourism attractions in the<br />
area including the Fish <strong>River</strong> Canyon, and the Sperrgebiet shortly to become<br />
13/11/2007 Final<br />
124
<strong>Orange</strong> IWRMP<br />
Task 7: Environment<br />
a very sought-after destination. There are a large number of guest and<br />
hunting farms in the area, and Luderitz is growing in popularity;<br />
• conservancies (both communal and freehold) and private game parks are<br />
expanding and proliferating, which creates opportunities for further tourism<br />
and conservation growth and partnership.<br />
The southern regions of Namibia have only relatively recently started attracting tourists<br />
in significant numbers, mainly to Sossusvlei and the Fish <strong>River</strong> Canyon. This can be<br />
seen in the nature of the developments in the south, particularly the fact that access to<br />
the parks is very limited, and there are relatively few tourism facilities in many areas.<br />
Some of the main challenges in the area, linked to the opportunities that addressing<br />
these challenges will create, include:<br />
Creating linkages – existing initiatives<br />
There are a number of reasons for linking different regions – some ecological, others<br />
economic and market related. The main ecological reasons are:<br />
• to cover adequate components of the biomass, habitats, micro-habitats,<br />
species and genetic variations, both in terms of diversity as well as in<br />
sufficient numbers to ensure that both ecosystems (in space) and evosystems<br />
(evolutionary systems – over time) function effectively;<br />
• to create space for movement. One of the most important adaptations to arid<br />
and unpredictable environments is the ability to move - far and fast. Most<br />
wildlife, particularly larger mammals and birds, are highly mobile and<br />
nomadic. Large open systems allow for such responses. Even in one of the<br />
largest parks in the world, the Namib-Naukluft park (over 5 million ha), large<br />
ungulates are restricted from moving eastwards in dry times, and die along<br />
the park boundary fence;<br />
• to accommodate wide-ranging species with large home ranges. The<br />
endangered Lappet-faced Vulture is at its highest density in the Namib-<br />
Naukluft Park. Yet this 5 million ha park does not contain the entire home<br />
range of a single pair. Birds expose themselves to the risk of persecution and<br />
poisoning on adjacent farmlands when they leave the park;<br />
• to make provision for climate change. The best response we have at this<br />
stage is to manage for open systems, create linkages and “corridors” for<br />
13/11/2007 Final<br />
125
<strong>Orange</strong> IWRMP<br />
Task 7: Environment<br />
plants and animals to move, disperse and colonize new areas as conditions<br />
shift.<br />
The main economic reasons are to create a diversity of marketing opportunities, to<br />
cater for a wide range of interests that are environmentally and socially acceptable<br />
(e.g. spectacular landscapes, geology, archaeology, flora – including specialist<br />
interests such as succulents, birding, wildlife, hiking, horse-riding, wilderness, off-road<br />
4x4 driving, photography, hunting, fishing, etc.), and to keep tourists gainfully occupied<br />
in the area for as long as possible, thereby creating wealth, the opportunity for further<br />
services and support industries and generating employment in the zone.<br />
The following linkages within the zone are important:<br />
• the Sperrgebiet National Park must work seamlessly with the Namib-Naukluft<br />
Park and the Huns Mountain/Ai-Ais/Fish <strong>River</strong> Canyon Park complex;<br />
• these parks should all seek linkages through partnership and mutual<br />
incentives with neighbouring private land owners, and take down fences to<br />
allow wildlife to move eastwards during dry periods;<br />
• the Fish <strong>River</strong> Canyon Park must work seamlessly with the Richtersveld Park<br />
in South Africa, and tourists should be able to move easily across the border<br />
from one side to another.<br />
New initiatives<br />
Most of the protected areas of Namibia were established prior to the science of<br />
biodiversity conservation. Indeed, most protected areas were established more<br />
because the land was deemed unsuitable for farming than for conservation<br />
imperatives. As a result, many vegetation types are very poorly represented, or entirely<br />
unrepresented in the protected area network (Table 5.1). In some cases, private<br />
nature reserves and conservancies make significant contributions to the percent of<br />
land held under conservation-friendly management, and this approach is in line with<br />
government’s call for “innovative approaches” to securing adequate coverage of all<br />
habitats for conservation.<br />
The Central-South zone contains the entire ranges of eight of the vegetation types that<br />
occur there.<br />
13/11/2007 Final<br />
126
<strong>Orange</strong> IWRMP<br />
Task 7: Environment<br />
Five vegetation types in two biomass have less than 2% representation in the state<br />
protected area network in this zone, with two of them being totally unrepresented.<br />
When taking into account the other forms of biodiversity-friendly land management<br />
such as private nature reserves and conservancies, one vegetation type remains<br />
totally unprotected (Dwarf Shrub – Southern Kalahari Transition), one is at just 0.4%<br />
(Southern Kalahari) and one is at 9.1% (Karas Dwarf Shrubland).<br />
In addition to vegetation types, there are some areas outside the protected network<br />
that are relatively rich in biodiversity and endemic species. The Karas Mountains<br />
south-east of Keetmanshoop has high plant diversity and endemism, as does the<br />
northern side of the <strong>Orange</strong> river from Noordoewer eastwards. This latter area is also<br />
rich in mammal endemics. The entire escarpment and transition zone is a rich zone of<br />
endemism.<br />
With these two aspects in mind it is clear that it would be highly desirable to secure<br />
representative components of the under-represented vegetation types in the areas<br />
with high diversity importance.<br />
Table 5-3: The priority vegetation types and recommended actions and targets to<br />
adequately protect biodiversity<br />
Biome<br />
Nama<br />
Karoo<br />
Vegetation<br />
type<br />
Dwarf<br />
Shrub<br />
Savanna<br />
Recommended actions<br />
1.8% in PAN (small parts of Fish <strong>River</strong> Canyon, Hardap & Naute). A<br />
further 1.8% receives high level of protection in a private nature<br />
reserve, and 12.5% in two emerging communal conservancies<br />
(Berseba & Behanie). An initial target of 4% of this vegetation type<br />
would be appropriate within the national Parks estate – through<br />
linkages of existing areas. This vegetation type is quite diverse across<br />
both north-south and east-west gradients. It would thus be beneficial<br />
to acquire land in a number of different places within the vegetation<br />
type. Options include: (a) north of the Fish Fiver Canyon Park, linking<br />
this to Naute; (b) land to the south (linking to Naute), west and north<br />
of the Berseba/Behanie communal conservancies; (c) land to the east<br />
of the Naukluft, creating an east-west landscape covering three<br />
vegetation types; and (d) land adjacent and to the west of Hardap.<br />
Options (a), (c) & (d) would be the preferred priorities - all three. Both<br />
the existing and future parks should be used to lever (through<br />
incentives and co-management options) compatible and biodiversity<br />
friendly land uses on adjacent land.<br />
13/11/2007 Final<br />
127
<strong>Orange</strong> IWRMP<br />
Task 7: Environment<br />
Biome<br />
Salt Pans<br />
Vegetation<br />
type<br />
Karas Dwarf<br />
Shrubland<br />
Dwarf<br />
Shrub –<br />
Southern<br />
Kalahari<br />
Transition<br />
Pans<br />
Recommended actions<br />
0.6% in PAN and a further 8.4% within communal conservancies<br />
(mainly !Khob!Naub). See recommendations under “Dwarf Shrub –<br />
Southern Kalahari Transition” to target Karas mountain and adjacent<br />
areas, thus linking this and next vegetation types. In addition to the<br />
Karas Mountain and adjacent area, the southernmost area in this<br />
vegetation type along the <strong>Orange</strong> <strong>River</strong>, is high in both diversity and<br />
endemics – plant and animal. The most strategic area to target is the<br />
Blydeverwacht Plateau and south to the <strong>Orange</strong> <strong>River</strong>, in the extreme<br />
south-eastern corner of Namibia. This would include a diversity of<br />
habitats including wetlands and riparian belt along the <strong>Orange</strong> <strong>River</strong>,<br />
and link to Augrabies National Park in South Africa, thereby creating a<br />
transboundary protected area. In addition, the area is close to the<br />
Araimsvlei and Onseepkans border posts and highways, making it<br />
ideally located for tourism purposes and lodge developments. Could<br />
be a good “joint venture” between public and private sectors, for land<br />
acquisition, tourism development and park management. In addition<br />
to about 2-3% of this vegetation type linked to the Karas Mountain<br />
area (see next vegetation type), an additional 2% should be acquired<br />
in the extreme south-eastern corner of Namibia and bordering on the<br />
<strong>Orange</strong> <strong>River</strong><br />
0% in PAN, and 0% under any other form of protection. Currently the<br />
only vegetation type in Namibia that enjoys absolutely no form of<br />
protection. Apart from some small ephemeral pans, there are no<br />
distinguishing features to this vegetation type and no significant<br />
routes, infrastructure, etc. At its north-western side it approaches the<br />
base of the Karas Mountains (Groot Karasberge). This small mountain<br />
range (inselberg) is a site high in plant diversity and endemism, and<br />
falls within the Karas Dwarf Shrubland, of which only some 0.6%<br />
occurs within the PAN. It is thus recommended that the Karas<br />
mountains and surrounding areas – to east and west - be the focal<br />
point for land acquisition, so that both vegetation types are<br />
represented and linked. An initial target of some 3-4% in the Dwarf<br />
Shrub – Kalahari Transition would be appropriate (and 2-3% at this<br />
linked site in the Karas Dwarf Shrubland – which together with part of<br />
the Karas mountain will made a highly diverse and interesting Karoo<br />
park. Incentives for neighbours to practice biodiversity friendly land<br />
uses and co-management approaches should be explored and<br />
implemented.<br />
95.8% of the surface area of pans in Namibia are contained within the<br />
PAN. While this seems impressive, it is heavily biased towards the<br />
Etosha and other large pans in the north-central parts of the country<br />
within the Etosha National Park. There are a series of smaller pans,<br />
particularly in the Karas Dwarf Shrubland north-east of Keetmanshoop<br />
and in the Southern Kalahari and its transition zones that are<br />
unprotected. It is not suggested that these areas should be targeted<br />
for inclusion in the PAN exclusively on the presence of ephemeral<br />
pans. However, it is recommended that pans should be one of the<br />
positive contributing factors considered when looking to acquire land<br />
in the underrepresented vegetation types of the Central-South zone. It<br />
is also recommended that the pans in this area should gain higher<br />
priority within the wetlands portfolio of the relevant MET staff and the<br />
Wetlands Working Group, to understand their role better and to<br />
develop, in partnership with land owners, appropriate management<br />
approaches.<br />
13/11/2007 Final<br />
128
<strong>Orange</strong> IWRMP<br />
Task 7: Environment<br />
Biome<br />
Acacia<br />
Tree-and-<br />
Shrub<br />
Savanna<br />
Vegetation<br />
type<br />
Southern<br />
Kalahari<br />
Recommended actions<br />
0% in PAN, 0.4% in freehold conservancies. One of the least<br />
protected vegetation types in Namibia. Well protected in South Africa<br />
and Botswana within the Kalahari Gemsbok Transboundary Park.<br />
With the opening of the Mata Mata gate and the flow of tourism traffic,<br />
there is considerable potential to link tourism and wildlife management<br />
in this area. The primary focus should be for public and private sector<br />
partners to acquire land in this area, and along the national border,<br />
with a future vision to incorporating a state/private sector land<br />
partnership within the current transboundary park, turning it into a<br />
three-nation initiative, and lifting the fence between Namibia and SA.<br />
By linking land in Namibia to the very large Kalahari Park, a 3-4%<br />
representation of this vegetation type in Namibia would be<br />
ecologically viable. In isolation, it would not. The linkage would also<br />
hugely promote its marketability and thus is economic viability.<br />
5.10 Conclusion<br />
Land and water management are the key challenges in the semi-arid and arid regions<br />
of southern Namibia. There is considerable evidence of environmental degradation.<br />
The symptoms, such as overgrazing, loss of biodiversity and woody vegetation, have<br />
root causes that generally are to be found in the socio-economic sectors and in policy<br />
failures. These range from tenure over land and resources to pricing and economic<br />
incentives to policy harmonization between sectors.<br />
In general terms, conventional agriculture has not been conducive to achieving<br />
sustainable rural development in the southern arid and semi-arid regions of Namibia.<br />
New land uses are becoming preferable, from a number of different perspectives.<br />
Wildlife and tourism is being seen as one of the most viable alternatives. It generates<br />
more income per hectare, it creates more and higher paying jobs, it allows for<br />
diversification and a range of capacity-building directions, it facilitates entrepreneurial<br />
skills and small and medium enterprises, and it is generally more environmentally<br />
friendly and sustainable. It also uses far less water than does agriculture, and adds<br />
considerable value to each cubic meter of water used – generally in the order of 5-15<br />
times more than in all but the highest end of the agricultural sector, e.g. grape<br />
production.<br />
13/11/2007 Final<br />
129
<strong>Orange</strong> IWRMP<br />
Task 7: Environment<br />
6 COMMON ENVIRONMENTAL ISSUES<br />
A synthesis of the environmental issues from Chapters 2 to 5 is indicated in Table 6.1.<br />
The main issues can be divided up into System Drivers and Habitat Response (Figure<br />
6.1).<br />
The major drivers in the <strong>Orange</strong> <strong>River</strong> Basin are as follows:<br />
• Altered flow regime or hydrology (dams. Interbasin transfers, Hydro-electrical<br />
flow releases, irrigation and mining abstraction)<br />
• <strong>Water</strong> quality (salanisation due to mines and irrigation diffuse return flows,<br />
nutrient build up due to agricultural use of fertilizers and irrigation diffuse<br />
return flows)<br />
• Geomorphology (river channel not being scoured due to reduced flood regime<br />
and changed seasonal flows)<br />
LAND USE<br />
CATCHMENT AND<br />
ATMOSPHERE<br />
SYSTEM DRIVERS<br />
WATER COLUMN:<br />
PHYSICO-<br />
CHEMICAL<br />
HYDROLOGY<br />
GEOMORPHOLOGY<br />
ECOREGIONAL REFERNCES<br />
FISH<br />
HABITAT ATTRIBUTES: INSTREAM AND RIPARIAN<br />
AQUATIC<br />
RIPARIAN<br />
INVERTEBRATES<br />
VEGETATION<br />
HABITAT<br />
BIOLOGICAL<br />
RESPONSES<br />
Figure 6-1: Typical habitat drivers and biological response for rivers.<br />
13/11/2007 Final<br />
130
<strong>Orange</strong> IWRMP Task 7: Environment<br />
Table 6-1: Major environmental aspects within the different counties of the <strong>Orange</strong> <strong>River</strong> basin<br />
Country Drivers Response<br />
Lesotho<br />
South Africa<br />
Hydrology<br />
Geomorpholo<br />
gy<br />
Flow changes Flow modifications Abstractions Flow<br />
modifications<br />
Interbasin transfers for<br />
drinking water supply<br />
Interbasin transfers for<br />
drinking and irrigation<br />
water supply<br />
Dams for water supply<br />
and hydropower<br />
Dams for water storage<br />
and hydropower,<br />
unseasonable winter<br />
flows, reduction in annual<br />
volumes, wet and dry<br />
seasons reduced, lack of<br />
flow variability<br />
Irrigation and<br />
mining<br />
abstractions<br />
Botswana Irrigation<br />
abstractions<br />
Namibia Unseasonable winter<br />
flows, reduction in annual<br />
volumes, wet and dry<br />
seasons reduced, lack of<br />
flow variability<br />
Dams trapping<br />
sediments<br />
Floods<br />
masked by<br />
dams reduce<br />
scouring and<br />
sediment<br />
transfer,<br />
islands due to<br />
sediment<br />
deposits,<br />
reeds in river,<br />
channel<br />
encroachment,<br />
flood<br />
attenuation<br />
capacity<br />
reduced<br />
Irrigation and<br />
mining<br />
abstractions<br />
<strong>Water</strong><br />
quality<br />
Nutrient,<br />
temperatures<br />
changes,<br />
enrichment<br />
Salinisation<br />
Pesticides<br />
Nutrient<br />
enrichment<br />
Salinisation<br />
Pesticides<br />
Species diversity<br />
Habitat inundation<br />
by dams<br />
Artificial flows,<br />
species<br />
threatened, salt<br />
marsh lost<br />
RAMSAR status<br />
Salt marsh lost<br />
RAMSAR status<br />
Increased pests<br />
<strong>Water</strong> hyacinth,<br />
blackflies<br />
Blackflies<br />
13/11/2007 Final<br />
131
<strong>Orange</strong> IWRMP<br />
Task 7: Environment<br />
The major habitat changes are:<br />
• Salt marsh at <strong>Orange</strong> <strong>River</strong> Mouth no longer being inundated and<br />
consequently RAMSAR status being lost<br />
• Reduced breeding ground or birds<br />
• <strong>River</strong> channel becoming narrower due to less floods (being captured by<br />
dams)<br />
• More reed encroachment into river channel and on islands due to sediment<br />
deposition and less flood and high flows<br />
The major biological responses are:<br />
• Greater occurrence of nuisance black flies due to altered flow and greater<br />
available habitat for fly breeding<br />
• Greater growth of water hyacinth due to less turbid water and greater<br />
nutrients<br />
13/11/2007 Final<br />
132
<strong>Orange</strong> IWRMP<br />
Task 7: Environment<br />
7 ENVIRONMENTAL FLOWS<br />
7.1 Background to Environmental Flows<br />
International law and regional agreements give these countries a say in whatever<br />
developments take place that will impact the flow of shared rivers. South Africa has<br />
recently implemented the Ecological Reserve (South African National <strong>Water</strong> Act, Act<br />
36 of 1998) and Namibia is also in the process of incorporating environmental flows<br />
into its river management procedures. Thus, there may exist the need for<br />
harmonization of environmental flow procedures and allocations between the countries<br />
that share the <strong>Orange</strong> <strong>River</strong> (and possibly other river) basins.<br />
An environmental flow is a flow in a river (or wetland) that maintains the ecosystem in<br />
a negotiated ecological condition. This condition is decided by society and is normally<br />
a compromise between economic, social and ecological values of the water for various<br />
uses.<br />
<strong>Water</strong> is essential to support the Earth’s ecosystems. Aquatic ecosystems such as<br />
rivers and wetlands are important to people because they provide fish, floodplain<br />
grazing land, timber, reeds, wild vegetables, medicine and other goods. They also<br />
provide services such as flood protection and water quality improvement, and much of<br />
what we call quality of life. In particular, many of the world’s poorest people depend<br />
directly on the natural resources and services of aquatic ecosystems. For instance, in<br />
the case of the Lesotho Highlands <strong>Water</strong> Project (LHWP), contrary to the expectation<br />
of local experts, the affected rivers were found to be central to the lives of 150 000<br />
riparian people in Lesotho alone (Metsi Consultants 2000).<br />
<strong>Water</strong> is also required for all other human endeavors, and water resource<br />
developments invariably impact on the natural flow regime of aquatic ecosystems, with<br />
concomitant impacts on the goods and services provided by the ecosystems<br />
themselves. Experience has shown, however, that such impacts can be partially<br />
mitigated through the implementation of environmental flow releases .<br />
Sustaining <strong>River</strong>s and Livelihoods<br />
The World Commission on Dams recognized the role of environmental flow releases in<br />
mitigating the potential negative environmental effects of water resources<br />
developments, and recommended that "large dams provide for releasing<br />
environmental flows to help maintain downstream ecosystem integrity and community<br />
13/11/2007 Final<br />
133
<strong>Orange</strong> IWRMP<br />
Task 7: Environment<br />
livelihoods and are designed, modified, and operated accordingly" (Policy Principle<br />
4.5, Strategic Priority 4 - Sustaining <strong>River</strong>s and Livelihoods).<br />
Even the most successful environmental flow programme will only partially mitigate<br />
against the effects of a water-resource development. Nothing is gained at no cost – if<br />
flow regimes are manipulated, the targeted rivers will change. Society decides, proactively<br />
or through neglect, the extent of that change (Brown and King 2002a).<br />
Environmental flow assessments links between flow and ecosystem condition are<br />
referred to as environmental flow assessments. Such assessments can be done at<br />
several levels of detail, from a simple statement of water depth to provide wetted<br />
habitat for a valued fish species, to a comprehensive description of a flow regime with<br />
intra-annual and inter-annual variability of low flows and floods in order to maintain<br />
whole river systems. Early EFAs concentrated on one or more biophysical aspects of<br />
river condition, but some more recent EFAs in areas such as SADC, where many<br />
people depend on rivers for subsistence, have included socio-economic aspects.<br />
For rivers, environmental flow assessments most often concentrate on representative<br />
sites or reaches, where a team of specialists assess the relationships between various<br />
aspects of the riverine ecosystem and flow.<br />
There are essentially two approaches to flow assessments: prescriptive and<br />
interactive. Methods based on the prescriptive approach usually address a narrow and<br />
specific objective and result in a recommendation for a single flow value or flow<br />
regime. Interactive approaches, on the other hand, focus on the relationships between<br />
changes in river flow and one or more aspects of the river. Once these relationships<br />
are established, the outcome is no longer restricted to a single interpretation of what<br />
the resulting river condition would be, and the flow assessment team is able to<br />
produce a range of possible scenarios, linking the volume and timing of flows to river<br />
condition and the provision of various goods and services (Brown and King 2002a).<br />
These scenarios provide the decision maker with the impacts and benefits of each<br />
scenario, which can be used in deciding water allocations where tradeoffs need to be<br />
made between ecosystem protection, protection of resources used by riparian people,<br />
and a variety of other off-channel uses of the water, such as irrigation, rural and urban<br />
domestic supply and water from industry.<br />
Increasingly, flow assessments are seen as tools in water-resource management that<br />
display the wider costs as well as the benefits of developments, allowing more<br />
informed trade-offs to be made.<br />
13/11/2007 Final<br />
134
<strong>Orange</strong> IWRMP<br />
Task 7: Environment<br />
The analysis of environmental flow requirements is based on the premise that river<br />
flow is the primary determinant of a number of physical and biological parameters in<br />
aquatic and riparian ecosystems. A crucial relationship exists between river flow or<br />
discharge (analyzed as a number of components, notably base flows and floods),<br />
hydraulics and geomorphology. The volume of flow determines the depth and size of<br />
the river and a number of ecological processes are linked to this.<br />
An instream flow requirement (IFR) or Ecological Flow Requirement (EFR) is a<br />
description of a modified flow regime, invariably due to the presence of a control<br />
structure in the river, such as a dam or weir that is linked to a description of the<br />
condition or health of the river that this flow might be expected to produce.<br />
Furthermore, because the characteristics of a river change as one moves downstream,<br />
flow-ecology relationships change too. One must, therefore, establish different<br />
relationships for each affected river reach. Thus, IFR studies focus their analyses on<br />
carefully selected IFR Sites, representative of particular river reaches.<br />
It is worth considering the implications of environmental flow releases not only on yield<br />
but also on operation costs and expertise required. Information obtained from<br />
elsewhere in the world suggests that environmental flows are becoming central<br />
aspects of water resource developments and a universal tool for managing water<br />
resources. They can be accommodated most cost-effectively through consideration of<br />
the following options (after Bird et al. 2002):<br />
• EFRs should be brought into consideration early on in the decision making<br />
process for proposed water-resource developments (i.e. as early as master<br />
planning and pre-feasibility).<br />
• Where possible, dams should be located off the main river channels.<br />
• Dam sites should be located upstream of major tributaries to protect natural<br />
flow variability and reduce the onus on the dam to provide EFRs.<br />
• Certain rivers or river reaches should be designated as either sacrificial (can<br />
be heavily utilized) and others as sacrosanct (very little water abstraction)<br />
• Dams should allow for the release of large floods, unless situated upstream of<br />
large tributaries.<br />
• There should be a provision for EFRs during the filling and construction of<br />
dams.<br />
• Real time daily hydrological data should be collected at the inflow into the<br />
dam and downstream of it.<br />
13/11/2007 Final<br />
135
<strong>Orange</strong> IWRMP<br />
Task 7: Environment<br />
• Multiple vertical releases (draw offs) at dams are essential to implement<br />
comprehensive environmental flow releases.<br />
• The various water releases from dams should be integrated into an overall<br />
environmental flow management strategy that includes water quality.<br />
• Harmonisation of environmental flow procedures and allocations between the<br />
countries that share the river basins should be achieved.<br />
• An agreed-on process for decision-making involving parties on a broad basis<br />
should be established, where tradeoffs between economics and<br />
environmental impacts can be considered and consensus reached on a final<br />
environmental flow allocation.<br />
• Procedures for optimisation and implementation of the agreed-on<br />
environmental flow allocations should be established.<br />
• Institutional capacity to monitor environmental flows and the resulting river<br />
condition, and to practice adaptive management should be established.<br />
7.2 Lesotho and Environmental Flows<br />
All of Lesotho’s rivers flow into South Africa and, through the <strong>Orange</strong> <strong>River</strong>, onto to<br />
Namibia.<br />
The Lesotho Highlands <strong>Water</strong> Project environmental flow studies were conducted by<br />
Metsi Consultants between 1997 and 2002 (see Box 1). These studies used an<br />
interactive environmental flow assessment methodology called DRIFT (King et al.<br />
2002) and concentrated on six sites each representative of a river reach downstream<br />
of the proposed Lesotho Highlands <strong>Water</strong> Project impoundments, viz. (Metsi<br />
Consultants 2000):<br />
IFR Site 1 On the Matsoku <strong>River</strong> near the village of Seshote, representing the<br />
Matsoku <strong>River</strong> from the site of the proposed Matsoku Weir to the confluence with the<br />
Malibamats'o <strong>River</strong>;<br />
IFR Site 2 On the Malibamats'o <strong>River</strong> downstream of the Katse Bridge,<br />
representing the Malibamats'o <strong>River</strong> from Katse Bridge to the confluence with the<br />
Matsoku <strong>River</strong>;<br />
IFR Site 3 On the Malibamats'o <strong>River</strong> at Paray, representing the Malibamats'o<br />
<strong>River</strong> from the confluence with the Matsoku <strong>River</strong> to the confluence with the Senqu<br />
<strong>River</strong>;<br />
13/11/2007 Final<br />
136
<strong>Orange</strong> IWRMP<br />
Task 7: Environment<br />
IFR Site 4 On the Senqu <strong>River</strong> at Sehonghong, representing the Senqu <strong>River</strong><br />
from the confluence with the Malibamats'o <strong>River</strong> to the confluence with the Tsoelike<br />
<strong>River</strong>;<br />
IFR Site 5 On the Senqu <strong>River</strong> at Whitehills, representing the Senqu <strong>River</strong> from<br />
the confluence with the Tsoelike <strong>River</strong> to the confluence with the Senqunyane <strong>River</strong>;<br />
IFR Site 6 On the Senqu <strong>River</strong> at Seaka Bridge, representing the Senqu <strong>River</strong><br />
from the confluence with the Senqunyane <strong>River</strong> to the Lesotho/South Africa border;<br />
IFR Site 7 On the Senqunyane <strong>River</strong> at Marakabei), representing the<br />
Senqunyane <strong>River</strong> from the site of the proposed Mohale Dam to the confluence with<br />
the Lesobeng <strong>River</strong> ;<br />
IFR Site 8 On the Senqunyane <strong>River</strong> upstream of the confluence with the Senqu<br />
<strong>River</strong> representing the Senqunyane <strong>River</strong> from the confluence with the Lesobeng <strong>River</strong><br />
to the confluence with the Senqu <strong>River</strong><br />
Box 1 Key Statistics of the LHWP Environmental Flow<br />
Assessment* (from Brown and King 2002b)<br />
Client: Lesotho Highlands Development Authority<br />
Consultant: Metsi Consultants (Joint Venture: Southern <strong>Water</strong>s<br />
ER& C and SMEC International).<br />
Study area: 5980 km 2 (a 10-km wide corridor along 568 km of<br />
river).<br />
Study rivers: Senqu, Malibamatso, Matsoku and Senqunyane<br />
<strong>River</strong>s.<br />
Rural population using the study rivers for subsistence: 150 000<br />
people.<br />
Number of reports produced: 22<br />
The dataset of consequences of flow change for the study rivers and for the people<br />
reliant on the resources provided by the rivers allowed for the initial development of<br />
four scenarios ranging from Minimum Degradation (c. 60% of the mean annual runoff<br />
remaining in the river) to Treaty releases (c. 3-5% of the mean annual runoff remaining<br />
13/11/2007 Final<br />
137
<strong>Orange</strong> IWRMP<br />
Task 7: Environment<br />
in the river). An additional set of scenarios (based on the original dataset), and more<br />
detailed information on compensation and mitigation of possible impacts on riparian<br />
people were compiled as part of a second phase study, LHDA No. 678.<br />
The environmental flows finally agreed on for the Lesotho Highlands <strong>Water</strong> Project<br />
followed a prolonged period of negotiation between the Lesotho Highlands<br />
Development Authority, the Governments of Lesotho, South Africa and Namibia,<br />
various other interested and affected parties and the World Bank. The agreed-on<br />
environmental flows concentrated on the river reaches immediately downstream of<br />
Phase 1 structures, viz. IFR sites 1, 2, 3 and 7, and represented between 10 and 40 %<br />
of the mean annual runoff at those sites.<br />
The reports for the Lesotho Highlands <strong>Water</strong> Project study (LHDA 648 & 678) have<br />
been made available to the public and can be obtained from LHDA in Maseru, the<br />
LHDA website or the Southern <strong>Water</strong>s website.<br />
7.2.1 The potential implications of environmental flow requirements for<br />
further Lesotho water projects?<br />
It is almost certain that some form of environmental flow requirements assessment will<br />
be required for the Lesotho Lowlands Study once specific options have been chosen<br />
and for Phase II of the Lesotho Highlands Project (if either of these studies take<br />
place). However, it is also likely that some of the information already generated for the<br />
Lesotho Highlands <strong>Water</strong> Project could be used to good effect, particularly that for the<br />
sites situated on the middle and lower Senqu <strong>River</strong>. Indeed, for any water resource<br />
developments on the mainstem of the Senqu, Senqunyane or Malibamatso <strong>River</strong>s,<br />
relevant environmental flow studies have been completed and, provided permission to<br />
use the data were forthcoming from LHDA, they would require relatively little updating<br />
and adjustment for use in the Lesotho Lowlands study.<br />
Should other aquatic ecosystems be targeted for proposed water resource<br />
developments as part of further phases of the Lesotho <strong>Water</strong> Projects, then they will<br />
also require environmental flow assessment.<br />
7.3 South Africa and Environmental Flows.<br />
The <strong>Water</strong> Law Principles of South Africa (1996) clearly set the direction of the future<br />
of water resources management. The twin threads of sustainability and equity run<br />
through the Principles, the National <strong>Water</strong> Policy of 1997 and the National <strong>Water</strong> Act<br />
(NWA, Act 36 of 1998). The key to balancing sustainability and equity lies in the<br />
13/11/2007 Final<br />
138
<strong>Orange</strong> IWRMP<br />
Task 7: Environment<br />
provisions for the Reserve, and in our ability to quantify a Reserve, as well as to<br />
manage water uses so as to meet the Reserve.<br />
The NWA is founded on the principle that National Government has overall<br />
responsibility for and authority over water resource management for the benefit of the<br />
public without seriously affecting the functioning of the natural environment. In order to<br />
achieve this objective, Chapter 3 of the NWA provides for the protection of water<br />
resources through the Reserve for water resources.<br />
The move to integrated management of water resources, on an ecosystem basis,<br />
requires the introduction of a new set of tools for resource management, tools that are<br />
flexible, protective and can take account of extreme differences within South Africa,<br />
both in socio-economic conditions, and in natural variability of aquatic ecosystems.<br />
The move to resource management has been a gradual one over the last ten years,<br />
driven by need, as South Africa approached the limits of new development of water<br />
resources and was forced to begin a shift to careful management of existing available<br />
resources. To support this change, new tools and new ways of making decisions have<br />
been under development within the Department of <strong>Water</strong> Affairs and Forestry (DWAF)<br />
and within other agencies responsible for natural resource management. In response<br />
to requirements for environmental impact assessment, and as a result of the<br />
Department’s commitment to follow the <strong>Integrated</strong> Environmental <strong>Management</strong><br />
procedure in planning and implementation of major water resources developments, a<br />
considerable amount of effort within the South African scientific community was<br />
focused on finding ways to assess the water requirements of aquatic ecosystems<br />
(Ecological <strong>Water</strong> Requirements (EWR) and Estuarine Flow Requirements (EFR).<br />
Since 1998, the Department of <strong>Water</strong> Affairs and Forestry (DWAF) has investigated<br />
the development of methods to determine the Ecological Reserve for rivers.<br />
13/11/2007 Final<br />
139
<strong>Orange</strong> IWRMP<br />
Task 7: Environment<br />
RDM protocols<br />
1. INITIATE RDM STUDY<br />
- STUDY AREA<br />
- RDM LEVEL & COMPONENTS<br />
- STUDY TEAM<br />
Project<br />
scope<br />
Reserve Components<br />
<strong>River</strong>s, Groundwater,<br />
Estuaries, Wetlands<br />
RDM level<br />
Rapid I, II, III<br />
Intermediate<br />
Comprehensive<br />
?<br />
Cost/Confidence<br />
analysis<br />
System operation<br />
2. DEFINE RESOURCE UNITS<br />
Select IFR sites<br />
Geomorphological<br />
zonation<br />
Ecoregions<br />
3. DEFINE ECOLOGICAL<br />
CATEGORIES (EC) AND<br />
RECOMMEND<br />
EC Classification<br />
Reference conditions<br />
Present Ecological State<br />
Trajectories of change<br />
Ecological Importance and Sensitivity<br />
Socio/Cultural Importance<br />
Constraints<br />
(EC specialist meeting)<br />
Stakeholder Process<br />
Capacity building<br />
Empowering<br />
4. QUANTIFY ECOLOGICAL<br />
WATER REQUIREMENT<br />
(EWR) SCENARIOS<br />
Apply Process<br />
(BBM, Stressor Response, DRIFT)<br />
(IFR specialist meeting)<br />
Data Organisation<br />
Collate existing data<br />
Collect additional info<br />
Analyse info<br />
5. ECOLOGICAL<br />
CONSEQUENCES OF<br />
OPERATIONAL SCENARIOS<br />
(quantity & quality)<br />
YIELD CONSEQUENCES OF<br />
RESERVE<br />
Define operational<br />
scenarios<br />
Provide resource<br />
economic consequences<br />
Catchment<br />
System Analysis<br />
Integration BHN &<br />
Reserve<br />
components<br />
Yield & stakeholder<br />
requirements,<br />
operational constraints<br />
Stakeholder process<br />
Scenario implications &<br />
assessment<br />
6. DWAF MANAGEMENT<br />
CLASS DECISION MAKING<br />
PROCESS<br />
Information on categories<br />
other than Ecological, i.e.<br />
domestic use, irrigation,<br />
recreation etc<br />
7. RESERVE SPECIFICAION<br />
Ecospecs (ecological<br />
component of RQO)<br />
RQO<br />
8. IMPLEMENTATION<br />
DESIGN<br />
Implementation methods<br />
and operating rules for<br />
Reserve<br />
Monitoring protocols<br />
Monitoring DSS, Baseline,<br />
Compliance monitoring<br />
IMPLEMENT &<br />
MONITOR<br />
Figure 7-1: The 8-step Reserve process as used in South Africa<br />
13/11/2007 Final<br />
140
<strong>Orange</strong> IWRMP<br />
Task 7: Environment<br />
The Directorate: Resource Directed Measures (D: RDM) of DWAF is tasked with the<br />
responsibility of ensuring that the Reserve requirements, which have priority over other<br />
uses in terms of the NWA, are determined before license applications are to be<br />
processed. There are several stressed catchments where applications for licensing<br />
have been received by the D: RDM. The available water resources cannot meet all the<br />
water requirements of the users in these catchments, without trade-off among water<br />
user sectors. DWAF has identified these stressed catchments where it will be desirable<br />
in the near future to undertake compulsory licensing.<br />
It is important to note that in the South African context the following key RDM<br />
component need to be addressed:<br />
• Ecological <strong>Water</strong> Requirement Scenarios. In order to provide EWR scenarios,<br />
an ecological classification process must be applied. This will provide a range<br />
of Ecological Categories for which flow scenarios can be developed as well as<br />
a recommended Ecological Category.<br />
• Resource Quality Objectives includes various aspects other than ecological.<br />
• Basic Human Needs Reserve (amount of water required within a catchment<br />
for basic human needs)<br />
• Socio-economic assessment (place a value on water usage so as to compare<br />
different water usages in terms of economic contribution to the catchment).<br />
7.3.1 Process for Reserve studies<br />
Ecological <strong>Water</strong> Requirement (EWR) methods have been designed and tested for<br />
South African circumstances since the late 1980s. With the inclusion of EWRs in the<br />
form of the Reserve in the National <strong>Water</strong> Act (No 36 of 1998), specific developments<br />
were initiated to tailor-make existing tools to conform to Reserve requirements as well<br />
as to develop new methods/tolls where necessary.<br />
EWR methods consist of the application of various tools. To comply with the<br />
requirements for determining the Reserve, this work must be undertaken within the<br />
context of a Reserve determination process. The Reserve determination process<br />
consists of an 8-step procedure (Figure 7.1). (Louw & Hughes, 2002).<br />
The following process (Figure 7.1 modify DWAF 2002) is used to undertake Ecological<br />
Flow Requirement studies in South Africa:<br />
13/11/2007 Final<br />
141
<strong>Orange</strong> IWRMP<br />
Task 7: Environment<br />
• A set of Ecological <strong>Water</strong> Requirement (EWR) scenarios is generated to test<br />
through the application of a yield model. Each scenario represents a possible<br />
flow regime, intended to have specific outcomes linked to the Reserve.<br />
Scenarios specify how much water is required, where and when, and take<br />
cognizance of the likely water quality consequences.<br />
• Based on the impacts of the EWR scenarios a set of flow scenarios, called<br />
Operational Scenarios, is generated and tested. These scenarios are realistic<br />
scenarios as impacts on users and constraints such as outlet sizes of dams<br />
are considered. Decision makers will select one of these scenarios as the<br />
Reserve.<br />
• The likely impact of the Operational Scenarios on the available yield is<br />
determined.<br />
• The likely impact of the Operational Scenarios on the aquatic ecology is<br />
determined.<br />
• The likely economic impact of selected Operational Scenarios is determined.<br />
The likely impact of selected Operational Scenarios on the Goods and Services<br />
provided by the riverine system is determined.<br />
7.3.2 South African Environmental flows studies to date<br />
The <strong>Orange</strong> <strong>River</strong> catchment within South Africa covers many <strong>Water</strong> <strong>Management</strong><br />
Areas (WMA’s, Figure 7.2) and quaternary catchments (Figure 7.3).<br />
To date, in order to process licence applications many desktop and rapid (low<br />
confidence) as well as some intermediate Reserve determinations have been<br />
undertaken in the <strong>Orange</strong> <strong>River</strong> catchment within South Africa (Table 7.1). None of<br />
these studies have been undertaken on a broad river reach and they have mainly been<br />
undertaken on a quaternary basis. No comprehensive or high resolution (high<br />
confidence) Reserve has been undertaken with the <strong>Orange</strong> <strong>River</strong> catchment to date.<br />
The roll out of DWAF policies as part of the National <strong>Water</strong> Act (Act 36 of 1998) should<br />
ultimately enable the <strong>Orange</strong> <strong>River</strong> Basin to be optimally managed and water allocated<br />
on a more ecologically sustainable manner. Further pressure will be brought to bear on<br />
the management of the <strong>Orange</strong> <strong>River</strong> Basin (and especially the Upper <strong>Orange</strong> <strong>River</strong>)<br />
by the continued requirements of the international obligations of neighboring states.<br />
13/11/2007 Final<br />
142
<strong>Orange</strong> IWRMP<br />
Task 7: Environment<br />
Figure 7-2: <strong>Water</strong> <strong>Management</strong> Areas and the river systems in the <strong>Orange</strong> <strong>River</strong><br />
catchment area<br />
13/11/2007 Final<br />
143
<strong>Orange</strong> IWRMP<br />
Task 7: Environment<br />
Figure 7-3: <strong>Orange</strong> and Vaal <strong>River</strong> quaternary catchments<br />
13/11/2007 Final<br />
144
<strong>Orange</strong> IWRMP Task 7: Environment<br />
Table 7-1: List of all DWAF reserve studies that have been undertaken on the Vaal and <strong>Orange</strong> <strong>River</strong> catchments<br />
Quat ID Compartm ent W MA_Description SurfaceW aterResource GW aterResour QuantityLevel QualityLvl ECQualit ECQuant LinkQuats PESC RDApproved TERTIARY SECONDARY<br />
C11E 147 <strong>River</strong> Lower Vaal Vaal <strong>River</strong> Rapid 1 Desktop C 12-Mar-02 C11 C1<br />
C11F 148 <strong>River</strong> Upper Vaal Brumm erspruit Desktop C 31-Aug-01 C11 C1<br />
C21E 164 Groundwater Lower Vaal <strong>River</strong> Rapid 1 14-Feb-03 C21 C2<br />
C22B 164 Groundwater Middle Vaal <strong>River</strong> Rapid 1 25-Mar-04 C22 C2<br />
C22C 166 <strong>River</strong> Middle Vaal Vaal <strong>River</strong> Rapid 1 D 27-Feb-02 C22 C2<br />
C22D 170 <strong>River</strong> Lower Vaal Vaal <strong>River</strong> Rapid 1 D 28-Mar-01 C22 C2<br />
C22F 138 <strong>River</strong> Lower <strong>Orange</strong> <strong>Orange</strong> <strong>River</strong> Desktop 12-Apr-01 C22 C2<br />
C22H 230 <strong>River</strong> Upper Vaal C 16-Oct-00 C22 C2<br />
C23E 232 <strong>River</strong> Lower Vaal Vaal <strong>River</strong> Rapid 1 C 16-Oct-00 C23 C2<br />
C24C 60 <strong>River</strong> Upper Vaal Suikerbosrand <strong>River</strong> C24 C2<br />
C24F 227 Groundwater Upper Vaal Vaal <strong>River</strong> Rapid 1 C C 14-Dec-01 C24 C2<br />
C24F 228 <strong>River</strong> Lower <strong>Orange</strong> Riet <strong>River</strong> Rapid 1 B 31-Aug-01 C24 C2<br />
C24J 237 <strong>River</strong> Lower <strong>Orange</strong> 31-Aug-01 C24 C2<br />
C25D 239 <strong>River</strong> Lower <strong>Orange</strong> 31-Aug-01 C25 C2<br />
C25E 241 <strong>River</strong> Middle Vaal Vaal <strong>River</strong> Rapid 1 D 05-Jun-01 C25 C2<br />
C25E 249 Groundwater Middle Vaal Vaal <strong>River</strong> 06-Jul-01 C25 C2<br />
C31A 251 <strong>River</strong> Middle Vaal Makwassiespruit Desktop Desktop C 21-Nov-01 C31 C3<br />
C31F 257 <strong>River</strong> Lower Vaal 31-Aug-01 C31 C3<br />
C42E 259 <strong>River</strong> Lower Vaal 31-Aug-01 C42 C4<br />
C42H 260 <strong>River</strong> Upper Vaal Vaal <strong>River</strong> Rapid 1 D D 14-Dec-01 C42 C4<br />
C42K 260 Groundwater Upper Vaal Vaal <strong>River</strong> Rapid 1 Rapid 1 31-Aug-01 C42 C4<br />
C42L 262 <strong>River</strong> Upper Vaal Blesbokspruit <strong>River</strong> Desktop C21F C 25-May-01 C42 C4<br />
C51E 271 Groundwater Upper Vaal Desktop 31-Aug-01 C51 C5<br />
C51G 265 <strong>River</strong> Lower <strong>Orange</strong> <strong>Orange</strong> <strong>River</strong> Rapid 1 A/B 21-May-01 C51 C5<br />
C52C 270 <strong>River</strong> Lower <strong>Orange</strong> <strong>Orange</strong> <strong>River</strong> Intermediate te D C52 C5<br />
C52D 272 <strong>River</strong> Lower <strong>Orange</strong> Intermediate te 31-Aug-01 C52 C5<br />
C91A 313 <strong>River</strong> Upper Vaal Klipspruit <strong>River</strong> Klipspruit <strong>River</strong> Rapid 1 Rapid 1 D 01-Jul-01 C91 C9<br />
D12F 82 <strong>River</strong> Upper Vaal W aterval <strong>River</strong> Desktop Desktop C 05-Feb-02 D12 D1<br />
D13M 70 Groundwater Middle Vaal Desktop 23-Jul-04 D13 D1<br />
D14H 102 <strong>River</strong> Lower <strong>Orange</strong> Annis <strong>River</strong> Rapid 1 D 31-Aug-01 D14 D1<br />
D18B 79 <strong>River</strong> Lower <strong>Orange</strong> D18 D1<br />
D18E 82 <strong>River</strong> Upper Vaal W aterval <strong>River</strong> Desktop Desktop C 05-Feb-02 D18 D1<br />
D22A 102 <strong>River</strong> Lower <strong>Orange</strong> <strong>Orange</strong> <strong>River</strong> Rapid 2 Rapid 2 D 31-Aug-01 D22 D2<br />
D23D 343 <strong>River</strong> Upper Vaal Blesbokspruit <strong>River</strong> D23 D2<br />
D31E 352 <strong>River</strong> Lower Vaal Intermediate te D 31-Aug-01 D31 D3<br />
D32K 352 <strong>River</strong> Lower <strong>Orange</strong> <strong>Orange</strong> <strong>River</strong> Rapid 2 D 31-Aug-01 D32 D3<br />
D34G 358 <strong>River</strong> Lower Vaal C91E 12-Mar-02 D34 D3<br />
D35G 359 <strong>River</strong> Lower Vaal C91E 12-Mar-02 D35 D3<br />
D35H 360 <strong>River</strong> Lower Vaal C91D 12-Mar-02 D35 D3<br />
D41C 364 <strong>River</strong> Lower <strong>Orange</strong> <strong>Orange</strong> <strong>River</strong> D73B 31-Aug-01 D41 D4<br />
D41D 364 <strong>River</strong> Lower <strong>Orange</strong> D73B 31-Aug-01 D41 D4<br />
D41D 364 <strong>River</strong> Lower <strong>Orange</strong> <strong>Orange</strong> <strong>River</strong> D73B 31-Aug-01 D41 D4<br />
D41G 365 <strong>River</strong> Lower <strong>Orange</strong> Vaal <strong>River</strong> Desktop C/D 31-Aug-01 D41 D4<br />
D41J 369 <strong>River</strong> Upper <strong>Orange</strong> Kraai <strong>River</strong> Desktop B/C 14-Sep-01 D41 D4<br />
D42C 366 <strong>River</strong> Lower <strong>Orange</strong> Vaal <strong>River</strong> Desktop 31-Aug-01 D42 D4<br />
D56A 374 <strong>River</strong> Lower <strong>Orange</strong> <strong>Orange</strong> <strong>River</strong> Rapid 1 Rapid 1 31-Aug-01 D56 D5<br />
D56B 375 <strong>River</strong> Lower <strong>Orange</strong> <strong>Orange</strong> <strong>River</strong> Desktop D 31-Aug-01 D56 D5<br />
D57E 375 <strong>River</strong> Lower <strong>Orange</strong> <strong>Orange</strong> <strong>River</strong> Desktop D 31-Aug-01 D57 D5<br />
D58A 376 <strong>River</strong> Lower <strong>Orange</strong> <strong>Orange</strong> <strong>River</strong> Desktop D 31-Aug-01 D58 D5<br />
13/11/2007 Final<br />
145
<strong>Orange</strong> IWRMP<br />
Task 7: Environment<br />
7.3.3 The Lower <strong>Orange</strong> <strong>River</strong> <strong>Management</strong> Study (LORMS)<br />
A study focussed on the river reach of the <strong>Orange</strong> <strong>River</strong> between Augrabies and<br />
Onseepkans, was undertaken in 2005 known as the Lower <strong>Orange</strong> <strong>River</strong> <strong>Management</strong><br />
Study (LORMS) (DWAF 2005). Specialists also contextualized their information within<br />
the wider LORMS study area (i.e., from the confluence of the Vaal to the mouth of the<br />
<strong>Orange</strong> <strong>River</strong>). The text in this section is a summary of some of the findings of the<br />
LORMS study (DWAF 2005).<br />
Social/Environmental Demands provided the outcome of the comparison between the<br />
1996 estimates for the instream flow requirements for the <strong>Orange</strong> <strong>River</strong> (DWAF 2005)<br />
and those obtained from the Desktop Model using the latest hydrology. If the<br />
Ecological Flow Requirements (EFR) had to be supplied from which Vanderkloof Dam<br />
(the last major structure on the <strong>Orange</strong> <strong>River</strong> main stem), then implementing the EFR<br />
would be problematic. Using the river as a conduit for irrigation water creates<br />
ecological problems related to unnaturally high and stable flows in the river. Using the<br />
environmental flow estimates of either the <strong>Orange</strong> <strong>River</strong> Replanning Study (ORRS) or<br />
the Desktop for planning purposes in LORMS may not be appropriate or feasible, and<br />
it was recommended that the relationship between the current flow regime in the river<br />
and the EFR recommended by the Desktop Model be examined, and that where<br />
appropriate, recommended flows be revised.<br />
Table 7.2 is a summary of the Present Ecological Status (PES) for each of the<br />
disciplines considered for the river in the environmental flow tasks. In general, the<br />
ecological condition of the river is deemed to be on a negative trajectory, with all<br />
disciplines expecting a one-category deterioration in condition in the next twenty years.<br />
<strong>River</strong> systems function as an integrated whole, and changes made in one part of a<br />
system will inevitably lead to changes in another part, and so it is unsurprising that the<br />
disciplines predict similar trends.<br />
13/11/2007 Final<br />
146
<strong>Orange</strong> IWRMP<br />
Task 7: Environment<br />
Table 7-2: Summary of the Present Ecological Status (PES) for each of the<br />
disciplines considered, their predicted trajectory of change for 20 years and an<br />
indication of whether these changes documented/expected are related to<br />
changes in the flow regime of the <strong>Orange</strong> <strong>River</strong>. Colour codes are provided in<br />
the key (DWAF 2005).<br />
The most important aspects of the flow regime for maintaining or improving the current<br />
ecological condition are reinstating the winter low flows (i.e., reducing current flows)<br />
and the November freshet. The flow-related contribution factors identified were:<br />
• unseasonable winter releases;<br />
• lack of very low flow periods;<br />
• lack of the November freshet;<br />
• reduction in water volume;<br />
• reduction in wet and dry season inter-annual floods; and<br />
• lack of flow variability.<br />
The extent to which the negative trajectory can be halted will depend on the degree of<br />
variability that can be managed in the system, as well as issues other than flow, and<br />
cannot be assessed in this task. This variability will include:<br />
• reinstatement of year-on-year variability;<br />
13/11/2007 Final<br />
147
<strong>Orange</strong> IWRMP<br />
Task 7: Environment<br />
• provision of intra-annual floods; and<br />
• capping of winter releases.<br />
The recommended category for a Comprehensive Reserve Determination would most<br />
likely be a C-Category.<br />
The main reasons for this negative trajectory are the deviation from the natural flow<br />
and deterioration in water quality. Flow changes, as a result of river regulation, are<br />
considered to be the major culprit. The aspects of the flow regime causing a decline in<br />
the river’s condition include:<br />
• the absence of seasonal natural flow patterns;<br />
• the absence of minor to medium maintenance floods; and<br />
• higher winter volumes for hydropower generation.<br />
• It should be kept in mind that ±98% of the <strong>Orange</strong> <strong>River</strong>’s runoff, including the<br />
bigger bulk of these maintenance floods, is generated in the system’s upper<br />
catchment, above the major dams within the SA borders.<br />
Table 7-3: Summary of the Present Ecological Status (PES), The Predicted<br />
Trajectory of Change for 20 Years and an Indication of whether These Changes<br />
Documented/Expected are Related to Changes in the Flow Regime of the <strong>Orange</strong><br />
<strong>River</strong>.<br />
13/11/2007 Final<br />
148
<strong>Orange</strong> IWRMP<br />
Task 7: Environment<br />
The changes to the Flow Regime Most Likely to have contributed to Present<br />
Ecological Status are as follows:<br />
There has been a reduction in the volume of water flowing down the <strong>Orange</strong> <strong>River</strong>, viz.<br />
natural Mean Annual Runoff (nMAR) = c. 10 587.30 MCM (median c. 5 100 MCM) and<br />
2005 Mean Annual Runoff (2005MAR) = c. 4 382.12 MCM (40% nMAR). In general,<br />
relationships between reductions in nMAR from elsewhere in South Africa and<br />
ecological condition of the affected riverine ecosystem show strong correlations,<br />
particularly when this is accompanied by a change in the natural distribution of flows.<br />
However, much of the reduction in ecological condition in the LOR can be attributed to<br />
mechanical manipulation of the riverbanks and floodplain.<br />
The most important aspects of the flow regime for maintaining or improving the current<br />
ecological condition are reinstating the winter low flows (i.e., reducing current flows)<br />
and the November freshet. In summary, the flow related contribution factors identified<br />
were:<br />
• unseasonable winter releases;<br />
• lack of very low flow periods;<br />
• lack of the November freshet;<br />
• reduction in volume;<br />
• reduction in wet and dry season inter-annual floods; and<br />
• lack of variability.<br />
It was the consensus opinion of the LORMS study (DWAF 2005) that a<br />
Comprehensive Reserve/EFR Determination on the LOR should be undertaken as<br />
a matter of priority.<br />
Furthermore, the Study Team stressed the importance of controlling mechanical<br />
manipulation of the river bed, banks and floodplain, as these factors are major<br />
contributors towards the decline in the condition of the riverine ecosystem and,<br />
together with changes to the flow regime, will eventually lead to its complete collapse<br />
7.4 Botswana<br />
The Molopo <strong>River</strong> Basin (Nossop <strong>River</strong> Basin included), which forms part of the<br />
northern portion of the <strong>Orange</strong>-Senqu <strong>River</strong> Basin, is located in the southern part of<br />
Botswana with an area of approximately 71,000 square kilometers (Figure 4.1). The<br />
Molopo and Nossop are the major rivers in the Basin and they form part of the<br />
13/11/2007 Final<br />
149
<strong>Orange</strong> IWRMP<br />
Task 7: Environment<br />
international boundary with the Republic of South Africa. These rivers are highly<br />
season and their flow is dependant on good summer rains. In general there are no<br />
longer flows in the rivers of the Basin.<br />
The Botswana <strong>Water</strong> Act (Act 34.01) intends to define ownership of any rights to the<br />
use of water and to provide for grant of water rights and servitude. <strong>Water</strong> in rivers,<br />
streams, lakes, pans, swamps or beneath a watercourse or underground water and in<br />
works such as canals, reservoirs and dams is public water. The use of such water can<br />
only be with permission granted by the <strong>Water</strong> Apportionment Board in the Department<br />
of <strong>Water</strong> Affairs. Application for the water user rights to the Board is done through the<br />
<strong>Water</strong> Registrar who shall issue a certificate. The Act bars pollution of public water with<br />
any matter derived from such use likely to cause injury either directly or indirectly to<br />
public health, livestock, animal life, fish, crops, orchards or gardens which are irrigated<br />
by such water or to any product in the processing of which such water is used. The<br />
holder of a water right is obligated to take precautions to prevent accumulations in any<br />
river, stream or watercourse of silt, sand, gravel, stones, sawdust, refuse, sewage,<br />
waste or any other substance likely to affect injuriously the use of such water. A holder<br />
of water right who contravenes the Act shall be guilty of an offence and liable to a<br />
penalty under the Act.<br />
Environmental flows are not a high priority for the highly seasonal rivers of Botswana<br />
that flow into the <strong>Orange</strong> <strong>River</strong>.<br />
7.5 Namibia<br />
Namibia is also in the process of incorporating environmental flows into its river<br />
management procedures. Namibian scientists and conservationists were observers on<br />
the LORMS study (DWAF 2005) and concurred with the consensus opinion that a<br />
Comprehensive Reserve/EFR Determination on the LOR should be undertaken as a<br />
matter of priority.<br />
7.6 Possible international implications related to environmental flows<br />
South Africa and Namibia are situated downstream of the Lesotho and Botswana.<br />
Southern Africa has recently implemented the Ecological Reserve (SA <strong>Water</strong> Act<br />
1998) and Namibia is also in the process of incorporating environmental flows into its<br />
river management procedures. Thus, there may exist the need for harmonisation of<br />
environmental flow procedures and allocations between the countries that share the<br />
<strong>Orange</strong> <strong>River</strong> (and possibly other river) basins.<br />
13/11/2007 Final<br />
150
<strong>Orange</strong> IWRMP<br />
Task 7: Environment<br />
At this stage no transboundary or international studies using this methodology have<br />
been undertaken within the <strong>Orange</strong> <strong>River</strong> basin. The principles of environmental flows<br />
have been exhaustively applied in Lesotho for Phase 1 dams and rivers (Brown and<br />
King 2002) and South Africa. No detailed or comprehensive Reserve studies have<br />
been undertaken on the <strong>Orange</strong> <strong>River</strong> or Vaal <strong>River</strong> to date in South Africa. DWAF is<br />
in the process of commissioning a comprehensive Reserve for the Vaal <strong>River</strong> system<br />
which should begin in 2006.<br />
The <strong>Orange</strong> <strong>River</strong> Environmental Flow Requirements should be undertaken as a<br />
matter of priority at a comprehensive or detailed level. This study should be<br />
undertaken under the banner of ORASECOM and must include all of the countries.<br />
Despite the different water legislation in the <strong>Orange</strong> <strong>River</strong> Basin countries the basic<br />
principles of environmental flows are internationally accepted and can be applied<br />
across shared water courses. It is important that this study include the following<br />
aspects at the onset of the study:<br />
• Agreement on the Environmental Flows methods to be used<br />
• Full participation of all countries and their scientists and regulators in the<br />
process<br />
• A inclusive public participation process throughout the study (including public<br />
education and awareness)<br />
• Socio-cultural and socio-economic assessments to run concurrently with the<br />
EFR study<br />
In conclusion, cultural and ecological issues are now globally taking the same level of<br />
importance as engineering and economic issues, with cost implications for projects.<br />
Many schemes might become far less viable than originally assumed with these new<br />
aspects included.<br />
13/11/2007 Final<br />
151
<strong>Orange</strong> IWRMP<br />
Task 7: Environment<br />
8 DATA AVAILABLE AND GAPS<br />
A list of the data available, including Geographical data, is in Appendix B. The<br />
following is a list of information gaps<br />
It is difficult to put together a definitive list of information gaps on any subject, because<br />
there are different perspectives, different degrees of detail and different information<br />
needs at different times. The task is, essentially, as long as a piece of string. However,<br />
the following list identifies some of the more important information gaps based on<br />
recent socio-economic and biophysical participatory assessments, LORMS study<br />
(DWAF 2005) and literature reviews.<br />
• Holistic management of the <strong>Orange</strong> <strong>River</strong> Basin: the flows that go to sea<br />
at the <strong>Orange</strong> <strong>River</strong> mouth should be managed in an integrated manner<br />
starting with environmental flow releases from Lesotho, the Vaal <strong>River</strong> system<br />
as well as in stream dams along the length of the <strong>Orange</strong> <strong>River</strong>. The <strong>Orange</strong><br />
<strong>River</strong> mouth salt marsh losing its RAMSAR status is mainly due to the altered<br />
flows due to dams in the system. The ORASECOM initiative is an excellent<br />
starting point for the holoitic management of the <strong>Orange</strong> <strong>River</strong> Basin’s flows.<br />
• Environmental flows method to be confirmed for the <strong>Orange</strong> <strong>River</strong><br />
Basin: at present there is not agreed upon environmental flow assessment<br />
method for the <strong>Orange</strong> <strong>River</strong> basin. Lesotho and South Africa have applied<br />
slightly different methods for environmental flows but these methods are not<br />
fundamentally different and recent research has shown that the results from<br />
these methods are statistical. In addition, a single methodology should be<br />
applied to both the river and the estuary. Currently, two different<br />
methodologies are used, but the interface between the two is now improving.<br />
It is critically important that a comprehensive or high level of confidence<br />
Environmental flows study is undertaken for the <strong>Orange</strong> <strong>River</strong> Basin. This full<br />
assessment requires better data (including low flow information). Thus, a<br />
focused monitoring system should be established to provide the necessary<br />
information, for a period of two years. It is planned that the Vaal <strong>River</strong> system<br />
will undergo a comprehensive Reserve (environmental flows) study from 2006<br />
to 2008. This study needs to be extended to include the whole <strong>Orange</strong> <strong>River</strong><br />
basin.<br />
• <strong>Water</strong> flow monitoring in the lower <strong>Orange</strong> <strong>River</strong>: the flow gauging system<br />
in this section of the basin is inadequate. This is particularly true for low flows,<br />
13/11/2007 Final<br />
152
<strong>Orange</strong> IWRMP<br />
Task 7: Environment<br />
where existing data is unreliable. This information is needed (and low flow info<br />
is particularly important) for environmental flow management. Good flow<br />
gauging stations need to be established that provide reliable data during low<br />
flow periods. These gauging stations need to be monitored. Historic data<br />
needs (as far as possible) to be adjusted, based on the results from the new<br />
gauges.<br />
• Environmental needs of the lower <strong>Orange</strong> <strong>River</strong>: a preliminary<br />
environmental flow requirement assessment of the lower <strong>Orange</strong> <strong>River</strong> and<br />
estuary (river mouth) has been done. A comprehensive assessment is now<br />
needed. This full assessment requires better data (including low flow<br />
information). Thus, a focused monitoring system should be established to<br />
provide the necessary information, over a period of two years. In addition, a<br />
single methodology should be applied to both the river and the estuary.<br />
Currently, two different methodologies are used, which do not interface<br />
particularly well, and the client is often left having to manage the interfacing.<br />
• Environmental economics data for the whole <strong>Orange</strong> <strong>River</strong>: a preliminary<br />
set of environmental accounts have been developed for the <strong>Orange</strong> <strong>River</strong><br />
some 5 years ago. These need to be updated and refined. Of particular<br />
relevance is a good understanding of the value of water and its use, including<br />
(a) basic human needs and ecological needs, particularly with regard to the<br />
ecological services that water provides; and (b) value-adding for different<br />
water uses. This exercise should go further, to investigate how a “water stock<br />
exchange” could be established, so that water quotas could be traded,<br />
thereby creating a mechanism that would, at the same time (i) create optimal<br />
value for water, so that it became (over time) used for the most value-adding<br />
and strategically important activities, and (ii) it became viewed as a high value<br />
commodity and was not wasted (i.e. creating policy incentives for “water<br />
demand management”).<br />
• Environmental water flow requirements of the Fish and other ephemeral<br />
rivers: while there are methodologies in place (which have been well tested)<br />
to determine environmental flow requirements of perennial river basins, there<br />
are no clear mechanisms to determine environmental flows for ephemeral<br />
systems. It is important that this issue be addressed, for the Fish <strong>River</strong><br />
(because of its periodically significant contribution to the <strong>Orange</strong> <strong>River</strong> mouth,<br />
as well as for the optimal management and development of the Fish <strong>River</strong><br />
system), as well as for some other, more arid systems which contribute little of<br />
13/11/2007 Final<br />
153
<strong>Orange</strong> IWRMP<br />
Task 7: Environment<br />
nothing to the <strong>Orange</strong> (e.g. Nossob / Auob), but which have important<br />
groundwater aquifers used for domestic and agricultural purposes. A current<br />
<strong>Water</strong> Research Commission Project is being funded in South Africa to<br />
address the issue of how to determine environmental flows for ephemeral<br />
rivers. Similarly the Department of <strong>Water</strong> Affairs and Forestry in South Africa<br />
has developed a prototype method for a groundwater reserve determination.<br />
• Agricultural return flows, and more efficient irrigation: the environmental<br />
flow work done to date on the lower <strong>Orange</strong> river and on the mouth have<br />
shown that the degraded condition of the system is only partly a result of the<br />
severely altered hydrology of the system. A large contributing factor results<br />
from out-of-river management. One of the more immediate concerns is the<br />
poor management practices of some of the irrigated cultivation in the <strong>Orange</strong><br />
<strong>River</strong> valley. Cultivation is too close to river banks. Excessive irrigation<br />
occurs, resulting in return flows carrying pesticides and fertilizers into the<br />
river. Improved farming methods and management practices need to be<br />
implemented, and closer monitoring and regulation is required.<br />
• Socio-economic conditions around informal settlements: new projects<br />
along the lower <strong>Orange</strong> <strong>River</strong>, e.g. prospecting and mining, grape and other<br />
farming, have resulted in informal settlements becoming established. People<br />
arrive with the hope of work, and/or people are employed on a highly<br />
seasonal basis (e.g., grape picking) and remain in the area, in informal<br />
settlements, throughout the remainder of the year with no formal income. This<br />
results in high pressure on local resources (e.g. riparian woodlands stripped<br />
for timber for building informal houses and for energy; fishing in river, using<br />
fine mesh nets (even mosquito nets) and thus stripping the fish resources),<br />
and uncontrolled domestic stock entering protected areas and overgrazing the<br />
river banks and floodplains – all leading to severe environmental degradation.<br />
It also results in social degeneration, with poor housing, no adequate<br />
schooling and medical care, escalating poverty, illegal border crossings and<br />
transfer of goods, prostitutions, escalating incidents of HIV/Aids, etc. There is<br />
little information available on this rapidly changing and expanding situation,<br />
and even less decisive action. It is important that the situation be properly<br />
understood, and that some clear development plan is implemented to address<br />
the situation before it spirals out of control.<br />
• Better understanding of a dam at Vioolsdrif: the lower <strong>Orange</strong> <strong>River</strong><br />
management study recommended that a storage come re-regulating dam<br />
13/11/2007 Final<br />
154
<strong>Orange</strong> IWRMP<br />
Task 7: Environment<br />
should be considered at Vioolsdrif. The impacts (both positive and negative)<br />
need to be better understood, so that these may be optimized and mitigated<br />
for, respectively. Some of the information needs would include:<br />
• The likely water quality profile of the proposed dam option, particularly<br />
with regard to the potential for algal growth, which will affect the<br />
reservoir itself and the downstream environment;<br />
• Changes in the thermal stratification and its likely effects on the<br />
downstream aquatic biota: fish spawning and growth; flowering times,<br />
growth rates and size at maturity of riparian vegetation;<br />
• The extent of riverine habitat (including the riparian zone) likely to be<br />
inundated, and its availability outside of the various inundation zones;<br />
• Movement of fish past the barrier;<br />
• Invasive aliens, e.g. black fly;<br />
• As yet unidentified impacts such as water quality effects linked to the<br />
underlying geology;<br />
• Extent to which large floods will flush pollution from existing and<br />
proposed operations, including mining operations, into the dam<br />
• Detailed archaeological impacts;<br />
• Socio-economic impacts (e.g. informal settlements, potential impact of<br />
disease, such as bilharzias, and possibly expansion of malaria linked<br />
to climate change) and economic opportunities (e.g. fish farming,<br />
tourism), etc.<br />
Impact of climate change on security of water supply and hydrology of the<br />
system. The impacts of climate change need to be monitored and the security of<br />
water supply needs to be planned for The common management of the <strong>Orange</strong> <strong>River</strong><br />
Basin across international boundaries will go along way to improving the<br />
understanding and water needs of the countries and regions.<br />
13/11/2007 Final<br />
155
<strong>Orange</strong> IWRMP<br />
Task 7: Environment<br />
9 RECOMMENDATIONS AND CONCLUSIONS<br />
The <strong>Orange</strong> <strong>River</strong> originates in the Lesotho Highlands and flows in a westerly direction<br />
2 200 km to the west coast where the river discharges into the Atlantic Ocean. Four<br />
countries share the <strong>Orange</strong> <strong>River</strong> Basin. Each of these countries have different rain<br />
falls with Lesotho the main supplier of water to the <strong>Orange</strong> <strong>River</strong>, followed by South<br />
Africa. Botswana and Namibia’s rivers are highly seasonal (if at all) and consequently<br />
have a small contribution to the MAR of the <strong>Orange</strong> <strong>River</strong> basin.<br />
Each country within the <strong>Orange</strong> <strong>River</strong> Basin has its own water management legislation<br />
as well as their own water demands or stressors. It is therefore pressures or drivers<br />
that contribute to the environmental issues within the <strong>Orange</strong> <strong>River</strong>.<br />
The environmental issues associated with the <strong>Orange</strong> <strong>River</strong> are directly related to the<br />
anthropogenic use of the water. The major impact is due to the altered flows of the<br />
<strong>Orange</strong> <strong>River</strong> due to man reallocating this water for uses outside the catchment, for<br />
hydro-power, agricultural and mining use. As a result the river’s ecological integrity has<br />
been compromised to such an extent that the current flow regime has resulted in the<br />
loss of biodiversity, nutrient enrichment, increasing salt loads and nuisance plants and<br />
animals.<br />
In order to manage the <strong>Orange</strong> <strong>River</strong> basin’s environmental aspects in a holistic<br />
manner the ORASECOM initiative must continue to promote the use of environmental<br />
flow requirements. A comprehensive environmental flow study should be undertaken<br />
for the <strong>Orange</strong> <strong>River</strong>. This will include the existing study that has been undertaken in<br />
Lesotho for Phase 1 as well as the comprehensive study to be undertaken for the Vaal<br />
<strong>River</strong> system (2006 to 2008). It is important that all the countries within the <strong>Orange</strong><br />
<strong>River</strong> basin are part of this study and that the appropriate socio-economic<br />
assessments and public participation takes place concurrently with the environmental<br />
flows study.<br />
The following recommendations are suggested:<br />
• The holistic management of the <strong>Orange</strong> <strong>River</strong> Basin (source to sea) should be<br />
promoted through ORASECOM;<br />
• The data collected in each country (water quality, flow, GIS etc) should be<br />
collated and stored in a standardized format that will allow way easy<br />
exchange between countries;<br />
13/11/2007 Final<br />
156
<strong>Orange</strong> IWRMP<br />
Task 7: Environment<br />
• ORASECOM initiative must continue to promote the use of environmental flow<br />
requirements (and appropriate methods for all countries and rivers);<br />
• Environmental water flow requirements of the Fish and other ephemeral rivers<br />
should be determined;<br />
• Appropriate socio-economic assessments and public participation takes place<br />
concurrently with the environmental flows study;<br />
• The flow monitoring in the lower <strong>Orange</strong> <strong>River</strong> is inadequate and should be<br />
addressed; and<br />
• Agricultural return flows, and more efficient irrigation should be studied as<br />
results to date have shown that the degraded condition of the Lower <strong>Orange</strong><br />
<strong>River</strong> is only partially as a result of the severely altered hydrology of the<br />
system.<br />
13/11/2007 Final<br />
157
<strong>Orange</strong> IWRMP<br />
Task 7: Environment<br />
10 REFERENCES<br />
Key reports emerging to date are:<br />
Conservation<br />
Mokuku, C., Lepono, T., Mokhothu, M., Khasipe, T and Mokuku, T. (2002) SECOND<br />
STATE OF THE ENVIRONMENT REPORT. National Environment Secretariat Ministry<br />
of Tourism, Environment and Culture, Lesotho<br />
Invertebrates<br />
Palmer, R. W. 1996. Invertebrates in the <strong>Orange</strong> <strong>River</strong>, with emphasis on conservation<br />
and management. Southern African Journal of Aquatic Sciences 22(1/2): 3-51.<br />
Palmer, R.W. 1993. Short-term impacts of formulations of Bacillus thuringiensis var.<br />
israelensis de barjac and the organophosphate temephs, used in blackfly (Diptera:<br />
Simuliidae) control, on rheophilic benthic macroinvertebrates in the middle <strong>Orange</strong><br />
<strong>River</strong>, South Africa. Southern African Journal of Aquatic Sciences 19(1/2): 14-33.<br />
Palmer, R.W. 1994. Detrimental effects of fenthion (Queletox UL), used to control redbilled<br />
Quelea (Quelea quelea), on rheophilic benthic macroinvertebrates in the <strong>Orange</strong><br />
<strong>River</strong>. Southern African Journal of Aquatic Siences 20(1/2): 33-37.<br />
Palmer, R.W. 1994. Principles of integrated control of blackflies (Diptera: Simuliidae) in<br />
South Africa. WRC <strong>Report</strong> No. 650/1/97.<br />
Palmer, R.W. and Palmer, A.C. 1995. Impacts of repeated applications of Bacillus<br />
thuringiensis var. israelensis de Barjac and temephos, used in blackfly (Diptera:<br />
Simuliidae) control, on macroinvertebrates in the middle <strong>Orange</strong> <strong>River</strong>, South Africa.<br />
Southern African Journal of Aquatic Sciences 21(1/2): 35-55.<br />
Fish<br />
Benade, B. 2003. Appendix 4. Draft report: The ecological importance and sensitivity<br />
of the Lower <strong>Orange</strong> <strong>River</strong> downstream of 20° latitude to the <strong>Orange</strong>-Fish <strong>River</strong><br />
confluence. Lower <strong>Orange</strong> <strong>River</strong> <strong>Management</strong> Study – Task 8.3. Unpublished report<br />
for Ninham Shand, Cape Town.<br />
Benade, C, M.T. Seaman and C.P. de Vries. 1995. Fishways in the <strong>Orange</strong> <strong>River</strong><br />
System. In: Fishway Criteria Workshop. Proceedings of a workshop to evaluate<br />
fishway monitoring results and to formulate guidelines for determining the necessity for<br />
and design of fishways in South Africa. D’Nyala Nature Reserve 2-5 May 1995.<br />
13/11/2007 Final<br />
158
<strong>Orange</strong> IWRMP<br />
Task 7: Environment<br />
Compiled by AH Bok. <strong>Water</strong> Research Commission and the Department of <strong>Water</strong><br />
Affairs and Forestry.<br />
Benade, C. 1988. Episodic flood events in the <strong>Orange</strong> <strong>River</strong> System – an ecological<br />
perspective. Paper (3.6) presented at a conference on Floods in Perspective.<br />
Organizing Committee, Floods in Perspective - C.104, CSIR, PO Box 395, Pretoria,<br />
0001 Republic of South Africa.<br />
Benade, C. 1990. Neus-Auhrabies Government <strong>Water</strong> Scheme: Environmental impact<br />
report on the proposed Neusberg Weir in the <strong>Orange</strong> <strong>River</strong>. Department of <strong>Water</strong><br />
Affairs and Forestry <strong>Report</strong> No, B16/79/21/1.<br />
Benade, C. 1993. Studies on fish populations in the regulated <strong>Orange</strong> <strong>River</strong> System<br />
within the borders of the Cape Province. Unpublished M.Sc. thesis (Volume 1: Text;<br />
Volume 2: Figures and Tables), University of the <strong>Orange</strong> Free State, Bloemfontein.<br />
Skelton, P.H.and Cambray, J.A. 1981. The freshwater fishes of the Middle and Lower<br />
<strong>Orange</strong> <strong>River</strong>. Koedoe 24:51-66.<br />
General water resources<br />
DWAF (2002) National <strong>Water</strong> Resource Strategy (Act 23711 of 2002)<br />
DWAF (2003). Upper <strong>Orange</strong> WMA Internal Strategic Perspective: Central Region<br />
Compiled for Department of <strong>Water</strong> Affairs and Forestry by PDNA, V3, WMB and WRP<br />
DWAF, 1998a. <strong>Orange</strong> <strong>River</strong> Development Project. Replanning Study (ORDRS).<br />
Hydrology and System Analysis – <strong>Orange</strong> <strong>River</strong> Basin. Department of <strong>Water</strong> Affairs &<br />
Forestry. Pretoria.<br />
DWAF, 1998b. <strong>Orange</strong> <strong>River</strong> Development Project – Replanning Study. <strong>Water</strong> Quality<br />
Aspects. <strong>Orange</strong> <strong>River</strong> Basin: Volume 1: Expected <strong>Water</strong> Quality Changes.<br />
Department of <strong>Water</strong> Affairs & Forestry. Pretoria.<br />
DWAF, 1999. <strong>Orange</strong> <strong>River</strong> Development Project Replanning Study. Main <strong>Report</strong>.<br />
Department of <strong>Water</strong> Affairs & Forestry. Pretoria.<br />
DWAF, 2002. National <strong>Water</strong> Resource Strategy. Proposed First Edition, August 2002.<br />
Department of <strong>Water</strong> Affairs & Forestry. Pretoria.<br />
Heath, R.G.H. (2004). Current status of the upper <strong>Orange</strong> <strong>River</strong>. DWAF <strong>Report</strong> no.<br />
2004/022/07<br />
Muir; C., Maré; M du Plessis; F., van der Merwe; B. and Crosby, C. 2004, <strong>Water</strong><br />
Requirements, <strong>Report</strong> for Prefeasibility Study Into Measures To Improve The<br />
13/11/2007 Final<br />
159
<strong>Orange</strong> IWRMP<br />
Task 7: Environment<br />
<strong>Management</strong> Of The Lower <strong>Orange</strong> <strong>River</strong> And To Provide For Future Developments<br />
Along The Border Between Namibia And South Africa, July 2004.<br />
Venter, G.C; (2002) <strong>Water</strong> Quality of the Upper <strong>Orange</strong> <strong>River</strong>. Dissertation in fulfilment<br />
of the requirements for a MSc degree. Department of Botany and Genetics.University<br />
of the Free State, Bloemfontein.<br />
WCD (World Commission on Dams), 2000. Dams and development. A new framework<br />
for decision making. The <strong>Report</strong> of the World Commission on Dams. World<br />
Commission on dams. www.dams.org.<br />
Environmental flows<br />
A. Birkhead, V. Alavian, J. King, C. Brown. Specialist report - volume 1: hydraulics;<br />
volume 2: aquatic habitat mapping. (November 1999), vi + 23pp.; vi + 74pp. (<strong>Report</strong><br />
no. LHDA-F-12). See item 233.598.<br />
A. H. Arthington, J. L. Rall, M. J. Kennard. Specialist report - fish. (November 1999),<br />
viii + 80pp. <strong>Report</strong> no. LHDA-F-18). See item 164.040.<br />
Albert Roseboom, Martin Thoms. Specialist report - volume 1 sedimentology; volume 2<br />
geomorphology. (November 1999), iv + 37pp.; vi + 58pp. (<strong>Report</strong> no. LHDA-F-14).<br />
See item 233.600<br />
Brown, C and King, J (editors) 2003. Volume II: IFR methodology. LHDA 648-F-03.<br />
Consulting services of the establishment and monitoring of the instream flow<br />
requirements for river courses downstream of LHWP Dams. Unpublished Metsi<br />
Consultants <strong>Report</strong> to Lesotho Highlands Development Authority. Metsi Consultants,<br />
Lesotho.<br />
C. Boucher, S. Tlale. Specialist report - volume 1: riparian vegetation; volume 2: social<br />
vegetation. (November 1999), x + 98pp.; ii + 20pp. (<strong>Report</strong> no. LHDA-F-16). See<br />
items 233.602, 223.140 (Boucher) and 227.830 (Tlale).<br />
C. Brown, J. King, H. Sabet, S. Yance. Biophysical consequencies of the Treaty<br />
Scenario. (June 2000), ix + 158pp. maps. (<strong>Report</strong> no. LHDA 648-F-05). See item<br />
233.595.<br />
C. Brown, J. King, H. Sabet, S. Yance. Biophysical consequences of the Minimum<br />
Degradation Scenario. (April 2000), viii + 135pp. maps. (<strong>Report</strong> no. LHDA 648_F_04).<br />
See item 233.594.<br />
13/11/2007 Final<br />
160
<strong>Orange</strong> IWRMP<br />
Task 7: Environment<br />
C. Brown, J. King, H. Sabet, S. Yance. Biophysical consequencies of the Design<br />
Limitation Scenario. (June 2000), x + 138pp. maps. (<strong>Report</strong> no. LHDA 648-F-06). See<br />
item 233.596.<br />
C. Brown, J. King, H. Sabet, S. Yance. Biophysical consequencies of the ‘Fourth’<br />
Scenario. (June 2000), x + 152pp. maps. (<strong>Report</strong> no. LHDA 648-F-07). See item<br />
233.597.<br />
C. Brown, J. King. Project structure, vol. 1: terms of reference, study area and<br />
programme of events; vol. 2: IFR methodology. (April 2000), vi + 27pp.; x + 180pp.<br />
(<strong>Report</strong> no. LHDA 648-F-03). See item 233.593.<br />
Cate Brown, Jackie King, Hossein Sabet. Monitoring protocol. (June 2000), xiv + 69pp.<br />
map. (<strong>Report</strong> no. LHDA-F-23). See item 233.607.<br />
Christian Boehm, David Hall. Specialist report - sociology. (November 1999), viii +<br />
79pp. (<strong>Report</strong> no. LHDA-F-08). See item 63.694.<br />
Daniel Phororo. Specialist report - animal health. (November 1999), xii + 52pp. (<strong>Report</strong><br />
no. LHDA-F-10). See item 95.698.<br />
DWAF (2005) Pre-Feasibility Study Into Measures To Improve The <strong>Management</strong> Of<br />
The Lower <strong>Orange</strong> <strong>River</strong> And To Provide For Future Developments Along The Border<br />
Between Namibia And South Africa : Specialist <strong>Report</strong> on the Environmental Flow<br />
Requirements – <strong>River</strong>ine.: CA Brown. <strong>Report</strong> Status : Final DWAF RSA <strong>Report</strong> No.:<br />
PB D000/00/4503<br />
H. Sabet, S. Yance. Specialist report - hydrology. (November 1999), 6 volumes.<br />
(<strong>Report</strong> no. LHDA-F-13). See item 233.599<br />
H. Sabet, S. Yance. Specialist report - yield analysis. (June 2000), viii + irreg. pag.<br />
totalling 22pp. + 10pp. of figs. + 5 appendices totalling 41pp. (<strong>Report</strong> no. LHDA-F-20).<br />
See item 233.604.<br />
Heath, R.G.H. et al. (2001). Development and conservation planning for the <strong>Orange</strong><br />
<strong>River</strong> mouth. <strong>Report</strong> to the SDI of DBSA.<br />
Hossein Sabet. Sociological report of the four scenarios. (June 2000), xii + 181pp.<br />
map. (<strong>Report</strong> no. LHDA-F-21). See item 233.605.<br />
J. King, H. Sabet, C. Brown, S. Hirst. Final report: summary of main findings. (June<br />
2000), x + 74pp. + 5 annexes totalling 15pp. maps. (<strong>Report</strong> no. LHDA 648-F-02). See<br />
item 233.592.<br />
13/11/2007 Final<br />
161
<strong>Orange</strong> IWRMP<br />
Task 7: Environment<br />
Moeketsi Majoro. Specialist report - economics. (June 2000), xvii + 95pp. map. (<strong>Report</strong><br />
no. LHDA-F-22). See item 233.606.<br />
R. Skoroszewski, F. de Moor. Specialist report - macroinvertebrates. (November<br />
1999), xii + 146pp. (<strong>Report</strong> no. LHDA-F-17). See item 163.813.<br />
R. Skoroszewski. Specialist report - water quality. (November 1999), x + 137pp.<br />
<strong>Report</strong> no. LHDA-F-15). See item 233.601<br />
Rose Phillips. Specialist report - public health. (June 2000), xix + 62pp. (<strong>Report</strong> no.<br />
LHDA-F-09). See item 154.609.<br />
S. Ferreira, N. Jacobsen. Specialist report - volume 1: wildlife and birds; volume 2:<br />
herpetofauna. (November 1999), xii + 87pp.; viii + 31pp. (<strong>Report</strong> no. LHDA-F-19). See<br />
items 223.603, 163.334 (Ferreira) and 165.360 (Jacobsen).<br />
S. Yance, H. Sabet. Specialist report - water supply. (November 1999), vii + 42pp.<br />
(<strong>Report</strong> no. LHDA-F-11). See item 236.598.<br />
678 Contract 678: Additional Scenarios and Production of a New Final <strong>Report</strong> to<br />
Augment Consulting Services for the Establishment and Monitoring of the Instream<br />
Flow Requirements for <strong>River</strong> Courses Downstream of LHWP Dams.<br />
[Maseru]: Metsi Consultants (June 2000), 5 different bound volumes, of which 4<br />
volumes belong to a single numbered report.<br />
The Contract for Additional Scenarios and Production of a New Final <strong>Report</strong> to<br />
Augment Consultancy Services for Establishing and Monitoring Instream Flow<br />
Requirements Downstream from LHWP Dams was awarded to Metsi Consultants, a<br />
joint venture of Southern <strong>Water</strong>s Ecological Research and Consulting Pty Ltd (South<br />
Africa); and Snowy Mountains Engineering Company (SMEC) International Pty Ltd<br />
(Australia). The contract is essentially a continuation of Contract 648, and it produced<br />
two numbered reports as follows:<br />
H. Sabet, C. Brown, S. Hirst. Final report: summary of main findings for Phase 1<br />
Development. (June 2000), viii + 44pp. + annexes totalling 8pp. (<strong>Report</strong> no. LHDA<br />
678-F-01). See item 233.608.<br />
H. Sabet, S. Yance, C. Brown, P. Martel, M. Majoro. Analysis of the Minimum<br />
Degradation, Treaty, Design Limitation and Fourth Scenarios for Phase 1 Development.<br />
(June 2000), 4 vols. (<strong>Report</strong> no. LHDA 678-F-02). See item 233.609.<br />
13/11/2007 Final<br />
162
<strong>Orange</strong> IWRMP<br />
Task 7: Environment<br />
Environmental flows Lesotho<br />
Contract 648: Consulting Services for the Establishment and Monitoring of the<br />
Instream Flow Requirements for <strong>River</strong> Courses Downstream of LHWP Dams.<br />
[Maseru]: Metsi Consultants (November 1999, June 2000), 28 different bound<br />
volumes, of which 5 volumes comprise 2 ‘volumes’ bound together as a single report.<br />
The Contract for Consultancy Services for Establishing and Monitoring Instream Flow<br />
Requirements Downstream from LHWP Dams was awarded to Metsi Consultants, a<br />
joint venture of Southern <strong>Water</strong>s Ecological Research and Consulting Pty Ltd (South<br />
Africa); and Snowy Mountains Engineering Company (SMEC) International Pty Ltd<br />
(Australia). For this project, reports are numbered LHDA 648-F-XX, where XX runs<br />
from 02 to 23. Some of these reports (notably 03, 12, 14, 16, 19) contain two volumes<br />
on different topics bound together, while report 13 is in 6 separate volumes. The<br />
number 01 was apparently allocated for the Inception <strong>Report</strong>, which has not been<br />
seen. Apart from the Inception <strong>Report</strong>, there are 22 final reports bound in 27 parts,<br />
covering 27 topics. The individual reports and the sections in the bibliography where<br />
they can be found area as follows:<br />
J. King, H. Sabet, C. Brown, S. Hirst. Final report: summary of main findings. (June<br />
2000), x + 74pp. + 5 annexes totalling 15pp. maps. (<strong>Report</strong> no. LHDA 648-F-02). See<br />
item 233.592.<br />
C. Brown, J. King. Project structure, vol. 1: terms of reference, study area and<br />
programme of events; vol. 2: IFR methodology. (April 2000), vi + 27pp.; x + 180pp.<br />
(<strong>Report</strong> no. LHDA 648-F-03). See item 233.593.<br />
C. Brown, J. King, H. Sabet, S. Yance. Biophysical consequences of the Minimum<br />
Degradation Scenario. (April 2000), viii + 135pp. maps. (<strong>Report</strong> no. LHDA 648_F_04).<br />
See item 233.594.<br />
C. Brown, J. King, H. Sabet, S. Yance. Biophysical consequencies of the Treaty<br />
Scenario. (June 2000), ix + 158pp. maps. (<strong>Report</strong> no. LHDA 648-F-05). See item<br />
233.595.<br />
C. Brown, J. King, H. Sabet, S. Yance. Biophysical consequencies of the Design<br />
Limitation Scenario. (June 2000), x + 138pp. maps. (<strong>Report</strong> no. LHDA 648-F-06). See<br />
item 233.596.<br />
13/11/2007 Final<br />
163
<strong>Orange</strong> IWRMP<br />
Task 7: Environment<br />
C. Brown, J. King, H. Sabet, S. Yance. Biophysical consequencies of the ‘Fourth’<br />
Scenario. (June 2000), x + 152pp. maps. (<strong>Report</strong> no. LHDA 648-F-07). See item<br />
233.597.<br />
Christian Boehm, David Hall. Specialist report - sociology. (November 1999), viii +<br />
79pp. (<strong>Report</strong> no. LHDA-F-08). See item 63.694.<br />
Rose Phillips. Specialist report - public health. (June 2000), xix + 62pp. (<strong>Report</strong> no.<br />
LHDA-F-09). See item 154.609.<br />
Daniel Phororo. Specialist report - animal health. (November 1999), xii + 52pp. (<strong>Report</strong><br />
no. LHDA-F-10). See item 95.698.<br />
S. Yance, H. Sabet. Specialist report - water supply. (November 1999), vii + 42pp.<br />
(<strong>Report</strong> no. LHDA-F-11). See item 236.598.<br />
A. Birkhead, V. Alavian, J. King, C. Brown. Specialist report - volume 1: hydraulics;<br />
volume 2: aquatic habitat mapping. (November 1999), vi + 23pp.; vi + 74pp. (<strong>Report</strong><br />
no. LHDA-F-12). See item 233.598.<br />
H. Sabet, S. Yance. Specialist report - hydrology. (November 1999), 6 volumes.<br />
(<strong>Report</strong> no. LHDA-F-13). See item 233.599<br />
Albert Roseboom, Martin Thoms. Specialist report - volume 1 sedimentology; volume 2<br />
geomorphology. (November 1999), iv + 37pp.; vi + 58pp. (<strong>Report</strong> no. LHDA-F-14).<br />
See item 233.600<br />
R. Skoroszewski. Specialist report - water quality. (November 1999), x + 137pp.<br />
<strong>Report</strong> no. LHDA-F-15). See item 233.601<br />
C. Boucher, S. Tlale. Specialist report - volume 1: riparian vegetation; volume 2: social<br />
vegetation. (November 1999), x + 98pp.; ii + 20pp. (<strong>Report</strong> no. LHDA-F-16). See items<br />
233.602, 223.140 (Boucher) and 227.830 (Tlale).<br />
R. Skoroszewski, F. de Moor. Specialist report - macroinvertebrates. (November<br />
1999), xii + 146pp. (<strong>Report</strong> no. LHDA-F-17). See item 163.813.<br />
A. H. Arthington, J. L. Rall, M. J. Kennard. Specialist report - fish. (November 1999),<br />
viii + 80pp. <strong>Report</strong> no. LHDA-F-18). See item 164.040.<br />
S. Ferreira, N. Jacobsen. Specialist report - volume 1: wildlife and birds; volume 2:<br />
herpetofauna. (November 1999), xii + 87pp.; viii + 31pp. (<strong>Report</strong> no. LHDA-F-19).<br />
See items 223.603, 163.334 (Ferreira) and 165.360 (Jacobsen).<br />
13/11/2007 Final<br />
164
<strong>Orange</strong> IWRMP<br />
Task 7: Environment<br />
H. Sabet, S. Yance. Specialist report - yield analysis. (June 2000), viii + irreg. pag.<br />
totalling 22pp. + 10pp. of figs. + 5 appendices totalling 41pp. (<strong>Report</strong> no. LHDA-F-20).<br />
See item 233.604.<br />
Hossein Sabet. Sociological report of the four scenarios. (June 2000), xii + 181pp.<br />
map. (<strong>Report</strong> no. LHDA-F-21). See item 233.605.<br />
Moeketsi Majoro. Specialist report - economics. (June 2000), xvii + 95pp. map. (<strong>Report</strong><br />
no. LHDA-F-22). See item 233.606.<br />
Cate Brown, Jackie King, Hossein Sabet. Monitoring protocol. (June 2000), xiv + 69pp.<br />
map. (<strong>Report</strong> no. LHDA-F-23). See item 233.607.<br />
678 Contract 678: Additional Scenarios and Production of a New Final <strong>Report</strong> to<br />
Augment Consulting Services for the Establishment and Monitoring of the Instream<br />
Flow Requirements for <strong>River</strong> Courses Downstream of LHWP Dams.<br />
[Maseru]: Metsi Consultants (June 2000), 5 different bound volumes, of which 4<br />
volumes belong to a single numbered report.<br />
The Contract for Additional Scenarios and Production of a New Final <strong>Report</strong> to<br />
Augment Consultancy Services for Establishing and Monitoring Instream Flow<br />
Requirements Downstream from LHWP Dams was awarded to Metsi Consultants, a<br />
joint venture of Southern <strong>Water</strong>s Ecological Research and Consulting Pty Ltd (South<br />
Africa); and Snowy Mountains Engineering Company (SMEC) International Pty Ltd<br />
(Australia). The contract is essentially a continuation of Contract 648, and it produced<br />
two numbered reports as follows:<br />
H. Sabet, C. Brown, S. Hirst. Final report: summary of main findings for Phase 1<br />
Development. (June 2000), viii + 44pp. + annexes totalling 8pp. (<strong>Report</strong> no. LHDA<br />
678-F-01). See item 233.608.<br />
H. Sabet, S. Yance, C. Brown, P. Martel, M. Majoro. Analysis of the Minimum<br />
Degradation, Treaty, Design Limitation and Fourth Scenarios for Phase 1 Development.<br />
(June 2000), 4 vols. (<strong>Report</strong> no. LHDA 678-F-02). See item 233.609.<br />
LESOTHO<br />
Ambrose, D. (1991). A tentative History of Lesotho Palaeontology. NUL Journal of<br />
Research, Occasional Publication No.1.<br />
Budget Speech to Parliament of the Kingdom of Lesotho. Fiscal Year 2002/2003<br />
Bureau of Statistics (2001) Education Ststistics (1994-1998). GoL. Maseru.<br />
13/11/2007 Final<br />
165
<strong>Orange</strong> IWRMP<br />
Task 7: Environment<br />
Bureau of Statistics (2001). National Accounts (1980-2000). GoL, Maseru.<br />
Central Bank of Lesotho. Annual <strong>Report</strong>s (1990 - 2000)<br />
Consta D. (1987). Preservation of Historical Buildings and Sites in Maseru. (Maseru<br />
Development <strong>Plan</strong> Working Paper 3A). Lesotho Government, Physical <strong>Plan</strong>ning<br />
Division.<br />
Consta D. (1987). Preservation of Historical Buildings and Sites in Maseru. (Maseru<br />
Development <strong>Plan</strong> Working Paper 3A). Lesotho Government, Physical <strong>Plan</strong>ning<br />
Division.<br />
Sevenhuysen P. (1999) Lesotho Land-cover Change Project Summary - Phase 1.<br />
CSIR. Pretoria.<br />
DYELEC Lesotho (2000). Upgrading and Strengthening of the 33kV Distribution<br />
System Including Increasing Capacity of the Thetsane 33/11kV Substation to<br />
2x20MVA and the Provision of the New 2x10MVA Tikoe 33/11kV Substation: Revised<br />
Designed Proposal.<br />
Government of Lesotho (2001) A Document Outlining the Functional Roles of Land<br />
Use <strong>Plan</strong>ning Division - Mininstry of Agriculture, Cooperatives and Land Reclamation,<br />
and Physical <strong>Plan</strong>ning Division - Ministry of Local Government. Ministries of Agriculture<br />
and Local Government. Maseru.<br />
Government of Lesotho (1988). Design Standards for Roads and Bridges. Vol. 9.<br />
Guidelines for Environmental Control. Roads Department. Maseru.<br />
Government of Lesotho (1989). National Environmental Action <strong>Plan</strong>.GoL. Maseru.<br />
Government of Lesotho (1994). National Action <strong>Plan</strong> to Implement Agenda 21. Ministry<br />
of Finance, Economic <strong>Plan</strong>ning and Manpower Development. Maseru.<br />
Government of Lesotho (1995). Lesotho Agenda 21 National Investment Programme.<br />
NES, Maseru.<br />
Government of Lesotho (1996) National Environment Policy. National Environment<br />
Secretariat. Maseru.<br />
Government of Lesotho (1998) Sixth National Development <strong>Plan</strong> (1996/97-1998/1999).<br />
Ministry of Development <strong>Plan</strong>ning, Maseru.<br />
Government of Lesotho (1999). Draft Guidelines for Environmental<br />
Assessment. Maseru. Government of Lesotho.<br />
Impact<br />
13/11/2007 Final<br />
166
<strong>Orange</strong> IWRMP<br />
Task 7: Environment<br />
Government of Lesotho (1999). National <strong>Water</strong> Policy. Department of <strong>Water</strong> Affairs,<br />
Ministry of Natural <strong>Resources</strong>. Maseru.<br />
Government of Lesotho (2000) HIV/AIDS STD Situation in Lesotho. MHSW. Maseru.<br />
Government of Lesotho (2000) National AIDS Strategic <strong>Plan</strong> 2000/2001-2003/3004.<br />
GoL, Maseru.<br />
Government of Lesotho (2000) Sexually Transmitted Infections Prevention and Control<br />
Programme. MHSW, Maseru.<br />
Government of Lesotho (2000). Interim Poverty Strategy Paper. Ministry of<br />
Development <strong>Plan</strong>ning, Maseru.<br />
Government of lesotho (2000) report of Land policy review commission. Ministry of<br />
Local government, Maseru.<br />
Government of Lesotho (2000). Lesotho Sectoral Improvement and Reform<br />
Programme Policy Framework. Ministry of Public Service. Maseru.<br />
Government of Lesotho (2000). National <strong>Report</strong> on Climate Change: First National<br />
Communication to the Conference of the Parties to the United Nations Framework<br />
Convention on Climate Change. Ministry of Natural <strong>Resources</strong>. Maseru.<br />
Government of Lesotho (2000). National Strategy on Lesotho's Biological Diversity:<br />
Conservation and Sustainable Use. National Environment Secretariat. Ministry of<br />
Environment, Gender and Youth Affairs. Maseru.<br />
Government of Lesotho (2001). Draft Guidelines for Environmental<br />
Assessment. NIRAS/NES Maseru.<br />
Impact<br />
Government of Lesotho (2001). Environment Act. GoL, Maseru.<br />
Government of Lesotho (Undated). Strategic <strong>Plan</strong> for the Ministry of Industry, Trade<br />
and Marketing. Ministry of Industry, Trade and Marketing, Maseru.<br />
Government of Lesotho (Undated). The Constitution of Lesotho. Morija. Lesotho.<br />
Government of Lesotho. (2000). Tourism Development <strong>Plan</strong> for the Kingdom of<br />
Lesotho. Ministry of Tourism, Sports & Culture. Maseru.<br />
Government of Lesotho. (2001). Interim Poverty Reduction Strategy Paper. Ministry of<br />
Development <strong>Plan</strong>ning. Maseru.<br />
Historical Monuments, Relics, Fauna and Flora Act 1967, No. 41/1967.<br />
13/11/2007 Final<br />
167
<strong>Orange</strong> IWRMP<br />
Task 7: Environment<br />
Kaplan, J. (1992). Archaeological Excavations at Liphofung Cave. Maseru: Lesotho<br />
Highlands Development Authority.<br />
Kaplan, J. (1992). Archaeological Excavations at Liphofung Cave. Maseru: Lesotho<br />
Highlands Development Authority.<br />
Kaplan, J. (1993). The Archaeology of the ‘Muela Rock-shelter. Maseru: Lesotho<br />
Highlands <strong>Water</strong> Authority.<br />
Kaplan, J. (1993). The Archaeology of the ‘Muela Rock-shelter. Maseru: Lesotho<br />
Highlands <strong>Water</strong> Authority.<br />
Kaplan, J. (1996). Archaeological Excavations at Lithakong. Maseru: Lesotho<br />
Highlands Development Authority.<br />
Kaplan, J. (1996). Archaeological Excavations at Lithakong. Maseru: Lesotho<br />
Highlands Development Authority.<br />
Lekholoane L. (2002) Helvetas Lesotho 2001 Annual <strong>Report</strong>. Maseru, Lesotho.<br />
Lesotho Electricity Corporation. Maseru, Lesotho.Electricity Act 1969, No 7/1969.<br />
LHDA (1999) <strong>Water</strong> Quality Monitoring of Kao <strong>River</strong> System. <strong>Water</strong> Quality Section,<br />
Maseru.<br />
Lesotho National Development Corporation (October 2001). Tikoe Industrial Estate<br />
Traffic Study <strong>Report</strong>, Maseru.<br />
Lesotho <strong>Water</strong> and Sewage Authority Order 29 of 1991, as amended in 1993.<br />
Lesotho <strong>Water</strong> and Sewage Authority Order 29 of 1991, as amended in 1993.<br />
LNDC (Undated). LNDC Industrial Infrastructural Development Project Proposal.<br />
Maseru. Lesotho.<br />
Loubser, J. (1993). Provisional <strong>Report</strong> on the Conservation of Fourteen Painted Rock<br />
Shelters Affected by Phase 1A of the Lesotho Highlands <strong>Water</strong> Project. Maseru:<br />
Lesotho Highlands Development Authority.<br />
Loubser, J. (1993). Provisional <strong>Report</strong> on the Conservation of Fourteen Painted Rock<br />
Shelters Affected by Phase 1A of the Lesotho Highlands <strong>Water</strong> Project. Maseru:<br />
Lesotho Highlands Development Authority.<br />
Mabote T. and Molapo L. (2001). The Proposed Sustainability Indicators for Lesotho's<br />
State of the Environment <strong>Report</strong> 2002. NES-DANCED. Maseru.<br />
13/11/2007 Final<br />
168
<strong>Orange</strong> IWRMP<br />
Task 7: Environment<br />
Maliehe, E.B. (1997).Medicinal <strong>Plan</strong>ts and Herbs of Lesotho. A Visual Guide to 60<br />
Species from Around the Country. Mafeteng: Mafeteng Development Project.<br />
Metsi Consultants (2000). Consulting Services for the Establishment and Monintoring<br />
of the Instream Flow Requirements for <strong>River</strong> Courses Downstream of LHWP Dams:<br />
Final <strong>Report</strong>. LHDA. Maseru.<br />
MoA (1995). People and their Land: Production Through Conservation in Lesotho.<br />
Bahr Mapping and Printing, Maseru.<br />
Nielson P. (2000). ACP-EU Partnership Agreement: COTONOU Agreement.<br />
Oosthuizen, T. (2000). Proposed <strong>Water</strong> Quality Guidelines for Lesotho: Domestic<br />
(drinking) water guidelines. African Environmental <strong>Management</strong> Services.<br />
O'Riordan T. (2000). Environmental Science for Environmental <strong>Management</strong>.Pearson<br />
Ed. Ltd. United Kingdom.<br />
Phororo. D.R. (2001). Action Programme for Development of Lesotho 2001-2010.<br />
Ministry of Development <strong>Plan</strong>ning, Maseru.<br />
Prasad, G. (1998). Palaeontological Survey of the Maseru By-pass. Maseru: Lesotho<br />
Highlands Development Authority.<br />
Prasad, G. (1998). Palaeontological Survey of the Maseru By-pass. Maseru: Lesotho<br />
Highlands Development Authority.<br />
Protection and Preservation Commission (1983). Lesotho’s Heritage in Jeopardy.<br />
Morija: Morija Printing Works.<br />
Public Health Order 1970, No 12/1970.<br />
Quinlan, T. (1995). Grasslanf Degradation and Livestock Rearing in Lesotho. Journal<br />
of Southern African Studies, 21(13): 491-507.<br />
Sechaba Consultants (1994). Poverty in Lesotho: A mapping exercise. Sechaba<br />
Consultants. Maseru.<br />
Sechaba Consultants (2000). Poverty and Livelihoods in Lesotho - More than a<br />
Mapping Exercise. Maseru.<br />
TAMS Consultants & Associates, (1996). <strong>Water</strong> Resource <strong>Management</strong>: Policy and<br />
Strategies Study: Annexes E-I <strong>Report</strong> for the Department of <strong>Water</strong> Affairs, Ministry of<br />
Natural <strong>Resources</strong>, GoL. Maseru.<br />
Town and Country <strong>Plan</strong>ning Act 1980, No. 11/1980.<br />
13/11/2007 Final<br />
169
<strong>Orange</strong> IWRMP<br />
Task 7: Environment<br />
U.S Government (2000). The African Growth and Opportunity Act. Washington DC.<br />
U.S.A.<br />
UNCED (1992). UNCED, The Earth Summit. Connect, vol. XVII, no. 2. June 1992.<br />
UNDP (1997). A study of NGO Activities in Lesotho - 1996. Maseru<br />
UNDP (2000). Common Country Assessment: Lesotho. Maseru.<br />
UNDP (Undated). United Nations Development Assistance Framework. Maseru.<br />
<strong>Water</strong> <strong>Resources</strong> Act 1978, No 22/1978, amended LN 17/1985<br />
REFERENCES FROM LESOTHO EXTRACTED FROM PROFESSOR DAVID<br />
AMBROSE’S BIOBLIOGRAPHY<br />
ECOLOGY<br />
300 The South African Land-cover Characteristics Database: a synopsis of<br />
the landscape.<br />
D. H. K. Fairbanks, M. W. Thompson, D. E. Vink, T. S. Newby, H. M. vand den Berg,<br />
D. A. Everard. South African Journal of Science (ZA), vol. 96, no. 2 (February 2000),<br />
pp. 69-82. maps.<br />
The land-cover data base described here covers Lesotho, South Africa and Swaziland,<br />
within which area the largest surface type (34.1%) is shrubland and low fynbos,<br />
followed by 21.3% grassland, 17.6% thicket and bushland; and 12.2% cultivated land.<br />
As far as Lesotho is concerned, most land is unimproved grassland (37.2%) or<br />
degraded unimproved grassland (26.8%), followed by dryland cultivation (mainly in the<br />
lowlands) (22.6%), shrubland and low fynbos (mainly at very high altitude) (9.7%), and<br />
thicket and bushland (mainly in the foothills) (2.6%). All other areas are under 1% and<br />
these include urban and residential land (0.33%), barren rock (0.25%) and wetlands<br />
(0.21%). Commercial dryland and forest plantations are each calculated at 0.06%,<br />
while all three of waterbodies, irrigated areas, and dongas (and sheet erosion scars)<br />
are all calculated at 0.03%. The area of actual forest is given at 144 ha, less than<br />
0.005% of the total area.<br />
Although the article states that ‘the research results reported here are definitive’, it is<br />
clear that for Lesotho some areas have been underrestimated, including residential<br />
land (which seems to include urban but not rural residential use); and also the area of<br />
dongas and sheet erosion scars. Forest at 144 ha must also be underestimated.<br />
13/11/2007 Final<br />
170
<strong>Orange</strong> IWRMP<br />
Task 7: Environment<br />
The database was designed and produced as a joint venture between a number of<br />
South African bodies including the Centre for Scientific and Industrial research (CSIR).<br />
A range of methods was used including satellite imagery. A coloured map across the<br />
front and back covers of the same issue of the SAJR shows the land-cover<br />
classification for the three country region.<br />
Agriculture; Forest; Grassland; Land claasifiation; Satellite imagery; Vegetation types;<br />
Wetlands.<br />
584 Manual for a plant community ecology and field taxonomy training<br />
course for extension and technical officers of the Range Managment Division,<br />
Lesotho.<br />
C. D. Morris, J. B. M. Browning, N. M. Tainton, R. F. Buzzard. [S. l.]: [s. n.] (December<br />
1994), iv + 183pp. map. illus.<br />
The exact provenance of this publication is not clear from internal evidence, but three<br />
authors work in Pietermaritzburg, and Buzzard was at the time working in the<br />
Community Natural <strong>Resources</strong> <strong>Management</strong> Project of USAID in Maseru.<br />
The emphasis in the manual is on the high altitude flora, divided here (following Killick<br />
(1963) and Jacot Guillarmod, Flora of Lesotho (1971)) into a Montane Belt (2000 -<br />
2400m), Subalpine Belt (2400 - 2900m) and an Alpine Belt above 2900m. Despite its<br />
atypical features, many of the examples are taken from the Sehlabathebe National<br />
Park.<br />
The book is divided into four chapters, beginning with ‘An introduction to the vegetation<br />
of Lesotho’, well illustrated with photographs and diagrams. It is surprising to read here<br />
however that Aloe polyphylla is not a Lesotho endemic (surely an error). An appendix<br />
to this chapter at page 70 is the paper Morris, Tainton & Boleme (1993).<br />
A short chapter describes ‘Introduction to plant collection and storage procedures’, and<br />
shows examples of labelled herbarium specimens.<br />
Chapter 3 deals particularly with identification of grasses and similar plants, and<br />
includes a list of some 72 common grasses found in the Maloti in the Mokhotlong area,<br />
as well as 11 sedges and 4 rushes.<br />
The last chapter is by R. F. Buzzard, and is ‘An introduction to ecological monitoring’,<br />
and deals with the seetting up of monitoring sites and the making of transects. Key<br />
indicators of range condition are parameters which include total canopy cover, basal<br />
cover, bare soil, litter, average plant distance, soil condition, percentage of palatable<br />
13/11/2007 Final<br />
171
<strong>Orange</strong> IWRMP<br />
Task 7: Environment<br />
(to livestock!) grasses, and the range condition index. An example of transect data is<br />
given for the Phororong Basin in the Pelaneng/Bokong Range <strong>Management</strong> Area. [E.<br />
D. May]<br />
Aloe polyphylla; Ecological monitoring; Grasses; Grassland ecology; Herbarium<br />
technique; Mokhotlong; <strong>Plan</strong>t collecting; Range <strong>Management</strong>; Sehlabathebe<br />
National Park; Soil condition; Transects.<br />
586 A threatened resource: Lesotho’s alpine wetlands, unique in many<br />
ways, are facing a complexity of threats.<br />
Craig Morris, Stefan Grab. African Wildlife (ZA), vol. 51, no. 3 (May/June 1997), pp.<br />
14-16. illus.<br />
This article makes a distinction between bogs with a high water table and submerged<br />
inter-hummock areas; and fens which have their water table below the vegetated<br />
surface. Mention is also made of flarks defined as water-filled depressions.<br />
There is a general description of Lesotho’s high altitude wetlands of the ecology with<br />
mention of selected typical plant and animal species. The Sehlabathebe water lily,<br />
Aponogeton ranunculiflorus is mentioned as having been found recently (1989)<br />
growing in wetland pools along the Drakensberg escarpment (more details are not<br />
given).<br />
Attention is drawn to the impact of the recent Mokhotlong tarred road construction,<br />
which has bulldozed its way through several wetlands. The problems of overgrazing<br />
are also discussed. [9]<br />
Aponogeton ranunculiflorus; Bogs; Ecology; Fens; Mokhotlong; Road<br />
construction; Wetlands.<br />
588 Classification of the eastern alpine vegetation of Lesotho.<br />
C. D. Morris, N. M. Tainton, S. Boleme. African Journal of Range and Forage Science<br />
(??), vol. 10 (1993), pp. 47-53. map.<br />
This paper derives from the Maloti/Drakensberg Catchment Conservation Programme.<br />
The study in the extreme east of Lesotho identified five particular vegetation<br />
communities occupying particular topographical positions. These are described in<br />
some detail, three of them occupying the Alpine Belt (above 2900 m) and two<br />
occupying the Subalpine Belt (2400 to 2900 m). Proportions of plants in each of the<br />
communities is tabulated, and in particular certain grass types classified according to<br />
photosynthetic pathway (C 3 or C 4 ).<br />
13/11/2007 Final<br />
172
<strong>Orange</strong> IWRMP<br />
Task 7: Environment<br />
This paper can also be found reproduced at page 70 of C. D. Morris, J. B. M.<br />
Browning, N. M. Tainton & R. F. Buzzard (1994). [E. D. May]<br />
Alpine vegetation; Maloti/Drakensberg Catchment Conservation Programme;<br />
Photosynthetic pathways; Vegetation communities.<br />
900 Primary divisions of the biomes of South Africa.<br />
R. H. Westfall, J. M. van Staden. South African Journal of Science, vol. 92, no. 8<br />
(August 1996), pp. 373-375. maps.<br />
This article describes a mapping of biomes in Lesotho, South Africa, and Swaziland by<br />
means of mean annual rainfall in relation to the existing Acocks Veld Type map. 16<br />
subdivisions of biomes were determined in this way and are mapped in colour. From<br />
these a biome map is derived showing six biomes, the desert biome being omitted.<br />
The biome map shows most of Lesotho in the Grassland Biome, but also, rather<br />
anomalously and without comment, assigns the summit plateau to the Nama-Karoo<br />
Biome.<br />
Biomes.<br />
GUIDES<br />
450 Identification guide to the basaltic flora of Lesotho.<br />
H. P. Linder, C. Mokuku. [S. l.]: [s. n.] [2000], 45pp. illus.<br />
Although publication details are missing from this item, the senior author is Keeper of<br />
the Bolus Herbarium at the University of Cape Town and it seems that the book was<br />
published from there, but with assistance from the Lesotho Highlands Development<br />
Authority and the Foundation for Reseach Development.<br />
The booklet is intended to assist both amateurs and professionals to identify plant<br />
species. It contains descriptions of 382 plant species, apparently mainly collected in<br />
the Mohale and Katse catchments. The species are described and where there is a<br />
voucher specimen in the Bolus Herbarium (eventually to be transferred to Lesotho),<br />
the details are given. The species are arranged under families, the main<br />
characteristics of which are also described. Of the described species there are new<br />
species (yet to be scientifically described and published) in the genera Crassula,<br />
Delosperma, Heliochrysum, Heliophila and Kniphofia.<br />
Colour photographs of 72 of the plant species (six to a page) are provided on<br />
unnumbered pages.<br />
13/11/2007 Final<br />
173
<strong>Orange</strong> IWRMP<br />
Task 7: Environment<br />
The introducation mentions the intention to include Sesotho plant names, but that this<br />
edition does not yet have them.<br />
Basalt; Bolus Herbarium; Field guides (plants); Flora of basalt; Katse catchment;<br />
Mohale catchment; New species; <strong>Plan</strong>t species.<br />
ENVIRONMENTAL LAW<br />
100 Legal aspects of water resources management.<br />
David Ambrose, George Radosevich, Norton Tennille. Maseru: <strong>Water</strong> <strong>Resources</strong><br />
<strong>Management</strong> Project (May 1996), 186pp. + 3 tables. (Annex A to Main <strong>Report</strong>).<br />
The original of this report was published as Annex A (together with Annexes B & C,<br />
which deal respectively with Institutional and International aspects of water resources<br />
management) as one of the seven volumes of the <strong>Water</strong> resources management:<br />
policy and strategies study. It has also been separately bound for library use.<br />
500 Environmental Bill 2000.<br />
Lesotho Parliament. [Maseru]: the Parliament (2000), vii + 77pp.<br />
This Bill was a long time in gestation, and it can be traced back to the framework law<br />
proposed in Witzsch & Ambrose (1992) (text in Annex II to Part III of the book). By<br />
1996, the Bill had been largely drafted by the Assistant Parliamentary Secretary, and<br />
there is an extensive commentary on this version in appendix B in Ambrose,<br />
Radosevich & Tennille (1996).<br />
The Bill proposes the setting up of a set of bureaucratic structures for the management<br />
of the environment and natural resources, headed by a National Environmental<br />
Council, the membership of which is rather similar to the Cabinet augmented with<br />
representation from several outside bodies. Its members include the Prime Minister<br />
and Deputy Prime Minister as Chairman and Vice-Chairman respectively.<br />
The Council is the supreme body in the formulation of policy, but responsibility for<br />
environmental management is vested in a Lesotho Environment Authority (LEA),<br />
set up as a body corporate and governed by a Board of Directors, of which the<br />
Government Secretary is to be Chairman. The Chief Executive of the LEA is appointed<br />
by the Minister responsible for the environment on the advice of the Board, and the<br />
LEA essentially replaces the existing National Environment Secretariat.<br />
13/11/2007 Final<br />
174
<strong>Orange</strong> IWRMP<br />
Task 7: Environment<br />
The LEA in turn is advised by a Technical Advisory Committee of eight members.<br />
Moreover, each Line Ministry (Ministry responsible for a law with environmental<br />
implications) is also required to establish an environmental unit.<br />
The Bill also makeS provision for the National Environmental Action <strong>Plan</strong> (to be<br />
revised every five years), District Environmental Action <strong>Plan</strong>s, Environmental Impact<br />
Assessments, Environmental Quality Standards, Pollution Control, Environmental<br />
<strong>Management</strong> (including conservation of biological diversity), Environmental<br />
Restoration Orders, and Procedures for Environmental Inspection, Analysis and<br />
Record Keeping. There are also provisions for environmental information<br />
dissemination (including a ‘State of the Environment and Environment <strong>Management</strong><br />
<strong>Report</strong>’ to be published every five years. A National Environment Fund is also<br />
established administered by the Chief Executive of the LEA. [IE EN/F112/0006]<br />
Environmental Impact Assessment; Environmental management; Environmental<br />
quality standards; Environment Bill 1990; Lesotho Environment Authority;<br />
National Environmental Action <strong>Plan</strong>; National Environment Council; Pollution<br />
control.<br />
SOIL EROSION<br />
100 Geomorphic effects of soil erosion.<br />
Heinrich R. Beckedahl, Tanya A. S. Bowyer-Bower, George F. Dardis, Patricia M.<br />
Hanvey. In: The geomorphology of southern Africa. Edited by Bernard P. Moon and<br />
George F. Dardis. Johannesburg: Southern Book Publishers (1988), pp. 249-276. illus.<br />
maps.<br />
The authors provide a concise survey of the factors which determine the extent and<br />
intensity of soil erosion in southern Africa. Rainfall impact, infiltration, sheetwash, rill<br />
erosion, gully erosion and subsurface erosion (including pipe development) are<br />
discussed along with wind erosion. Also discussed are the geomorphic effects of soil<br />
erosion, the rate of development of soil erosion features, and erosion hazard<br />
assessment. Literature cited includes a number of references to studies on soil erosion<br />
in Lesotho.<br />
Erosion hazard assessment; Geomorphology; Soil erosion.<br />
520 On the Follow Up of the International Convention to Combat<br />
Desertification and its Urgent Action for Africa: report on the SADC Sub-<br />
Regional <strong>Plan</strong>ning and Programming Workshop, Pretoria 8_10 March 1995.<br />
13/11/2007 Final<br />
175
<strong>Orange</strong> IWRMP<br />
Task 7: Environment<br />
P. S. Maro. Maseru: Southern African Development Community Environment and Land<br />
<strong>Management</strong> Sector (June 1995), 150pp.<br />
The SADC Environment and Land <strong>Management</strong> Sector (SADC-ELMS) has its<br />
secretariat located within the Ministry of Agriculture in Maseru. It has been active in<br />
addressing problems of land degradation and desertification. Prior to the Earth Summit<br />
in Rio in 1992, it produced a regional report, Sustaining our common future which<br />
became part of Agenda 21, the action plan to achieve sustainable development in the<br />
21st century.<br />
After Rio, the UN General Assembly established a Committee from whose<br />
deliberations was drafted the International Convention to Combat Desertification<br />
(CCD) which was finalized in June 1994 and opened for signature in October 1994. In<br />
the same year SADC-ELMS prepared a SADC Sub-Regional Case Study on Drought<br />
and Desertification, the draft of which was approved by SADC member states in June<br />
1994. Pending the CCD coming into force, strategies of an Urgent Action for Africa<br />
component of the CCD had become a United Nations Environmental Programme<br />
supported action agenda, for which this SADC workshop was arranged.<br />
The workshop includes country reports by eleven of the SADC countries. The Lesotho<br />
report is K. Mafura & J. Molapo, Outline of the Lesotho National Strategy to Combat<br />
Desertification and Mitigate Effect of Drought (Annex 3B, p. 49-62), and was prepared<br />
by the National Desertification Steering Committee. The report describes national<br />
policies and programmes and the status of key sectoral programmes for combating<br />
desertification. There is also a section entitled ‘Elements of Lesotho’s National Action<br />
Programme for Combating Desertification and Effects of Land Degradation’ in which<br />
objectives, actions required and activities are listed under the headings Accelerated<br />
Afforestation, Livestock, Rangeland <strong>Resources</strong> <strong>Management</strong>, Land Use <strong>Management</strong>,<br />
<strong>Water</strong> <strong>Resources</strong> <strong>Management</strong>, and Energy Savings and the Using of Alternative<br />
Energy Sources. Activities listed under <strong>Water</strong> <strong>Resources</strong> <strong>Management</strong> include<br />
measures required (but details not specified) to protect bogs and sponges; and the<br />
establishment of 30 additional drought/rainfall reporting and monitoring stations.<br />
There is also a comparative tabular summary of the various National Action<br />
Programmes at p.5-13.<br />
The main report includes issues discussed, general observations and conclusions from<br />
National Action Programme presentations, and consideration of Sub-Regional Action<br />
13/11/2007 Final<br />
176
<strong>Orange</strong> IWRMP<br />
Task 7: Environment<br />
Programmes. There is a section indicating the scheduling of Priority Action Programme<br />
Areas and a discussion of potential funding mechanisms and resources.<br />
Amongst other issues is the need to rationalise SADC activities with those of<br />
SARCCUS, the Southern African Regional Commission on the Conservation and<br />
Utilisation of Soil, which was established in 1948 at a meeting in Goma in Zaire, and<br />
has had a permanent secretariat since 1950.<br />
Annex 4 is a SADC-ELMS paper entitled SADC sub-regional action programmes in<br />
combating desertification and mitigating the effects of drought. This lists the three<br />
ELMS Programme Areas of Land <strong>Management</strong> (four projects and sub-programmes);<br />
<strong>Water</strong> <strong>Resources</strong> <strong>Management</strong> (five projects and sub-programmes); and Environment<br />
<strong>Management</strong>, Monitoring and Assessment (five projects and sub-programmes). Detail<br />
on most of the projects and sub-programmes is, however, scanty.<br />
For a follow-up report, see item 760. [9]<br />
Convention to Combat Desertification; Desertification; SADC-ELMS; SARCCUS;<br />
Soil erosion.<br />
760 On Sub-Regional Action Programme in the Implementation of the<br />
Convention to Combat Desertification and its urgent action for Africa: report on<br />
the SADC Consultations and Workshop, Windhoek, Namibia, 16-18 January<br />
1996.<br />
Southern African Development Community - Environment & Land <strong>Management</strong> Sector.<br />
Maseru: SADC-ELMS (1996), [vii +]147pp.<br />
This report is a follow-up to item 520, and SADC-ELMS is taken as author/editor<br />
because there is no identified editor of the publication, although possibly this role was<br />
played by Umesh Kumar, who undertook the desktop composition.<br />
The workshop was attended by 78 participants and had as objectives inter alia to<br />
review key elements for an action programme for the SADC region for implementing<br />
the Convention to Combat Desertification; to formulate strategies for public<br />
participation; to share experiences by SADC member states on their National Action<br />
Programme Process.<br />
The Lesotho Country <strong>Report</strong> by N. M. ’Mota and Kabelo Mafura is on pp. 52-58, and<br />
much of the introductory material is the same as the report in item 520. A number of<br />
activities during 1995 are reported on including district workshops to introduce the<br />
Convention and workshops for traditional doctors, journalists and herdboys. Eight on-<br />
13/11/2007 Final<br />
177
<strong>Orange</strong> IWRMP<br />
Task 7: Environment<br />
going national Rural Development Porjects are listed with descriptions and capital<br />
investment.<br />
It is also noted that Lesotho ratified the Convention to Combat Desertification on<br />
12 September 1995. [9]<br />
Convention to Combat Desertification; Desertification; Soil erosion.<br />
800 Oral evidence in historical environmental impact assessment: soil<br />
conservation in Lesotho in the 1930s and 1940s.<br />
Kate B. Showers, Gwendolyn M. Malahleha. Journal of Southern African Studies (GB),<br />
vol. 18, no. 2 (June 1992), p. 276-296.<br />
This paper derives from hypotheses developed in Kate Showers’ 1982 Cornell<br />
University PhD thesis, where it was suggested that the colonial soil conservation<br />
scheme using contour ridges may in fact have exacerbated soil erosion by creating<br />
new erosion gullies. The authors discuss evidence from a small sample of oral<br />
informants (3 in Quthin and 6 in ‘Mobu’ [Ha Tšilo]) about the nature and impact of the<br />
soil conservation campaigns in the 1930s and 1940s. The applicability of oral<br />
methodologies in ‘historical environmental impact assessment’ is also discussed. [9]<br />
Environmental impact assessment; Oral history; Soil conservation; Soil erosion.<br />
SENSITIVE AREAS<br />
200 Nationally significant natural areas of Lesotho.<br />
Alan C. Beverly. [Sehlabathebe, Lesotho]: [the author] (June 1977), 4pp. mimeo.<br />
The author identifies a number of areas of special significance (particularly from the<br />
botanical point of view), including the Likolobeng tributary of the Makhaleng; the<br />
Quthing Valley; the Tsoelike Valley; Sehlabathebe National Park; the area adjoining<br />
the Drakensberg Escarpment; an area SE of Mantšonyane; the Maphotong Gorge;<br />
and Qiloane Falls. The author travelled extensively through Lesotho while carrying out<br />
a Spiral Aloe survey in 1976-7. [9]<br />
Drakensberg Escarpment; Likolobeng; Mantšonyane; Maphotong Gorge;<br />
Qiloane Falls; Quthing Valley; Sehlabathebe National Park; Tsoelike Valley.<br />
301 Peace parks: the dream & the facts.<br />
Ross Douglas. Keeping Track (ZA), (October/November 1997), p. 44-49. illus. maps.<br />
13/11/2007 Final<br />
178
<strong>Orange</strong> IWRMP<br />
Task 7: Environment<br />
The peace park movement encourages the creation of Transfrontier Conservation<br />
Areas (TFCAs) straddling international boundaries. Seven such TFCAs are proposed<br />
for areas bordering South Africa, of which one, the Drakensberg/Maloti TFCA straddles<br />
South Africa’s border with Lesotho. This TFCA is envisaged as covering 5000 km 2 of<br />
land, approximately half of it in north-eastern Lesotho. At present the land on the<br />
South African side of the border is mainly managed by the Natal Parks Board,<br />
although there is a portion which is ‘communally owned’. On the Lesotho side of the<br />
border all the land is ‘communally owned’.<br />
The concept of Peace Parks originated from a 1988 Commission of the International<br />
Union for the Conservation of Nature (IUCN), from which a Southern African Peace<br />
Parks Foundation took its cue after a 1990 meeting between Anton Rupert, President<br />
of the South African World Wildlife Fund and President Joaquim Chissano of<br />
Mozmbique. The Foundation’s original aims were linked to cross-border projects<br />
between South Africa and Mozambique, in particular linking Kruger Park with areas on<br />
the Mozambique side of the border. The geographical scop of the aims has expanded<br />
to cover other areas, using the more inclusive TFCA model where formal national<br />
parks are not appropriate.<br />
Drakensberg/Maloti Park; Peace parks.<br />
Pollution and Degradation Control<br />
500 Is it the rich or the poor, the rural or the urban that contribute more in<br />
environmental degradation?<br />
M. P. Nkuatsana. [Maseru]: [Paper given at LEINET (Lesotho Environmental Network)<br />
Seminar held at the British Council, Maseru (14 October 1997)], 7pp.<br />
This paper is by a representative of the Lesotho Youth Federation. It points out the<br />
difficulties of quantifying relative impact, and that population increase and population<br />
distribution are of major importance in environmental degradation. [9]<br />
Environmental degradation; LEINET; Lesotho Youth Federation; Population;<br />
700 Encouraging regional sustainable development: a role for South Africa<br />
as a “JI Intermediary”.<br />
Ian H. Rowlands. Africa Insight (ZA), vol. 27, no. 3 (1997), pp. 200-206. illus.<br />
13/11/2007 Final<br />
179
<strong>Orange</strong> IWRMP<br />
Task 7: Environment<br />
This article is concerned with the obligations of countries to keep greenhouse gases in<br />
the year 2000 no higher than in 1990 levels, with more stringent future targets. Within<br />
this context, the concept of ‘joint impleentation ’(JI) is being discussed by which a<br />
country could meet its reduction obligations in another country. The author assesses<br />
the possible role of South Africa as a ‘JI intermediary’ with its SADC neighbours.<br />
Tables show Lesotho as receiving the 9th largest foreign investment development<br />
amongst the 12 SADC countries ($13 million average for th period 1991-5); and also<br />
show Lesotho as having the 5th lowest financial risk ranking amongst the twelve<br />
countries (this data being quoted from Euromoney of March 1997). [9]<br />
FORESTRY<br />
Community forestry in Lesotho: the people’s perspective; a report on the Social<br />
Forestry Study prepared for a Community Forestry Programme for the Kingdom<br />
of Lesotho.<br />
David Hall, Thuso Green. [Maseru]: Overseas Development Administration of the<br />
United Kingdom [for Lesotho Government Ministry of Agriculture Forestry Division]<br />
(December 1989, reprinted 1996), [xiii +] 233pp. illus.<br />
This publication is the most important source of information on the attitudes of people<br />
in Lesotho to tree planting. The report is based on both existing literature (including<br />
Sesotho literature) and research undertaken by a team of participant-observers who<br />
stayed in villages in nine widely dispersed parts of Lesotho.<br />
Traditional knowledge about trees is widespread in villages, and the management of<br />
indigenous woodland and certain plantations fall under the chieftainship. The Woodlot<br />
Project, on the other hand, although establishing substantial new plantations<br />
throughout Lesotho has had the disadvantage of creating a dependency syndrome.<br />
Trees were only planted when woodlots were established or maintained through ‘food<br />
for work’ schemes. Moreover, the types of trees planted were determined by the<br />
project, not by villagers who (at least for personal household ownership) preferred to<br />
have access to good quality fruit trees, not timber trees.<br />
Land acquired for woodlots became forestry reserves, acquired by the state and<br />
beyond village control, and the only obligation to the village was to make available<br />
20% of revenue generated by the woodlots. Acquisition of land for woodlots was<br />
generally initiated through a traditional village pitso. but the authors point out that<br />
pitsos are highly defective as democratic institutions, being easily dominated by one<br />
group or another.<br />
13/11/2007 Final<br />
180
<strong>Orange</strong> IWRMP<br />
Task 7: Environment<br />
Once established, woodlots are extremely inefficient in terms of the amount of time of<br />
foresters needed to manage such matters as the sale of wood, which villagers feel free<br />
to steal, since they see the woodlots as government rather than community owned.<br />
Woodlots also acquire bad reputations as harbouring criminals, and since they were<br />
seen as established by the government of the day (which until 1993 was undemocratic<br />
and unpopular) were sometimes subjected to acts of vandalism or arson.<br />
Community forestry is used in the report to mean non-governmental tree cultivation by<br />
entire villages for the benefit of all in the village. The <strong>Report</strong> advocates a model for<br />
Community Forestry in which Village Tree Committees are established along the lines<br />
of the existing successful Village <strong>Water</strong> Committees. The Forestry Division’s future role<br />
would then become one of advice and training as well as provision of seedlings.<br />
The report includes an extensive bibliography, and four Appendices, one of which is a<br />
somewhat inaccurate list of Sesotho and Latin names of Lesotho indigenous tree<br />
species. The photographic supplement (‘Appendix 5’) does not appear in the published<br />
version of the report, even though mention of it on page 28 might expect the reader to<br />
think otherwise.<br />
For a perceptive and lively review of the book by F. C. Brideswater, see Journal of<br />
Dendrology, no. 13 (1991), p. 66-67.<br />
Community development; Community forestry; Indigenous trees; Trees,<br />
indigenous; Participant research; Village Tree Committees; Woodlot Project.<br />
RANGE<br />
614 Grassland degradation and livestock rearing in Lesotho.<br />
Tim Quinlan. Journal of Southern African Studies (GB), vol. 21, no. 3 (September<br />
1995), p. 491-507.<br />
Quinlan’s work is based on extensive observation of livestock practices in the late<br />
1980s in Mokhotlong District. He reviews the history of transhumance and settlement<br />
in the Maloti, and colonial and post-colonial interventions. However, despite major<br />
donor-supported projects, there remains a ‘blindness of current<br />
‘development/conservation’ projects in Lesotho to the character of local stock-rearing<br />
characteristics’. He notes that despite official judgments of ‘overstocking’, the size of<br />
the national herd has oscillated around the current figure for the past 50 years. He<br />
takes issue on some of James Ferguson’s findings in his 1990 book, The anti-politics<br />
13/11/2007 Final<br />
181
<strong>Orange</strong> IWRMP<br />
Task 7: Environment<br />
machine. Sheep and goats and the labour of herd boys are cash commodities in a<br />
different way from cattle and horses.<br />
Amongst details given in the paper are survival rates per annum for livestock, the<br />
recent innovation of ‘winter’ cattle posts in mountain valleys; and the way in which<br />
stover, formerly a communal resource, is now taken by farmers as fodder, reflecting<br />
perhaps increased ownership rights over land.<br />
In relation to the problem of degradation of mountain catchments, Quinlan states: ‘If<br />
we accept that Basotho have developed sophisticated stock-rearing practices, we<br />
must acknowledge that they have been relatively successful in minimising grassland<br />
degradation, even if there is legitimate concern that their efforts are no longer<br />
adequate’. By contrast, he is critical of the Range <strong>Management</strong> Areas created as a<br />
result of a USAID-supported project, these areas ignoring existing boundaries between<br />
jurisdictions.<br />
Conservation of catchments has current topicality, both as a means to reduce siltation<br />
of Lesotho Highlands <strong>Water</strong> project dams, and as part of a conservation strategy for<br />
the Drakensberg/Maloti Catchment Conservation Programme, funded by South Africa<br />
and initiated in 1987.<br />
Catchment protection; Cattle; Cattle posts; Donkeys; Drakensberg/Maloti<br />
Catchment Protection Project; Ferguson, J.; Goats; Grassland degradation;<br />
Herdboys; Horses; Mokhotlong; Mules; Range <strong>Management</strong> Areas; Sheep;<br />
Transhumance; USAID.<br />
Land tenure issues in livestock development and range management.<br />
Steven W. Lawry. In: Proceedings Land Act Policy Seminar, Quthing, Lesotho, March<br />
18-22, 1984. Lesotho Government Ministry of Agriculture. [Maseru]: the Ministry<br />
(March 1984), pp. 95-110.<br />
Describes how various factors, particularly herd size and ownership patterns interact<br />
with range ecology, household income strategies, administrative resources and<br />
economic forces to constrain land tenure options.<br />
The grasses and pastures of South Africa.<br />
Lucy K. A. Chippindall and others. [S. l.]: Central News Agency for the Trustees of ‘The<br />
grasses and Pastures of South Africa Book Fund’ (1955), xvi + 771pp. illus. maps.<br />
13/11/2007 Final<br />
182
<strong>Orange</strong> IWRMP<br />
Task 7: Environment<br />
This standard work on the grasses of southern Africa is well illustrated in black and<br />
white with some colour plates. For some species distribution maps are included which<br />
show Lesotho records. In other cases, Lesotho is included in verbal description of<br />
distributions.<br />
Grasses include bamboos (including the wild bamboo of Lesotho); and the book also<br />
includes grasses (many of them introduced) which are food plants. Thus maize, wheat,<br />
barley, oats etc are described. There is also information on lawn grasses including<br />
Kikuyu grass introduced from East Africa, and the cosmopolitan Cynodon dactylon<br />
(couch-grass) which in Lesotho quickly colonizes and saves bare patches of soil from<br />
erosion.<br />
Part 1 (pp. 1-528) by Lucy K. A. Chippindall is ‘A guide to the identification of grasses<br />
in South Africa’.<br />
Part 2 (pp. 529-752) consists of 14 chapters by 17 authors on ‘Pasture management in<br />
South Africa’. Part 2 is wide-ranging including statistics of livestock (including some<br />
1951 figures for Lesotho), and material on the ecology of grasslands; on rotational<br />
grazing; and on virtually every economic use of grasses including the grasses used for<br />
airstrips.<br />
Three coloured maps, based on the work of J. P. H. Acocks, are tip-ins at the end of<br />
the book. One shows the vegetation in A.D. 1950, a second the possible vegetation in<br />
A.D. 2050 if prevailing tendencies continue, and a third the possible vegetation pattern<br />
under scientific management. Without scientific management, Lesotho is seen as<br />
almost totally invaded by the Karoo and by Karroid Bushveld. Under scientific<br />
management, sweet grassveld could be restored to much of the country.<br />
Final report: baseline biological survey, fauna and flora, Lesotho Highlands<br />
<strong>Water</strong> Project Phase 1A, Contract no. 75, vol. 2 - flora.<br />
Loxton, Venn & Associates. Johannesburg: Loxton, Venn & Associates [for] Lesotho<br />
Highlands Development Authority (September 1993), iv+111pp. +3 appendices<br />
totalling 40pp. illus. maps.<br />
This report includes an overview of previous ecological studies and also describes the<br />
grazing system in some detail together with the utilization of the vegetation by<br />
livestock. A chapter discusses the dynamics of the vegetation under different<br />
disturbance regimes, with an extensive discussion of the impact of grazing and the<br />
plants that increase, decrease or invade. Carrying capacities in livestock units per<br />
hectare (LSU/ha) are calculated for each vegetation community type, and it is<br />
13/11/2007 Final<br />
183
<strong>Orange</strong> IWRMP<br />
Task 7: Environment<br />
concluded that there will be a surfeit of 2078 LSU after impoundment, leading to<br />
livestock exceeding the ecological carrying capacity. A wide range of appropriate<br />
recommendations are made in relation to managing the stocking rate and grazing<br />
pressure.<br />
Anti-erosion policies in the mountain areas of Lesotho: the South African<br />
connection.<br />
Thackwray Driver. Environment and History (UK), vol. 5, no. 1 (1999), pp. 1-25.<br />
This paper looks at the political pressure placed on the colonial administration by<br />
South Africa in the late 1940s and early 1950s to impose policies such as grazing<br />
control. Soil erosion at the time became an important element in the debate about the<br />
transfer of the High Commission Territories to South African control.<br />
The paper, using Lesotho and South African archival sources, provides an historical<br />
account of concern about soil erosion in the Maloti, beginning with the forestry report<br />
of A. W. Heywood in 1908. Heywood proposed that trees might regulate the flow of<br />
water in the rivers, and this was taken up soon afterwards by Carlson (item 94.009)<br />
who advocated South Africa paying for the whole Maloti to be afforested. However, the<br />
colonial administration became mainly concerned about overgrazing and its impact on<br />
the livestock sector, as set out in a 1931 unpublished report of R. W. Thornton.<br />
After the Second World War, soil erosion in Lesotho became a live issue in relations<br />
between the colonial administration and South Africa, while the public was made<br />
aware of the problems by articles in Veld Trust News. Initially the colonial<br />
administration reacted by closing some mountain grazing areas, but culling schemes<br />
were opposed in the Basutoland National Council and elsewhere, the more so after a<br />
South Africa culling in Witzie’s Hoek led to unrest and loss of human lives.<br />
The story of interaction between Lesotho and South Africa is continued up until the<br />
1950s with shifting perceptions on the South African side of Lesotho’s future in terms<br />
of its apartheid policies.<br />
The article is largely based on the author’s PhD thesis (see item 670).<br />
Pastoral utilization and land cover change: a case study from the Sanqebethu<br />
valley, eastern Lesotho.<br />
Marcus Nüsser. Erdkunde: Archive für Wissenshaftliche Geographie (DE), vol. 56<br />
(2002), pp. 207-221. illus. maps.<br />
13/11/2007 Final<br />
184
<strong>Orange</strong> IWRMP<br />
Task 7: Environment<br />
This thorough study, which maps cattle posts and makes studies of changes using<br />
coloured satellite images, analyses recent developments of pastoral resource<br />
utilization and subsequent vegetation changes in the Sanqebethu valley east of<br />
Mokhotlong. High altitude grasslands showed a slight reduction of vegetation cover in<br />
the period 1989 to 1999.<br />
Land degradation and soil erosion in the eastern Highlands of Lesotho, southern<br />
Africa.<br />
Marcus Nüsser, Stefan Grab. Beitrag zur Physischen Geographie (DE), vol. 133<br />
(2002), pp. 291-311. illus. maps.<br />
This study looks particularly at human and animal interventions which have resulted in<br />
the transformation of high-altitude grasslands and wetlands in eastern Lesotho, looking<br />
at factors such as fire, overgrazing, and natural frost-induced processes. Case<br />
histories are presented of the Sanqebethu valley and the Sani Plateau region.<br />
Vegetation was sampled by transects and moderate to heavy grazing impact was<br />
found. In wetlands, hoof pressure of livestock was found to ply a role in gully<br />
development. Accelerated soil erosion was found to be partly related to fire, combined<br />
with wind, and repeat photography following a fire below Hodgson’s Peak illustrates<br />
this.<br />
Towards an integrated research approach for the Drakensberg and Lesotho<br />
mountain environments: a case study from the Sani Pass region.<br />
Stefan Grab, Marcus Nüsser. South African Geographical Journal (ZA), vol. 83 (2001),<br />
pp. 64-68. illus. map.<br />
This article makes reference to an intra-disciplinary research programme by<br />
geographers from the University of Bonn in Germany and the University of the<br />
Witwatersrand in South Africa whereby social and ecological investigations are being<br />
used for resource management. The Sani Top plateau area is taken as a case study<br />
region, where the writers found that the interactions between the natural and social<br />
systems in Lesotho are complex. Reference is made to the palatable grasses and<br />
scrubs and to transhumance practices. A map of the Sani Top area shows cattle posts<br />
classified by whether they are permanent, seasonal or deserted.<br />
13/11/2007 Final<br />
185
<strong>Orange</strong> IWRMP<br />
Task 7: Environment<br />
<strong>Report</strong> on a vegetation survey in pilot area of Mokhotlong District.<br />
Marcus Nüsser. Freiburg, Germany: PARTICIP Gmbh Consultants for Development &<br />
Environment [for] Maseru: National Environment Secretariat Drakensberg/Maloti<br />
Mountains Conservation Programme (1999?), ??pp.; rev. ed. (March 2001), vi + 33pp.<br />
This vegetation survey, preceded by a training course, was undertaken in the Alpine<br />
Belt of eastern Mokhotlong District from 6 to 21 April 1999. The report also includes<br />
the main findings from two winter surveys, one in the upper Sanqebethu valley, 11 - 18<br />
August 1999, and the other in the Sani area 28 August - 5 September 1999.<br />
The survey team carried out the range inventory using the metric belt transect method.<br />
Appendix D (pp. 22-28) provides the transect data and floristic composition of the<br />
transects. Appendix E lists the cattle population in summer and winter at various cattle<br />
posts and each records the months when the cattle post was occupied. There is,<br />
however, no map showing the location of the listed cattle posts.<br />
The writer advocates a human-ecological approach for monitoring changes in the<br />
alpine belt. He advocates repeat photography at different seasons, and notes the<br />
damage caused by seasonal illegal grassland burning.<br />
For closely related literature by Marcus Nüsser, see items 216.525 and 216.526.<br />
Grassland degradation and livestock rearing in Lesotho.<br />
Tim Quinlan. Journal of Southern African Studies (GB), vol. 21, no. 3 (September<br />
1995), p. 491-507.<br />
Quinlan’s work is based on extensive observation of livestock practices in the late<br />
1980s in Mokhotlong District. He reviews the history of transhumance and settlement<br />
in the Maloti, and colonial and post-colonial interventions. However, despite major<br />
donor-supported projects, there remains a ‘blindness of current<br />
‘development/conservation’ projects in Lesotho to the character of local stock-rearing<br />
characteristics’. He notes that despite official judgments of ‘overstocking’, the size of<br />
the national herd has oscillated around the current figure for the past 50 years. He<br />
takes issue on some of James Ferguson’s findings in his 1990 book, The anti-politics<br />
machine. Sheep and goats and the labour of herd boys are cash commodities in a<br />
different way from cattle and horses.<br />
Amongst details given in the paper are survival rates per annum for livestock, the<br />
recent innovation of ‘winter’ cattle posts in mountain valleys; and the way in which<br />
13/11/2007 Final<br />
186
<strong>Orange</strong> IWRMP<br />
Task 7: Environment<br />
stover, formerly a communal resource, is now taken by farmers as fodder, reflecting<br />
perhaps increased ownership rights over land.<br />
In relation to the problem of degradation of mountain catchments, Quinlan states: ‘If<br />
we accept that Basotho have developed sophisticated stock-rearing practices, we<br />
must acknowledge that they have been relatively successful in minimising grassland<br />
degradation, even if there is legitimate concern that their efforts are no longer<br />
adequate’. By contrast, he is critical of the Range <strong>Management</strong> Areas created as a<br />
result of a USAID-supported project, these areas ignoring existing boundaries between<br />
jurisdictions.<br />
Conservation of catchments has current topicality, both as a means to reduce siltation<br />
of Lesotho Highlands <strong>Water</strong> project dams, and as part of a conservation strategy for<br />
the Drakensberg/Maloti Catchment Conservation Programme, funded by South Africa<br />
and initiated in 1987.<br />
Catchment protection; Cattle; Cattle posts; Donkeys; Drakensberg/Maloti Catchment<br />
Protection Project; Ferguson, J.; Goats; Grassland degradation; Herdboys; Horses;<br />
Mokhotlong; Mules; Range <strong>Management</strong> Areas; Sheep; Transhumance; USAID.<br />
13/11/2007 Final<br />
187
<strong>Orange</strong> IWRMP<br />
Task 7: Environment<br />
11 APPENDIX A<br />
Fish in lower <strong>Orange</strong> <strong>River</strong> (extracted from DWAF 2005)<br />
Although situated in the driest part of the country, the freshwater fish species diversity<br />
of the LOR (Augrabies Falls to <strong>Orange</strong> <strong>River</strong> Mouth), listed in Table A.1, is the highest<br />
of any of the <strong>Orange</strong> <strong>River</strong> System, with 13 of the <strong>Orange</strong> <strong>River</strong> Systems’ total of 15<br />
indigenous freshwater fish species, naturally distributed in this river stretch. Of the fish<br />
species listed in Table 1:<br />
Oreochromis mossambicus, is an introduced indigenous species; andCyprinus<br />
carpio is an alien species.<br />
Table A1: Checklist of the Freshwater Fish Species found between Augrabies<br />
Falls and the <strong>Orange</strong> <strong>River</strong> Mouth (Skelton 1993; Benade 1993). (L = Large; M =<br />
Medium; S = Small; E - Endemic; I = Indigenous; V = Vulnerable; R = Red Data; In<br />
= Introduced; A = Alien)<br />
Mesobola brevianalis (<strong>River</strong> Sardine) is restricted to the LOR (Jubb, 1967), where it is<br />
the most common and abundant fish species (Skelton and Cambray 1981; Cambray<br />
1984; Benade 1993), found in the open water habitats of the mainstream, quiet<br />
backwaters, as well as flowing channels and rapids (Skelton and Cambray 1981;<br />
Benade 1993).<br />
Barbus paludinosus (Straightfin Barb) prefers quiet to slow flowing, moderately<br />
vegetated bays, shores, backwaters, pools and impounded areas, although its<br />
numbers are rather low (Skelton and Cambray, 1981).<br />
13/11/2007 Final<br />
188
<strong>Orange</strong> IWRMP<br />
Task 7: Environment<br />
The three cichlids, Pseudocrenilabrus philander (Southern Mouthbrooder), Tilapia<br />
sparrmanii (Banded Tilapia) and Oreochromis mossambicus (Mozambique Tilapia)<br />
prefer quiet, well-vegetated water for breeding purposes. Pseudocrenilabrus philander<br />
and Tilapia sparrmanii are the most abundant species in the well-vegetated,<br />
(extremely) slow flowing Vaal <strong>River</strong> section within the Northern Cape Province.<br />
Clarias gariepinus (Sharptooth Catfish), an omnivorous scavenger (Jubb 1967), which<br />
does not occur in large quantities under riverine conditions (Skelton and Cambray,<br />
1981; Cambray 1984; Benade 1993) is equipped with suprabranchial organs (pseudo<br />
lungs) with which it can survive in water of low oxygen content, and spawns in grassy<br />
places inundated by floodwaters of high oxygen content (Jubb, 1967). Barbus<br />
trimaculatus’ (Threespot Barb) habitat preference is rapid areas and its breeding is<br />
triggered by flow (Benade, 1993).<br />
Barbus hospes (Namaqua Barb) is endemic to the <strong>Orange</strong> <strong>River</strong> stretch between<br />
Augrabies Falls and the <strong>Orange</strong> <strong>River</strong> Mouth (Jubb, 1967), being most abundant<br />
downstream from Goodhouse (Cambray 1984; Benade 1993) and is Red Data listed<br />
(Skelton, 1987), favouring open flowing water, a sandy substrate and little vegetation<br />
(Cambray, 1984) in and around rapids (Benade, 1993), and appears to be a stream<br />
spawner (Benade, 1993).<br />
Barbus kimberleyensis (Largemouth Yellowfish) is a Red Data listed endemic (Jubb,<br />
1967) <strong>Orange</strong> <strong>River</strong> System predator (Jubb and Farquharson 1965; Mulder 1973),<br />
preferring clear, fast-flowing water with a sandy to gravel substrate (Mulder, 1973). It<br />
takes approximately seven years to mature sexually (Benade, 1993) and breeds in and<br />
below rapids (Skelton and Cambray, 1981) during the first post-winter floods<br />
(Tomasson and Allanson, 1983).<br />
Barbus aeneus (Smallmouth Yellowfish) is the most abundant large fish species in the<br />
LOR (Benade, 1993), and is an endemic (Jubb, 1967) opportunistic omnivore<br />
(Tomasson, 1983) preferring clear, fast-flowing water and a sandy to gravel substrate<br />
(Mulder, 1973; Skelton and Cambray 1981), for spawning (Jubb, 1967) during the first<br />
post-winter floods (Tomasson and Allanson, 1983).<br />
Labeo capensis (<strong>Orange</strong> <strong>River</strong> Mudfish), the dominant large <strong>Orange</strong> <strong>River</strong> System fish<br />
species (Mulder 1973b; Skelton and Cambray 1981) (although its numbers are<br />
declining towards the LOR [Benade, 1993]). It is an endemic (Jubb, 1967) detritivore<br />
Groenewald,1957; Jubb 1967), which appears to be utilizing all aquatic habitat types<br />
13/11/2007 Final<br />
189
<strong>Orange</strong> IWRMP<br />
Task 7: Environment<br />
(Mulder 1973b; Cambray 1984), breeding in floodplains, main streams and rapids<br />
(Cambray, 1985).<br />
Austroglanis sclateri (Rock Catfish) is an endemic Red Data listed (Skelton, 1987)<br />
omnivore (Jubb, 1967), which is not common, even in its preferred habitat (Skelton<br />
and Cambray, 1981), and appears to be highly specialised regarding its habitat<br />
requirements consisting basically of a rock/sand/gravel substrate, and ranging from<br />
bedrock with/without scattered rocks and sandy to gravel substrates, to rocky pools,<br />
rapids (Skelton and Cambray 1981; Cambray 1984; Benade 1993) and riffles, with the<br />
surrounding aquatic environment adhering to specific water quality standards (Benade,<br />
1993). The river stretch below Muggie Falls appears to be ideal A. sclateri habitat.<br />
13/11/2007 Final<br />
190