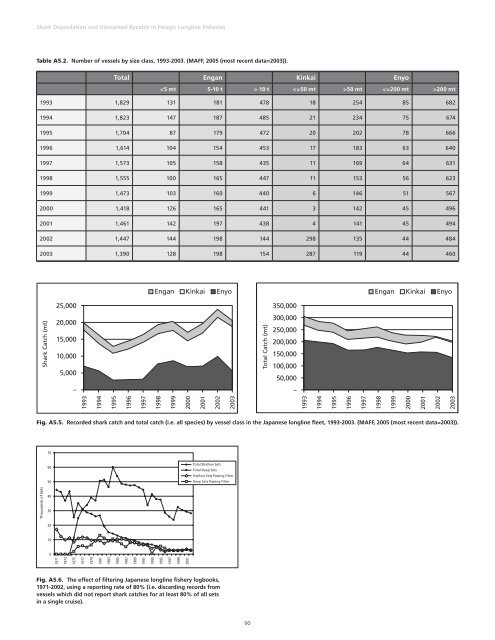
<strong>Shark</strong> <strong>Depredation</strong> <strong>and</strong> <strong>Unwanted</strong> <strong>Bycatch</strong> <strong>in</strong> <strong>Pelagic</strong> Longl<strong>in</strong>e Fisheries Table A5.2. Number of vessels by size class, 1993-2003. (MAFF, 2005 (most recent data=2003)). Total Engan K<strong>in</strong>kai Enyo 10 t 50 mt 200 mt 1993 1,829 131 181 478 18 254 85 682 1994 1,823 147 187 485 21 234 75 674 1995 1,704 87 179 472 20 202 78 666 1996 1,614 104 154 453 17 183 63 640 1997 1,573 105 158 435 11 169 64 631 1998 1,555 100 165 447 11 153 56 623 1999 1,473 103 160 440 6 146 51 567 2000 1,418 126 165 441 3 142 45 496 2001 1,461 142 197 438 4 141 45 494 2002 1,447 144 198 144 298 135 44 484 2003 1,390 128 198 154 287 119 44 460 Fig. A5.5. Recorded shark catch <strong>and</strong> total catch (i.e. all species) by vessel class <strong>in</strong> the Japanese longl<strong>in</strong>e fleet, 1993-2003. (MAFF, 2005 (most recent data=2003)). Fig. A5.6. The effect of filter<strong>in</strong>g Japanese longl<strong>in</strong>e fishery logbooks, 1971-2002, us<strong>in</strong>g a report<strong>in</strong>g rate of 80% (i.e. discard<strong>in</strong>g records from vessels which did not report shark catches for at least 80% of all sets <strong>in</strong> a s<strong>in</strong>gle cruise). 90
Japan <strong>Pelagic</strong> Longl<strong>in</strong>e Fisheries Table A5.3. Effort by vessel class, 1993-2003. Engan (days at sea) Source: MAFF (2005) Source: MAFF (2003) Calculated (see text for assumptions) K<strong>in</strong>kai (cruises) Enyo (cruises) K<strong>in</strong>kai (sets) Enyo (sets) Engan (hooks) K<strong>in</strong>kai (hooks) Enyo (hooks) 1993 104,173 1,600 2,041 37,426 154,106 104,173 74,852 308,212 1994 103,538 1,712 2,127 31,785 148,725 103,538 63,570 297,450 1995 101,658 1,435 2,009 28,113 141,744 101,658 56,226 283,488 1996 102,087 1,322 2,026 29,163 146,440 102,087 58,326 292,880 1997 108,097 1,233 1,961 25,396 148,716 108,097 50,792 297,432 1998 105,496 1,173 1,712 22,898 143,208 105,496 45,796 286,416 1999 107,304 1,092 1,423 22,973 127,200 107,304 45,946 254,400 2000 109,088 1,066 1,252 23,228 119,677 109,088 46,456 239,354 2001 110,638 1,036 1,220 22,161 124,614 110,638 44,322 249,228 2002 43,056 4,528 1,148 na na 43,056 na na 2003 46,403 4,443 1,045 na na 46,403 na na deep (7-20 hpb) showed a strik<strong>in</strong>g pattern. In a recent analysis, an analytical filter was applied to remove data from fishermen who do not always accurately record shark catches (Nakano <strong>and</strong> Clarke 2006). The filter works by assum<strong>in</strong>g that at least 80% of all sets <strong>in</strong> a s<strong>in</strong>gle cruise should record at least one shark <strong>and</strong> excludes data from cruises which do not meet this criterion. In other words, the number of sets <strong>in</strong> a cruise pass<strong>in</strong>g the filter can be used as a rough <strong>in</strong>dication of the frequency of shark catches <strong>and</strong> when the frequency is too low the report<strong>in</strong>g is suspect. When the effect of the filter was exam<strong>in</strong>ed separately for shallow <strong>and</strong> deep sets, the percentage of shallow sets pass<strong>in</strong>g the filter rema<strong>in</strong>ed consistently above 25% from 1971-1985 <strong>and</strong> from 1985 until 2002 more than 90% of the shallow sets passed the filter (Fig. A5.6). In contrast, dur<strong>in</strong>g the same period (1971-2002) the proportion of deep sets pass<strong>in</strong>g the filter ranged from 7-26%. These data seem to suggest that the depth of the set may determ<strong>in</strong>e the shark catch rate. However, when the location of shallow <strong>and</strong> deep sets was exam<strong>in</strong>ed it was revealed that proximity to Japanese ports is confounded with hooks per basket (a proxy variable for depth). Therefore, it may be location <strong>and</strong> not depth which is responsible for the observed trends. In particular, as the fishery developed (see Section A5.2) the location of the deep sets moved farther <strong>and</strong> farther offshore, co<strong>in</strong>cident with the expansion of the enyo fleet’s target<strong>in</strong>g of bigeye tuna. With<strong>in</strong> the small subset of the deep sets that rema<strong>in</strong>ed <strong>in</strong> nearshore waters (i.e. waters between 15-40ºN <strong>and</strong> 140-160ºE) a high percentage (80%) passed the filter (i.e. frequently recorded at least one shark per set) between 1971-1992 The shallow sets, which had a high rate of pass<strong>in</strong>g the filter were predom<strong>in</strong>antly made <strong>in</strong> <strong>in</strong>shore waters (15-50ºN <strong>and</strong> east of 180ºE) which are the fish<strong>in</strong>g grounds of the k<strong>in</strong>kai fleet. This f<strong>in</strong>d<strong>in</strong>g re<strong>in</strong>forces <strong>and</strong> partially expla<strong>in</strong>s the f<strong>in</strong>d<strong>in</strong>g of disproportionately high shark catches <strong>in</strong> the k<strong>in</strong>kai fleet. Given the available data, we cannot determ<strong>in</strong>e whether there is causality between the higher k<strong>in</strong>kai shark catch rates <strong>and</strong> a) the proximity to a market for sharks <strong>in</strong> Japanese ports <strong>and</strong>/or b) the effect of sett<strong>in</strong>g hooks at shallow depths. Fig. A5.6 <strong>in</strong>dicates that a very high proportion of shallow sets record catch<strong>in</strong>g sharks, whereas a very low proportion of deep sets record catch<strong>in</strong>g sharks (Source: NRIFSF unpublished data). A5.3.3. Calculation of nom<strong>in</strong>al shark CPUE Effort for the three longl<strong>in</strong>e fleets are currently published (MAFF 2005) <strong>in</strong> units of cruises for enyo <strong>and</strong> k<strong>in</strong>kai fleets, <strong>and</strong> days at sea for the engan fleet (Table A5.3, Columns 1-3). In previous years (e.g. MAFF 2003), effort for the enyo <strong>and</strong> k<strong>in</strong>kai fleets was published <strong>in</strong> units of sets (Table A5.3, Columns 4-5). If one assumes that each engan day at sea represents one set of on average 1,000 hooks, <strong>and</strong> each k<strong>in</strong>kai <strong>and</strong> enyo set represents on average 2,000 hooks, an approximate number of hooks fished by each fleet can be calculated (Table A5.3, Columns 6-8) thereby provid<strong>in</strong>g a common unit of effort for all three fleets. Comb<strong>in</strong><strong>in</strong>g the effort data <strong>in</strong> Table A5.3 with the annual shark catch data <strong>in</strong> Fig. A5.5a (i.e. year-by-year, fleet-specific shark catch divided by effort) produces nom<strong>in</strong>al catch per unit effort (CPUE) figures for sharks over the years 1993-2003. The engan <strong>and</strong> enyo fleets have a similar nom<strong>in</strong>al shark CPUE of 0.020 (sd=0.0022) for engan, <strong>and</strong> 0.021 (sd=0.0090) for enyo. The nom<strong>in</strong>al shark CPUE <strong>in</strong> 3 For an unknown reason, <strong>in</strong> 1993 the percentage of deep sets <strong>in</strong> nearshore waters which pass the filter drops suddenly below 20% <strong>and</strong> rema<strong>in</strong>s at this low level until 2002. While it may be possible that deep set longl<strong>in</strong>e operations changed abruptly <strong>in</strong> 1993, it is also possible that the <strong>in</strong>troduction of new logbook report<strong>in</strong>g formats <strong>in</strong> 1993 may also be a factor. 91
- Page 3 and 4:
Shark Depredation and Unwanted Byca
- Page 5:
Shark Depredation and Unwanted Byca
- Page 9 and 10:
Contents Summary and Conclusions 1
- Page 11 and 12:
Contents Appendix 3. Fiji Pelagic L
- Page 13:
Contents Appendix 8. USA Hawaii Lon
- Page 16 and 17:
Shark Depredation and Unwanted Byca
- Page 19 and 20:
Chapter 1 Introduction and Methods
- Page 21 and 22:
Introduction and Methods 1.2. Metho
- Page 23 and 24:
Fishing Gear and Operational Charac
- Page 25 and 26:
Fishing Gear and Operational Charac
- Page 27 and 28:
Shark Catch Rates and Disposition T
- Page 29 and 30:
Chapter 4 National and Internationa
- Page 31 and 32:
National and International Measures
- Page 33 and 34:
Economic, Practical, Ecological and
- Page 35 and 36:
Economic, Practical, Ecological and
- Page 37 and 38:
Chapter 6 Industry Attitudes and Pr
- Page 39 and 40:
Industry Attitudes and Practices Lo
- Page 41 and 42:
Industry Attitudes and Practices Fi
- Page 43 and 44:
Chapter 7 Potential of Deterrents,
- Page 45 and 46:
Potential of Deterrents, Hotspot Av
- Page 47 and 48:
References Campana, S.E., L. Marks,
- Page 49:
References Neves dos Santos, M., Ga
- Page 52 and 53:
Shark Depredation and Unwanted Byca
- Page 54 and 55: Shark Depredation and Unwanted Byca
- Page 56 and 57: Shark Depredation and Unwanted Byca
- Page 58 and 59: Shark Depredation and Unwanted Byca
- Page 60 and 61: Shark Depredation and Unwanted Byca
- Page 62 and 63: Shark Depredation and Unwanted Byca
- Page 64 and 65: Shark Depredation and Unwanted Byca
- Page 66 and 67: Shark Depredation and Unwanted Byca
- Page 68 and 69: Shark Depredation and Unwanted Byca
- Page 70 and 71: Shark Depredation and Unwanted Byca
- Page 72 and 73: Shark Depredation and Unwanted Byca
- Page 74 and 75: Shark Depredation and Unwanted Byca
- Page 76 and 77: Shark Depredation and Unwanted Byca
- Page 78 and 79: Shark Depredation and Unwanted Byca
- Page 80 and 81: Shark Depredation and Unwanted Byca
- Page 82 and 83: Shark Depredation and Unwanted Byca
- Page 84 and 85: Shark Depredation and Unwanted Byca
- Page 86 and 87: Shark Depredation and Unwanted Byca
- Page 88 and 89: Shark Depredation and Unwanted Byca
- Page 90 and 91: Shark Depredation and Unwanted Byca
- Page 92 and 93: Shark Depredation and Unwanted Byca
- Page 94 and 95: Shark Depredation and Unwanted Byca
- Page 96 and 97: Shark Depredation and Unwanted Byca
- Page 99 and 100: Appendix 5 Japan Pelagic Longline F
- Page 101 and 102: Japan Pelagic Longline Fisheries Fi
- Page 103: Japan Pelagic Longline Fisheries mo
- Page 107 and 108: Japan Pelagic Longline Fisheries is
- Page 109 and 110: Japan Pelagic Longline Fisheries ta
- Page 111 and 112: Japan Pelagic Longline Fisheries In
- Page 113 and 114: Japan Pelagic Longline Fisheries A5
- Page 115 and 116: Appendix 6 Peru Artisanal Mahimahi
- Page 117 and 118: Peru Artisanal Mahimahi And Shark L
- Page 119 and 120: Peru Artisanal Mahimahi And Shark L
- Page 121 and 122: Peru Artisanal Mahimahi And Shark L
- Page 123 and 124: Peru Artisanal Mahimahi And Shark L
- Page 125 and 126: Peru Artisanal Mahimahi And Shark L
- Page 127 and 128: Appendix 7 South Africa Pelagic Lon
- Page 129 and 130: South Africa Pelagic Longline Tuna
- Page 131 and 132: South Africa Pelagic Longline Tuna
- Page 133 and 134: South Africa Pelagic Longline Tuna
- Page 135 and 136: Appendix 8 USA Hawaii-based Pelagic
- Page 137 and 138: USA Hawaii-based Pelagic Longline S
- Page 139 and 140: USA Hawaii-based Pelagic Longline S
- Page 141 and 142: USA Hawaii-based Pelagic Longline S
- Page 143 and 144: USA Hawaii-based Pelagic Longline S
- Page 145 and 146: USA Hawaii-based Pelagic Longline S
- Page 147 and 148: Appendix 9 USA Atlantic, Gulf of Me
- Page 149 and 150: USA Atlantic, Gulf of Mexico and Ca
- Page 151 and 152: USA Atlantic, Gulf of Mexico and Ca
- Page 153 and 154: USA Atlantic, Gulf of Mexico and Ca
- Page 155 and 156:
USA Atlantic, Gulf of Mexico and Ca
- Page 157 and 158:
USA Atlantic, Gulf of Mexico and Ca
- Page 159 and 160:
USA Atlantic, Gulf of Mexico and Ca
- Page 161 and 162:
USA Atlantic, Gulf of Mexico and Ca