2008 - K+S Aktiengesellschaft
2008 - K+S Aktiengesellschaft
2008 - K+S Aktiengesellschaft

Create successful ePaper yourself
Turn your PDF publications into a flip-book with our unique Google optimized e-Paper software.
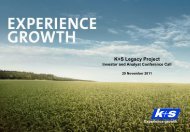
Experience growth.<br />
Chemical and Ag Science Conference<br />
Credit Suisse<br />
New York, 17 September <strong>2008</strong><br />
Experience growth.
<strong>K+S</strong> Group<br />
Growth Lies at the Heart of Our Vision<br />
<strong>K+S</strong> is one of the world's leading suppliers of speciality and standard fertilizers,<br />
plant care as well as salt products.<br />
With our products and brands, we offer our customers a range of needs-based<br />
goods and services which provides growth opportunities in virtually every<br />
sphere of daily life.<br />
In doing so, we assume active responsibility for the sustained growth of our world.<br />
Our 12,000 employees display their commitment towards this goal day in day out<br />
by applying their knowledge and experience.<br />
<strong>K+S</strong><br />
Experience growth.<br />
September <strong>2008</strong> <strong>K+S</strong> Group 1
<strong>K+S</strong> Group<br />
Content<br />
A. Corporate Structure<br />
B. Core Business Segments:<br />
- Fertilizers and Plant Care<br />
-Salt<br />
C. Complementary Business Segments<br />
D. Strategy<br />
E. Financial Data and Outlook<br />
F. <strong>K+S</strong> Share<br />
Appendix<br />
September <strong>2008</strong> <strong>K+S</strong> Group 2
<strong>K+S</strong> Group<br />
Corporate Structure as of 1 January <strong>2008</strong><br />
<strong>K+S</strong> Group<br />
Revenues<br />
EBIT I<br />
Potash and Magnesium Products<br />
1,408.0<br />
177.9<br />
Core business<br />
fertilizers and<br />
plant care<br />
COMPO<br />
617.4<br />
32.0<br />
fertiva<br />
648.0<br />
25.3<br />
Core business<br />
salt<br />
Salt<br />
545.1<br />
47.8<br />
Complementary<br />
business<br />
segments<br />
KTG<br />
Waste Management and Recycling<br />
Logistics (KTG)<br />
Animal hygiene products<br />
Trading business (CFK)<br />
125.1<br />
37.7<br />
Revenues and EBIT I refer to fiscal year 2007; figures in € million<br />
September <strong>2008</strong> <strong>K+S</strong> Group 3
<strong>K+S</strong> Group<br />
Worldwide Presence<br />
Overseas<br />
Europe<br />
Kassel<br />
Revenues by region (2007)<br />
Germany 19.6%<br />
Rest of Europe 47.1%<br />
Overseas 33.3%<br />
Production<br />
Sales<br />
September <strong>2008</strong> <strong>K+S</strong> Group 4
<strong>K+S</strong> Group<br />
Content<br />
A. Corporate Structure<br />
B. Core Business Segments:<br />
- Fertilizers and Plant Care<br />
-Salt<br />
C. Complementary Business Segments<br />
D. Strategy<br />
E. Financial Data and Outlook<br />
F. <strong>K+S</strong> Share<br />
Appendix<br />
September <strong>2008</strong> <strong>K+S</strong> Group 5
<strong>K+S</strong> Group<br />
Why Fertilize ?<br />
• There are only few soils on earth<br />
which have a sufficient content and<br />
availability of nutrients to achieve<br />
high yields over a longer period<br />
without fertilization<br />
• Indispensable supplement to the natural<br />
nutrient content of soils<br />
• Compensation of the nutrient losses<br />
by harvest and other losses<br />
September <strong>2008</strong> <strong>K+S</strong> Group 6
<strong>K+S</strong> Group<br />
Key Drivers of the Fertilizer Business<br />
• Despite decreasing availability of arable farm land, global production of soft<br />
commodities has to increase:<br />
• steadily increasing world population<br />
• changing diets toward higher meat consumption (e.g. 1 kg beef = 8 kg animal feed)<br />
• increasing importance of renewable raw materials for the production of bio energy<br />
• As a consequence, fertilizing with key nutrients nitrogen (N), phosphate (P)<br />
and potash (K), but also increasingly magnesium (Mg) and sulphur (S)<br />
is the solution to cope with this challenge<br />
• Nutrients cannot be substituted and a balanced fertilization of all nutrients is<br />
necessary to achieve optimal yields. Emerging countries, in particular, should still<br />
significantly increase the potash proportion of their total fertilizer application<br />
• Medium- and long-term increase in global fertilizer consumption (N, P and K)<br />
of about 3.0% p.a. expected<br />
Advantage:<br />
<strong>K+S</strong> offers its worldwide customers all nutrients<br />
in a market-oriented specialised product range<br />
September <strong>2008</strong> <strong>K+S</strong> Group 7
<strong>K+S</strong> Group<br />
Yields of Cereals in Selected Regions<br />
dt/ha<br />
70<br />
60<br />
50<br />
40<br />
30<br />
20<br />
10<br />
0<br />
North America Latin America Western Europe Eastern Europe South Asia Far East Africa<br />
Source: FAO<br />
1980 1985 1990 1995 2000 2004<br />
• Highest yields of cereals per hectare to be found in Western Europe and in North America<br />
thanks to a balanced fertilization tradition and advanced agricultural systems as well as<br />
favourable climatic conditions<br />
• Assuming an increased awareness of balanced fertilization, emerging markets possess<br />
significant catching-up potential<br />
• In 2004, the increase in yields of cereals per hectare in Eastern Europe is to be considered<br />
as not sustainable and was primarily caused by favourable climatic conditions. The region is<br />
still suffering from the consequences arising out of a persistent fertilization deficit.<br />
September <strong>2008</strong> <strong>K+S</strong> Group 8
300<br />
<strong>K+S</strong> Group<br />
Meat Consumption per Capita<br />
250<br />
200<br />
kg / person<br />
150<br />
North America<br />
100<br />
Europe*<br />
South America<br />
50<br />
0<br />
Asia<br />
Africa<br />
1961 1970 1980 1990 2002<br />
* comparable data for Europe is not available before 1992<br />
Source: Food and Agriculture Organization of the United Nations (FAO)<br />
• Rising prosperity goes along with rising meat consumption<br />
• Production of 1 kilogram of meat requires multiple kilograms of animal feed<br />
• Still enormous potential for rising fertilizer demand in emerging countries<br />
September <strong>2008</strong> <strong>K+S</strong> Group 9
<strong>K+S</strong> Group<br />
Bio Diesel Production - Objectives of the ‘EU 25’<br />
22.000<br />
20.000 According to the EU guideline from 08.05.2003 for the promotion of the use of<br />
bio fuels, the member states have to guarantee a minimum share of bio fuels.<br />
18.000<br />
16.000 1.000 t/year<br />
14.000 14,000<br />
13,450<br />
12.000 12,000<br />
11,500<br />
10.000 10,000<br />
8.000 8,000<br />
6.000 6,000<br />
4.000 4,000<br />
4,250<br />
5,950<br />
7,750<br />
9,550<br />
2.000 2,000<br />
0<br />
2.00 % 2.75 % 3.50 % 4.25 % 5.00 % 5.75 %<br />
2005 2006 2007 <strong>2008</strong> 2009 2010<br />
Source: Verband Dt. Biodieselhersteller e.V.<br />
September <strong>2008</strong> <strong>K+S</strong> Group 10
<strong>K+S</strong> Group<br />
Fertilizer Business - Gene Technology<br />
• Objectives of gene technology:<br />
• improved crop resistance against broad-band herbicides as well as pests and diseases<br />
• breeding of plants with elevated use value for the customer<br />
• Cultivation of genetically modified crops (GMO) mainly in the USA, Argentina, Canada,<br />
Brazil, China and South Africa<br />
• In Europe, the use is ethically disputed and does virtually not exist<br />
• Genetically modified crops are usually soybean, maize, cotton and oilseed rape<br />
• The use of GMOs reduces the economical input and increases the yield per unit<br />
of cultivated area<br />
• Due to the genetic modification, the plant’s needs become similar to those of ‘top athletes’.<br />
The increased removal of mineral nutrients from the soil has to be supplemented<br />
in form of fertilizers<br />
As long as the demand for food of the increasing world population is larger than<br />
the current supply, the use of GMOs leads to an increased demand for fertilizers<br />
September <strong>2008</strong> <strong>K+S</strong> Group 11
<strong>K+S</strong> Group<br />
Agricultural Supply Falls Short of Demand<br />
Production, consumption, stocks of cereals<br />
Production, consumption, stocks of corn<br />
100<br />
50<br />
100<br />
50<br />
80<br />
40<br />
80<br />
40<br />
60<br />
30<br />
60<br />
30<br />
40<br />
20<br />
40<br />
20<br />
million t<br />
20<br />
0<br />
-20<br />
10<br />
0<br />
-10<br />
%<br />
million t<br />
20<br />
0<br />
-20<br />
10<br />
0<br />
-10<br />
%<br />
-40<br />
-20<br />
-40<br />
-20<br />
-60<br />
-30<br />
-60<br />
-30<br />
-80<br />
-40<br />
-80<br />
-40<br />
-100<br />
1980/81<br />
1985/86<br />
1990/91<br />
1995/96<br />
2000/01<br />
2005/06<br />
-50<br />
-100<br />
1980/81<br />
1985/86<br />
1990/91<br />
1995/96<br />
2000/01<br />
2005/06<br />
-50<br />
Source: USDA<br />
Production surplus Production deficit Stocks-to-use ratio (rhs)<br />
Production surplus Production deficit Stocks-to-use ratio (rhs)<br />
• Over the past thirty years, annual global production of cereals and corn has often fallen<br />
short of demand<br />
• Despite reasonable harvest levels during the last ten years, these structural supply and<br />
demand gaps have resulted in historically low stocks-to-use ratios<br />
• Although “ideal” weather in <strong>2008</strong> (USDA-Report, 12 August <strong>2008</strong>) will most likely help<br />
farmers to achieve above-average yields, stocks-to-use ratios remain at historical lows<br />
September <strong>2008</strong> <strong>K+S</strong> Group 12
<strong>K+S</strong> Group<br />
Higher Prices of Agricultural Products<br />
Index: January 2005 = 100<br />
325<br />
Corn<br />
• Agricultural output cannot<br />
keep up with demand<br />
300<br />
275<br />
250<br />
225<br />
200<br />
175<br />
Palm oil<br />
Wheat<br />
Soybeans<br />
+144%<br />
+120%<br />
+114%<br />
+113%<br />
• Low worldwide inventories<br />
of agricultural products<br />
• Additional and increasing<br />
demand of renewable raw<br />
materials<br />
150<br />
125<br />
100<br />
Cultivation intensity and<br />
fertilizer use increase<br />
75<br />
Jan.<br />
2005<br />
Jan.<br />
2006<br />
Jan.<br />
2007<br />
Jan.<br />
<strong>2008</strong><br />
Source: World Bank; as of August <strong>2008</strong><br />
September <strong>2008</strong> <strong>K+S</strong> Group 13
<strong>K+S</strong> Group<br />
Profit Dynamics of Winter Wheat (180 €/t)<br />
€/ha Current<br />
1600Revenues<br />
€1,440<br />
Expenses €1,210<br />
1400Profit<br />
€ 230<br />
1200<br />
1000<br />
800<br />
600<br />
400<br />
200<br />
0<br />
459<br />
459<br />
Scenarios<br />
€1,440<br />
€ 1,257 (+4%)<br />
€ 183 (-20%)<br />
183<br />
183<br />
183<br />
Total<br />
Total<br />
367 30.3% 413 32.9%<br />
321<br />
of which<br />
of which<br />
21 4.1% 22<br />
7.6%<br />
20<br />
110<br />
MOP<br />
110 MOP 110<br />
70 70 70<br />
€ 1,260<br />
€ 1,163 (-4%)<br />
€ 97 (-57%)<br />
September <strong>2008</strong> <strong>K+S</strong> Group 14<br />
459<br />
600 € MOP, 8t/ha 1,200 € MOP, 8t/ha 600 € MOP, 7t/ha<br />
Seeds/plants<br />
Fertilization<br />
Plant protection agents Variable costs of carrying out the work<br />
Other costs<br />
Fixed costs (incl. lease)<br />
(e.g. insurance, water)<br />
Total<br />
27.6%<br />
of which<br />
3.8%<br />
MOP<br />
Potash share in total cost<br />
structure of a farmer<br />
currently only about 4%<br />
A fictitious doubling of the<br />
potash price only affects the<br />
profit to a less than full extent<br />
A yield reduction of a good<br />
10% however, results in a<br />
halving of the profit level<br />
The challenge for<br />
agriculture: ensuring a<br />
high level of revenues by<br />
means of a balanced use<br />
of nutrients<br />
Conservative assumptions: without agricultural subsidies, incl. interest expense for prefinancing costs, 100% use of mineral fertilizers (no organic manuring),<br />
straw remains in the field (straw manuring), fertilizer usage for 8 t/ha yield: 80 kg/ha MOP, 536 kg/ha CAN, 139 kg/ha TSP; Sources: costs (20 ha plot) according<br />
to Kuratorium für Technik und Bauwesen in der Landwirtschaft e. V. (KTBL), LAND & Forst, fertilizer prices: end-consumer prices, yield according to agricultural<br />
statistics of Destatis, nutrient removal according to federal states‘ guidelines on application of fertilizers
<strong>K+S</strong> Group<br />
Effect of Potash Fertilization on Yield<br />
t/ha<br />
12<br />
10<br />
8<br />
6<br />
4<br />
2<br />
0<br />
Winter wheat – Series of experiments<br />
(Germany)<br />
Additional yield<br />
t/ha<br />
1,5<br />
1978 1981 1984 1987 1990 1993 1996 1999<br />
K 2 O = 0 Kg K 2 O = 100 Kg Linear (addit. yield, rhs.)<br />
1,0<br />
0,5<br />
0,0<br />
Functional and sustainable<br />
potassium fertilization results in:<br />
• Mitigation of the effects of<br />
negative factors<br />
(e.g. temperature, precipitation)<br />
on yield<br />
• Increasing additional yields<br />
in the course of time<br />
• A potash-cost/proceeds<br />
ratio of 1:3<br />
(taking into account the<br />
current price level)<br />
Technical progress, plant<br />
protection and progress in cultivation<br />
enhance the potential of the plant<br />
over time. The exploitation of this<br />
potential depends on a balanced<br />
supply of nutrients!<br />
Series of experiments in Niestetal, Germany, Kassel, average annual precipitation: 647 mm, average annual temperature: 8.7°C:<br />
The geological starting material is a soil texture of silty loam. In agricultural practice, this soil has the reputation of supplying all nutrients particularly well, so that<br />
even reduced potassium fertilization need not necessarily result in corresponding declines in yield. The soil has a high supply class (E) prior to the start of the<br />
experiment. In contrast to nitrogen, the effect of potassium fertilization can only be assessed accurately in the long term. Only long-term field trials also identify the<br />
reciprocal effects (e.g. weather conditions) of all location factors.<br />
September <strong>2008</strong> <strong>K+S</strong> Group 15
<strong>K+S</strong> Group<br />
Market Impact on Fertilizer Suppliers<br />
+++ very strong<br />
++ strong<br />
+ low<br />
o very low/non existent<br />
Nitrogen<br />
(N)<br />
Relative market impact<br />
per class of nutrient<br />
Phosphate<br />
(P)<br />
Potash<br />
(K)<br />
<strong>K+S</strong> +<br />
o<br />
+++<br />
Agrium +++<br />
+/o<br />
+<br />
Mosaic +<br />
+++<br />
++<br />
PCS ++<br />
++<br />
++<br />
Uralkali o<br />
o<br />
+++<br />
Yara<br />
+++<br />
+<br />
o<br />
Explanatory note:<br />
The weighting indicates how the companies mentioned are affected by market impacts in each nutrient class.<br />
The matrix does not show the relative importance among the companies.<br />
September <strong>2008</strong> <strong>K+S</strong> Group 16
Potash and Magnesium Products<br />
World Potash Production and Sales by Region<br />
Million tonnes<br />
20.6<br />
18.9<br />
24.7<br />
10.8<br />
4.7<br />
8.2 7.4<br />
8.6<br />
10.4<br />
1.5<br />
0.7<br />
Incl. sulphate of potash<br />
and low grade potash<br />
Sources: IFA, <strong>K+S</strong><br />
World potash production:<br />
2007: 57.8 million t<br />
2006: 50.9 million t<br />
World potash sales:<br />
2007: 58.7 million t<br />
2006: 50.7 million t<br />
September <strong>2008</strong> <strong>K+S</strong> Group 17
Potash and Magnesium Products<br />
Supplier Structure on the World Potash Market<br />
33.2%<br />
22.8%<br />
11.8%<br />
9.3%<br />
9.2%<br />
9.0%<br />
3.2%<br />
1.5%<br />
•PCS<br />
•Mosaic<br />
•Agrium<br />
Canpotex<br />
Year 2007<br />
Sources: IFA, <strong>K+S</strong><br />
•Belaruskali<br />
•Uralkali<br />
BPC<br />
(since 2006)<br />
<strong>K+S</strong><br />
•Silvinit<br />
IPC<br />
ICL-<br />
Group<br />
•DSW<br />
•Iberpotash<br />
•CPL<br />
participation<br />
of PCS in ICL<br />
APC<br />
participation<br />
of PCS<br />
SQM<br />
participation<br />
of PCS<br />
Others<br />
China,<br />
Intrepid,<br />
Vale,<br />
Compass<br />
September <strong>2008</strong> <strong>K+S</strong> Group 18
Potash and Magnesium Products<br />
World Potash Capacity, Production and Sales<br />
Million tonnes<br />
80<br />
70<br />
60<br />
50<br />
52.6<br />
Technically available capacity<br />
(incl. announced capacity expansions)<br />
Production<br />
Sales<br />
49.1<br />
45.5<br />
43.9<br />
54.2 54.4<br />
50.7<br />
61.0<br />
58.7<br />
Ø + 5%<br />
Ø + 3%<br />
77.9<br />
70.7<br />
• The shortfall of Eastern European<br />
demand after the collapse of the<br />
Soviet Union was more than<br />
compensated for by the growth<br />
in emerging markets<br />
• Growing world population,<br />
increasing demand for higher-quality<br />
food especially in emerging markets<br />
and increasing use of bio energy<br />
40<br />
30<br />
36.2<br />
• Tactical purchasing behaviour,<br />
particularly with regard to countries<br />
with state-driven potash importing<br />
organizations, affected the year 2006<br />
20<br />
10<br />
0<br />
55.0 35.2 45.1 46.0 48.5 54.0 56.6 50.9 57.8 61.0<br />
1988 ’93 ’01 ’02 ’03 ’04 ’05 ’06 ’07 ’08<br />
2013<br />
(e)<br />
(e)<br />
Incl. sulphate of potash and low grade potash<br />
Sources: IFA, <strong>K+S</strong><br />
• Medium-term demand growth of<br />
approx. 3% - 5% per year expected<br />
• All announced capacity expansions<br />
considered until 2013<br />
High utilization of technically<br />
available capacity also expected<br />
for the next years<br />
September <strong>2008</strong> <strong>K+S</strong> Group 19
Potash and Magnesium Products<br />
Agricultural Potash Consumption by Region<br />
,<br />
40.000<br />
,<br />
32.000<br />
1,000 t K 2<br />
O<br />
World<br />
,<br />
20.000<br />
,<br />
16.000<br />
1,000 t K 2<br />
O<br />
Developed markets<br />
North America, Western Europe, Australia, Japan<br />
,<br />
24.000<br />
,<br />
12.000<br />
,<br />
16.000<br />
,<br />
8.000<br />
,<br />
8.000<br />
,<br />
4.000<br />
,<br />
20.000<br />
,<br />
16.000<br />
0<br />
80/81 82/ 84/ 86/ 88/ 90/ 92/ 94/ 96/ 98/ 00/ 02/ 04/ 06/07<br />
e<br />
1,000 t K 2<br />
O<br />
Transitional markets<br />
Central and Eastern Europe, Central Asia<br />
,<br />
20.000<br />
,<br />
16.000<br />
0<br />
80/81 82/ 84/ 86/ 88/ 90/ 92/ 94/ 96/ 98/ 00/ 02/ 04/ 06/07<br />
e<br />
1,000 t K 2<br />
O<br />
Emerging markets<br />
Latin America, Asia, Africa, Oceania<br />
,<br />
12.000<br />
,<br />
12.000<br />
,<br />
8.000<br />
,<br />
8.000<br />
,<br />
4.000<br />
,<br />
4.000<br />
0<br />
80/81 82/ 84/ 86/ 88/ 90/ 92/ 94/ 96/ 98/ 00/ 02/ 04/ 06/07<br />
e<br />
Sources: IFA, FAO<br />
0<br />
80/81 82/ 84/ 86/ 88/ 90/ 92/ 94/ 96/ 98/ 00/ 02/ 04/ 06/07<br />
e<br />
September <strong>2008</strong> <strong>K+S</strong> Group 20
Potash and Magnesium Products<br />
MOP Prices for Selected Markets<br />
US$/t<br />
Overseas<br />
(standard, cfr)<br />
US$/t<br />
Northwest-Europe<br />
(standard, fob)<br />
1000<br />
925<br />
850<br />
775<br />
700<br />
625<br />
550<br />
475<br />
400<br />
325<br />
250<br />
175<br />
100<br />
Thailand/Taiwan<br />
Brazil<br />
Q1 Q3 Q1 Q3 Q1 Q3 Q1 Q3 Q1 Q3 Q1 Q3<br />
956<br />
950<br />
September <strong>2008</strong> <strong>K+S</strong> Group 21<br />
920<br />
850<br />
780<br />
710<br />
640<br />
570<br />
500<br />
430<br />
360<br />
290<br />
220<br />
150<br />
80<br />
Q1 Q3 Q1 Q3 Q1 Q3 Q1 Q3 Q1 Q3 Q1 Q3<br />
2003 ‘04 ‘05 ‘06 ‘07 <strong>2008</strong> 2003 ‘04 ‘05 ‘06 ‘07 <strong>2008</strong><br />
Source: FMB; as of 4 September <strong>2008</strong><br />
832
Potash and Magnesium Products<br />
Recent Price Increases/Announcements<br />
Price quotations per tonne MOP<br />
Western Europe<br />
granular MOP<br />
standard MOP<br />
Brazil<br />
granular MOP<br />
South-East Asia<br />
standard MOP<br />
India<br />
standard MOP<br />
• Beginning of July ’08: price increase of € 25to € 560 cfr;<br />
End of July ’08: latest price increase of further €40to € 600 cfr<br />
with immediate effect<br />
• End of June ’08: price increase of about € 260 to approx. € 540 cfr<br />
for Q3/<strong>2008</strong> (3 months contract to expire at the end of Sept. <strong>2008</strong>)<br />
• Beginning of Apr. ’08: announcement of a price increase of US$ 150<br />
to US$ 750 cfr from 1 June ’08 (Canpotex);<br />
End of Apr. ’08: announcement of a further price increase of US$ 250<br />
to US$ 1,000 cfr from 1 July ’08 (BPC)<br />
• Beginning of Apr. ’08: announcement of a price increase of US$ 125<br />
to US$ 725 cfr from 1 June ’08 (Canpotex);<br />
End of Apr. ’08: announcement of a further price increase of US$ 275<br />
to US$ 1,000 cfr from 1 July ’08 (BPC)<br />
• Mid of March ’08: price increase of US$ 355 to US$ 625 cfr as of May ’08;<br />
valid until March 2009<br />
Source: FMB<br />
September <strong>2008</strong> <strong>K+S</strong> Group 22
Potash and Magnesium Products<br />
Loader (up to 20 tonnes)<br />
September <strong>2008</strong> <strong>K+S</strong> Group 23
<strong>K+S</strong> Group<br />
Potash and Magnesium Products<br />
1 st Half<br />
Financial Year<br />
Revenues by product group<br />
€ million<br />
<strong>2008</strong><br />
2007<br />
2007<br />
2006<br />
2007 (%)<br />
Revenues<br />
1,135.3<br />
708.2<br />
1,408.0<br />
1,238.9<br />
EBIT I<br />
462.3<br />
108.7<br />
177.9<br />
158.6<br />
Brief description<br />
Crude potash and magnesium salts are<br />
extracted from six mines in Germany and form<br />
the basis for the production of a large number<br />
of fertilizers. In addition, these crude salts are<br />
also processed into products for technical,<br />
industrial and pharmaceutical applications.<br />
Special feature: Our deposits also contain<br />
magnesium and sulphur, which are particularly<br />
suitable for the production of specialities.<br />
Potassium chloride 47.9<br />
Fertilizer specialities 38.5<br />
Industrial products 13.6<br />
September <strong>2008</strong> <strong>K+S</strong> Group 24
Potash and Magnesium Products<br />
Product Portfolio 2007 (Sales volumes in million tonnes)<br />
1.4 million tonnes non-potashcontaining<br />
products<br />
• Fertilizer specialities<br />
- ESTA ® Kieserite<br />
- EPSO ® product family<br />
• Industrial products<br />
- magnesium sulphate<br />
- magnesium chloride<br />
Fertilizer<br />
specialities<br />
3.42<br />
Industrial<br />
products<br />
1.04<br />
Potassium<br />
chloride<br />
3.75<br />
6.8 million tonnes potashcontaining<br />
products<br />
• Potassium chloride<br />
- MOP - Standard<br />
-MOP -Granulat<br />
• Fertilizer specialities<br />
- Potassium sulphate<br />
- Patentkali ®<br />
- Korn-Kali ® -products<br />
- Magnesia-Kainit ®<br />
- Thomaskali ®<br />
-NPK<br />
• Industrial products<br />
- potassium chloride, 97% - 99% KCl<br />
- potassium sulphate, > 95% K 2<br />
SO 4<br />
- high purity salts<br />
Theoretical size for the determination of the price sensitivity of the <strong>K+S</strong> product<br />
portfolio relating to a price increase of potassium chloride (MOP)<br />
6.8 million tonnes x (0.53*/0.6) ≙ 6.0 million tonnes (MOP-equivalent)<br />
* Average K 2 O content of the product mix amounts to 53%<br />
September <strong>2008</strong> <strong>K+S</strong> Group 25
Potash and Magnesium Products<br />
USD Currency Management<br />
• USD revenues are hedged after the deduction of overseas freight costs and a safety margin<br />
• US dollar hedging in 2003 to 2007 (inclusive) via double-barrier options: no classic hedging<br />
mechanism, was only effective within certain barriers; barriers were restructured in case of<br />
an imminent knock-out<br />
• At the end of 2007, US dollar hedging was converted into a pure risk limitation system,<br />
because in view of the significant US dollar depreciation the former system has<br />
reached its limits given opportunity-risk considerations<br />
As of <strong>2008</strong>: use of options, which<br />
prescribe a worst-case scenario,<br />
but provide the opportunity to<br />
share in any possible appreciation<br />
of the US dollar<br />
„worst case“ for the fiscal year <strong>2008</strong>:<br />
USD 932 million at USD/EUR 1.51 incl. costs<br />
„worst case“ for the fiscal year 2009:<br />
USD 1,320 million at USD/EUR 1.53 incl. costs<br />
September <strong>2008</strong> <strong>K+S</strong> Group 26
<strong>K+S</strong> Group<br />
COMPO<br />
1 st Half<br />
Financial Year<br />
Revenues by segment<br />
€ million<br />
<strong>2008</strong><br />
2007<br />
2007<br />
2006<br />
2007 (%)<br />
Revenues<br />
480.9<br />
374.0<br />
617.4<br />
552.4<br />
EBIT I<br />
65.0<br />
28.2<br />
32.0<br />
29.2<br />
Brief description<br />
Consumer business: high-quality branded products<br />
such as potting soil, plant care products, lawn and<br />
garden fertilizers. Recent strategic alliance with<br />
the global plant protection player Syngenta to<br />
become effective from 2007 onwards.<br />
Professional business: special complex fertilizers<br />
and stabilised ENTEC ® fertilizers for horticulture<br />
and agricultural special crops, slow release<br />
fertilizers for lawns, sports fields and public<br />
green areas.<br />
Consumer business 33.5<br />
Professional/<br />
Industrial business 66.5<br />
September <strong>2008</strong> <strong>K+S</strong> Group 27
<strong>K+S</strong> Group<br />
fertiva<br />
1 st Half<br />
Financial Year<br />
Revenues by product group<br />
€ million<br />
<strong>2008</strong><br />
2007<br />
2007<br />
2006<br />
2007 (%)<br />
Revenues<br />
441.3<br />
304.5<br />
648.0<br />
556.2<br />
EBIT I<br />
21.6<br />
9.9<br />
25.3<br />
16.7<br />
Brief description<br />
fertiva represents the <strong>K+S</strong> Group’s nitrogen<br />
fertiizer activities and markets the agricultural<br />
fertilizers produced exclusively by BASF. Furthermore<br />
fertiva sells limited volumes purchased<br />
from other leading European producers, too.<br />
Fixed range for fertivas trading business contribution<br />
to earnings: 50% split between <strong>K+S</strong> and BASF<br />
within a corridor of € +/- 10 million. Since 2004,<br />
above € + 10 million, at least 25% additional profit<br />
share for <strong>K+S</strong>.<br />
Complex fertilizers 32.1<br />
Straight nitrogen fertilizers/<br />
Ammonium sulphate nitrate 44.6<br />
Ammonium sulphate 23.3<br />
September <strong>2008</strong> <strong>K+S</strong> Group 28
<strong>K+S</strong> Group<br />
fertiva/COMPO<br />
Advantages of joint production<br />
• BASF produces fertilizers on an exclusive basis for fertiva and for COMPO;<br />
fertiva and COMPO control production volumes and product mix<br />
• Joint use of BASF technologically leading production facilities<br />
at competitive cost by fertiva and COMPO (economies of scale)<br />
• Joint production planning enables COMPO and fertiva to optimise production cost<br />
• Research agreement with BASF forms the basis for innovations at COMPO and fertiva<br />
• For the time being, the contract is valid until the end of 2014<br />
Sales volumes of fertiva in 2007<br />
Sales volumes of COMPO in 2007<br />
•<br />
•<br />
•<br />
Complex fertilizers: 1.03 million tonnes<br />
Straight nitrogen fertilizers:<br />
1.76 million tonnes<br />
Ammonium sulphate: 1.43 million tonnes<br />
• Professional/industrial business:<br />
0.99 million tonnes<br />
e.g. stabilized fertilizer, (coated) slow-release<br />
fertilizer, complex fertilizer specialities,<br />
nutrient salts<br />
September <strong>2008</strong> <strong>K+S</strong> Group 29
<strong>K+S</strong> Group<br />
Content<br />
A. Corporate Structure<br />
B. Core Business Segments:<br />
- Fertilizers and Plant Care<br />
-Salt<br />
C. Complementary Businesses<br />
D. Strategy<br />
E. Financial Data and Outlook<br />
F. <strong>K+S</strong> Share<br />
Appendix<br />
September <strong>2008</strong> <strong>K+S</strong> Group 30
<strong>K+S</strong> Group<br />
Salt<br />
1 st Half<br />
Financial Year<br />
Revenues by product group<br />
€ million<br />
<strong>2008</strong><br />
2007<br />
2007<br />
2006<br />
*<br />
2007 (%)<br />
Revenues<br />
278.3<br />
275.2<br />
545.1<br />
485.8<br />
EBIT I<br />
10.5<br />
26.7<br />
47.8<br />
67.6<br />
* since 1 July 2006 including SPL<br />
Brief description<br />
Salt products of highest purity and quality<br />
are used as table salt, industrial salt, salt<br />
for chemical transformation and salt for<br />
winter maintenance (de-icing). Main production<br />
sites are located in Germany as well as in<br />
some Western European countries.<br />
With the acquisition of the Chilean salt<br />
producer Sociedad Punta de Lobos in 2006,<br />
<strong>K+S</strong> owns additional production sites in Chile<br />
and Brazil.<br />
Table salt 17.0<br />
Industrial salt 28.7<br />
Salt for chemical<br />
transformation 9.8<br />
De-icing salt 33.7<br />
Other 10.8<br />
September <strong>2008</strong> <strong>K+S</strong> Group 31
Salt<br />
Mining Chamber in Germany<br />
September <strong>2008</strong> <strong>K+S</strong> Group 32
Salt<br />
SPL: Salt Extraction in the Atacama Desert<br />
September <strong>2008</strong> <strong>K+S</strong> Group 33
Salt<br />
SPL: The Optimal Strategic Complement for <strong>K+S</strong><br />
• SPL has developed into a strong player in the Americas<br />
• one of the most cost effective salt producers in the world<br />
• enjoys favourable logistical location to attractive overseas markets<br />
• high earnings capacity with growth opportunities<br />
• SPL opens up new growth opportunities in the worldwide salt business<br />
• growth potential in current SPL markets<br />
• focus: strengthening of weather-independent product segments<br />
(industrial salt and salt for chemical use)<br />
• growth strategy supported by the doubling of the port capacity and the<br />
medium-term, consistent expansion of the production capacity<br />
<strong>K+S</strong> as a global player in salt with a strong presence in Europe<br />
and the Americas; in the future potentials in Asia too<br />
September <strong>2008</strong> <strong>K+S</strong> Group 34
Salt<br />
Main Salt Suppliers Worldwide<br />
Capacity in million tonnes (crystallized salt and salt in brine; excl. captive use)<br />
18.7<br />
16.2<br />
6.5<br />
14.0<br />
13.7<br />
13.1<br />
9.7<br />
9.0<br />
7.5<br />
7.0<br />
5.3<br />
4.1<br />
3.8<br />
3.6<br />
China<br />
National<br />
Salt Ind.<br />
(China)<br />
(GER)<br />
Cargill<br />
(USA)<br />
Compass<br />
Minerals<br />
(USA)<br />
Morton<br />
Salt<br />
(USA)<br />
Dampier<br />
Salt<br />
(AUS)<br />
Artyomsol<br />
(Ukraine)<br />
Exportadora<br />
del Sal<br />
(MEX)<br />
Südsalz<br />
(GER)<br />
Salins<br />
Group<br />
(F)<br />
Mitsui<br />
& Co.<br />
(AUS)<br />
Akzo<br />
(NL)<br />
Year 2007<br />
Sources: Roskill 2007, <strong>K+S</strong><br />
September <strong>2008</strong> <strong>K+S</strong> Group 35
<strong>K+S</strong> Group<br />
Content<br />
A. Corporate Structure<br />
B. Core Business Segments:<br />
- Fertilizers and Plant Care<br />
-Salt<br />
C. Complementary Business Segments<br />
D. Strategy<br />
E. Financial Data and Outlook<br />
F. <strong>K+S</strong> Share<br />
Appendix<br />
September <strong>2008</strong> <strong>K+S</strong> Group 36
<strong>K+S</strong> Group<br />
Complementary Business Segments<br />
1 st Half<br />
Financial Year<br />
Revenues by segment<br />
€ million<br />
<strong>2008</strong><br />
2007<br />
2007<br />
2006<br />
2007 (%)<br />
Revenues<br />
61.3<br />
61.2<br />
125.1<br />
123.9<br />
EBIT I<br />
14.2<br />
18.0<br />
37.7<br />
37.1<br />
Brief description<br />
Waste Management and Recycling uses the caverns<br />
as well as the existing infrastructure in the active<br />
mines created by underground extraction of crude<br />
salts. The <strong>K+S</strong> Group is the leading provider for<br />
underground waste management in Europe ensuring<br />
safety over long periods of time. In addition, we offer<br />
tailor-made solutions for the recycling requirements<br />
of our customers.<br />
Logistics activities being essential for <strong>K+S</strong> are also<br />
bundled in this business segment. Another important<br />
activity is the granulation of CATSAN® (cat litter).<br />
Waste Management<br />
and Recycling 56.4<br />
Logistics 13.6<br />
Granulation 22.9<br />
Trading business 5.3<br />
Other 1.8<br />
September <strong>2008</strong> <strong>K+S</strong> Group 37
Waste Management and Recycling<br />
Raw Material Prices Favour Recycling Business<br />
Index: January 2003 = 100<br />
700<br />
600<br />
500<br />
400<br />
300<br />
200<br />
100<br />
Price of copper<br />
Price of aluminium<br />
• Recycling: high prices for<br />
aluminium granulate being obtained<br />
by the recycling of salt slag<br />
• Reutilisiation: stricter legal<br />
requirements for the treatment of<br />
household waste help to increase<br />
prices and volumes of underground<br />
reutilisation of flue gas ashes<br />
• Disposal: high prices for copper<br />
being obtained by retrieval of<br />
contaminated copper transformers<br />
0<br />
Jan.<br />
2003<br />
Jan.<br />
2004<br />
Jan.<br />
2005<br />
Jan.<br />
2006<br />
Jan.<br />
2007<br />
Jan.<br />
<strong>2008</strong><br />
Source: Bloomberg, London Metals Exchange<br />
September <strong>2008</strong> <strong>K+S</strong> Group 38
<strong>K+S</strong> Group<br />
Content<br />
A. Corporate Structure<br />
B. Core Business Segments:<br />
- Fertilizers and Plant Care<br />
-Salt<br />
C. Complementary Business Segments<br />
D. Strategy<br />
E. Financial Data and Outlook<br />
F. <strong>K+S</strong> Share<br />
Appendix<br />
September <strong>2008</strong> <strong>K+S</strong> Group 39
<strong>K+S</strong> Group<br />
<strong>K+S</strong> is the Leading Player in its Markets<br />
Fertilizers and Plant Care:<br />
Potash<br />
One of the leading suppliers worldwide<br />
• Leader in Europe<br />
• Fourth-largest producer worldwide<br />
Sulphate of potash<br />
and magnesium sulphate • Leading position in the World<br />
The green market<br />
Nitrogen<br />
Salt:<br />
esco<br />
SPL<br />
• Leader in Europe with COMPO<br />
• Very well positioned with fertiva<br />
One of the leading suppliers worldwide<br />
• No. 1 in Europe<br />
• One of the leading suppliers<br />
on the American continent<br />
September <strong>2008</strong> <strong>K+S</strong> Group 40
<strong>K+S</strong> Group<br />
Strategy<br />
• Consolidation and selective expansion of our leading market positions,<br />
particularly with regard to specialities<br />
• Further development of our core business sectors through acquisitions<br />
and cooperation arrangements<br />
• Ongoing focus on improving efficiency and cutting costs<br />
as well as exploiting synergies<br />
September <strong>2008</strong> <strong>K+S</strong> Group 41
<strong>K+S</strong> Group<br />
Content<br />
A. Corporate Structure<br />
B. Core Business Segments:<br />
- Fertilizers and Plant Care<br />
-Salt<br />
C. Complementary Business Segments<br />
D. Strategy<br />
E. Financial Data and Outlook<br />
F. <strong>K+S</strong> Share<br />
Appendix<br />
September <strong>2008</strong> <strong>K+S</strong> Group 42
<strong>K+S</strong> Group<br />
500<br />
Development of Revenues and Earnings<br />
5.000<br />
4.500<br />
450<br />
4.000 € million € 400 million<br />
CAGR 10.0% CAGR 25.3%<br />
CAGR 14.7%<br />
3.500 3,500<br />
3,344 350<br />
3.000 3,000<br />
300<br />
286<br />
2.500 2,500<br />
2,288<br />
250<br />
2.000 2,000<br />
200<br />
**<br />
175<br />
1.500 1,500<br />
1.000 1,000<br />
150<br />
100<br />
116<br />
101<br />
500<br />
50<br />
0<br />
‘03 ‘05<br />
’07<br />
0<br />
‘03 ‘05 ’07 ‘03 ‘05 ’07<br />
Revenues<br />
Operating<br />
earnings<br />
Group earnings,<br />
adjusted *<br />
2003: German GAAP; since 2004: IFRSs<br />
* 2003: net income; since 2004: adjusted for the effect of market value changes in hedging transactions;<br />
in the case of adjusted Group earnings, the resulting tax effects were also eliminated<br />
** excluding non-recurrent deferred tax income of € 41.9 million or € 0.25 per share<br />
September <strong>2008</strong> <strong>K+S</strong> Group 43
<strong>K+S</strong> Group<br />
Capital Expenditure, Acquisitions, Share Buyback<br />
€ million<br />
500<br />
400<br />
300<br />
2003-’08e<br />
Share buybacks: 110<br />
Acquisitions: 454<br />
Expansion capex: 272<br />
Maintenance capex: 597<br />
Total cash-outflow: 1,433<br />
358<br />
200<br />
100<br />
0<br />
93<br />
1<br />
43<br />
92<br />
2<br />
67<br />
27<br />
22<br />
77<br />
33<br />
21<br />
94 105 86<br />
109 95 108<br />
2003 2004 2005 2006 2007 <strong>2008</strong>e<br />
• 2003-<strong>2008</strong>e: depreciation > maintenance capex<br />
2003: German GAAP; since 2004: IFRSs<br />
September <strong>2008</strong> <strong>K+S</strong> Group 44
<strong>K+S</strong> Group<br />
Key Figures as of 30 June <strong>2008</strong><br />
€ million<br />
H1/<strong>2008</strong> H1/2007 %<br />
Revenues<br />
2,397.5<br />
1,723.3<br />
+ 39.1<br />
Operating earnings (EBIT I)<br />
552.7<br />
172.7<br />
+220.0<br />
Earnings before income taxes (EBT), adjusted *<br />
538.5<br />
156.6<br />
+ 243.9<br />
Group earnings after taxes, adjusted *<br />
393.7<br />
104.8<br />
+ 275.7<br />
Effective tax rate (%)<br />
26.9<br />
33.1<br />
Capital expenditure<br />
84.7<br />
50.8<br />
+ 66.7<br />
Free cash flow before acquisitions/divestments<br />
285.3<br />
65.0<br />
+338.9<br />
Net indebtedness **<br />
904.4<br />
741.6<br />
+ 22.0<br />
Earnings per share, adjusted (€) * , ***<br />
2.39<br />
0.64<br />
+ 273.4<br />
Average number of shares (million) ***<br />
164.89<br />
164.88<br />
-<br />
* adjusted for the effect of market value changes for exchange rate hedging transactions;<br />
in the case of adjusted Group earnings, the resulting tax effects were also eliminated<br />
** including pension provisions and provisions for mining obligations<br />
*** adjusted for share split in the ratio 1 to 4 (technical execution: 21 July <strong>2008</strong>)<br />
September <strong>2008</strong> <strong>K+S</strong> Group 45
<strong>K+S</strong> 2.900<br />
Group<br />
Changes in Revenues as of 30 June <strong>2008</strong><br />
2.700<br />
€ million<br />
2,500 2.500<br />
2,300 2.300<br />
+812.3 -68.3 +2.1<br />
2,397.5<br />
2,100 2.100<br />
1,900 1.900<br />
+674.2<br />
1,700 1.700<br />
1,723.3 -71.9<br />
1,500 1.500<br />
1,300 1.300<br />
Revenues<br />
H1<br />
2007<br />
Volume/<br />
structure<br />
Prices<br />
Exchange<br />
rates<br />
Consolidation<br />
Revenues<br />
H1<br />
<strong>2008</strong><br />
September <strong>2008</strong> <strong>K+S</strong> Group 46
<strong>K+S</strong> Group<br />
2,10<br />
Development of Earnings per Share, Adjusted *<br />
1,80<br />
€<br />
1,50 1.50<br />
1.40<br />
1,20 1.20<br />
0.99<br />
0,90 0.90<br />
0,60 0.60<br />
0,30 0.30<br />
0,00 0.00<br />
0.43<br />
0.46<br />
0.24<br />
0.19<br />
0.21<br />
**<br />
0.38<br />
0.26 0.29<br />
0.14<br />
Q1 - Q4 2006 Q1 - Q4 2007 Q1 - Q2 <strong>2008</strong><br />
EPS H1 * €0.67 €0.64 €2.39<br />
**<br />
EPS FY * €1.07 €1.06 -<br />
* adjusted for the effect of market value changes in hedging transactions; in the case of adjusted Group earnings,<br />
the resulting tax effects were also eliminated; from 21 July <strong>2008</strong> onwards: adjusted for share split in the ratio 1 to 4 (21 July <strong>2008</strong><br />
** excluding non-recurrent deferred tax income of € 41.9 million or € 0.25 per share<br />
September <strong>2008</strong> <strong>K+S</strong> Group 47
<strong>K+S</strong> Group<br />
Outlook for the Year <strong>2008</strong> (as of 6 August <strong>2008</strong>)<br />
• Revenues of the <strong>K+S</strong> Group expected to increase considerably due to higher revenues in<br />
the Potash and Magnesium Products, fertiva and COMPO business segments.<br />
Countervailing currency and volume effects will only have a disproportionate impact<br />
• Much higher operating earnings EBIT I expected for <strong>2008</strong> primarily due to the sharply<br />
increasing average prices in the Potash and Magnesium Products business segment, which<br />
are by far exceeding the rise in operating costs and dampening currency effects<br />
• With an essentially unchanged financial result and a corporate tax rate of about 27% to 29%<br />
(2007: 29.9%), adjusted Group earnings after taxes also expected to increase considerably<br />
• Outlook for the entire year for <strong>K+S</strong> Group:<br />
- Revenues: € 5.3 - 5.5 billion (2007: € 3.3 bn )<br />
- Operating earnings (EBIT I): € 1.4 - 1.6 billion (2007: € 285.7 m )<br />
- Group earnings, adjusted: € 1.0 - 1.1 billion (2007: € 175.3 m )<br />
- Earnings per share, adjusted *: € 6.00 - 6.65 (2007: € 1.06 )<br />
* adjusted to share split in the ratio 1 to 4 (entry in Commercial Register: 24 June <strong>2008</strong>; technical execution: 21 July <strong>2008</strong>)<br />
• The outlook for <strong>2008</strong> is based on the following premises:<br />
- an average US dollar exchange rate of 1.53 USD/EUR during the year as a whole<br />
- strong global demand for potash fertilizers, persistent scarcity and thus a high utilisation of<br />
potash capacities<br />
- oil and gas prices remaining at their current levels<br />
- an average de-icing salt business in Europe and North America in the fourth quarter<br />
September <strong>2008</strong> <strong>K+S</strong> Group 48
<strong>K+S</strong> Group<br />
<strong>2008</strong> Perspectives by Business Segment<br />
• Potash and Magnesium Products: The potash fertilizers prices currently achieved are clearly<br />
higher than the average prices of the past year. The resultant price effect on revenues should<br />
amount to at least 90% in <strong>2008</strong>. For <strong>2008</strong>, we expect a level of about 7.9 million tonnes of<br />
goods (2007: 8.22 million tonnes). Currency and volume effects will admittedly have a dampening<br />
effect, but the expected price effect should by far more than make up for these effects and<br />
for the increase in operating costs.<br />
• COMPO: Revenues should increase tangibly in <strong>2008</strong>, especially in the professional segment.<br />
Though the prices for raw materials rise steeply, operating earnings should significantly increase.<br />
• fertiva: Higher average prices for nitrogenous fertilizers should result in a strong increase in<br />
revenues of fertiva’s trading business. Despite significantly higher than expected raw material<br />
costs, operating earnings should also clearly rise in comparison with last year.<br />
• Salt: Despite a slow start for de-icing salt due to weather conditions, we anticipate a moderate<br />
increase in revenues during the year as a whole. The cost side will be impacted this year by<br />
higher energy and freight costs as well as a lower currency result. Operating earnings should<br />
therefore be significantly lower.<br />
• Complementary business segments: Course of business expected to remain stable; with<br />
regard to operating earnings, we anticipate a noticeable decrease compared with the previous<br />
year resulting from a lower level of overseas deliveries that can be expected. Previous year’s<br />
figures benefited from the proceeds of the sale of biodata Analytik GmbH.<br />
September <strong>2008</strong> <strong>K+S</strong> Group 49
<strong>K+S</strong> Group<br />
Content<br />
A. Corporate Structure<br />
B. Core Business Segments:<br />
- Fertilizers and Plant Care<br />
-Salt<br />
C. Complementary Business Segments<br />
D. Strategy<br />
E. Financial Data and Outlook<br />
F. <strong>K+S</strong> Share<br />
Appendix<br />
September <strong>2008</strong> <strong>K+S</strong> Group 50
<strong>K+S</strong> <strong>Aktiengesellschaft</strong><br />
Key Data of the <strong>K+S</strong> Share<br />
****<br />
<strong>2008</strong><br />
2007<br />
2006<br />
2005<br />
2004<br />
2003<br />
Earnings per share, adjusted (€) * , **<br />
1.06<br />
***<br />
1.07<br />
0.95<br />
0.61<br />
0.61<br />
Dividend per share (€) **<br />
0.50<br />
0.50<br />
0.45<br />
0.33<br />
0.25<br />
Book value per share, adjusted (€) * , **<br />
6.71<br />
6.81<br />
6.43<br />
5.65<br />
5.19<br />
3.44<br />
Year-end closing price (XETRA, €) **<br />
40.69<br />
20.55<br />
12.76<br />
9.78<br />
5.44<br />
Total stock exchange turnover (€bn)<br />
15.6<br />
10.2<br />
4.3<br />
1.9<br />
1.0<br />
0.4<br />
Average daily turnover (€m)<br />
124.2<br />
40.6<br />
16.9<br />
7.4<br />
3.9<br />
1.6<br />
Average number of shares (m) **<br />
164.89<br />
164.96<br />
164.96<br />
169.24<br />
170.00<br />
167.08<br />
Dividend yield (closing price, %)<br />
Return on equity after taxes (%) *<br />
1.2<br />
16.1<br />
2.4<br />
***<br />
17.7<br />
3.5<br />
17.8<br />
3.3<br />
12.1<br />
4.6<br />
17.7<br />
* 2003: German GAAP; since 2004: IFRSs, adjusted for the effect of market value changes in hedging transactions;<br />
in the case of adjusted Group earnings, the resulting tax effects were also eliminated<br />
** adjusted for share split in the ratio 1 to 4 (technical execution: 21 July <strong>2008</strong>)<br />
*** excluding non-recurrent deferred tax income of 0.25 € per share<br />
**** as of 30 June<br />
September <strong>2008</strong> <strong>K+S</strong> Group 51
<strong>K+S</strong> <strong>Aktiengesellschaft</strong><br />
Dividends and Share Buybacks (10 Years)<br />
150<br />
€ million<br />
120<br />
90<br />
60<br />
Dividend per share (rhs) *<br />
(for the prior financial year)<br />
Share buybacks (lhs)<br />
Total dividend payment (lhs)<br />
(for the prior financial year)<br />
69.36<br />
0.21<br />
0.25<br />
43.38<br />
0.25<br />
0.25<br />
66.70<br />
0.33<br />
55.25<br />
0.45<br />
74.25<br />
0.50<br />
82.50<br />
0,75<br />
€ per share<br />
0.60 0,60<br />
0.50<br />
0.45 0,45<br />
82.50<br />
0.30 0,30<br />
30<br />
0.09<br />
17.90<br />
0.14<br />
25.65<br />
37.61<br />
43.40<br />
41.47<br />
42.50<br />
0.15 0,15<br />
0<br />
1999 2000 2001 2002 2003 2004 2005 2006 2007 <strong>2008</strong><br />
0.00 0,00<br />
* adjusted for share split in the ratio 1 to 4 (technical execution: 21 July <strong>2008</strong>)<br />
September <strong>2008</strong> <strong>K+S</strong> Group 52
<strong>K+S</strong> <strong>Aktiengesellschaft</strong><br />
<strong>K+S</strong> Share Price Compared with DAX and MDAX<br />
Performance of <strong>K+S</strong> share<br />
(Index: 31 December 2007 = 100)<br />
Market capitalisation<br />
(€ million)<br />
240<br />
220<br />
200<br />
180<br />
160<br />
<strong>K+S</strong><br />
+67%<br />
+4,515<br />
11,228<br />
140<br />
120<br />
+3,322<br />
6,713<br />
100<br />
80<br />
60<br />
Jan.<br />
<strong>2008</strong><br />
Source: Bloomberg; as of 12 September <strong>2008</strong><br />
Sept.<br />
MDAX -18%<br />
DAX -23%<br />
3,391<br />
2006<br />
31 Dec.<br />
2007<br />
31 Dec.<br />
<strong>2008</strong><br />
12 Sept.<br />
September <strong>2008</strong> <strong>K+S</strong> Group 53
<strong>K+S</strong> <strong>Aktiengesellschaft</strong><br />
<strong>K+S</strong> Share Price Compared with Peer Group<br />
Index: 31 December 2007 = 100<br />
250<br />
225<br />
200<br />
175<br />
150<br />
<strong>K+S</strong><br />
+67%<br />
125<br />
100<br />
75<br />
Jan.<br />
<strong>2008</strong><br />
Sept.<br />
PotashCorp +13%<br />
Yara +8%<br />
Mosaic -3%<br />
Uralkali -9%<br />
Source: Bloomberg; as of 12 September <strong>2008</strong><br />
September <strong>2008</strong> <strong>K+S</strong> Group 54
<strong>K+S</strong> <strong>Aktiengesellschaft</strong><br />
Shareholder Structure<br />
• BASF holds approx. 10% of our shares<br />
• MCC Holding Limited (Linea Ltd.), an investment<br />
vehicle of Andrey Melnichenko, which is also<br />
invested in the Russianagrochemical enterprise<br />
EuroChem, holds 10.43% of our shares<br />
Freefloat 79.27%<br />
• The freefloat of <strong>K+S</strong> AG amounts to a good 79%<br />
MCC Holding Ltd.<br />
(Linea Ltd.) 10.43%<br />
BASF SE 10.30%<br />
September <strong>2008</strong> <strong>K+S</strong> Group 55
<strong>K+S</strong> Group<br />
Financial Calendar<br />
12 November <strong>2008</strong> ‣ Interim report 30 September <strong>2008</strong><br />
12 March 2009 ‣ Report on business in <strong>2008</strong><br />
‣ Press and analyst conference, Frankfurt am Main<br />
13 May 2009 ‣ Annual General Meeting 2009, Kassel<br />
‣ Interim report 31 March 2009<br />
14 May 2009 ‣ Dividend payment for the year <strong>2008</strong><br />
13 August 2009 ‣ Interim report 30 June 2009<br />
September <strong>2008</strong> <strong>K+S</strong> Group 56
<strong>K+S</strong> <strong>Aktiengesellschaft</strong><br />
Bertha-von-Suttner-Straße 7<br />
34131 Kassel (Germany)<br />
phone: +49 (0)561 / 9301-0<br />
fax: +49 (0)561 / 9301-1753<br />
www.k-plus-s.com<br />
Investor Relations<br />
phone: +49 (0)561 / 9301-1460<br />
fax: +49 (0)561 / 9301-2425<br />
email: investor-relations@k-plus-s.com<br />
Experience growth.
<strong>K+S</strong> Group<br />
Content<br />
A. Corporate Structure<br />
B. Core Business Segments:<br />
- Fertilizers and Plant Care<br />
-Salt<br />
C. Complementary Business Segments<br />
D. Strategy<br />
E. Financial Data and Outlook<br />
F. <strong>K+S</strong> Share<br />
Appendix<br />
September <strong>2008</strong> <strong>K+S</strong> Group 58
<strong>K+S</strong> Group<br />
History<br />
1889 Formation of „<strong>Aktiengesellschaft</strong> für Bergbau und Tiefbohrung“,<br />
the eldest predeceasing company of today’s <strong>K+S</strong> <strong>Aktiengesellschaft</strong><br />
1970/71 Merger of all three West-German potash producers to Kali und Salz GmbH; BASF is<br />
majority shareholder / change of corporate form into Kali und Salz AG<br />
1993 Merger of the potash and rock salt activities of Kali und Salz AG and the East-German<br />
Mitteldeutsche Kali AG into the Kali und Salz GmbH (Kali und Salz AG share: 51%)<br />
1997 BASF reduces its stake of Kali und Salz AG to 49.5%<br />
1998 Purchase of the remaining share capital (49%) of Kali und Salz GmbH;<br />
BASF reduces its stake to 25.1%; <strong>K+S</strong> is included in the MDAX<br />
1999 Change of company name to <strong>K+S</strong> <strong>Aktiengesellschaft</strong>; acquisition of COMPO and<br />
fertiva; BASF reduces its stake to approx. 15%<br />
2000/2001 <strong>K+S</strong> cancelled 10% own shares (2000); expansion of the business segments COMPO<br />
and salt by further acquisitions<br />
2002 Foundation of salt joint venture esco - european salt company (<strong>K+S</strong> stake: 62%)<br />
2003 <strong>K+S</strong> cancelled 5.6% own shares; BASF reduces its stake to approx. 10%<br />
2004 Acquisition of Solvay’s 38% share in esco<br />
2005 Share buyback of 1.25 million shares; Cooperation between COMPO and Syngenta in the area<br />
of plant protection products<br />
2006 Acquisition of the Chilean salt producer Sociedad Punta de Lobos<br />
<strong>2008</strong> Inclusion in the DAX<br />
September <strong>2008</strong> <strong>K+S</strong> Group 59
<strong>K+S</strong> Group<br />
Revenues and Earnings as of 31 December 2007<br />
€ million<br />
2007 2006<br />
%<br />
Revenues<br />
3,344.1<br />
2.957.7<br />
+ 13.1<br />
Operating earnings (EBIT I)<br />
285.7<br />
278.0<br />
+ 2.8<br />
Earnings after market value changes (EBIT II)<br />
- 106.9<br />
361.6<br />
-<br />
Financial result<br />
- 35.7<br />
- 20.1<br />
- 77.6<br />
Earnings before income taxes (EBT)<br />
Income taxes<br />
of which: deferred taxes<br />
Group earnings after taxes<br />
- 142.6<br />
- 49.5<br />
- 68.9<br />
- 93.3<br />
341.5<br />
112.2<br />
62.3<br />
228.9<br />
**<br />
**<br />
**<br />
-<br />
-<br />
-<br />
-<br />
Earnings before income taxes, adjusted *<br />
250.0<br />
257.9<br />
**<br />
- 3.1<br />
Group earnings after taxes, adjusted *<br />
175.3<br />
176.2<br />
- 0.5<br />
* adjusted for the effect of market value changes in hedging transactions;<br />
in the case of adjusted Group earnings, the resulting tax effects were also eliminated<br />
** excluding non-recurrent deferred tax income of € 41.9 million<br />
September <strong>2008</strong> <strong>K+S</strong> Group 60
<strong>K+S</strong> 3.700 Group<br />
Changes in Revenues as of 31 December 2007<br />
3.600<br />
€ million<br />
3.500<br />
3.400 3,400<br />
3,344.1<br />
3.300 3,300<br />
3.200 3,200<br />
3.100 3,100<br />
+267.8<br />
-76.0<br />
+126.4<br />
+386.4<br />
3.000 3,000<br />
+68.2<br />
2.900 2,900<br />
2,957.7<br />
2.800 2,800<br />
2.700 2,700<br />
2.600 2,600<br />
Revenues<br />
2006<br />
Volume/<br />
structure<br />
Prices<br />
Exchange<br />
rates<br />
Consolidation<br />
Revenues<br />
2007<br />
September <strong>2008</strong> <strong>K+S</strong> Group 61
<strong>K+S</strong> Group<br />
Balance Sheet as of 31 December 2007<br />
€ million<br />
Non-current assets<br />
of which: Intangible assets<br />
Property, plant and equipment<br />
Securities<br />
Deferred tax assets<br />
Current assets<br />
of which: Inventories<br />
Accounts receivable - trade<br />
Securities and cash and cash equivalents<br />
Equity<br />
Non-current debt<br />
of which: Financial liabilities<br />
Provisions (pensions and mining obligations)<br />
Deferred tax liabilities<br />
Current debt<br />
of which: Financial liabilities<br />
Balance sheet total<br />
Net indebtedness (including pension provisions for mining obligations)<br />
2007<br />
1,440.2<br />
172.5<br />
1,124.8<br />
37.1<br />
70.0<br />
1,524.6<br />
368.6<br />
757.2<br />
53.1<br />
931.8<br />
1,004.2<br />
360.2<br />
483.3<br />
21.7<br />
1,028.8<br />
328.1<br />
2,964.8<br />
1,086.5<br />
2006<br />
1,396.6<br />
189.0<br />
1,082.6<br />
42.1<br />
52.0<br />
1,434.3<br />
370.2<br />
628.8<br />
79.6<br />
1,124.3<br />
822.1<br />
136.8<br />
466.4<br />
79.5<br />
884.5<br />
233.9<br />
2,830.9<br />
718.2<br />
September <strong>2008</strong> <strong>K+S</strong> Group 62
<strong>K+S</strong> Group<br />
Cash Flow Statement as of 31 December 2007<br />
€ million<br />
2007 2006 +/-<br />
Gross cash flow<br />
372.1<br />
342.7<br />
+ 29.4<br />
Cash flow provided by operating activities *<br />
258.7<br />
227.6<br />
+ 31.1<br />
Cash flow used in investing activities<br />
- 140.7<br />
- 429.8<br />
+ 289.1<br />
- of which: acquisitions/divestments<br />
2.6<br />
- 357.7<br />
+ 360.3<br />
Free cash flow before acquisitions/divestments *<br />
115.4<br />
155.6<br />
- 40.2<br />
Free cash flow<br />
- 249.0<br />
- 227.4<br />
- 21.6<br />
Cash flow used in financing activities<br />
81.7<br />
170.9<br />
- 89.2<br />
Change in cash and cash equivalents<br />
- 167.8<br />
- 53.4<br />
- 114.4<br />
* adjusted for the tie-up of funds for premium payments for hedging transactions<br />
September <strong>2008</strong> <strong>K+S</strong> Group 63
<strong>K+S</strong> Group<br />
Operating EBIT Margins as of 31 December 2007<br />
Operating<br />
earnings<br />
Revenues<br />
Operating<br />
EBIT margin<br />
€ million<br />
2007 2007<br />
2007<br />
2006<br />
Potash and Magnesium Products<br />
177.9<br />
1,408.0<br />
12.6%<br />
12.8%<br />
COMPO<br />
32.0<br />
617.4<br />
5.2%<br />
5.3%<br />
fertiva<br />
25.3<br />
648.1<br />
3.9%<br />
3.0%<br />
Salt<br />
47.8<br />
545.1<br />
8.8%<br />
13.9%<br />
Waste Management and Recycling<br />
Services and Trading<br />
11.5<br />
27.7<br />
70.5<br />
55.0<br />
16.3%<br />
50.4%<br />
*<br />
19.9%<br />
*<br />
46.2%<br />
Reconciliation<br />
-36.5<br />
-<br />
-<br />
-<br />
<strong>K+S</strong> Group<br />
285.7<br />
3,344.1<br />
8.5%<br />
9.4%<br />
* incl. internal revenues: 20.5% (as of 31 Dec. 2007) and 19.3% (as of 31 Dec. 2006)<br />
September <strong>2008</strong> <strong>K+S</strong> Group 64
<strong>K+S</strong> Group<br />
ROCE as of 31 December 2007<br />
Operating<br />
earnings<br />
Net<br />
assets<br />
*<br />
Return on<br />
capital employed<br />
€ million<br />
2007 2007<br />
2007<br />
2006<br />
Potash and Magnesium Products<br />
177.9<br />
861.0<br />
20.7%<br />
18.6%<br />
COMPO<br />
32.0<br />
300.5<br />
10.7%<br />
10.3%<br />
fertiva<br />
25.3<br />
-94.9<br />
-<br />
-<br />
Salt<br />
47.8<br />
693.5<br />
6.9%<br />
14.1%<br />
Waste Management and Recycling<br />
11.5<br />
28.1<br />
40.9%<br />
55.2%<br />
Services and Trading<br />
27.7<br />
34.1<br />
-<br />
-<br />
Reconciliation<br />
- 36.5<br />
20.0<br />
-<br />
-<br />
<strong>K+S</strong> Group<br />
285.7<br />
1,842.3<br />
15.5%<br />
17.4%<br />
* average (1 Jan. + 31 Dec.) : 2<br />
September <strong>2008</strong> <strong>K+S</strong> Group 65
<strong>K+S</strong> Group<br />
Forward-Looking Statements<br />
This presentation contains facts and forecasts that relate to the future development<br />
of the <strong>K+S</strong> Group and its companies. The forecasts are estimates that we have<br />
made on the basis of all information available to us at this moment in time.<br />
Should the assumptions underlying these forecasts prove not to be correct,<br />
actual events may deviate from expectations as set forth at the present time.<br />
September <strong>2008</strong> <strong>K+S</strong> Group <strong>K+S</strong> Group 66
<strong>K+S</strong> <strong>Aktiengesellschaft</strong><br />
Bertha-von-Suttner-Straße 7<br />
34131 Kassel (Germany)<br />
phone: +49 (0)561 / 9301-0<br />
fax: +49 (0)561 / 9301-1753<br />
www.k-plus-s.com<br />
Investor Relations<br />
phone: +49 (0)561 / 9301-1460<br />
fax: +49 (0)561 / 9301-2425<br />
email: investor-relations@k-plus-s.com<br />
Experience growth.