Table of Contents - The Port of Los Angeles
Table of Contents - The Port of Los Angeles
Table of Contents - The Port of Los Angeles

You also want an ePaper? Increase the reach of your titles
YUMPU automatically turns print PDFs into web optimized ePapers that Google loves.
<strong>Port</strong> <strong>of</strong> <strong>Los</strong> <strong>Angeles</strong> <strong>Port</strong>wide Rail Synopsis<br />
Review Draft<br />
Prepared for:<br />
<strong>Port</strong> <strong>of</strong> <strong>Los</strong> <strong>Angeles</strong><br />
Prepared by:<br />
July 2004
<strong>Port</strong> <strong>of</strong> <strong>Los</strong> <strong>Angeles</strong><br />
<strong>Port</strong>wide Rail Synopsis<br />
Prepared for:<br />
<strong>Port</strong> <strong>of</strong> <strong>Los</strong> <strong>Angeles</strong><br />
425 S. Palos Verdes Street<br />
San Pedro, CA 90731<br />
Contact: Paul Johansen<br />
310/732-3678<br />
Prepared by:<br />
Jones & Stokes<br />
17310 Red Hill Avenue, Suite 320<br />
Irvine, CA 92614-5600<br />
Contacts: Kris Bonner, 949/260-1080<br />
Jennifer Barnes, 425/822-1077<br />
July 2004
Jones & Stokes. 2004. <strong>Port</strong> <strong>of</strong> <strong>Los</strong> <strong>Angeles</strong> <strong>Port</strong>wide Rail Synopsis. July.<br />
(J&S 04320.04.) Irvine, CA. Prepared for the <strong>Port</strong> <strong>of</strong> <strong>Los</strong> <strong>Angeles</strong>.
<strong>Table</strong> <strong>of</strong> <strong>Contents</strong><br />
Chapter 1. Introduction.......................................................................................................................... 1<br />
Purpose <strong>of</strong> Report...................................................................................................................................................1<br />
Background .............................................................................................................................................................1<br />
<strong>Port</strong> Rail Policy........................................................................................................................................................2<br />
Primary Sources......................................................................................................................................................2<br />
<strong>Port</strong> Rail Capacity Analysis ..................................................................................................................................2<br />
Supplemental Sources .........................................................................................................................................3<br />
Overview <strong>of</strong> Report .................................................................................................................................................3<br />
Chapter 2. Cargo, Facilities, and Container Movement...........................................................................5<br />
Containers and Ships .............................................................................................................................................5<br />
Container Terminals................................................................................................................................................6<br />
Cargo Origins and Destinations ............................................................................................................................7<br />
How Cargo Moves ...................................................................................................................................................7<br />
Truck Movement...................................................................................................................................................8<br />
Rail Movement......................................................................................................................................................8<br />
Truck Versus Rail Movement ...............................................................................................................................9<br />
Conclusion...............................................................................................................................................................9<br />
Chapter 3. Existing Transportation Facilities .................................................................................... 10<br />
Railroad Facilities..................................................................................................................................................10<br />
Railroad Lines.....................................................................................................................................................10<br />
On-dock ICTFs.......................................................................................................................................................12<br />
Off-dock and Near-dock Rail Yards .....................................................................................................................14<br />
Roadways ..............................................................................................................................................................14<br />
Chapter 4. Cargo Forecasts ................................................................................................................ 16<br />
Unconstrained Forecasts .....................................................................................................................................16<br />
Capacity Consideration for Truck Haul Forecasts .............................................................................................16<br />
Capacity Consideration for Rail Forecasts.........................................................................................................16<br />
Capacity Analysis <strong>of</strong> Rail Yards..........................................................................................................................17<br />
Off-dock Rail Capacity Versus Demand .............................................................................................................21<br />
Near-dock Rail Demand .....................................................................................................................................21<br />
Intermodal Volume Forecasts.............................................................................................................................22<br />
Chapter 5. Railroad Mainline Simulation Model ................................................................................ 23<br />
Model Overview.....................................................................................................................................................23<br />
Overview <strong>of</strong> Simulation Approach.......................................................................................................................23<br />
Description <strong>of</strong> Simulation Elements....................................................................................................................25<br />
Cargo Forecasts.................................................................................................................................................25<br />
Train Forecasts...................................................................................................................................................25<br />
Model Network....................................................................................................................................................26<br />
Summary <strong>of</strong> Simulation Scenarios ......................................................................................................................26<br />
Rail Level <strong>of</strong> Service Definition...........................................................................................................................26<br />
Conclusions from Simulation ..............................................................................................................................28<br />
Existing Conditions.............................................................................................................................................28<br />
Future Conditions ...............................................................................................................................................28<br />
<strong>Port</strong> <strong>of</strong> <strong>Los</strong> <strong>Angeles</strong> July 2004<br />
Review Draft<br />
Page i
Chapter 6. Summary <strong>of</strong> Rail Recommendations ............................................................................... 33<br />
Track Improvements...........................................................................................................................................33<br />
Centralized Traffic Control System Improvements .............................................................................................34<br />
Other Operating Improvements ..........................................................................................................................35<br />
Chapter 7. Relationship to Freight Truck Haulage ............................................................................ 36<br />
<strong>Port</strong> Baseline Transportation Study ....................................................................................................................36<br />
Baseline Study Approach ...................................................................................................................................36<br />
Existing Intersection Conditions Analysis ...........................................................................................................36<br />
Capacity Consideration for Truck Haul Forecasts .............................................................................................37<br />
Recommended Roadway Improvements ............................................................................................................38<br />
Operations Improvements ..................................................................................................................................39<br />
Infrastructure Improvements...............................................................................................................................39<br />
Intelligent Transportation Systems Measures.....................................................................................................40<br />
Impact <strong>of</strong> Freight Rail on Air Quality ...................................................................................................................40<br />
Introduction.........................................................................................................................................................40<br />
Air Quality Regulations and Policies...................................................................................................................41<br />
Draft 2001 Baseline Emission Inventory.............................................................................................................43<br />
Comparison <strong>of</strong> Rail and Truck Emissions...........................................................................................................44<br />
Potential for Air Quality Benefits from Increased Use <strong>of</strong> Rail Cargo...................................................................46<br />
Impact <strong>of</strong> Freight Rail on Roadway Congestion.................................................................................................47<br />
Chapter 8. Conclusion ......................................................................................................................... 50<br />
References ............................................................................................................................................ 51<br />
Printed References................................................................................................................................................51<br />
Personal Communications ...................................................................................................................................52<br />
Glossary <strong>of</strong> Terms ..................................................................................................................................... 53<br />
<strong>Port</strong> <strong>of</strong> <strong>Los</strong> <strong>Angeles</strong> July 2004<br />
Review Draft<br />
Page ii
<strong>Table</strong>s<br />
2-1 Top Container Impacts and Exports .................................................................................. 7<br />
3-1 Off-dock Rail Yards ........................................................................................................... 14<br />
4-1 <strong>Port</strong> Summary <strong>of</strong> Rail Yard Capacities............................................................................. 19<br />
4-2 <strong>Port</strong> <strong>of</strong> <strong>Los</strong> <strong>Angeles</strong> Intermodal MPC Model Results...................................................... 20<br />
4-3 <strong>Port</strong>s <strong>of</strong> <strong>Los</strong> <strong>Angeles</strong> and Long Beach Intermodal MPC Model Results....................... 21<br />
4-4 <strong>Port</strong>s <strong>of</strong> <strong>Los</strong> <strong>Angeles</strong> and Long Beach<br />
Intermodal Demand and Rail Yard Capacities................................................................. 22<br />
5-1 <strong>Port</strong>s <strong>of</strong> <strong>Los</strong> <strong>Angeles</strong> and Long Beach Peak Day Train Forecast.................................. 26<br />
5-2 Level <strong>of</strong> Service Criteria for <strong>Port</strong> Area Rail Operations.................................................. 27<br />
5-3 Level <strong>of</strong> Service Criteria for <strong>Port</strong>/Alameda Corridor Rail Operations............................ 27<br />
5-4 Network Performance Results for<br />
<strong>Port</strong>s <strong>of</strong> <strong>Los</strong> <strong>Angeles</strong> and Long Beach Rail System....................................................... 30<br />
7-1 Level <strong>of</strong> Service Criteria for Signalized Intersections .................................................... 37<br />
7-2 Level <strong>of</strong> Service Criteria for Unsignalized Intersections................................................ 37<br />
7-3 2001 <strong>Port</strong>wide Emissions by Source Category, Tons Per Year ..................................... 45<br />
7-4 2001 <strong>Port</strong>wide Emissions by Source Category, Tons Per Day ...................................... 45<br />
7-5 Estimated Annual Average Tons Per Day <strong>of</strong> Emissions From<br />
Rail and Heavy-Duty Diesel Trucks, South Coast Air Basin, 2000 and 2010................ 46<br />
7-6 Passenger Car Equivalents for LOS Effects <strong>of</strong> Trucks on Freeways............................ 48<br />
7-7 LOS for Basic Freeway Sections...................................................................................... 49<br />
<strong>Port</strong> <strong>of</strong> <strong>Los</strong> <strong>Angeles</strong> July 2004<br />
Review Draft<br />
Page iii
Figures<br />
2-1 Container Delivery Methods, by Distance from <strong>Port</strong> <strong>of</strong> <strong>Los</strong> <strong>Angeles</strong>.................follows 8<br />
2-2 Rail and Truck Shipment <strong>of</strong> <strong>Port</strong> <strong>of</strong> <strong>Los</strong> <strong>Angeles</strong>.................................................follows 8<br />
2-3 Trip Equivalents for <strong>Port</strong> <strong>of</strong> <strong>Los</strong> <strong>Angeles</strong> Freight Cargo Models........................follows 9<br />
3-1 Major Rail Lines and Facilities.............................................................................follows 11<br />
3-2 Existing Rail Facilities..........................................................................................follows 11<br />
3-3 Alameda Corridor .................................................................................................follows 11<br />
3-4 On-dock ICTFs at <strong>Port</strong> <strong>of</strong> <strong>Los</strong> <strong>Angeles</strong> ............................................................................ 13<br />
3-5 Key Roadways Used Between UP ICTF and <strong>Port</strong>s............................................ follows 15<br />
4-1 Existing and Proposed Future ICTFs at <strong>Port</strong> <strong>of</strong> <strong>Los</strong> <strong>Angeles</strong> ........................................ 18<br />
5-1 Major Steps <strong>of</strong> Railroad Simulation ................................................................................. 24<br />
6-1 Recommended <strong>Port</strong> Rail Capacity Improvements .............................................follows 34<br />
6-2 Recommended Extension <strong>of</strong> <strong>Port</strong><br />
Centralized Traffic Control, 2010–2015...............................................................follows 34<br />
7-1 Potential Improvements to Roadway System ....................................................follows 39<br />
7-2 Estimated Annual Average Tons Per Day <strong>of</strong> Rail Emissions,<br />
South Coast Air Basin, 2000 and 2010................................................................follows 47<br />
7-3 Estimated Annual Average Tons Per Day <strong>of</strong> Truck Emissions,<br />
South Coast Air Basin, 2000 and 2010................................................................follows 47<br />
7-4 Estimated NOx Emissions Per Ton-Mile <strong>of</strong> Rail and Truck Freight,<br />
South Coast Air Basin, 2000–2010......................................................................follows 47<br />
7-5 Estimated PM10 Emissions Per Ton-Mile <strong>of</strong> Rail and Truck Freight,<br />
South Coast Air Basin, 2000–2010......................................................................follows 47<br />
<strong>Port</strong> <strong>of</strong> <strong>Los</strong> <strong>Angeles</strong> July 2004<br />
Review Draft<br />
Page iv
Acronyms and Abbreviations<br />
2001 BEI Draft <strong>Port</strong>wide Baseline Emission Inventory using 2001 Data<br />
ACTA Alameda Corridor Transportation Authority<br />
APL American President Line<br />
AREMA American Railway Engineering and Maintenance-<strong>of</strong>-Way Association<br />
ATMIS <strong>Port</strong>s Automated Traffic Management and Information System<br />
BNSF Burlington Northern & Santa Fe Railroad<br />
CARB California Air Resources Board<br />
CO carbon monoxide<br />
CP control point<br />
CTC Centralized Traffic Control<br />
EPA U.S. Environmental Protection Agency<br />
HC hydrocarbons<br />
I-110 Interstate 110<br />
I-710 Interstate 710<br />
ICTF intermodal container transfer facility<br />
ITS International Transportation Service<br />
LAHD <strong>Los</strong> <strong>Angeles</strong> Harbor Department<br />
LOS Level <strong>of</strong> Service<br />
mph miles per hour<br />
MTA <strong>Los</strong> <strong>Angeles</strong> County Metropolitan Transportation Authority<br />
NOx oxides <strong>of</strong> nitrogen<br />
NYK Nippon Yusen Kaisha<br />
PCE passenger car equivalent<br />
PCT Pacific Container Terminal<br />
PHL Pacific Harbor Line<br />
PM10 particulate matter less than 10 microns in diameter<br />
<strong>Port</strong> <strong>Port</strong> <strong>of</strong> <strong>Los</strong> <strong>Angeles</strong><br />
RTC Rail Traffic Controller<br />
SCAQMD South Coast Air Quality Management District<br />
SOx sulfur dioxide<br />
SR State Route<br />
SSA Stevedoring Services <strong>of</strong> America<br />
TEUs twenty-foot equivalent units<br />
TICTF Terminal Island Container Transfer Facility<br />
UP Union Pacific Railroad<br />
V/C volume to capacity ratio<br />
VOC volatile organic compounds<br />
WBICTF West Basin Intermodal Container Transfer Facility<br />
YML Yang Ming Lines<br />
YTI Yusen Terminal Incorporated<br />
<strong>Port</strong> <strong>of</strong> <strong>Los</strong> <strong>Angeles</strong> July 2004<br />
Review Draft<br />
Page v
Chapter 1. Introduction<br />
Purpose <strong>of</strong> Report<br />
Background<br />
<strong>The</strong> purpose <strong>of</strong> this <strong>Port</strong>wide Rail Synopsis is to summarize previous technical studies<br />
completed for the <strong>Port</strong> <strong>of</strong> <strong>Los</strong> <strong>Angeles</strong> (<strong>Port</strong>) that forecast future cargo quantities and<br />
types, analyze the capacity <strong>of</strong> the existing rail system, and recommend rail<br />
improvements. While this report focuses on the rail system that serves the <strong>Port</strong>, it also<br />
provides a summary <strong>of</strong> the larger physical and operational context in which the rail<br />
analyses and recommendations were made, and discusses the interconnection <strong>of</strong> rail with<br />
trucks.<br />
Railroads were responsible for settlement <strong>of</strong> the West and the emergence <strong>of</strong> the United<br />
States into an economic superpower by allowing efficient transport <strong>of</strong> goods to and from<br />
markets. Similarly, railroads played a key role in the development <strong>of</strong> the <strong>Port</strong> into a<br />
world‐class seaport. Rail is essential to both the <strong>Port</strong>’s current operation and its future<br />
growth.<br />
Intermodal<br />
Transport:<br />
Containerized<br />
cargo moved via<br />
two different<br />
modes <strong>of</strong><br />
transportation<br />
(ship, truck and<br />
rail).<br />
Throughput:<br />
<strong>The</strong> amount <strong>of</strong><br />
cargo<br />
transferred in<br />
and out <strong>of</strong> a<br />
port.<br />
<strong>The</strong> <strong>Port</strong> was connected to downtown <strong>Los</strong> <strong>Angeles</strong> by rail in 1869 when Phineas Banning<br />
opened the <strong>Los</strong> <strong>Angeles</strong> and San Pedro Railroad; in the same year, the first<br />
transcontinental rail line was completed. Southern Pacific Railroad later acquired<br />
Banning’s line and connected <strong>Los</strong> <strong>Angeles</strong> and the <strong>Port</strong> to the rest <strong>of</strong> the nation through<br />
the transcontinental railroad network. Today, Burlington Northern & Santa Fe (BNSF)<br />
Railroad and Union Pacific (UP) Railroad provide long‐haul service to the <strong>Port</strong>, while<br />
Pacific Harbor Line (PHL) provides local switching and train control services.<br />
Since the 1960s, both the volume and the percentage <strong>of</strong> goods being transported by<br />
standardized shipping containers have increased significantly. <strong>The</strong>se weatherpro<strong>of</strong>ed<br />
steel containers can easily be transferred between ships, trains, and trucks, a process<br />
called intermodal transport. Intermodal transport has become the standard method <strong>of</strong><br />
moving goods worldwide, resulting in improved safety and efficiency and reduced costs.<br />
Containerization has enabled dramatic increases in international trade.<br />
<strong>The</strong> <strong>Port</strong> is the busiest container port in the United States, and the eighth busiest in the<br />
world. Located in San Pedro Bay, approximately 20 miles south <strong>of</strong> downtown <strong>Los</strong><br />
<strong>Angeles</strong>, the <strong>Port</strong> occupies 7,500 acres <strong>of</strong> land and water along 43 miles <strong>of</strong> waterfront. In<br />
addition to the <strong>Port</strong>, San Pedro Bay is home to the <strong>Port</strong> <strong>of</strong> Long Beach. When considered<br />
together, the combined trade <strong>of</strong> the <strong>Port</strong> and the <strong>Port</strong> <strong>of</strong> Long Beach ranks third in the<br />
world in container throughput (behind Hong Kong and Singapore), and serves as the<br />
country’s primary gateway to Asian‐based trading partners. About 575,000 jobs in<br />
southern California (based upon 2002 calendar year) are related to these two ports. (<strong>Port</strong><br />
<strong>of</strong> <strong>Los</strong> <strong>Angeles</strong> 2003a.)<br />
<strong>Port</strong> <strong>of</strong> <strong>Los</strong> <strong>Angeles</strong> July 2004<br />
Review Draft Page 1
<strong>Port</strong>wide Rail Synopsis<br />
Chapter 1. Introduction<br />
Regional<br />
Market:<br />
Area 550<br />
miles from<br />
the <strong>Port</strong>,<br />
usually<br />
served by<br />
truck transit.<br />
Half <strong>of</strong> the cargo coming through the <strong>Port</strong> is delivered by truck to the regional market,<br />
an area that is within roughly 550 miles <strong>of</strong> the <strong>Port</strong>. Goods destined for the national<br />
market beyond this area are delivered primarily by rail. As recently as 1996, all railbound<br />
containers traveling through the <strong>Port</strong> had to first be trucked to rail yards outside<br />
the harbor. Since that time, the <strong>Port</strong> has moved to the forefront <strong>of</strong> rail handling by<br />
constructing four on‐dock intermodal container transfer facilities (ICTFs) that allow<br />
containers to move between ships and trains without traveling on streets and freeways<br />
outside the <strong>Port</strong>.<br />
Forecasts indicate that cargo demand at the <strong>Port</strong> is expected to increase substantially over<br />
the next 5 to 20 years. Rail transport is a key component in accommodating this future<br />
growth. <strong>The</strong> purpose <strong>of</strong> this <strong>Port</strong>wide Rail Synopsis is to document existing rail<br />
conditions and identify improvements that will meet projected growth needs.<br />
<strong>Port</strong> Rail Policy<br />
<strong>The</strong> <strong>Port</strong> has developed a Draft Rail Policy, submitted to the Board <strong>of</strong> Harbor<br />
Commissioners on April 22, 2004. This proposed policy recognizes the anticipated<br />
growth in container cargo and supports the need to accommodate projected demand.<br />
Specifically, the <strong>Port</strong> policy resolves to:<br />
Intermodal<br />
Container<br />
Transfer<br />
Facility<br />
(ICTF):<br />
A rail yard<br />
used to<br />
transfer<br />
containers to<br />
and from<br />
trains.<br />
■<br />
■<br />
■<br />
■<br />
Provide for near‐dock access to Class I railroads for shippers, carriers, and terminal<br />
operators;<br />
Ensure that rail is used to its fullest feasible extent by container operations;<br />
Ensure that sufficient rail capacity is maintained to increase rail usage to meet future<br />
demand; and<br />
Provide the opportunity to direct local movements <strong>of</strong> cargo from truck to rail.<br />
<strong>The</strong> rail analysis summarized in this report provides technical analysis and identifies<br />
recommended improvements that support this Draft Rail Policy.<br />
Primary Sources<br />
This <strong>Port</strong>wide Rail Synopsis summarizes the <strong>Port</strong> Rail Capacity Analysis report prepared<br />
in 2003 and supplements its information with other sources. To prevent citing the <strong>Port</strong><br />
Rail Capacity Analysis pr<strong>of</strong>usely throughout this synopsis, it will be understood that<br />
information that is not cited was taken from the <strong>Port</strong> Rail Capacity Analysis (<strong>Port</strong> <strong>of</strong> <strong>Los</strong><br />
<strong>Angeles</strong> 2003b).<br />
<strong>Port</strong> Rail Capacity Analysis<br />
<strong>The</strong> <strong>Port</strong> Rail Capacity Analysis identifies the growth in rail traffic expected to occur in<br />
order to accommodate projected future cargo demand, and to identify improvements<br />
needed for rail to meet that demand. Transportation planning tools applied in this study<br />
included a model that determined the practical capacity <strong>of</strong> freight rail based on rail yard<br />
capacity, and a simulation model that analyzed the mainline rail operations under<br />
existing and projected future conditions. <strong>The</strong> study identified system deficiencies <strong>of</strong> rail<br />
<strong>Port</strong> <strong>of</strong> <strong>Los</strong> <strong>Angeles</strong> July 2004<br />
Review Draft Page 2
<strong>Port</strong>wide Rail Synopsis<br />
Chapter 1. Introduction<br />
yards and the mainline rail network in and around the <strong>Port</strong>, and recommended physical<br />
and operational strategies to alleviate those deficiencies. (<strong>Port</strong> <strong>of</strong> <strong>Los</strong> <strong>Angeles</strong> 2003b).<br />
Supplemental Sources<br />
Information that supplements the <strong>Port</strong> Rail Capacity Analysis is cited throughout this<br />
synopsis and is fully referenced at the end <strong>of</strong> the document. <strong>The</strong> following three studies<br />
are the primary supplemental sources used throughout this synopsis.<br />
Overview <strong>of</strong> Report<br />
1. San Pedro Bay <strong>Port</strong>s Rail Market Study. <strong>The</strong> objectives <strong>of</strong> this study were to<br />
identify destinations for cargo volumes to be handled by on‐ and near‐dock<br />
facilities; project future rail demand; assess capacities <strong>of</strong> on‐, near‐, and <strong>of</strong>f‐dock<br />
rail yards and identify associated deficiencies; conduct revenue analysis to<br />
determine the financial feasibility <strong>of</strong> recommended improvements; and define<br />
areas where further study was warranted. (<strong>Port</strong> <strong>of</strong> <strong>Los</strong> <strong>Angeles</strong> 2004a).<br />
2. Baseline Transportation Study. This study was conducted to address existing<br />
and future roadway deficiencies associated with the <strong>Port</strong>. It includes analysis <strong>of</strong><br />
existing and future vehicular traffic demand, identification <strong>of</strong> roadway system<br />
deficiencies, and recommendations for necessary improvements. Both<br />
transportation planning and traffic engineering analyses were conducted as part<br />
<strong>of</strong> this study. <strong>The</strong> study included analyses within and immediately adjacent to<br />
the <strong>Port</strong>. Regional transportation system analyses were also performed on the<br />
freeway system. (<strong>Port</strong> <strong>of</strong> <strong>Los</strong> <strong>Angeles</strong> 2003c.).<br />
3. Comparison <strong>of</strong> Rail and Truck Emissions per Ton‐Mile <strong>of</strong> Cargo. This study<br />
was prepared for the Association <strong>of</strong> American Railroads to compare rail and<br />
truck emissions per ton‐mile <strong>of</strong> cargo for the South Coast and San Joaquin Air<br />
Basins for 2000 to 2012 (Caretto 2004).<br />
This report includes the following sections:<br />
Mode:<br />
Type <strong>of</strong><br />
transportation<br />
(e.g., rail, ship,<br />
and truck).<br />
■<br />
■<br />
■<br />
■<br />
Chapter 1: Introduction—Introduces the <strong>Port</strong>wide Rail Synopsis, gives a background<br />
description <strong>of</strong> the <strong>Port</strong>’s relationship with rail, and presents the main sources used to<br />
create this report.<br />
Chapter 2: Cargo, Facilities, and Container Movement—Describes the<br />
characteristics <strong>of</strong> cargo, containers, container terminals, and the transit mode<br />
combinations by which cargo moves into and out <strong>of</strong> the <strong>Port</strong>.<br />
Chapter 3: Existing Transportation Facilities—Describes the rail facilities and<br />
roadways that serve the <strong>Port</strong>.<br />
Chapter 4: Cargo Forecasts—Summarizes the cargo forecasted between now and<br />
2020, and identifies the sources <strong>of</strong> the forecast numbers.<br />
<strong>Port</strong> <strong>of</strong> <strong>Los</strong> <strong>Angeles</strong> July 2004<br />
Review Draft Page 3
<strong>Port</strong>wide Rail Synopsis<br />
Chapter 1. Introduction<br />
■<br />
■<br />
■<br />
■<br />
■<br />
■<br />
Chapter 5: Railroad Mainline Simulation Model—Summarizes the methodology<br />
and results <strong>of</strong> the simulation <strong>of</strong> the trains in the rail network under projected future<br />
conditions.<br />
Chapter 6: Summary <strong>of</strong> Rail Recommendations—Describes the operational and<br />
infrastructure improvements to the rail system that have been identified by the<br />
technical studies.<br />
Chapter 7: Relationship to Freight Truck Haulage—Summarizes the analysis <strong>of</strong> the<br />
regional roadway system completed by the <strong>Port</strong>, as well as the roadway<br />
improvements needed to accommodate projected future truck cargo haulage. This<br />
chapter also discusses the potential impacts that elimination <strong>of</strong> truck trips in favor <strong>of</strong><br />
rail may have on regional air quality and traffic congestion.<br />
Chapter 8: Conclusion—Presents conclusions <strong>of</strong> this report.<br />
References—Complete list <strong>of</strong> sources that are cited throughout the report.<br />
Glossary—Provides definitions <strong>of</strong> terms and place names used in the document.<br />
Terms found in the glossary are bolded throughout the report, and selected terms are<br />
highlighted in the margins <strong>of</strong> the text.<br />
<strong>Port</strong> <strong>of</strong> <strong>Los</strong> <strong>Angeles</strong> July 2004<br />
Review Draft Page 4
Chapter 2. Cargo, Facilities, and Container Movement<br />
In 1959, the Matson Navigation Company’s ship “Hawaiian Merchant” made its first<br />
shipment <strong>of</strong> 20 cargo containers, marking the beginning <strong>of</strong> the containerized cargo<br />
handling at the <strong>Port</strong>. Today, intermodal transport <strong>of</strong> containerized cargo is the standard<br />
method <strong>of</strong> moving goods worldwide, accounting for about 90 percent <strong>of</strong> cargo<br />
movement. Containerization has dramatically increased the efficiency and reduced the<br />
cost <strong>of</strong> moving goods, enabling international trade to flourish. Locally, the shift to<br />
containers has reshaped the <strong>Port</strong>, and the forecasted increases in container cargo will<br />
continue this trend.<br />
This chapter describes the characteristics <strong>of</strong> containerization and cargo, how terminals<br />
operate, where cargo goes, and how cargo moves.<br />
Containers and Ships<br />
Twenty-foot<br />
equivalent<br />
unit (TEU):<br />
<strong>The</strong> standard<br />
measure <strong>of</strong><br />
container<br />
volume.<br />
Malcolm McLean, known as the ʺFather <strong>of</strong> Containerization,ʺ is credited with inventing<br />
the shipping container in the 1930s. Containers initially saw little commercial use but<br />
were used by the military during World War II. McLean’s idea eventually led him to<br />
found the Sea‐Land Shipping Company, which inaugurated container service in 1956.<br />
<strong>The</strong> first container ship voyage was the “Ideal X,” which carried 58 containers from New<br />
Jersey to Texas (GDV 2003). Shipping containers used in intermodal transit today<br />
generally conform to the International Organization for Standardization (ISO) container<br />
manufacturing standards. <strong>The</strong>se standards are designed to allow containers to be<br />
quickly and easily moved between ships, trucks, and trains.<br />
Although many shipping containers appear to be similar, a wide range <strong>of</strong> types are used,<br />
including general purpose or dry, insulated, flat rack or platform, open top, refrigerated,<br />
and tank designs. <strong>The</strong> majority <strong>of</strong> containers used worldwide today are 20 feet or 40 feet<br />
long, 8 feet wide, and 8.5 feet high (GDV 2003). <strong>The</strong> standard unit <strong>of</strong> measure used in<br />
shipping is the twenty‐foot equivalent unit (TEU). <strong>The</strong> most commonly used containers<br />
are 40 feet long and can convey 2 TEUs <strong>of</strong> cargo. While there is pressure from U.S.<br />
businesses to increase container size and thus efficiency, some countries in Europe and<br />
elsewhere oppose such changes due to the difficulties in moving larger containers on<br />
narrow roads.<br />
Since the time when “Ideal X” initiated the use <strong>of</strong> containerization, ships have increased<br />
in size to transport more containers in a single voyage. In 1988, the first container ships<br />
too large to pass through the Panama Canal—those carrying up to 2,170 containers—<br />
went into service. <strong>The</strong>se ships, referred to as “post‐Panamax” ships, have continued to<br />
increase in size over the last 15 years. Ships routinely carry more than 6,000 TEUs, and<br />
the newest ships carry more than 8,000 TEUs (White 2004).<br />
Although non‐containerized cargo such as liquid petroleum products, lumber,<br />
newsprint, and other “break bulk” items not suitable for containers are important trade,<br />
their percentage <strong>of</strong> total cargo at the <strong>Port</strong> is small and is expected to remain so; most <strong>of</strong><br />
the projected increases will be in containerized cargo. Automobiles are not shipped in<br />
containers, either. <strong>The</strong>y are conveyed by “roll on‐roll <strong>of</strong>f” ships in conjunction with<br />
<strong>Port</strong> <strong>of</strong> <strong>Los</strong> <strong>Angeles</strong> July 2004<br />
Review Draft Page 5
<strong>Port</strong>wide Rail Synopsis<br />
Chapter 2. Cargo, Facilities, and Container Movement<br />
receiving terminals that require less‐specialized port facilities and equipment than<br />
containerized cargo. This has enabled smaller, less congested harbors, such as <strong>Port</strong><br />
Hueneme in Ventura County, to be successful in competing for the auto importing trade.<br />
Container Terminals<br />
Backlands:<br />
Container<br />
storage areas.<br />
<strong>The</strong> information in this section was derived from the Draft Environmental Impact Report<br />
for Berth 206–209 Interim Container Reuse Project, which was prepared in May 2004 (<strong>Los</strong><br />
<strong>Angeles</strong> Harbor Department 2004).<br />
<strong>The</strong> <strong>Port</strong> includes 27 major cargo terminals—eight are container terminals and 19 are<br />
non‐container terminals. Combined, these terminals handle more than 120 million metric<br />
revenue tons <strong>of</strong> cargo representing some $102 billion.<br />
Stevedoring:<br />
<strong>The</strong> process<br />
<strong>of</strong> loading<br />
and<br />
unloading<br />
ships.<br />
<strong>The</strong> essential function <strong>of</strong> a container terminal is to transfer cargo from trucks and trains<br />
to ships, and from ships to trucks and trains. Terminals are complex facilities that<br />
integrate a variety <strong>of</strong> different physical components and operational processes. <strong>The</strong><br />
physical components consist <strong>of</strong> container vessels, berths/wharves (dock), cranes,<br />
container storage areas (backlands), entrance and exit gates, and maintenance and<br />
administration buildings. <strong>The</strong> operational processes include loading/unloading ships<br />
(stevedoring), terminal equipment and operations, rail operations, and trucking.<br />
Cargo is received and delivered through the truck gates and the on‐dock rail yard, if the<br />
terminal has one. Export cargo typically arrives at the terminal from 1 day to 1 week<br />
prior to the scheduled departure <strong>of</strong> the ship upon which the cargo is booked to sail.<br />
Chassis:<br />
Another<br />
word for an<br />
open trailer<br />
frame to<br />
which<br />
containers<br />
can be<br />
attached.<br />
Tractor:<br />
Truck cab<br />
without a<br />
trailer/chassis.<br />
Wharf gantry cranes are used to move containers on and <strong>of</strong>f ships. Gantry cranes move<br />
on rails imbedded in the wharf and typically can transfer 25 to 40 containers per hour.<br />
<strong>The</strong> cranes have anti‐sway devices, lighting, and adjustable “spreaders” (cargo hooks)<br />
that allow attachment to the various sizes <strong>of</strong> containers. <strong>The</strong> number <strong>of</strong> cranes operating<br />
simultaneously to load/unload one ship can vary from one to six cranes, depending on<br />
the size <strong>of</strong> the ship and the number <strong>of</strong> vessels at berth. Containers that are stored in<br />
terminal backlands are either stacked upon one another or stored on a trailer (chassis)<br />
and then parked.<br />
Export cargo arrives at the terminal by either truck or rail. Containers from trucks are<br />
stacked (grounded) in the terminal by yard equipment (sidepicks) or rubber‐tired gantry<br />
(RTG) cranes. Containers from trains are transferred from railcars to yard tractors<br />
(hoestlers) using yard equipment, and then transported by yard tractors to preplanned<br />
locations in the storage yard where the container is lifted to a grounded location by<br />
another crane.<br />
When the container ship arrives, longshoremen work day and night shifts, as necessary,<br />
to unload and load the ship. Dockside gantry crane operators lift containers (import<br />
cargo) from the ships onto specialized trailers pulled by yard tractors. <strong>The</strong> containers are<br />
then taken to backlands storage areas, on‐dock rail yards, or to truck loading areas.<br />
Export cargo, which is sitting ready on chassis or stacked on the ground in the yard, is<br />
then moved by yard tractor to the wharf and loaded onto the ship by gantry crane.<br />
<strong>Port</strong> <strong>of</strong> <strong>Los</strong> <strong>Angeles</strong> July 2004<br />
Review Draft Page 6
<strong>Port</strong>wide Rail Synopsis<br />
Chapter 2. Cargo, Facilities, and Container Movement<br />
Cargo Origins and Destinations<br />
In 2003, the <strong>Port</strong> handled 7.1 million TEUs. <strong>The</strong> United States generates a much higher<br />
import demand than export demand; as a result, volumes <strong>of</strong> imported cargo that travel<br />
through the <strong>Port</strong> are currently more than three times greater than volumes <strong>of</strong> exported<br />
cargo. Imports make up 75 percent <strong>of</strong> the cargo that comes through the <strong>Port</strong>. Due to the<br />
imbalance <strong>of</strong> imports and exports, ships usually arrive at West Coast ports with<br />
containers full <strong>of</strong> cargo but depart with a large number <strong>of</strong> empty containers, or<br />
containers filled with bulkier, lower value materials. <strong>The</strong> <strong>Port</strong>’s top trading partners are:<br />
■<br />
■<br />
■<br />
■<br />
■<br />
China ($35.7 billion),<br />
Japan ($24.8 billion),<br />
Taiwan ($10.1 billion),<br />
Thailand ($4.3 billion), and<br />
South Korea ($3.8 billion).<br />
<strong>Table</strong> 2‐1 summarizes the <strong>Port</strong>’s top container imports and exports.<br />
<strong>Table</strong> 2-1. Top Container Imports and Exports<br />
Top Container Imports<br />
Furniture<br />
Apparel<br />
Electronic products<br />
Toys<br />
Computer equipment<br />
Source: <strong>Port</strong> <strong>of</strong> <strong>Los</strong> <strong>Angeles</strong> 2004b.<br />
Top Container Exports<br />
Wastepaper<br />
Synthetic resins<br />
Fabric, including raw cotton<br />
Animal feed<br />
Scrap metal<br />
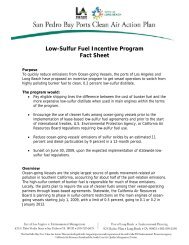
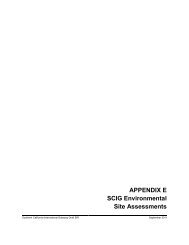
Cargo coming in through the <strong>Port</strong> is conveyed to both regional and national markets.<br />
Roughly 50 percent <strong>of</strong> incoming cargo is destined for the regional market, shown in<br />
Figure 2‐1 as the area within 550 miles <strong>of</strong> the <strong>Port</strong> (Mercer Management Consulting<br />
2001). <strong>The</strong> remaining 50 percent <strong>of</strong> cargo is destined for the national market and travels<br />
to such cities as Chicago, Atlanta, St. Louis, Memphis, New Orleans, and New York.<br />
While the cargo’s destination is always known, the method <strong>of</strong> transport depends on a<br />
complex decision‐making process that assesses a number <strong>of</strong> factors.<br />
How Cargo Moves<br />
A single medium‐sized container ship may unload 5,000 to 6,000 TEUs, while a new,<br />
larger ship can bring in as much as 8,100 TEUs. <strong>The</strong>se containers are then delivered<br />
outside the <strong>Port</strong> boundaries by various combinations <strong>of</strong> truck or rail transit to their final<br />
<strong>Port</strong> <strong>of</strong> <strong>Los</strong> <strong>Angeles</strong> July 2004<br />
Review Draft Page 7
<strong>Port</strong>wide Rail Synopsis<br />
Chapter 2. Cargo, Facilities, and Container Movement<br />
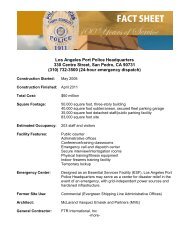
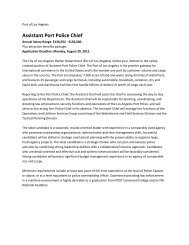
destination. Figure 2‐2 shows the percent <strong>of</strong> the <strong>Port</strong>’s 2003 TEUs by method <strong>of</strong><br />
shipment.<br />
Truck Movement<br />
Direct Truck Hauling. <strong>The</strong> container is loaded onto a chassis hauled by a street‐legal<br />
tractor at the terminal and then transported on roadways to its destination. An average<br />
truck carries one 40‐foot container (2 TEUs). Trucks haul all cargo destined for local<br />
areas within southern California, as well as most regional cargo. Long‐haul trucks<br />
convey less than 1 percent <strong>of</strong> total cargo to national markets.<br />
Transloaded Truck Hauling. <strong>The</strong> container is loaded onto a chassis hauled by a streetlegal<br />
tractor at the terminal and then transported on roadways to an intermediary<br />
warehouse, where the container is unloaded and the cargo is repacked into new<br />
container(s). <strong>The</strong> newly packed container is then trucked to its final destination.<br />
Rail Movement<br />
Unit Train:<br />
Coupled<br />
railcars<br />
varying in<br />
length<br />
between 115<br />
and 140<br />
railcars.<br />
On-Dock Rail. Containers are loaded directly onto trains at an on‐dock loading facility<br />
without traveling on public roads. Railcars are then coupled with other cars traveling to<br />
the same destination; the coupled railcars are called a unit train. Unit trains vary in<br />
length between 115 and 140 railcars, with each railcar carrying two stacked 40‐foot<br />
containers (or equivalent 20‐foot containers). With an industry‐average 90‐percent<br />
utilization rate, unit trains can be up to 8,000 feet in length and carry 414 to 504 TEUs <strong>of</strong><br />
cargo. Longer trains are not currently used due to limits in railcar coupler strength,<br />
except when respositioning empty railcars along routes with 10,000‐foot sidings<br />
(Leue pers. comm.). All trains traveling out <strong>of</strong> the <strong>Port</strong> are typically full, but an average<br />
<strong>of</strong> 50 percent <strong>of</strong> containers on inbound trains are empty, due to the U.S. international<br />
trade imbalance (the United States imports more than it exports).<br />
Near-Dock/Off-Dock Rail. Containers are loaded onto trucks at the terminal and then<br />
hauled on public roads to a rail facility located near dock (0 to 8 miles) or <strong>of</strong>f dock (8 to<br />
22 miles), where they are then loaded onto trains for shipping throughout the country.<br />
Similar to trains used for on‐dock rail, trains used for near‐dock or <strong>of</strong>f‐dock rail typically<br />
carry 414 to 504 TEUs per haul. All trains traveling out <strong>of</strong> the near‐dock and <strong>of</strong>f‐dock<br />
facilities have full import containers, but an average <strong>of</strong> 50 percent <strong>of</strong> railcars on inbound<br />
trains consist <strong>of</strong> empty containers from inland locations.<br />
Although on‐dock rail provides benefits <strong>of</strong> improving logistics, traffic congestion, and air<br />
quality, the decision process to select on‐dock versus <strong>of</strong>f‐dock is complex, based on a<br />
number <strong>of</strong> critical factors. Terminal operators and shipping lines prefer to use on‐dock<br />
rail to the fullest extent possible; however, some intermodal cargo will continue to be<br />
handled <strong>of</strong>f dock, due mainly to the following critical issues (DiBernardo pers. comm.):<br />
<strong>Port</strong> <strong>of</strong> <strong>Los</strong> <strong>Angeles</strong> July 2004<br />
Review Draft Page 8
Seattle<br />
<strong>Port</strong>land<br />
950 Miles<br />
Boise<br />
550 Miles<br />
Sacramento<br />
Reno<br />
Salt Lake City<br />
Cheyenne<br />
San Francisco<br />
350 Miles<br />
Denver<br />
Fresno<br />
Las Vegas<br />
<strong>Port</strong> <strong>of</strong> <strong>Los</strong> <strong>Angeles</strong><br />
San Diego<br />
Phoenix<br />
Albuquerque<br />
Legend<br />
Delivery by Truck<br />
Traditional Cost Breakeven Zone for Truck versus Rail<br />
Potential Intermodal Market, Currently Truck<br />
El Paso<br />
04320.04-001<br />
Delivery by Railroad, (Mercer,1998)<br />
Source: <strong>Port</strong> <strong>of</strong> <strong>Los</strong> <strong>Angeles</strong> 2003b<br />
0<br />
100<br />
200 300 400<br />
Miles<br />
Figure 2-1<br />
Container Delivery Methods,<br />
by Distance from <strong>Port</strong> <strong>of</strong> <strong>Los</strong> <strong>Angeles</strong>
REGIONAL SHIPMENT<br />
32%<br />
Local<br />
Transit<br />
18%<br />
Transloaded<br />
Truck<br />
San<br />
0%<br />
Shuttle<br />
Train<br />
IMPORT CARGO<br />
(approximately 75%<br />
<strong>of</strong> Total Cargo)<br />
Pedro<br />
Bay<br />
Marine<br />
Terminals<br />
16%<br />
NATIONAL SHIPMENT<br />
On-Dock<br />
Rail<br />
9%<br />
Near-Dock<br />
Rail<br />
14%<br />
Off-Dock<br />
Rail<br />
11%<br />
Transloaded<br />
Rail<br />
<strong>Port</strong>wide Rail Synopsis<br />
Chapter 2. Cargo, Facilities, and Container Movement<br />
■ insufficient amount <strong>of</strong> cargo to create a full train, 1<br />
■<br />
■<br />
labor availability, and<br />
train/ship schedule conflicts (e.g., earlier departure and arrival times for <strong>of</strong>f‐dock<br />
rail).<br />
<strong>The</strong>se issues will be largely resolved in future years due to increased cargo volumes, new<br />
terminal developments, and improved work rules and practices. In addition, lack <strong>of</strong> <strong>of</strong>fdock<br />
capacity will force the necessity <strong>of</strong> using on‐dock ICTFs. (<strong>Port</strong> <strong>of</strong> <strong>Los</strong> <strong>Angeles</strong><br />
2003b).<br />
Transloaded Rail. Containers are loaded onto trucks at the dock and then hauled to a<br />
redistribution center located 8 to 60 miles from the <strong>Port</strong>. Each truck typically carries one<br />
40‐foot container (2 TEUs). At the redistribution center, containers are typically<br />
unloaded and the cargo is repackaged into new containers, then trucked to an <strong>of</strong>f‐dock<br />
rail yard where containers are loaded onto trains for transcontinental shipment.<br />
Shuttle Train. <strong>The</strong> concept <strong>of</strong> shuttle trains is to use a combination <strong>of</strong> trucks and trains<br />
to move containers within the 550‐mile regional market area that is currently served<br />
exclusively by trucks. <strong>The</strong> <strong>Port</strong> would be connected by short‐haul shuttle train service to<br />
an intermodal “inland port” facility. Trucks would then move containers to and from<br />
final destinations, thereby avoiding the congested freeways leading to the <strong>Port</strong>. A shuttle<br />
train system could reduce traffic congestion, use the <strong>Port</strong> backland storage areas more<br />
efficiently, and reduce the need for container storage areas in Wilmington (Leue pers.<br />
comm.).<br />
Truck Versus Rail Movement<br />
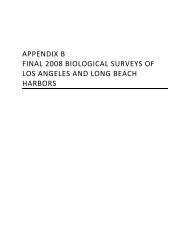
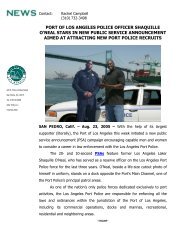
Transporting containers using on‐dock ICTFs reduces truck traffic. A ship carrying 5,000<br />
TEUs <strong>of</strong> cargo generates five trains worth <strong>of</strong> intermodal cargo. Each train is equivalent to<br />
700 truck trips; therefore, if all <strong>of</strong> the cargo on the ship is transported using on‐dock rail,<br />
3,500 trucks would be removed from the highways (Figure 2‐3).<br />
Conclusion<br />
<strong>The</strong> <strong>Port</strong> <strong>of</strong> <strong>Los</strong> <strong>Angeles</strong> has reinvented itself over time in response to world market<br />
changes and new technologies (www.laporthistory.org). Over the next 5 to 20 years, the<br />
<strong>Port</strong> will continue to adapt to the anticipated growth in containerized cargo. <strong>The</strong> <strong>Port</strong><br />
has made major investments in rebuilding terminals to include on‐dock ICTF’s, and<br />
future investments in rail are planned to help meet the challenges <strong>of</strong> this growth.<br />
1 For instance, the long‐haul railroads prefer to “build” trains with at least 90 railcars (180 containers). If a terminal<br />
does not have enough containers to build the train, the containers must be held on‐dock until the minimum number<br />
is reached. Instead <strong>of</strong> waiting, the shipping line may chose to truck the containers to an <strong>of</strong>f‐dock rail yard so that it<br />
can go out on an earlier train.<br />
<strong>Port</strong> <strong>of</strong> <strong>Los</strong> <strong>Angeles</strong> July 2004<br />
Review Draft Page 9
1 Train<br />
~ 700 Truck Trips (each symbol represents 10 trips)<br />
1 Ship ~ 5 Train Loads <strong>of</strong> Cargo<br />
04320.04-001<br />
Data Source: <strong>Port</strong> <strong>of</strong> <strong>Los</strong> <strong>Angeles</strong> 2003b<br />
~ 3,500 Truck Trips (each symbol represents 10 trips)<br />
Figure 2-3<br />
Trip Equivalents for <strong>Port</strong> <strong>of</strong> <strong>Los</strong> <strong>Angeles</strong><br />
Freight Cargo Models
Chapter 3. Existing Transportation Facilities<br />
As described in Chapter 2, both rail and roadway facilities are utilized separately and<br />
together to move cargo into and out <strong>of</strong> the <strong>Port</strong>. This chapter describes the rail facilities<br />
that currently serve the <strong>Port</strong>, along with roadways that are key to intermodal transport <strong>of</strong><br />
cargo.<br />
Railroad Facilities<br />
<strong>The</strong> railroad infrastructure includes the following major components:<br />
■<br />
■<br />
■<br />
Railroad lines,<br />
On‐dock/near‐dock ICTFs, and<br />
Off‐dock rail yards.<br />
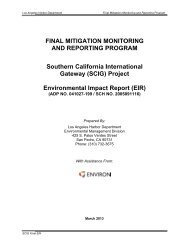
Figure 3‐1 is a regional view <strong>of</strong> the major railroad lines and rail yards that serve the <strong>Port</strong>.<br />
Figure 3‐2 shows a more detailed view <strong>of</strong> major railroad facilities, which are described in<br />
the following sections.<br />
Railroad Lines<br />
Union Pacific Railroad and Burlington Northern & Santa Fe Railway Lines<br />
<strong>The</strong> <strong>Port</strong> is served by two major railroads, BNSF and UP, whose networks cover the<br />
western two‐thirds <strong>of</strong> the United States. <strong>The</strong>se two railroads combined move more<br />
intermodal cargo than any other rail system in the world.<br />
Alameda<br />
Corridor:<br />
A 20-mile rail<br />
expressway<br />
that runs from<br />
the <strong>Port</strong>s <strong>of</strong><br />
<strong>Los</strong> <strong>Angeles</strong><br />
and Long<br />
Beach to<br />
downtown <strong>Los</strong><br />
<strong>Angeles</strong>.<br />
Prior to the opening <strong>of</strong> the Alameda Corridor (described below) in 2002, both UP and<br />
BNSF railroads used less direct routes, shown as dashed lines on Figure 3‐1. <strong>The</strong> former<br />
BNSF line is used for local industry access and is precluded from any intermodal<br />
containers. <strong>The</strong> former UP line is used for local industry access, but also serves as an<br />
emergency backup to the Alameda Corridor. <strong>The</strong> UP and BNSF main lines shown on<br />
Figure 3‐1 are also referred to as the “Alameda Corridor East,” where planning is<br />
underway to create grade separations on the east‐west rail lines similar to the Alameda<br />
Corridor.<br />
From main rail yards east <strong>of</strong> downtown <strong>Los</strong> <strong>Angeles</strong>, both UP and BNSF railroads serve<br />
transcontinental destinations to the north and to the east. To the north, UP and BNSF<br />
lines run to the Canadian border, and through the states <strong>of</strong> Oregon, Washington, and<br />
Idaho. To the east, both UP and BNSF have several railroad lines that run as far as<br />
Chicago, Illinois; St. Louis, Missouri; Memphis, Tennessee; and New Orleans, Louisiana.<br />
To destinations east <strong>of</strong> these cities, such as New York City and Miami, Florida, shippers<br />
must switch to tracks owned by other lines, such as CSX and Norfolk Southern.<br />
<strong>Port</strong> <strong>of</strong> <strong>Los</strong> <strong>Angeles</strong> July 2004<br />
Review Draft Page 10
<strong>Port</strong>wide Rail Synopsis<br />
Chapter 3. Existing Transportation Facilities<br />
Alameda Corridor<br />
<strong>The</strong> Alameda Corridor, shown in Figure 3‐3, is a 20‐mile rail expressway that runs from<br />
the <strong>Port</strong>s <strong>of</strong> <strong>Los</strong> <strong>Angeles</strong> and Long Beach to downtown <strong>Los</strong> <strong>Angeles</strong>, primarily along and<br />
adjacent to Alameda Street. Half <strong>of</strong> the three‐track corridor was built below ground,<br />
eliminating 200 at‐grade railroad crossings and providing benefits to both rail and<br />
vehicle movement. <strong>The</strong> Alameda Corridor connects the ports to the transcontinental rail<br />
yards east <strong>of</strong> downtown <strong>Los</strong> <strong>Angeles</strong> (Washington Boulevard/Interstate 710 [I‐710]),<br />
creating a faster, more efficient way to move cargo throughout the United States and to<br />
overseas markets. <strong>The</strong> grade separation allows trains to travel more quickly, increasing<br />
to approximately 30 to 40 miles per hour (mph) from the previous average speeds <strong>of</strong> 5 to<br />
20 mph. <strong>The</strong> Alameda Corridor cut transit times for one‐way train trips to 45 minutes,<br />
less than half <strong>of</strong> the 2 to 4 hours these trips previously took. This has reduced operating<br />
rail costs by approximately $1,000 per train due to time savings and crew reductions.<br />
<strong>The</strong> Alameda Corridor handles an average <strong>of</strong> 35 train movements per day and has a<br />
capacity <strong>of</strong> 150 train movements per day. <strong>The</strong> train volume forecast increases to 128 port<br />
trains in 2020. <strong>The</strong> 150‐train‐per‐day capacity was built to accommodate the projected<br />
increases in containerized cargo in future years. Although the Alameda Corridor is a<br />
monumental public works achievement, it is only one link in the logistics chain that<br />
connects the <strong>Port</strong> to national markets. Additional improvements, as described in<br />
Chapter 8 and the “Alameda Corridor East” project, as well as other operational factors<br />
described in Chapter 2 must be addressed to increase utilization <strong>of</strong> the Alameda<br />
Corridor.<br />
<strong>The</strong> corridor is managed by the Alameda Corridor Transportation Authority (ACTA),<br />
whose governing board is made up <strong>of</strong> representatives from the cities and <strong>Port</strong>s <strong>of</strong> <strong>Los</strong><br />
<strong>Angeles</strong> and Long Beach and the <strong>Los</strong> <strong>Angeles</strong> County Metropolitan Transportation<br />
Authority (MTA). <strong>The</strong> Board <strong>of</strong> Harbor Commissioners and <strong>Port</strong> staff are committed to<br />
work cooperatively with ACTA to increase the capability to move containers by rail.<br />
Train move:<br />
Any move<br />
made by an<br />
empty or full<br />
train into or<br />
out <strong>of</strong> a<br />
terminal or<br />
rail yard.<br />
Pacific Harbor Line<br />
PHL is the third‐party rail operator currently serving both ports. PHL provides the<br />
following services:<br />
■<br />
■<br />
■<br />
■<br />
dispatches all train moves on port rail facilities,<br />
spots and pulls all carload traffic within the <strong>Port</strong>s <strong>of</strong> <strong>Los</strong> <strong>Angeles</strong> and Long Beach,<br />
switches unit trains for railroads on request,<br />
switches intermodal cars within terminals on request, and<br />
■<br />
performs track maintenance <strong>of</strong> common port rail facilities and some terminals.<br />
PHL currently operates with a base at Water Street Yard on Pier A in the <strong>Port</strong>. This base<br />
serves as a classification yard, crew on‐duty point, and locomotive service facility. <strong>The</strong><br />
<strong>Los</strong> <strong>Angeles</strong> Harbor Department (LAHD) plans to relocate PHL in the near future to a<br />
yet to be determined location. PHL operates five switching jobs (crews) every weekday:<br />
<strong>Port</strong> <strong>of</strong> <strong>Los</strong> <strong>Angeles</strong> July 2004<br />
Review Draft Page 11
5<br />
10<br />
101<br />
110<br />
Downtown<br />
<strong>Los</strong> <strong>Angeles</strong><br />
Commerce<br />
710<br />
UP East LA Yard<br />
10<br />
60<br />
405<br />
Vernon<br />
BNSF Hobart Yard<br />
5<br />
Alameda Corridor<br />
105<br />
110<br />
Compton<br />
105<br />
91<br />
Carson<br />
710<br />
UP ICTF<br />
Wilmington<br />
605<br />
103<br />
405<br />
San Pedro<br />
47<br />
Long Beach<br />
04320.04-001<br />
Legend<br />
<strong>Port</strong> <strong>of</strong><br />
<strong>Los</strong> <strong>Angeles</strong><br />
<strong>Port</strong> <strong>of</strong><br />
Long Beach<br />
Union Pacific Railroad (UP) Main Line<br />
Former Union Pacific Railroad (UP), Industry Access<br />
Burlington Northern-Santa Fe Railroad (BNSF) Main Line<br />
Former Burlington Northern-Santa Fe Railroad (BNSF), Industry Access<br />
Pacific Harbor Line / <strong>Port</strong><br />
Alameda Corridor (Main Line)<br />
0<br />
Major Container Rail Yards<br />
San Pedro Bay<br />
Miles<br />
5<br />
Figure 3-1<br />
Major Rail Lines and Facilities<br />
10<br />
Source: <strong>Port</strong> <strong>of</strong> <strong>Los</strong> <strong>Angeles</strong> 2003b
Ave.<br />
Legend<br />
RAIL FACILITIES<br />
Existing Rail<br />
Alameda Corridor<br />
ICTF On Dock ICTF (<strong>Port</strong> <strong>of</strong> LA)<br />
ICTF Near Dock ICTF<br />
YARD Non-ICTF Rail Yards<br />
223rd St.<br />
405<br />
Carson St.<br />
UP<br />
DOLORES<br />
YARD<br />
FORMER UNION PACIFIC – INDUSTRY ACCESS<br />
CITIES<br />
<strong>Los</strong> <strong>Angeles</strong><br />
Long Beach<br />
Carson<br />
<strong>Los</strong> <strong>Angeles</strong> County<br />
Sepulveda Blvd.<br />
Wilmington Ave.<br />
ICTF<br />
SUPPORT<br />
YARD<br />
UP ICTF<br />
Santa Fe Ave.<br />
710<br />
Wardlow Rd.<br />
Willow St.<br />
Gaffey St.<br />
Westmont Dr.<br />
Channel St.<br />
1st St.<br />
6th St.<br />
1<br />
FORMER BURLINGTON NORTHERN SANTA FE – INDUSTRY A CESS<br />
Figueroa St.<br />
110<br />
YANG<br />
MING<br />
N. Front St.<br />
WEST<br />
BASIN<br />
ICTF<br />
Lomita Blvd.<br />
Pacific Coast Hwy.<br />
Wilminton Blvd.<br />
Anaheim St.<br />
Harry Bridges Blvd.<br />
TRAPAC<br />
West<br />
Basin<br />
Terminal Way<br />
Fries St.<br />
Ferry<br />
St<br />
Avalon Blvd.<br />
WILMINGTON<br />
Slip 1<br />
Vincent<br />
TERMINAL<br />
Thomas<br />
ISLAND ICTF<br />
Bridge<br />
Main Channel<br />
PIER A<br />
YARD<br />
EVERGREEN<br />
Slip 5<br />
YUSEN<br />
East Main Channel<br />
LAXT<br />
East<br />
Basin<br />
PIER 300<br />
ICTF<br />
BNSF<br />
WATSON<br />
YARD<br />
N. Henry<br />
Ford Ave.<br />
Alameda St.<br />
N. Henry Ford Ave.<br />
TRANSFER YARD<br />
Badger<br />
Bridge<br />
47<br />
UP MEAD<br />
YARD<br />
47 103<br />
Cerritos Channel<br />
Commodore<br />
Heim Bridge<br />
PIER S<br />
PIER T<br />
Dominguez Channel<br />
PIER A<br />
Ocean Blvd.<br />
Gerald<br />
Desmond<br />
Bridge<br />
West<br />
Basin<br />
PIER B<br />
MANUEL<br />
YARD<br />
Channel 2<br />
Back Channel<br />
Channel 3<br />
PIER B<br />
RAIL YARD<br />
PIER D<br />
PIER E<br />
Slip 3<br />
East Basin<br />
<strong>Los</strong> <strong>Angeles</strong> River<br />
PIER G<br />
Southeast Basin<br />
PIER J<br />
1<br />
SAN<br />
PEDRO<br />
Gaffey St.<br />
Pacific Ave.<br />
Harbor Blvd.<br />
Seaside<br />
APL<br />
MAERSK<br />
PIER 400<br />
ICTF<br />
PIER 400<br />
San Pedro Bay<br />
04320.04-001 7/7/04<br />
West Channel<br />
Minor St.<br />
East Channel<br />
Middle Breakwater<br />
0 2,000 4,000<br />
Feet<br />
GIS Data Source: <strong>Port</strong> <strong>of</strong> <strong>Los</strong> <strong>Angeles</strong><br />
Figure 3-2<br />
Existing Rail Facilities
Figure 3-3. Alameda Corridor
<strong>Port</strong>wide Rail Synopsis<br />
Chapter 3. Existing Transportation Facilities<br />
(1) Pier A to San Pedro/Wilmington,<br />
(2) Pier A to Manuel,<br />
(3) Pier A to Terminal Island (TI) to Toyota to LB Accounts (Baker, GP Gypsum, and<br />
National Gypsum),<br />
(4) BNSF Interchange at Watson Yard, and<br />
(5) UP Interchange at Dolores Yard.<br />
On weekends, switching job (3) and sometimes job (2) are dropped from the weekday<br />
list, resulting in three or four switching jobs per weekend day.<br />
Carload switching totals 32,000 carloads annually, not including empties; 85 percent <strong>of</strong><br />
the carload business is with LAHD. Unit train switching typically involves 10<br />
intermodal switch jobs per day on a fairly regular schedule, but at the discretion <strong>of</strong> the<br />
railroads. <strong>The</strong> weekly switching includes 50 starts split nearly evenly between UP and<br />
BNSF. UP trains include those to American President Line (APL), Evergreen, and<br />
International Transportation Service (ITS). BNSF trains include those to Maersk, Pacific<br />
Container Terminal (PCT), Yusen Terminal Incorporated (YTI), Yang Ming Lines (YML),<br />
and ITS. PHL also switches trains to Toyota’s Edison Yard.<br />
On-dock ICTFs<br />
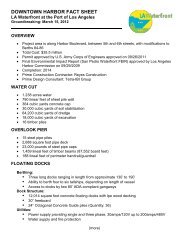
<strong>The</strong> <strong>Port</strong> currently is served by four ICTFs, as shown in Figure 3‐4 and described as<br />
follows.<br />
■<br />
■<br />
■<br />
■<br />
West Basin ICTF (WBICTF)—This on‐dock ICTF is currently operated by Marine<br />
Terminal Corporation, and receives rail service from BNSF.<br />
Terminal Island Container Transfer Facility (TICTF)—This on‐dock ICTF is currently<br />
operated in two halves divided bilaterally. One half is operated by Marine Terminal<br />
Corporation for Evergreen, with rail service by UP. <strong>The</strong> other half is operated by<br />
Stevedoring Services <strong>of</strong> America (SSA) for Nippon Yusen Kaisha (NYK) and its<br />
alliance members, and receives rail service from BNSF.<br />
Pier 300—<strong>The</strong> yard is currently operated by Eagle Marine Service for APL and its<br />
alliance members, and receives rail service from UP.<br />
Pier 400 ICTF—This is the newest on‐dock ICTF at the <strong>Port</strong>. <strong>The</strong> yard is currently<br />
operated by APM Terminals (Maersk‐Sealand), and receives rail service from BNSF.<br />
<strong>Port</strong> <strong>of</strong> <strong>Los</strong> <strong>Angeles</strong> July 2004<br />
Review Draft Page 12
<strong>Port</strong>wide Rail Synopsis<br />
Chapter 3. Existing Transportation Facilities<br />
WBICTF<br />
TICTF<br />
Pier 300<br />
Pier 400<br />
Figure 3-4. On-dock ICTFs at <strong>Port</strong> <strong>of</strong> <strong>Los</strong> <strong>Angeles</strong><br />
<strong>Port</strong> <strong>of</strong> <strong>Los</strong> <strong>Angeles</strong> July 2004<br />
Review Draft Page 13
<strong>Port</strong>wide Rail Synopsis<br />
Chapter 3. Existing Transportation Facilities<br />
Off-dock and Near-dock Rail Yards<br />
<strong>The</strong> locations <strong>of</strong> major <strong>of</strong>f‐dock and near‐dock facilities are shown in Figures 3‐1 and 3‐2,<br />
respectively. Seven major <strong>of</strong>f‐dock rail yards serve the <strong>Port</strong>. <strong>The</strong>ir existing<br />
characteristics are summarized in <strong>Table</strong> 3‐1.<br />
<strong>Table</strong> 3-1. Off-dock Rail Yards<br />
Facility<br />
Railroad<br />
Track Length (feet)<br />
Parking Spots<br />
Working track<br />
Storage track<br />
Hobart BNSF 42,698 87,275 4,858<br />
Parking<br />
Spot:<br />
Staging area<br />
for trucks.<br />
East LA UP 30,800 71,000 2,400<br />
UP-ICTF UP 24,100 50,000 4,000<br />
<strong>Los</strong> <strong>Angeles</strong><br />
Transportation Center<br />
UP 30,800 71,000 2,400<br />
City <strong>of</strong> Industry UP 7,200 20,000 1,500<br />
Commerce<br />
BNSF<br />
San Bernardino BNSF 22,766 22,476 2,005<br />
Source: <strong>Port</strong> <strong>of</strong> <strong>Los</strong> <strong>Angeles</strong> 2003b<br />
Roadways<br />
Figure 3‐5 illustrates the major freeways that provide regional access to the <strong>Port</strong>, as well<br />
as the local roadway system in the area. <strong>The</strong> highlighted roads are those primarily used<br />
to move containers from the <strong>Port</strong>s <strong>of</strong> <strong>Los</strong> <strong>Angeles</strong> and Long Beach to the near‐dock UP<br />
ICTF rail yard north <strong>of</strong> Willow Street. Two freeways provide the major regional access to<br />
the <strong>Port</strong>:<br />
■<br />
Long Beach Freeway and Harbor Freeway. I‐710 and Interstate 110 (I‐110) both<br />
provide regional access to the <strong>Port</strong>s <strong>of</strong> <strong>Los</strong> <strong>Angeles</strong> and Long Beach. Both freeways<br />
are north‐south highways that extend from the port area to downtown <strong>Los</strong> <strong>Angeles</strong>.<br />
<strong>The</strong>y each have six lanes in the vicinity <strong>of</strong> the harbor and widen to eight lanes to the<br />
north.<br />
Both I‐710 and I‐110 are part <strong>of</strong> the Eisenhower Interstate System <strong>of</strong> the National<br />
Highway System, while Seaside Avenue/Ocean Boulevard, Alameda Street, Harry<br />
Bridges Boulevard, and State Routes (SR)‐47/103 are classified as “other National<br />
Highway System routes.” <strong>The</strong> portion <strong>of</strong> Sepulveda Boulevard from SR‐103 to<br />
Alameda Street is classified as an approved intermodal connector on the National<br />
Highway System.<br />
Both interstates provide regional freeway connections to the following freeways: the<br />
San Diego Freeway (I‐405), Riverside Freeway (SR‐91), Century Freeway (I‐105),<br />
Santa Monica Freeway (I‐10), and the Santa Ana Freeway (I‐5).<br />
<strong>Port</strong> <strong>of</strong> <strong>Los</strong> <strong>Angeles</strong> July 2004<br />
Review Draft Page 14
<strong>Port</strong>wide Rail Synopsis<br />
Chapter 3. Existing Transportation Facilities<br />
■<br />
Terminal Island Freeway (SR-47/SR-103). <strong>The</strong> Terminal Island Freeway runs<br />
north‐south and connects Terminal Island with the cities <strong>of</strong> Wilmington, Carson, and<br />
western Long Beach. It also provides direct access to the ICTF located north <strong>of</strong><br />
Sepulveda Boulevard in the City <strong>of</strong> Carson. <strong>The</strong> Terminal Island Freeway is<br />
designated SR‐47 between Ocean Boulevard and the Henry Ford Avenue ramps.<br />
North <strong>of</strong> the Henry Ford Avenue ramps, it is designated SR‐103.<br />
In addition to accommodating trucks that carry local and long‐haul cargo within and<br />
beyond the region, the roadway system is utilized by trucks that carry intermodal cargo<br />
that is transferred at near‐dock and <strong>of</strong>f‐dock facilities, as well as transloaded rail. Cargo<br />
trucks share the roadway system with regional general purpose traffic, and the travel<br />
time and reliability <strong>of</strong> these trucks can be significantly impacted if the roadways are<br />
operating under congested conditions. <strong>The</strong> local and regional roadway system is<br />
described and evaluated in detail in the Baseline Transportation Study (<strong>Port</strong> <strong>of</strong> <strong>Los</strong><br />
<strong>Angeles</strong> 2003c). Conceptual recommended roadway improvements provided in the<br />
Baseline Transportation Study, as well as some discussion <strong>of</strong> rail versus roadway issues,<br />
are included in Chapter 7 <strong>of</strong> this report.<br />
<strong>Port</strong> <strong>of</strong> <strong>Los</strong> <strong>Angeles</strong> July 2004<br />
Review Draft Page 15
Legend<br />
ROADWAYS<br />
CITIES<br />
Highway<br />
Key Arterial Roadway<br />
Other Roadway<br />
Primary Road to/from<br />
Near Dock<br />
Bridge<br />
<strong>Los</strong> <strong>Angeles</strong><br />
RAIL FACILITIES<br />
Existing Rail<br />
Alameda Corridor<br />
ICTF On Dock ICTF (<strong>Port</strong> <strong>of</strong> LA)<br />
ICTF Near Dock ICTF<br />
YARD<br />
Non-ICTF 223rd St. Rail Yards<br />
Carson St.<br />
UP<br />
DOLORES<br />
YARD<br />
Wilmington Ave.<br />
UNION PACIFIC<br />
FORMER UNION PACIFIC – INDUSTRY ACCESS<br />
405<br />
Wardlow Rd.<br />
Long Beach<br />
Carson<br />
<strong>Los</strong> <strong>Angeles</strong> County<br />
Sepulveda Blvd.<br />
ICTF<br />
SUPPORT<br />
YARD<br />
UP ICTF<br />
Santa Fe Ave.<br />
710<br />
Willow St.<br />
Gaffey St.<br />
Westmont Dr.<br />
Channel St.<br />
1st St.<br />
6th St.<br />
1<br />
FORMER BURLINGTON NORTHERN SANTA FE – INDUSTRY A CESS<br />
Figueroa St.<br />
110<br />
YANG<br />
MING<br />
N. Front St.<br />
WEST<br />
BASIN<br />
ICTF<br />
Lomita Blvd.<br />
Pacific Coast Hwy.<br />
Wilminton Blvd.<br />
Anaheim St.<br />
Harry Bridges Blvd.<br />
TRAPAC<br />
West<br />
Basin<br />
Terminal Way<br />
Fries St.<br />
Ferry<br />
St<br />
Avalon Blvd.<br />
WILMINGTON<br />
Slip 1<br />
Vincent<br />
TERMINAL<br />
Thomas<br />
ISLAND ICTF<br />
Bridge<br />
Main Channel<br />
PIER A<br />
YARD<br />
EVERGREEN<br />
Slip 5<br />
YUSEN<br />
East Main Channel<br />
East<br />
Basin<br />
New Dock Street<br />
LAXT<br />
PIER 300<br />
ICTF<br />
BNSF<br />
WATSON<br />
YARD<br />
N. Henry<br />
Ford Ave.<br />
Alameda St.<br />
TRANSFER YARD<br />
47<br />
N. Henry Ford Ave.<br />
Badger<br />
Bridge<br />
UP MEAD<br />
YARD<br />
47 103<br />
Cerritos Channel<br />
Commodore<br />
Heim Bridge<br />
PIER S<br />
PIER T<br />
Dominguez Channel<br />
PIER A<br />
Ocean Blvd.<br />
Gerald<br />
Desmond<br />
Bridge<br />
West<br />
Basin<br />
MANUEL<br />
YARD<br />
PIER B<br />
Channel 2<br />
Back Channel<br />
Channel 3<br />
PIER B<br />
RAIL YARD<br />
PIER D<br />
PIER E<br />
Slip 3<br />
East Basin<br />
<strong>Los</strong> <strong>Angeles</strong> River<br />
PIER G<br />
Southeast Basin<br />
PIER J<br />
1<br />
SAN<br />
PEDRO<br />
Gaffey St.<br />
Pacific Ave.<br />
Harbor Blvd.<br />
Seaside<br />
Ave.<br />
APL<br />
MAERSK<br />
PIER 400<br />
ICTF<br />
PIER 400<br />
San Pedro Bay<br />
04320.04-001 7/7/04<br />
West Channel<br />
Minor St.<br />
East Channel<br />
Middle Breakwater<br />
0 2,000 4,000<br />
Feet<br />
Source: <strong>Port</strong> <strong>of</strong> <strong>Los</strong> <strong>Angeles</strong> 2003c<br />
Figure 3-5<br />
Key Roadways Used Between UP ICTF and <strong>Port</strong>s
Chapter 4. Cargo Forecasts<br />
Total<br />
Intermodal<br />
Demand:<br />
Total volume<br />
<strong>of</strong> cargo that<br />
is expected<br />
to be loaded<br />
onto trains at<br />
either on- or<br />
<strong>of</strong>f-dock rail<br />
yards.<br />
This chapter describes the forecasts that were developed for the <strong>Port</strong>s <strong>of</strong> <strong>Los</strong> <strong>Angeles</strong> and<br />
Long Beach through 2020. <strong>The</strong>se forecasts provide the basis for capacity analysis and<br />
improvement recommendations for the regional rail and roadway systems. Forecasts for<br />
both rail and roadway include the following components:<br />
■<br />
■<br />
Unconstrained Forecasts—Initial forecasts for the <strong>Port</strong>s <strong>of</strong> <strong>Los</strong> <strong>Angeles</strong> and Long<br />
Beach were based primarily upon market analysis, and were not constrained<br />
according to the physical capacity <strong>of</strong> port facilities.<br />
Capacity Considerations—For both the rail and roadway future analyses, the<br />
unconstrained forecasts provided the starting point for analysis, but capacity<br />
constraints were then considered. <strong>The</strong> roadway analysis and rail analysis employed<br />
separate methods to account for capacity in future conditions analysis. For rail<br />
analysis, additional rail yard capacity that would be required to meet the projected<br />
demand for intermodal cargo was identified.<br />
Unconstrained Forecasts<br />
<strong>The</strong> Mercer Management Consulting Study (July 2001) evaluated the potential container<br />
throughput demand for the <strong>Port</strong>s <strong>of</strong> <strong>Los</strong> <strong>Angeles</strong> and Long Beach. This market‐based<br />
forecast was prepared by Mercer Management Consulting to project long‐term trends for<br />
various types <strong>of</strong> waterborne cargo, including containerized cargo. Mercer examined a<br />
wide range <strong>of</strong> market conditions, trade scenarios, demographics, trade barriers, and<br />
economic models for trading partners on a global basis. Although this forecast did<br />
examine general infrastructure and cargo handling capabilities <strong>of</strong> the <strong>Port</strong>s <strong>of</strong> <strong>Los</strong><br />
<strong>Angeles</strong> and Long Beach, it is primarily a demand‐based market forecast that projects the<br />
volume <strong>of</strong> cargo that could be handled at the ports provided the physical capacity to do<br />
so is unconstrained (<strong>Port</strong> <strong>of</strong> <strong>Los</strong> <strong>Angeles</strong> 2003c).<br />
Capacity Consideration for Truck Haul Forecasts<br />
Roadway analysis presented in the Transportation Baseline Report utilized a second<br />
source <strong>of</strong> information, the Capacity Analysis Report (JWD 2002). This report evaluated<br />
the physical capacity <strong>of</strong> the <strong>Port</strong>’s existing and planned container terminal expansion for<br />
2002, 2005, 2010, and 2025. Unlike the previous forecast approach, this report examined<br />
the physical throughput capacity <strong>of</strong> each terminal based on a detailed analysis <strong>of</strong><br />
berthing and backland operational criteria. <strong>The</strong> capacity scenarios developed for<br />
roadway analysis are described in more detail in Chapter 7 <strong>of</strong> this report.<br />
Capacity Consideration for Rail Forecasts<br />
Capacity analysis for intermodal rail began with unconstrained Mercer forecasts for 2005,<br />
2010, 2015, and 2020. <strong>The</strong> Mercer cargo forecast estimates that intermodal cargo will<br />
comprise approximately 50 percent <strong>of</strong> the cargo moved through each <strong>of</strong> the <strong>Port</strong>s <strong>of</strong> <strong>Los</strong><br />
<strong>Angeles</strong> and Long Beach. This is the total volume <strong>of</strong> cargo that is expected to be loaded<br />
onto trains at either on‐ or <strong>of</strong>f‐dock rail yards (Total Intermodal Demand). <strong>The</strong> forecast<br />
<strong>Port</strong> <strong>of</strong> <strong>Los</strong> <strong>Angeles</strong> July 2004<br />
Review Draft Page 16
<strong>Port</strong>wide Rail Synopsis<br />
Chapter 4. Cargo Forecasts<br />
Total Intermodal Demand in 2020 will be loaded onto trains at either on‐ or <strong>of</strong>f‐dock<br />
ICTFs. Approximately 8.8 million TEUs are projected to be moved through the <strong>Port</strong> in<br />
2020, which is about half <strong>of</strong> the rail volume forecast for the combined <strong>Port</strong>s <strong>of</strong> <strong>Los</strong><br />
<strong>Angeles</strong> and Long Beach.<br />
<strong>The</strong> analysis <strong>of</strong> on‐dock intermodal rail yards is central to the Rail Capacity Analysis.<br />
<strong>The</strong> demand and capacity for each <strong>of</strong> the <strong>Port</strong>’s rail yards will determine the cargo<br />
volumes that could be handled through on‐dock rail yards, which would avoid<br />
generation <strong>of</strong> truck traffic. <strong>The</strong> resulting on‐dock rail volumes were used to determine<br />
the train traffic that would need to be accommodated by the <strong>Port</strong> rail network and the<br />
Alameda Corridor, as described in the following chapter.<br />
Capacity Analysis <strong>of</strong> Rail Yards<br />
<strong>The</strong> maximum practical capacity (MPC) <strong>of</strong> on‐dock and near‐dock rail yards was<br />
analyzed to understand the relative volumes <strong>of</strong> trains that could be generated by the<br />
container terminals. In addition to analyzing capacity constraints <strong>of</strong> existing and future<br />
facilities, the Rail Capacity Analysis identified expansion projects for the ICTF facilities<br />
that would allow future ICTF capacity to adequately meet future demand.<br />
<strong>The</strong> capacity for each <strong>of</strong> the <strong>Port</strong>’s rail yards determines the cargo volumes that could be<br />
handled by rail. <strong>The</strong> resulting rail volumes were used to determine the train traffic that<br />
must be accommodated by the <strong>Port</strong> rail network and Alameda Corridor in order to meet<br />
future demand.<br />
ICTF Capacity<br />
Figure 4‐1 shows the locations <strong>of</strong> existing and proposed ICTFs that were considered in<br />
future conditions analysis.<br />
<strong>Port</strong> <strong>of</strong> <strong>Los</strong> <strong>Angeles</strong> July 2004<br />
Review Draft Page 17
<strong>Port</strong>wide Rail Synopsis<br />
Chapter 4. Cargo Forecasts<br />
Transfer Yard<br />
(Proposed<br />
storage tracks)<br />
WBICTF<br />
West Basin-East<br />
(Proposed)<br />
TICTF<br />
Pier 300<br />
Pier 400<br />
Figure 4-1. Existing and Proposed Future ICTFs at <strong>Port</strong> <strong>of</strong> <strong>Los</strong> <strong>Angeles</strong><br />
<strong>Port</strong> <strong>of</strong> <strong>Los</strong> <strong>Angeles</strong> July 2004<br />
Review Draft Page 18
<strong>Port</strong>wide Rail Synopsis<br />
Chapter 4. Cargo Forecasts<br />
Working<br />
Track:<br />
Track that is<br />
actively used<br />
in rail service<br />
to run trains.<br />
Following are the working track and storage track expansion projects proposed for the<br />
ICTFs in order to allow the capacity <strong>of</strong> the on‐dock facilities to adequately meet projected<br />
future demand. <strong>Table</strong> 4‐1 summarizes the projections between now and 2020. <strong>The</strong><br />
proposed expansion projects are described in the paragraphs that follow the table.<br />
<strong>Table</strong> 4-1. <strong>Port</strong> Summary <strong>of</strong> Rail Yard Capacities<br />
Facility<br />
Track Type<br />
DS-Units(a)<br />
Existing<br />
Total by<br />
2020<br />
Pier 300 Working 64 79<br />
Storage 104 104<br />
Pier 400 Working 96 140<br />
Storage 126 250<br />
TICTF Working 56 98<br />
Storage 136 136<br />
WBICTF (b) Working 27 63<br />
Storage 54 90<br />
West Basin-East (b) Working – 42<br />
Storage – 84<br />
Total Working Track 243 422<br />
Storage<br />
Track:<br />
Track on<br />
which trains<br />
are stored.<br />
Total Storage Track 422 664<br />
(a) DS-unit = a 5-unit articulated railcar ≈ 305 feet <strong>of</strong> track ≈ 20 TEUs.<br />
(b) Expansion <strong>of</strong> storage track enabled through proposed expansion <strong>of</strong> the Transfer Yard.<br />
Source: <strong>Port</strong> <strong>of</strong> <strong>Los</strong> <strong>Angeles</strong> 2003b.<br />
Doublestacked<br />
Car<br />
(DS-car):<br />
Articulated<br />
railcar<br />
(typically 5-<br />
unit) that<br />
carries<br />
containers<br />
stacked two<br />
high.<br />
Proposed New Facilities<br />
■<br />
■<br />
Transfer Yard. Adequate storage track is essential to the efficient operation <strong>of</strong><br />
intermodal rail yards. <strong>The</strong> WBICTF rail facilities were found to be constrained by a<br />
lack <strong>of</strong> storage track under the existing conditions. <strong>The</strong>refore, an effort was<br />
undertaken to develop adequate storage track facilities within the constraints <strong>of</strong> the<br />
WBICTF land uses and the needs <strong>of</strong> the marine terminal container yards. <strong>The</strong><br />
conclusion <strong>of</strong> this effort was that an expansion <strong>of</strong> the existing transfer yard between<br />
Alameda Street and the DAS Terminal would provide effective rail operation with<br />
significant benefits to WBICTF and West Basin‐East ICTF, as well as the other rail<br />
facilities in the vicinity.<br />
West Basin‐East. This is a proposed facility in the conceptual stages <strong>of</strong> development.<br />
<strong>The</strong> opening date could occur by 2005. <strong>The</strong> proposed on‐dock ICTF is<br />
conceptualized to have in its initial configuration 21 double‐stacked car (DS‐cars) <strong>of</strong><br />
working track and 21 DS‐cars <strong>of</strong> storage track. A planned expansion would add 63<br />
<strong>Port</strong> <strong>of</strong> <strong>Los</strong> <strong>Angeles</strong> July 2004<br />
Review Draft Page 19
<strong>Port</strong>wide Rail Synopsis<br />
Chapter 4. Cargo Forecasts<br />
DS‐cars to the storage track (provided at POLA Transfer Yard) by 2015, and 21 DScars<br />
to the working track by 2020.<br />
Proposed ICTF Expansion<br />
■<br />
West Basin‐West (WBICTF). Expansion planned by 2015 would add nine DS‐cars to<br />
the working tracks and nine DS‐cars to the storage track. An additional storage track<br />
expansion <strong>of</strong> 27 DS‐cars would be implemented by dedicating track in the expanded<br />
POLA Transfer Yard to the intermodal operations. A planned 2020 expansion would<br />
add 27 DS‐cars to the working track.<br />
■<br />
■<br />
■<br />
Terminal Island (TICTF). Expansion planned by 2010 would add 42 DS‐cars to the<br />
working track.<br />
Pier 300. Planned expansion by 2015 would add 15 DS‐cars to the working track.<br />
Pier 400. Expansion planned by 2015 would add 24 DS‐cars to the working track and<br />
109 DS‐cars to the storage track. Additional expansion by 2020 would add<br />
20 DS‐cars to the working tracks and 15 DS‐cars to the storage track.<br />
MPC<br />
Model:<br />
A tool that<br />
directly<br />
considers rail<br />
operations,<br />
including<br />
switching,<br />
loading and<br />
unloading<br />
trains, and<br />
departing<br />
trains.<br />
Maximum Practical Capacity Modeling <strong>of</strong> ICTF Facilities<br />
<strong>The</strong> intermodal rail yard throughput capacities at each <strong>of</strong> the on‐dock rail yards were<br />
calculated using the MPC Model. This throughput model is a tool that directly considers<br />
rail operations, including switching, loading and unloading trains, and departing trains.<br />
It considered the effects <strong>of</strong> storage tracks, arrival/departure tracks, and rail yard<br />
configuration (e.g., track lengths, stub‐end yard, and end‐to‐end storage). <strong>The</strong> model<br />
incorporated the effects <strong>of</strong> these indirect impacts based on studies <strong>of</strong> operating times in<br />
typical railroad operations.<br />
Summaries <strong>of</strong> the MPC Model results with the proposed expansions to the ICTFs and the<br />
POLA Transfer Yard are provided in <strong>Table</strong> 4‐2 (only <strong>Port</strong> facilities) and in <strong>Table</strong> 4‐3 (both<br />
<strong>Port</strong>s <strong>of</strong> <strong>Los</strong> <strong>Angeles</strong> and Long Beach facilities).<br />
<strong>Table</strong> 4-2. <strong>Port</strong> <strong>of</strong> <strong>Los</strong> <strong>Angeles</strong> Intermodal MPC Model Results<br />
Intermodal Volume Category<br />
Annual Intermodal Volumes (TEUs)<br />
2005 2010 2015 2020<br />
Total intermodal demand 3,413,500 4,912,250 6,586,000 8,814,750<br />
Maximum potential on-dock demand 2,224,675 3,683,461 5,617,071 7,525,623<br />
Maximum practical on-dock capacity 2,592,178 3,324,872 5,072,250 6,801,311<br />
Maximum practical on-dock throughput 2,180,171 3,109,878 4,747,830 6,715,137<br />
Maximum practical on-dock throughput<br />
(percent <strong>of</strong> total <strong>Port</strong> <strong>of</strong> <strong>Los</strong> <strong>Angeles</strong><br />
throughput)<br />
Source: <strong>Port</strong> <strong>of</strong> <strong>Los</strong> <strong>Angeles</strong> 2003b.<br />
32% 32% 36% 38%<br />
<strong>Port</strong> <strong>of</strong> <strong>Los</strong> <strong>Angeles</strong> July 2004<br />
Review Draft Page 20
<strong>Port</strong>wide Rail Synopsis<br />
Chapter 4. Cargo Forecasts<br />
<strong>Table</strong> 4-3. <strong>Port</strong>s <strong>of</strong> <strong>Los</strong> <strong>Angeles</strong> and Long Beach Intermodal MPC Model<br />
Results<br />
Intermodal Volume Category<br />
Annual Intermodal Volumes (TEUs)<br />
2005 2010 2015 2020<br />
Total intermodal demand 6,827,000 9,824,500 13,172,000 17,629,500<br />
Maximum potential on-dock demand 4,381,919 6,978,177 10,732,752 14,875,453<br />
Maximum practical on-dock capacity 4,152,463 5,604,520 9,438,352 12,942,860<br />
Maximum practical on-dock throughput 3,659,673 5,359,228 9,074,308 12,791,248<br />
Maximum practical on-dock throughput<br />
(% <strong>of</strong> total throughput, <strong>Port</strong>s <strong>of</strong> <strong>Los</strong><br />
<strong>Angeles</strong> and Long Beach combined)<br />
Source: <strong>Port</strong> <strong>of</strong> <strong>Los</strong> <strong>Angeles</strong> 2004c.<br />
27% 27% 34% 36%<br />
<strong>The</strong> expanded Transfer Yard condition was used for subsequent intermodal volume<br />
forecasts and resulting train traffic forecasts. This condition was prudent to apply to the<br />
train traffic forecasts so that the increased rail traffic generated by the improved West<br />
Basin intermodal rail yards would be considered when evaluating the ability <strong>of</strong> the <strong>Port</strong><br />
rail network to accommodate rail traffic.<br />
Off-dock Rail Capacity Versus Demand<br />
<strong>The</strong> existing (2002) capacity <strong>of</strong> <strong>of</strong>f‐dock facilities, which includes rail yards in downtown<br />
<strong>Los</strong> <strong>Angeles</strong> and further inland, is estimated at 5.8 million TEUs (<strong>Port</strong> <strong>of</strong> <strong>Los</strong> <strong>Angeles</strong><br />
2004c). This capacity is allocated between domestic cargo, transload cargo, and<br />
international cargo. <strong>The</strong> <strong>Port</strong>s <strong>of</strong> <strong>Los</strong> <strong>Angeles</strong> and Long Beach Market Study estimated<br />
future demand for <strong>of</strong>f‐dock rail yards under two growth scenarios. <strong>The</strong> “Low Transload<br />
Scenario” assumes that domestic and transload intermodal volumes grow 3 percent year.<br />
<strong>The</strong> “High Transload Scenario” assumes that domestic and transload intermodal<br />
volumes grow at approximately 6 percent per year, which would be a similar rate to<br />
international volumes. <strong>The</strong> analysis concluded that under the lower growth scenario, all<br />
<strong>of</strong>f‐dock capacity would be utilized by 2010. To accommodate the higher growth<br />
scenario, nearly twice the amount <strong>of</strong> <strong>of</strong>f‐dock capacity would be required. Thus, the<br />
study concludes that international intermodal cargo will need to be handled by on‐dock<br />
and near‐dock facilities, since the <strong>of</strong>f‐dock facilities will be fully utilized by transload and<br />
domestic cargo by 2010. (<strong>Port</strong> <strong>of</strong> <strong>Los</strong> <strong>Angeles</strong> 2004c.)<br />
Near-dock Rail Demand<br />
Current near‐dock capacity is provided at the UP ICTF, and is approximately 1.5 million<br />
TEUs. Analysis indicates that additional rail yard capacity would be required by 2010 to<br />
meet the projected demand for intermodal cargo. Analysis takes into account the<br />
proposed expansion <strong>of</strong> on‐dock rail yards. As described in the previous section,<br />
domestic and transload cargo operations are expected to fully utilize <strong>of</strong>f‐dock rail yards.<br />
Thus it is recommended that additional rail yard capacity be provided at near‐dock<br />
intermodal facilities to meet the additional projected future demand. (<strong>Port</strong> <strong>of</strong> <strong>Los</strong><br />
<strong>Angeles</strong> 2004c.)<br />
<strong>Port</strong> <strong>of</strong> <strong>Los</strong> <strong>Angeles</strong> July 2004<br />
Review Draft Page 21
<strong>Port</strong>wide Rail Synopsis<br />
Chapter 4. Cargo Forecasts<br />
It is recommended that near‐dock rail yard capacity be developed in the <strong>Port</strong> vicinity<br />
south <strong>of</strong> I‐405. This development could be in the form <strong>of</strong> a new rail yard or expansion <strong>of</strong><br />
the existing ICTF rail yard. Near‐dock facilities are preferred since they have the least<br />
impact on regional highway traffic. Near‐dock development would need to begin<br />
immediately to address community concerns and land use changes necessary to have a<br />
project opened for the 2010 forecast condition.<br />
On‐dock ICTF improvements, as described in this chapter, were conceptually planned as<br />
part <strong>of</strong> the Rail Capacity Analysis (<strong>Port</strong> <strong>of</strong> <strong>Los</strong> <strong>Angeles</strong> 2003b). Off‐dock and near‐dock<br />
improvements were beyond the scope <strong>of</strong> the study and only the forecast requirements for<br />
these facilities were provided, as described above.<br />
Intermodal Volume Forecasts<br />
<strong>Table</strong> 4‐4 summarizes the forecast for the combined <strong>Port</strong>s <strong>of</strong> <strong>Los</strong> <strong>Angeles</strong> and Long<br />
Beach. <strong>The</strong> table shows that additional near‐dock rail yard capacity would be required<br />
for the ports by 2010 to meet the projected demand for intermodal cargo. If the on‐dock<br />
capacity expansion were not implemented to the extent described in the Rail Capacity<br />
Analysis, near‐dock capacity additional to the capacity need shown in <strong>Table</strong> 4‐4 would<br />
be required to meet projected future intermodal cargo demand (<strong>Port</strong> <strong>of</strong> <strong>Los</strong> <strong>Angeles</strong><br />
2004c).<br />
<strong>Table</strong> 4-4. <strong>Port</strong>s <strong>of</strong> <strong>Los</strong> <strong>Angeles</strong> and Long Beach Intermodal Demand and Rail<br />
Yard Capacities<br />
Annual Throughput<br />
(millions TEU)<br />
Existing 2010 2015 2020<br />
Total intermodal demand 5.3 9.8 13.2 17.6<br />
International cargo demand 4.0 8.2 11.3 15.4<br />
On-dock rail yard capacity 1.6 5.4 9.1 12.8<br />
Near-dock (UP ICTF) capacity 1.5 1.5 1.5 1.5<br />
Off-dock capacity for international cargo 0.9 0.0 0.0 0.0<br />
Demand for additional near-dock (ICTF south) capacity 0.0 1.3 0.7 1.1<br />
Source: <strong>Port</strong> <strong>of</strong> <strong>Los</strong> <strong>Angeles</strong> 2004c.<br />
<strong>Port</strong> <strong>of</strong> <strong>Los</strong> <strong>Angeles</strong> July 2004<br />
Review Draft Page 22
Chapter 5. Railroad Mainline Simulation Model<br />
This chapter summarizes the methodology and results <strong>of</strong> the simulation <strong>of</strong> the trains in<br />
the rail network under projected future conditions.<br />
<strong>The</strong> existing and forecast conditions were simulated using a dynamic simulation model<br />
to determine the LOS provided to trains in the rail network system. <strong>The</strong> simulation<br />
model assisted in the identification <strong>of</strong> bottlenecks to train traffic so that these deficiencies<br />
can be corrected. <strong>The</strong> phased recommended improvements that are presented in<br />
Chapter 8 were developed based on the model results.<br />
<strong>The</strong> major components <strong>of</strong> the simulation modeling process can be summarized as<br />
follows:<br />
1. Existing <strong>Port</strong> rail operations (2000). Existing conditions within the <strong>Port</strong> were<br />
simulated during the period selected as the benchmark, which was October 2000.<br />
2. Future <strong>Port</strong> operations (2005, 2010, 2015, and 2020). Simulation cases were run<br />
for each forecast year (2005, 2010, 2015, and 2020). <strong>The</strong> mainline simulation model<br />
scenarios (Scenarios 1 through 4) were performed with rail network extents covering<br />
the entire <strong>Port</strong>s <strong>of</strong> <strong>Los</strong> <strong>Angeles</strong> and Long Beach area and onto Alameda Corridor as<br />
far as Sepulveda Boulevard. <strong>The</strong> ACTA scenarios (ACTA 1 through 5) include the<br />
Alameda Corridor and the <strong>Port</strong> rail network. <strong>The</strong>se cases tested the entire portrelated<br />
rail network connecting the <strong>Port</strong>s <strong>of</strong> <strong>Los</strong> <strong>Angeles</strong> and Long Beach with the UP<br />
and BNSF mainlines, and additionally include the East Yard and Alameda Corridor<br />
through Hobart Yard.<br />
Model Overview<br />
<strong>The</strong> Rail Traffic Controller (RTC) Model is a sophisticated computer program designed to<br />
simulate both freight and passenger rail operations in either a planning environment or<br />
an online control center. While simulating the movement <strong>of</strong> many trains interacting with<br />
one another throughout a network, RTC uses standard operating rules to resolve meet<br />
and pass conflicts between trains. RTC accumulates train delay by individual trains as<br />
well as train type.<br />
Overview <strong>of</strong> Simulation Approach<br />
Figure 5‐1 illustrates the overall approach employed for railroad simulation. <strong>The</strong> nine<br />
operational scenarios shown in the figure are four that have boundaries that include the<br />
immediate <strong>Port</strong> vicinity, and five with boundaries that include the Alameda Corridor.<br />
<strong>Port</strong> <strong>of</strong> <strong>Los</strong> <strong>Angeles</strong> July 2004<br />
Review Draft Page 23
<strong>Port</strong>wide Rail Synopsis<br />
Chapter 5. Railroad Mainline Simulation Model<br />
Four forecast years<br />
2020<br />
2015<br />
2010<br />
2005<br />
Cargo Forecasts<br />
Four forecast years<br />
2020<br />
2015<br />
2010<br />
2005<br />
Train Volume<br />
Forecasts<br />
Simulation<br />
Rail Network<br />
Train Volume<br />
FScorecas<br />
ScSc<br />
enario 4<br />
enario 3<br />
enario 2 ts<br />
Scenario 1<br />
Defined by links and nodes<br />
Nine infrastructure & operational scenarios<br />
ACTA-5<br />
ACTA-4<br />
ACTA-3<br />
ACTA-2<br />
ACTA-1<br />
Mainline Simulation Model<br />
Rail Network<br />
Level <strong>of</strong> Service<br />
MODEL OUTPUT<br />
Train running time<br />
Total train delay<br />
Maximum train delay<br />
Average train delay<br />
For all scenarios and<br />
forecast years<br />
For all scenarios and<br />
forecast years<br />
Figure 5-1. Major Steps <strong>of</strong> Railroad Simulation<br />
<strong>Port</strong> <strong>of</strong> <strong>Los</strong> <strong>Angeles</strong> July 2004<br />
Review Draft Page 24
<strong>Port</strong>wide Rail Synopsis<br />
Chapter 5. Railroad Mainline Simulation Model<br />
Description <strong>of</strong> Simulation Elements<br />
Three major elements are defined for rail simulation: cargo forecasts, train forecasts, and<br />
the rail network. <strong>The</strong>se are described as follows.<br />
Cargo Forecasts<br />
Intermodal cargo forecasts were developed for 2005, 2010, 2015, and 2020, as described in<br />
Chapter 4 and summarized in <strong>Table</strong> 4‐4. <strong>The</strong>se intermodal volumes provided the basis<br />
for estimating train traffic forecasts, as described in the following section.<br />
Train Forecasts<br />
Forecasted train volumes include non‐intermodal and intermodal volumes. <strong>The</strong> train<br />
forecasts and simulations considered both the <strong>Port</strong>s <strong>of</strong> <strong>Los</strong> <strong>Angeles</strong> and Long Beach.<br />
Light Engine<br />
Moves:<br />
Train engine<br />
moves due to<br />
fueling,<br />
maintenance,<br />
or crew<br />
change<br />
requirements.<br />
Light Engine and Yard Switcher Moves<br />
Light engine moves occur through engine fueling/maintenance and crew change<br />
requirements. After 2010, rail capacity limitations are expected to constrain these moves.<br />
Yard switcher moves occur through inter‐terminal distribution <strong>of</strong> rail deliveries. <strong>The</strong><br />
deliveries may be empty railcars or loads that were delivered to one rail yard with a mix<br />
<strong>of</strong> cars ultimately destined to other terminals. Other yard switcher moves can include<br />
PHL making rounds that are not included in the direct delivery accounted for in the<br />
intermodal and non‐intermodal train traffic numbers.<br />
Non-Intermodal Volumes<br />
<strong>The</strong> Rail Capacity Analysis assumed that non‐intermodal operations (e.g., automobiles,<br />
slab steel, bulk, and boxcars) would maintain at existing train volumes; the Mercer<br />
forecast does not project these volumes to increase.<br />
Intermodal Volumes<br />
<strong>The</strong> forecast <strong>of</strong> intermodal trains is based on the Maximum On‐dock Share intermodal<br />
throughput presented in Chapter 4. <strong>The</strong> unit‐trains are estimated to average 23, 24, 25,<br />
and 25 DS‐cars in forecast years 2005, 2010, 2015, and 2020, respectively. Train volumes<br />
are counted as individual train movements, such that an inbound train counts as one<br />
movement and an outbound train counts as a second movement.<br />
Summary <strong>of</strong> Train Volumes<br />
<strong>The</strong> resulting rail volume forecasts are presented in <strong>Table</strong> 5‐1. <strong>The</strong>se volumes were used<br />
to generate trains in the mainline rail simulation model.<br />
<strong>Port</strong> <strong>of</strong> <strong>Los</strong> <strong>Angeles</strong> July 2004<br />
Review Draft Page 25
<strong>Port</strong>wide Rail Synopsis<br />
Chapter 5. Railroad Mainline Simulation Model<br />
<strong>Table</strong> 5-1. <strong>Port</strong>s <strong>of</strong> <strong>Los</strong> <strong>Angeles</strong> and Long Beach Peak Day Train Forecast<br />
Existing 2005 2010 2015 2020<br />
Intermodal 12 32 45 77 104<br />
Non-intermodal 26 26 26 26 26<br />
Light engine/yard switcher 20 24 26 26 26<br />
Total <strong>Port</strong> network trains 58 82 97 129 156<br />
Alameda Corridor trains 38 58 71 103 130<br />
Model Network<br />
<strong>The</strong> fundamental building blocks <strong>of</strong> the model networks are nodes and links. A<br />
prerequisite to obtaining useful results from RTC is the accurate description <strong>of</strong> track and<br />
signal layouts using nodes and links.<br />
■<br />
■<br />
Nodes represent locations—switch points, foul points, signals, station stops, speed<br />
change locations, and major grade change locations.<br />
Links represent track that connects node locations. Accurate lengths, speed limits,<br />
and ruling grades must be coded into the simulation network for the links.<br />
<strong>The</strong> minimum level <strong>of</strong> detail needed to simulate a train in RTC includes specifying the<br />
train’s origin, destination, and intermediate station or crew change points (if any). Users<br />
must specify a departure time from a train’s origin node. Departure and arrival times<br />
after the origin node are optional. However, if intermediate stop locations (such as crew<br />
change points) do not have specified departure times, minimum dwell time must be<br />
specified for them.<br />
Summary <strong>of</strong> Simulation Scenarios<br />
Rail Level <strong>of</strong> Service Definition<br />
Rail network system performance is presented as a Level <strong>of</strong> Service (LOS), which is<br />
report card‐type grading (A through F) based on delay ratio (total accumulated train<br />
delay time/running time). An LOS <strong>of</strong> C or better is considered acceptable based on<br />
experience at similar rail terminal environments and on the length <strong>of</strong> delays that were<br />
experienced by individual trains during simulation runs with those delay ratios. An LOS<br />
worse than C and delay ratio greater than 27 percent is considered unacceptable. <strong>The</strong><br />
relationship between delay ratio and LOS for the <strong>Port</strong> area rail operations is summarized<br />
in <strong>Table</strong> 5‐2.<br />
<strong>Port</strong> <strong>of</strong> <strong>Los</strong> <strong>Angeles</strong> July 2004<br />
Review Draft Page 26
<strong>Port</strong>wide Rail Synopsis<br />
Chapter 5. Railroad Mainline Simulation Model<br />
<strong>Table</strong> 5-2. Level <strong>of</strong> Service Criteria for <strong>Port</strong> Area Rail Operations<br />
Delay Ratio LOS Delay/Traffic Description<br />
0 to 12% A Minimal/Light<br />
12% to 20% B Minor/Light-Moderate<br />
20% to 27% C Moderate/Moderate<br />
27% to 32% D Significant/Heavy<br />
32% to 37% E Severe/Unstable<br />
37% + F Gridlock/Failed<br />
<strong>The</strong> results <strong>of</strong> the ACTA simulation runs were difficult to directly compare with the <strong>Port</strong><br />
runs due to differences in inputs for:<br />
■<br />
■<br />
Train Volumes. Intermodal train volumes were very nearly the same with minor<br />
adjustments, based on updated plans by the <strong>Port</strong>. However, the volumes <strong>of</strong> nonintermodal<br />
and light engine traffic were significantly increased in the ACTA runs.<br />
<strong>The</strong> ICTF in Carson was also included as a contributor <strong>of</strong> traffic to the Alameda<br />
Corridor.<br />
Rail Network Extents. <strong>The</strong> ACTA model covers the entire Alameda Corridor in<br />
addition to the <strong>Port</strong> rail network. Trains traveling through the corridor do not<br />
exhibit significant delays; therefore, the same delays incurred in the <strong>Port</strong> are<br />
averaged out over a greater running time. <strong>The</strong> delay ratios calculated for the ACTA<br />
model runs could be 5 to 10 percent lower than the <strong>Port</strong> Rail Capacity Analysis runs<br />
even though they are showing the same LOS in the <strong>Port</strong>. Thus, an adjusted<br />
definition <strong>of</strong> LOS was required to be used with the ACTA simulation runs since they<br />
modeled a larger system.<br />
<strong>The</strong> modified LOS definition for the Alameda Corridor/<strong>Port</strong> rail network model is shown<br />
in <strong>Table</strong> 5‐3.<br />
<strong>Table</strong> 5-3. Level <strong>of</strong> Service Criteria for <strong>Port</strong>/Alameda Corridor Rail Operations<br />
Delay Ratio LOS Delay/Traffic Description<br />
0 to 7% A Minimal/Light<br />
7% to 14% B Minor/Light-Moderate<br />
14% to 20% C Moderate/Moderate<br />
20% to 25% D Significant/Heavy<br />
25% to 30% E Severe/Unstable<br />
30% + F Gridlock/Failed<br />
<strong>Port</strong> <strong>of</strong> <strong>Los</strong> <strong>Angeles</strong> July 2004<br />
Review Draft Page 27
<strong>Port</strong>wide Rail Synopsis<br />
Chapter 5. Railroad Mainline Simulation Model<br />
Conclusions from Simulation<br />
Existing Conditions<br />
Existing rail analysis indicated that the rail network can readily accommodate the rail<br />
traffic operating over it most <strong>of</strong> the time without unreasonable train delays. However,<br />
there are periods <strong>of</strong> relatively dense traffic when delays can be significant and the<br />
physical plant may have already been inadequate. When the Badger Bridge over the<br />
Cerritos Channel was opened for marine traffic in simulation, as many as four train<br />
movements were delayed. Cross‐traffic at Long Beach Junction at that time was<br />
anticipated to diminish as the Alameda Corridor route opened and removed trains from<br />
the former UP San Pedro Branch via Wilmington Wye.<br />
Centralized Traffic Control (CTC) is a method <strong>of</strong> operation used by railroads to control<br />
and direct trains over a specified corridor. <strong>The</strong> electronic signal system that is used to<br />
provide this type <strong>of</strong> control is defined as a Traffic Control System in Part 236 <strong>of</strong> the Code<br />
<strong>of</strong> Federal Regulations 49.<br />
Simulation <strong>of</strong> existing conditions indicated that it may be advantageous to equip<br />
frequently‐used turnouts (track switches) that are and will remain outside <strong>of</strong> CTC/Traffic<br />
Control System limits with power switch machines and enable train crews to operate<br />
them by remote local control either from a locomotive cab or from a convenient ground<br />
location. This could improve railroad‐operating efficiency within the <strong>Port</strong> at locations<br />
where installation <strong>of</strong> CTC/Traffic Control System is not justified or desirable.<br />
Future Conditions<br />
<strong>The</strong> simulation results provided insight regarding:<br />
■<br />
■<br />
■<br />
Rail performance by <strong>Port</strong> area,<br />
Terminal Island access, and<br />
Light engine moves.<br />
<strong>The</strong> conclusions drawn from analyses for these categories are discussed in the following<br />
sections.<br />
Rail Performance by <strong>Port</strong> Area<br />
<strong>The</strong> network performance results <strong>of</strong> the Mainline Rail Simulation are based on the<br />
operations <strong>of</strong> the overall port rail system. This overall network result is the clearest<br />
indicator <strong>of</strong> system performance; however, the results <strong>of</strong> individual corridors within the<br />
<strong>Port</strong>s <strong>of</strong> <strong>Los</strong> <strong>Angeles</strong> and Long Beach were analyzed as well.<br />
<strong>Port</strong> <strong>of</strong> <strong>Los</strong> <strong>Angeles</strong>–West<br />
<strong>The</strong> proposed enhancements to West Basin access (e.g., the second ʺrunnerʺ and<br />
modification to the UP Transfer Yard leads) are just enough to absorb both the growth in<br />
traffic and the impact <strong>of</strong> an added West Basin‐East ICTF without unacceptable congestion.<br />
At 2005 demand (nine movements per day), <strong>Port</strong>‐West suffers 2 hours <strong>of</strong> delay per day, or<br />
<strong>Port</strong> <strong>of</strong> <strong>Los</strong> <strong>Angeles</strong> July 2004<br />
Review Draft Page 28
<strong>Port</strong>wide Rail Synopsis<br />
Chapter 5. Railroad Mainline Simulation Model<br />
21.5 percent <strong>of</strong> unimpeded running time. In 2010, with 11 movements per day, these<br />
numbers rise to 2‐¼ hours <strong>of</strong> delay per day, which is only 19 percent <strong>of</strong> running time. By<br />
2015, the <strong>Port</strong>‐West delay ratio is down to just more than 12 percent, or 1.5 freight train<br />
hours per operating day. An LOS value is difficult to assign to a localized subsystem, but<br />
the performance measure for <strong>Port</strong>‐West up through 2015 indicates acceptable system<br />
performance with approximately LOS C.<br />
By 2020, when West Basin‐East is modeled at its full capacity, the delay ratio rises to<br />
30.3 percent, and the actual hours rise to 4.6 hours per day with 17 to 18 movements per<br />
day. <strong>The</strong>se numbers indicate a struggling system (approximate LOS D), and the need for<br />
all recommended improvements.<br />
Train operations with West Basin‐East trains working toward WBICTF (ACTA‐5) are not<br />
significantly worse; however, by 2015 performance is marginal. Train operations are<br />
expected to be unacceptable after 2015 without the POLA Transfer Yard expansion.<br />
<strong>Port</strong> <strong>of</strong> Long Beach–Proper<br />
<strong>The</strong> results show that, except for Terminal Island, the <strong>Port</strong> <strong>of</strong> Long Beach mainlines (Long<br />
Beach Subdivision) function very well all the way through planning horizon year 2020.<br />
Various improvement projects are recommended to achieve this performance, as listed in<br />
Chapter 6.<br />
Terminal Island<br />
<strong>The</strong> greatest concern identified by the rail simulation is the function <strong>of</strong> the mainline onto<br />
Terminal Island. Both the <strong>Port</strong>s <strong>of</strong> <strong>Los</strong> <strong>Angeles</strong> and Long Beach have major terminal<br />
developments on Terminal Island and it is critical to provide access for the high level <strong>of</strong><br />
traffic generated by these terminals. <strong>The</strong> issues facing Terminal Island rail traffic include:<br />
■<br />
■<br />
Addressing the impacts <strong>of</strong> lifting Badger Bridge for vessel traffic, and<br />
Adding an additional mainline track.<br />
<strong>Table</strong> 5‐4 presents the system performance indicated by the simulation modeling <strong>of</strong> the<br />
different Badger Bridge lift scenarios. Badger Bridge is currently raised for vessels<br />
transiting the Cerritos Channel, causing delays to trains trying to cross the bridge. <strong>The</strong><br />
Badger Bridge delays have a significant impact on rail system performance. <strong>The</strong><br />
scenarios presented in <strong>Table</strong> 5‐4 focus on the effects <strong>of</strong> Badger Bridge and mainline tracks<br />
onto Terminal Island, but all other <strong>Port</strong> rail improvement projects are included in these<br />
runs as well. <strong>The</strong> results <strong>of</strong> four scenarios are presented in <strong>Table</strong> 5‐4. A bold line<br />
delineates the acceptable level <strong>of</strong> rail service for each year (scenarios below the bold line<br />
and shaded have acceptable rail service).<br />
<strong>Port</strong> <strong>of</strong> <strong>Los</strong> <strong>Angeles</strong> July 2004<br />
Review Draft Page 29
<strong>Port</strong>wide Rail Synopsis<br />
Chapter 5. Railroad Mainline Simulation Model<br />
<strong>Table</strong> 5-4. Network Performance Results for <strong>Port</strong>s <strong>of</strong> <strong>Los</strong> <strong>Angeles</strong> and Long<br />
Beach Rail System<br />
Scenario<br />
(Badger Bridge Up-time)<br />
1. Bridge Lifts after 47-foot<br />
Commodore Heim Bridge<br />
Replacement<br />
2. Bridge Lifts for reduced<br />
vessels (160 minutes/day)<br />
3. Bridge Lifts for Emergency<br />
Only (0 minutes/day)<br />
4. Scenario 4 plus Third<br />
Mainline from CP Mole to<br />
W. <strong>The</strong>nard (0 mins/day)<br />
Conclusion – Badger Bridge<br />
requirement<br />
LOS (Delay Ratio)<br />
2000 2005 2010 2015 2020<br />
B D (30%) D (32%)<br />
F (>45%) F (>60%)<br />
B C (24%) C (26%) F (40%) F (55%)<br />
A B (15%) B (17%) E (32%) F (47%)<br />
A A (12%) A (13%) B (20%) C (27%)<br />
OK with<br />
current<br />
bridge lifts<br />
Bridge lifts<br />
< 160<br />
minutes<br />
Bridge lifts<br />
< 160<br />
minutes<br />
0 lifts; add<br />
third track<br />
0 lifts; add<br />
third track<br />
Recommendations for Badger Bridge, based on the analysis results summarized in<br />
<strong>Table</strong> 5‐4, are as follows:<br />
■<br />
■<br />
■<br />
■<br />
By 2005—Badger Bridge is currently raised at least 280 minutes daily for vessels<br />
transiting the Cerritos Channel. <strong>The</strong>se intermittent closures to train traffic will cause<br />
significant impacts to rail operations by 2005. Bridge lifts need to be reduced to<br />
160 minutes per day for acceptable rail service.<br />
Between 2005 and 2010—<strong>The</strong> Badger Bridge operation will need to be reduced by<br />
2005 in order to provide acceptable rail service as defined by delay ratio. <strong>The</strong><br />
simulation results show an unacceptable LOS <strong>of</strong> D with the current number <strong>of</strong><br />
Badger Bridge lifts. Bridge lifts <strong>of</strong> 160 minutes per day will provide LOS for rail that<br />
is marginally acceptable by 2010.<br />
After 2010—Badger Bridge will need to be kept in the down position except in<br />
emergency situations after 2010 in order to provide acceptable rail service.<br />
By 2015—<strong>The</strong> volume <strong>of</strong> train traffic accessing Terminal Island will require an<br />
additional mainline track from Control Point (CP) West <strong>The</strong>nard to CP Mole, with<br />
added crossovers at both ends. Adding a track will be challenging since this stretch<br />
<strong>of</strong> rail runs through the highly constrained “Texaco Slot,” through the Henry Ford<br />
Grade Separation (which currently only has width for two existing tracks), across<br />
Badger Bridge (which currently only has width for two existing tracks), and through<br />
the crowded CP Mole area with two built‐out grade separations and numerous yard<br />
lead limitations. To achieve acceptable rail service, the <strong>Port</strong> will also need to extend<br />
CTC to the last turnout onto yard leads beyond CP Mole to Pier T, Pier 400, Pier 300,<br />
and TICTF.<br />
<strong>Port</strong> <strong>of</strong> <strong>Los</strong> <strong>Angeles</strong> July 2004<br />
Review Draft Page 30
<strong>Port</strong>wide Rail Synopsis<br />
Chapter 5. Railroad Mainline Simulation Model<br />
Light Engine Moves<br />
At current light engine ratios (as tested by ACTA‐1 and ‐2), the locomotive moves clearly<br />
tax the available capacity <strong>of</strong> the network and contribute significantly to system delay<br />
hours. <strong>The</strong> 153 light engines in the 2015 scenario lose 43 hours over the 4 days<br />
(10.75 hours per day, 17 minutes per move). <strong>The</strong> 196 light engines in the 2020 scenario<br />
lose 96 hours over the 4 days (24 hours per day, almost 30 minutes per move). Thus, itʹs<br />
clear that both the cost and reliability <strong>of</strong> the power moves become a serious issue<br />
between 2010 and 2015; the power component <strong>of</strong> the system performance is unacceptable<br />
after 2015, and by 2020 itʹs unacceptable even if it is assumed that only 44 percent<br />
(instead <strong>of</strong> 50 percent) <strong>of</strong> trains require an associated light engine movement.<br />
Relocating the engine service facilities closer to the major intermodal terminals (as tested<br />
in ACTA‐3 and ‐4) helps alleviate congestion, but the improvement is modest and not<br />
sufficient to eliminate the long‐term need for a third main track between CP Sepulveda<br />
and CP Mole.<br />
Two factors combine to limit the positive effect on overall congestion that results simply<br />
from relocating the engine facilities:<br />
1. While the light engines cause congestion by traveling farther to be serviced, itʹs still<br />
principally the long intermodal trains interfering with each other that are causing<br />
network congestion. This ʺtrainʺ‐related congestion is helped, but not eliminated, by<br />
relocating the facilities. <strong>The</strong> light engines themselves are <strong>of</strong>ten victims <strong>of</strong> congestion,<br />
rather than its cause, and in this respect the relocation <strong>of</strong> facilities helps significantly<br />
(see below).<br />
2. <strong>The</strong> engine facility at Brighton Beach (CP Mole) has to be located along Ocean<br />
Boulevard, between CP LAXT on the west and the leads to Piers T/W/400 on the east.<br />
This is the only area that allows connections from the service tracks to Pier 300 on the<br />
west and Terminal Island on the east. Even so, engines using this facility must cross<br />
over the leads within the interlocking plant at CP Mole. Significantly less time is<br />
required for such movements than the cases in which engines travel to the Dolores or<br />
Manuel yards. However, congestion still exists for these movements.<br />
Where the relocated facility benefits really show up is in reduced locomotive hours. This<br />
is a different benefit measure than just looking at congestion because it includes not only<br />
the time lost to congestion‐related delay, but the savings in pure running time that comes<br />
from shorter trips. <strong>The</strong> reduction in locomotive time required to move power to and<br />
from unit and double‐stack trains ranges from 22.6 percent under 2015 and 2020<br />
double‐track conditions to 19 percent under 2015 triple‐track conditions, and ranges from<br />
about 10 to 15 hours per operating day. This is a significant benefit, especially<br />
considering that most <strong>of</strong> the locomotive consists modeled contain four relatively new and<br />
expensive units. (Each locomotive consist has approximately 17,600 horsepower, so each<br />
hour <strong>of</strong> delay or travel time is 17,600 horsepower hours.)<br />
In summary, the high volume <strong>of</strong> light engine moves that would result from maintaining<br />
current operations will cause rail service problems in the 2010–2020 timeframe.<br />
Constructing engine service facilities within the <strong>Port</strong> will provide benefits, but there will<br />
<strong>Port</strong> <strong>of</strong> <strong>Los</strong> <strong>Angeles</strong> July 2004<br />
Review Draft Page 31
<strong>Port</strong>wide Rail Synopsis<br />
Chapter 5. Railroad Mainline Simulation Model<br />
continue to be pressure on the rail capacity due to light engine movements. <strong>The</strong><br />
operating concept <strong>of</strong> using shuttle engines that are maintained with fresh crews at an<br />
inland location should be pursued with the railroads. <strong>The</strong> shuttle engines would be<br />
established to allow dropping a consist and then immediately picking up a prepared<br />
train for departure, allowing the engines to be turned at a rail yard without generating<br />
light engine moves.<br />
Shuttle engines combined with the concept <strong>of</strong> classifying cars into terminal‐specific<br />
westbound trains will provide significant benefits to the LOS on the <strong>Port</strong> rail network.<br />
<strong>Port</strong> <strong>of</strong> <strong>Los</strong> <strong>Angeles</strong> July 2004<br />
Review Draft Page 32
Chapter 6. Summary <strong>of</strong> Rail Recommendations<br />
A <strong>Port</strong> rail improvement program has been developed to address deficiencies in the <strong>Port</strong><br />
rail network and its supporting systems. <strong>The</strong> recommended improvements are based on<br />
the results <strong>of</strong> mainline simulation modeling. Deficiencies are defined based on train<br />
delays and a minimum acceptable LOS. <strong>The</strong> locations <strong>of</strong> the proposed infrastructure<br />
improvements are shown in Figure 6‐1.<br />
Track Improvements<br />
2000–2005 Mainline Rail Capacity Improvements<br />
Rail capacity improvement projects that are recommended for the <strong>Port</strong>, to be completed<br />
by 2005, some <strong>of</strong> which have been completed, include:<br />
■<br />
■<br />
■<br />
Renovate <strong>Port</strong> Transfer Rail Yard as required for PHL,<br />
Crossover Connecting East Leg <strong>of</strong> TI Wye, and<br />
WBICTF Access Track Improvements.<br />
<strong>The</strong> corresponding letter for each <strong>of</strong> these improvements is shown in Figure 6‐1.<br />
Additional improvements that have been recommended for the <strong>Port</strong> <strong>of</strong> Long Beach for<br />
this time period (not shown in the figure), include:<br />
■<br />
■<br />
■<br />
■<br />
Long Beach Lead/TILT Connection,<br />
Pier T East Rail Access Improvements,<br />
Extend Pier F and Metro Leads, and<br />
Remove Pier G (ITS) Gate on Mainline Track.<br />
2005–2010 Mainline Rail Capacity Improvements<br />
Rail capacity improvement projects that are recommended for the <strong>Port</strong>, to be completed<br />
by 2010, include:<br />
■<br />
Modify Policy to Lift Badger Bridge for Emergency Vessels Only and<br />
■ Second Lead to Pier 400.<br />
<strong>The</strong> corresponding letter for each <strong>of</strong> these improvements is shown in Figure 6‐1.<br />
Additional improvements that have been recommended for the <strong>Port</strong> <strong>of</strong> Long Beach for<br />
this time period (not shown in the figure), include:<br />
■ Second Mainline Track to Pier J,<br />
<strong>Port</strong> <strong>of</strong> <strong>Los</strong> <strong>Angeles</strong> July 2004<br />
Review Draft Page 33
<strong>Port</strong>wide Rail Synopsis<br />
Chapter 6. Summary <strong>of</strong> Rail Recommendations<br />
■<br />
■<br />
Pier E Lead Improvements, and<br />
Pier G (ITS) Lead Improvements.<br />
2010–2015 Mainline Rail Capacity Improvements<br />
Rail capacity improvement projects that are recommended for the <strong>Port</strong>, to be completed<br />
by 2015, include:<br />
■<br />
Expand POLA Transfer Yard to Support West Basin operations.<br />
2015–2020 Mainline Rail Capacity Improvements<br />
Rail capacity improvement projects that are recommended for the <strong>Port</strong>, to be completed<br />
by 2020, include:<br />
■<br />
■<br />
Third Mainline from CP Anaheim to CP West <strong>The</strong>nard, with Added Crossovers and<br />
Third Mainline onto Terminal Island, including Badger Bridge to CP Mole.<br />
Two alternatives were developed to potentially address the additional track from Badger<br />
Bridge through CP Mole (shown as H1 and H2 in Figure 6‐1).<br />
Additional improvements that have been recommended for the <strong>Port</strong> <strong>of</strong> Long Beach for<br />
this time period (not shown in the figure), include:<br />
■ Pier B Rail Yard Expansion, Phase 2.<br />
Centralized Traffic Control System Improvements<br />
CTC is one <strong>of</strong> the train operating systems presently in use by PHL for the <strong>Port</strong>s <strong>of</strong> Les<br />
<strong>Angeles</strong> and Long Beach Railroad Network. CTC is described in the American Railway<br />
Engineering and Maintenance‐<strong>of</strong>‐Way Association (AREMA) Signal Manual as a system<br />
<strong>of</strong> railroad operation by which the movement <strong>of</strong> trains over routes and through blocks on<br />
a designated section <strong>of</strong> track is directed by signals controlled from a designated point<br />
without requiring the use <strong>of</strong> train orders and without the superiority <strong>of</strong> trains. CTC<br />
systems are also used where traffic patterns mandate the efficient management <strong>of</strong> train<br />
movement through a specified territory or ingress and egress through critical facilities.<br />
<strong>The</strong> proposed additions to the existing system include extension <strong>of</strong> CTC in the years<br />
between 2010 and 2015. <strong>The</strong> proposed extensions that apply to the <strong>Port</strong> are shown in<br />
Figure 6‐2, and described as follows:<br />
■<br />
■<br />
Extend CTC to Last Mainline Turnout into Yard Leads in the <strong>Port</strong> and<br />
Extend CTC to Last Mainline Turnout into Yard Leads on Terminal Island.<br />
Additional improvements that have been recommended for the <strong>Port</strong> <strong>of</strong> Long Beach for<br />
this time period (not shown in Figure 6‐2), include:<br />
■<br />
Extend CTC to Last Mainline Turnout into Yard Leads in <strong>Port</strong> <strong>of</strong> Long Beach.<br />
<strong>Port</strong> <strong>of</strong> <strong>Los</strong> <strong>Angeles</strong> July 2004<br />
Review Draft Page 34
Ave.<br />
Legend<br />
RECOMMENDED RAIL CAPACITY IMPROVEMENTS<br />
2000–2005<br />
A Renovation <strong>of</strong> <strong>Port</strong> Transfer Yard as Required for PHL<br />
B Crossover Connecting East Leg for T1 Wye<br />
C WBICTF Access Track Improvements and South Wilmington Grade Separation<br />
D West Basin East ICTF<br />
2005–2010<br />
223rd St.<br />
E Restriction <strong>of</strong> Badger Bridge Lift Operations for Emergency Vessals Only<br />
F Second Lead to Pier 400<br />
G Potential ICTF South<br />
2010–2015<br />
H Expansion <strong>of</strong> <strong>Port</strong> Transfer Yard to Support West Basin Operations<br />
2015–2020<br />
J Third Mainline between CP <strong>The</strong>nard and CP Anaheim, with Added Crossovers<br />
K1 Third Mainline onto Terminal Island, Including Badger Bridge to CP Mole – Alternative 1<br />
K2 Third Mainline onto Terminal Island, Including Badger Bridge to CP Mole – Alternative 2<br />
Sepulveda Blvd.<br />
Wilmington Ave.<br />
Carson St.<br />
UP<br />
DOLORES<br />
YARD<br />
ICTF<br />
SUPPORT<br />
YARD<br />
UP ICTF<br />
Santa Fe Ave.<br />
FORMER UNION PACIFIC – INDUSTRY ACCESS<br />
405<br />
Wardlow Rd.<br />
710<br />
Willow St.<br />
EXISTING RAIL FACILITIES<br />
Existing Rail<br />
Alameda Corridor<br />
ICTF On Dock ICTF (<strong>Port</strong> <strong>of</strong> LA)<br />
ICTF<br />
YARD<br />
Westmont Dr.<br />
1st St.<br />
6th St.<br />
Gaffey St.<br />
Channel St.<br />
FORMER BURLINGTON NORTHERN SANTA FE – INDUSTRY A CESS<br />
Near Dock ICTF 1<br />
Non-ICTF Rail Yards<br />
Figueroa St.<br />
110<br />
YANG<br />
MING<br />
N. Front St.<br />
WEST<br />
BASIN<br />
ICTF<br />
CITIES<br />
Lomita Blvd.<br />
Pacific Coast Hwy.<br />
Wilminton Blvd.<br />
Anaheim St.<br />
Harry Bridges Blvd.<br />
TRAPAC<br />
West<br />
Basin<br />
Terminal Way<br />
Fries St.<br />
Ferry<br />
St<br />
Avalon Blvd.<br />
WILMINGTON<br />
Slip 1<br />
Vincent<br />
TERMINAL<br />
Thomas<br />
ISLAND ICTF<br />
Bridge<br />
Main Channel<br />
<strong>Los</strong> <strong>Angeles</strong><br />
Long Beach<br />
Carson<br />
<strong>Los</strong> <strong>Angeles</strong> County<br />
PIER A<br />
YARD<br />
D<br />
C<br />
EVERGREEN<br />
Slip 5<br />
YUSEN<br />
East Main Channel<br />
LAXT<br />
East<br />
Basin<br />
PIER 300<br />
ICTF<br />
BNSF<br />
WATSON<br />
YARD<br />
A H J<br />
N. Henry<br />
Ford Ave.<br />
Alameda St.<br />
N. Henry Ford Ave.<br />
TRANSFER YARD<br />
Badger<br />
Bridge E<br />
K1<br />
B<br />
K2<br />
47<br />
F<br />
UP MEAD<br />
YARD<br />
47 103<br />
Cerritos Channel<br />
Commodore<br />
Heim Bridge<br />
PIER S<br />
PIER T<br />
Dominguez Channel<br />
PIER A<br />
Ocean Blvd.<br />
Gerald<br />
Desmond<br />
Bridge<br />
West<br />
Basin<br />
G<br />
PIER B<br />
MANUEL<br />
YARD<br />
Channel 2<br />
Back Channel<br />
Channel 3<br />
PIER B<br />
RAIL YARD<br />
PIER D<br />
PIER E<br />
Slip 3<br />
East Basin<br />
<strong>Los</strong> <strong>Angeles</strong> River<br />
PIER G<br />
Southeast Basin<br />
PIER J<br />
1<br />
SAN<br />
PEDRO<br />
Gaffey St.<br />
Pacific Ave.<br />
Harbor Blvd.<br />
Seaside<br />
APL<br />
MAERSK<br />
PIER 400<br />
ICTF<br />
PIER 400<br />
San Pedro Bay<br />
04320.04-001 7/7/04<br />
West Channel<br />
Minor St.<br />
East Channel<br />
0 2,000 4,000<br />
Feet<br />
Data Source: <strong>Port</strong> <strong>of</strong> <strong>Los</strong> <strong>Angeles</strong> 2003b<br />
Middle Breakwater<br />
Figure 6-1<br />
Recommended <strong>Port</strong> Rail Capacity Improvements
Ave.<br />
Legend<br />
LIMITS OF CENTRALIZED TRAFFIC CONTROL (CTC)<br />
Existing/Under Design<br />
Proposed<br />
RECOMMENDED CTC EXPANSION<br />
2010–2015<br />
I<br />
J<br />
Extend CTC to Last Mainline Turnout into Yard Leads in the <strong>Port</strong><br />
Extend CTC to Last Mainline Turnout into Yard 223rd Leads St. on Terminal Island<br />
Wilmington Ave.<br />
Carson St.<br />
UP<br />
DOLORES<br />
YARD<br />
FORMER UNION PACIFIC – INDUSTRY ACCESS<br />
405<br />
RAIL FACILITIES<br />
CITIES<br />
Wardlow Rd.<br />
ICTF<br />
ICTF<br />
YARD<br />
Existing Rail<br />
Alameda Corridor<br />
On-Dock ICTF (<strong>Port</strong> <strong>of</strong> LA)<br />
Near-Dock ICTF<br />
Non-ICTF Rail Yards<br />
<strong>Los</strong> <strong>Angeles</strong><br />
Long Beach<br />
Carson<br />
<strong>Los</strong> <strong>Angeles</strong> County<br />
Sepulveda Blvd.<br />
ICTF<br />
SUPPORT<br />
YARD<br />
UP ICTF<br />
Santa Fe Ave.<br />
Willow St.<br />
710<br />
Gaffey St.<br />
Westmont Dr.<br />
Channel St.<br />
1st St.<br />
6th St.<br />
1<br />
FORMER BURLINGTON NORTHERN SANTA FE – INDUSTRY A CESS<br />
Figueroa St.<br />
110<br />
YANG<br />
MING<br />
N. Front St.<br />
WEST<br />
BASIN<br />
ICTF<br />
Lomita Blvd.<br />
Pacific Coast Hwy.<br />
Wilminton Blvd.<br />
Harry Bridges Blvd.<br />
TRAPAC<br />
West<br />
Basin<br />
Terminal Way<br />
Fries St.<br />
Ferry<br />
St<br />
Avalon Blvd.<br />
Anaheim St.<br />
WILMINGTON<br />
Slip 1<br />
Vincent<br />
TERMINAL<br />
Thomas<br />
ISLAND ICTF<br />
Bridge<br />
Main Channel<br />
PIER A<br />
YARD<br />
EVERGREEN<br />
I<br />
Slip 5<br />
YUSEN<br />
East Main Channel<br />
LAXT<br />
East<br />
Basin<br />
PIER 300<br />
ICTF<br />
BNSF<br />
WATSON<br />
YARD<br />
J<br />
TRANSFER YARD<br />
N. Henry<br />
Ford Ave.<br />
Alameda St.<br />
N. Henry Ford Ave.<br />
Badger<br />
Bridge<br />
47<br />
UP MEAD<br />
YARD<br />
47 103<br />
Cerritos Channel<br />
Commodore<br />
Heim Bridge<br />
PIER S<br />
PIER T<br />
Dominguez Channel<br />
PIER A<br />
Ocean Blvd.<br />
Gerald<br />
Desmond<br />
Bridge<br />
West<br />
Basin<br />
PIER B<br />
MANUEL<br />
YARD<br />
Channel 2<br />
Back Channel<br />
Channel 3<br />
PIER B<br />
RAIL YARD<br />
PIER D<br />
PIER E<br />
Slip 3<br />
East Basin<br />
<strong>Los</strong> <strong>Angeles</strong> River<br />
PIER G<br />
Southeast Basin<br />
PIER J<br />
1<br />
SAN<br />
PEDRO<br />
Gaffey St.<br />
Pacific Ave.<br />
Harbor Blvd.<br />
Seaside<br />
APL<br />
MAERSK<br />
PIER 400<br />
ICTF<br />
PIER 400<br />
San Pedro Bay<br />
04320.04-001 7/7/04<br />
West Channel<br />
Minor St.<br />
East Channel<br />
Middle Breakwater<br />
0 2,000 4,000<br />
Feet<br />
Source: <strong>Port</strong> <strong>of</strong> <strong>Los</strong> <strong>Angeles</strong> 2003b<br />
Figure 6-2<br />
Recommended Extension <strong>of</strong> <strong>Port</strong> Centralized<br />
Traffic Control, 2010-2015
<strong>Port</strong>wide Rail Synopsis<br />
Chapter 6. Summary <strong>of</strong> Rail Recommendations<br />
Other Operating Improvements<br />
<strong>The</strong> Rail Capacity Analysis identified operating improvements that were necessary to<br />
achieve an acceptable level <strong>of</strong> train service. <strong>The</strong>se improvements are required in addition<br />
to the track and CTC system improvements. <strong>The</strong> operating improvements look for ways<br />
to limit any unnecessary train traffic since the <strong>Port</strong> rail network will be operating near its<br />
capacity by 2015.<br />
■<br />
Turn locomotives within the terminal. Intermodal trains should make dual moves to<br />
individual terminals to reduce light engine traffic. This means that a locomotive<br />
delivers a unit train to a specific terminal and then hooks up to an eastbound train<br />
that is built and has brakes charged and ready for departure. Achieving this<br />
operation would require several features:<br />
• Adequate departure tracks;<br />
• Ability to address fueling, maintenance, and crew change needs (accomplished<br />
with regional shuttle engines or with in‐<strong>Port</strong> fueling facilities); and<br />
• Locomotives that can pull in either direction to avoid wye turns (engines at both<br />
ends <strong>of</strong> locomotive set must be fully functional with such thing as<br />
instrumentation, windshield wipers, and toilets).<br />
■<br />
Avoid inter‐terminal train traffic. Intermodal trains that arrive in the <strong>Port</strong> are not<br />
currently sorted for single‐terminal delivery. PHL or the Class I operator must break<br />
and sort trains somewhere inside the <strong>Port</strong> for delivery to several individual<br />
terminals. This practice would not fit within the capacity <strong>of</strong> the <strong>Port</strong> rail network by<br />
2015. It is recommended that westbound trains be classified by terminal to create<br />
terminal‐specific trains somewhere outside the <strong>Port</strong>/<strong>Los</strong> <strong>Angeles</strong> region (i.e., beyond<br />
where rail congestion and rail yard land prices are high). One concept is to provide<br />
the classification at the same location where regional shuttle trains are exchanged,<br />
which could occur at an inland empire site.<br />
<strong>Port</strong> <strong>of</strong> <strong>Los</strong> <strong>Angeles</strong> July 2004<br />
Review Draft Page 35
Chapter 7. Relationship to Freight Truck Haulage<br />
This chapter summarizes the analysis <strong>of</strong> the regional roadway system completed by the<br />
<strong>Port</strong>, as well as the roadway improvements needed to accommodate projected future<br />
truck freight haulage. This chapter also discusses the potential impacts that elimination<br />
<strong>of</strong> truck trips in favor <strong>of</strong> rail may have on regional air quality and traffic congestion.<br />
<strong>Port</strong> Baseline Transportation Study<br />
<strong>The</strong> <strong>Port</strong> Baseline Transportation Study (<strong>Port</strong> <strong>of</strong> <strong>Los</strong> <strong>Angeles</strong> 2003c) was conducted by<br />
Meyer Mohaddas Associates to address existing and future roadway deficiencies<br />
expected to result from projected increases in cargo throughput. <strong>The</strong> study includes<br />
analysis <strong>of</strong> existing and future vehicular traffic demand, transportation system<br />
deficiencies, and necessary improvements. Both transportation planning and traffic<br />
engineering analyses were conducted for the study, which included analyses within and<br />
immediately adjacent to the <strong>Port</strong>. Regional transportation system analyses were also<br />
performed on the freeway system.<br />
Baseline Study Approach<br />
<strong>The</strong> <strong>Port</strong> Baseline Transportation Study project included the following tasks:<br />
■<br />
■<br />
■<br />
■<br />
■<br />
■<br />
■<br />
Assessment <strong>of</strong> existing roadway traffic conditions;<br />
Forecasts <strong>of</strong> container terminal truck trips by type (e.g., bobtail, chassis, container<br />
loads, and empties), container terminal auto trips, and non-container terminal auto<br />
and truck trips;<br />
Analysis <strong>of</strong> the transportation system operating conditions for key intersections in<br />
and around the <strong>Port</strong> for existing and future (2010 and 2025) years;<br />
Development <strong>of</strong> a comprehensive travel demand modeling tool for use in assessment<br />
<strong>of</strong> future travel patterns and projection <strong>of</strong> future deficiencies;<br />
Identification <strong>of</strong> future transportation system deficiencies;<br />
Recommended physical transportation system improvements and Intelligent<br />
Transportation System improvements in the <strong>Port</strong>; and<br />
Identification <strong>of</strong> <strong>Port</strong> truck traffic and deficiencies on the key regional access routes<br />
to the <strong>Port</strong>.<br />
Existing Intersection Conditions Analysis<br />
<strong>The</strong> existing intersection conditions analysis for signalized locations was conducted<br />
using the Critical Movement Analysis methodology. Unsignalized intersections were<br />
analyzed using methodologies contained in the Highway Capacity Manual<br />
(Transportation Research Board 2000). Basic input data for the existing intersection<br />
conditions analysis include number <strong>of</strong> lanes by type, signal or stop sign control, and peak<br />
hour traffic volumes (auto and truck).<br />
<strong>Port</strong> <strong>of</strong> <strong>Los</strong> <strong>Angeles</strong> July 2004<br />
Review Draft Page 36
<strong>Port</strong>wide Rail Synopsis<br />
Chapter 7. Relationship to Freight Truck Haulage<br />
LOS is a qualitative indication <strong>of</strong> an intersectionʹs operating conditions as represented by<br />
traffic congestion, delay, and volume to capacity (V/C) ratio. For signalized intersections,<br />
operating conditions are measured from LOS A (excellent conditions with little or no<br />
delay conditions) to LOS F (extreme congestion and intersection failure), with LOS D<br />
(V/C <strong>of</strong> 0.90) typically considered to be the threshold <strong>of</strong> acceptability. <strong>The</strong> relationship<br />
between V/C ratio and LOS for signalized intersections is summarized in <strong>Table</strong> 7‐1.<br />
<strong>Table</strong> 7-1. Level <strong>of</strong> Service Criteria for Signalized Intersections<br />
V/C Ratio LOS Traffic Conditions<br />
0 to 0.60 A Little or no delay/congestion<br />
0.61 to 0.70 B Slight congestion/delay<br />
0.71 to 0.80 C Moderate delay/congestion<br />
0.81 to 0.90 D Significant delay/congestion<br />
0.91 to 1.00 E Extreme congestion/delay<br />
1.01 + F Intersection failure/gridlock<br />
Stop‐controlled intersections were analyzed using methodologies contained in the Highway<br />
Capacity Manual, in which LOS is based on average vehicular delay. <strong>The</strong> relationship<br />
between delay and LOS for stop‐controlled intersections (two‐way and multi‐way stops)<br />
is summarized in <strong>Table</strong> 7‐2.<br />
<strong>Table</strong> 7-2. Level <strong>of</strong> Service Criteria for Unsignalized Intersections<br />
LOS<br />
A<br />
B<br />
C<br />
D<br />
E<br />
Average Delay (sec/vehicle)<br />
≤10<br />
F >50<br />
>10 and ≤15<br />
>15 and ≤25<br />
>25 and ≤35<br />
>35 and ≤50<br />
LOS analysis results indicate that 14 intersections currently operate at LOS E or F<br />
(considered deficient), while the rest operate at LOS D or better. <strong>The</strong> majority <strong>of</strong> the<br />
LOS E/F locations are along Gaffey Street, Western Avenue, Pacific Coast Highway,<br />
Figueroa Street, or at freeway on/<strong>of</strong>f ramps, including Harbor Boulevard, Swinford<br />
Street, I‐110, and SR‐47.<br />
Capacity Consideration for Truck Haul Forecasts<br />
Roadway analysis presented in this report utilized a source <strong>of</strong> information secondary to<br />
the Mercer forecast described in Chapter 4, the Capacity Analysis Report (JWD 2002).<br />
This report evaluated the physical capacity <strong>of</strong> the <strong>Port</strong>’s existing and planned container<br />
<strong>Port</strong> <strong>of</strong> <strong>Los</strong> <strong>Angeles</strong> July 2004<br />
Review Draft Page 37
<strong>Port</strong>wide Rail Synopsis<br />
Chapter 7. Relationship to Freight Truck Haulage<br />
terminal expansion for 2002, 2005, 2010, and 2025. Unlike the Mercer forecast approach,<br />
this report examined the physical throughput capacity <strong>of</strong> each terminal based on a<br />
detailed analysis <strong>of</strong> berthing and backland operational criteria. Changes to operational<br />
labor practices, increased hours <strong>of</strong> operation, ship sizes, container stacking heights, and<br />
other factors were built into a capacity analysis model that calculated the future years<br />
throughput capacity for the berths and backland areas independently for each terminal.<br />
<strong>The</strong> report also determined whether the backland or berth was the limiting factor for<br />
each terminal and reported an overall terminal capacity for each <strong>of</strong> the analysis years.<br />
<strong>The</strong> Baseline Transportation Study applied the following 2010 and 2025 scenarios for<br />
purposes <strong>of</strong> analysis:<br />
■ 2010 <strong>Port</strong> Capacity/Mercer Constrained Scenario. Assumes 19.7 million TEUs<br />
throughput in both ports, with <strong>Port</strong> TEUs based on terminal capacity and <strong>Port</strong> <strong>of</strong><br />
Long Beach taking the remainder. Also assumes some changes to terminal operating<br />
parameters.<br />
Hoot shift:<br />
Work shift<br />
that occurs<br />
between the<br />
night shift<br />
and the day<br />
shift.<br />
■ 2010 <strong>Port</strong>s <strong>of</strong> <strong>Los</strong> <strong>Angeles</strong> and Long Beach Mercer Unconstrained Scenario.<br />
Assumes 26.9 million TEUs throughput, with each port taking 50 percent <strong>of</strong> the<br />
throughput.<br />
■ 2025 Modified 24-hour Operations Scenario 1. Assumes 47.2 million TEUs<br />
throughput in both ports combined, split equally among the two ports. Assumes<br />
some changes to terminal operating parameters, including expanded gate hours<br />
during weekdays, expanded use <strong>of</strong> weekend operations, and more on‐dock rail.<br />
However, this scenario is more conservative because it does not assume full use <strong>of</strong><br />
expanded gate hours. <strong>The</strong> assumed shift split is 60 percent <strong>of</strong> throughput during the<br />
day shift and 20 percent in each <strong>of</strong> the night and hoot shifts.<br />
■ 2025 Modified 24-hour Operations Scenario 2. Assumes major changes to terminal<br />
operating parameters, including maximum use <strong>of</strong> on‐dock rail, maximum use <strong>of</strong><br />
extended gate hours, and full application <strong>of</strong> all other foreseeable operations changes<br />
to take port truck traffic away from the peak commute hours operation. This is the<br />
best case scenario, and it actually may result in reduced port trucks during peak<br />
hours at some locations as compared to 2010, when such drastic changes to terminal<br />
operations are not assumed. <strong>The</strong> assumed shifts split is 40 percent during the day, 40<br />
percent during the night, and 20 percent during the hoot shift.<br />
Recommended Roadway Improvements<br />
Concept‐level transportation system improvement recommendations were developed as<br />
part <strong>of</strong> the Transportation Baseline Study to mitigate the projected future deficiencies in<br />
the <strong>Port</strong> area (<strong>Port</strong> <strong>of</strong> <strong>Los</strong> <strong>Angeles</strong> 2003c). <strong>The</strong> recommendations include operations<br />
improvements, infrastructure improvements, and Intelligent Transportation Systems<br />
measures. Currently, the <strong>Port</strong> is initiating development <strong>of</strong> a <strong>Port</strong>wide Master<br />
Transportation Plan. <strong>The</strong> plan will include a review <strong>of</strong> previous studies that have been<br />
completed and more detailed evaluation <strong>of</strong> roadway improvements that have been<br />
<strong>Port</strong> <strong>of</strong> <strong>Los</strong> <strong>Angeles</strong> July 2004<br />
Review Draft Page 38
<strong>Port</strong>wide Rail Synopsis<br />
Chapter 7. Relationship to Freight Truck Haulage<br />
identified and recommended in the existing preliminary studies (Leue pers. comm).<br />
Improvements that have been identified at the conceptual level include the following.<br />
Operations Improvements<br />
<strong>The</strong> results <strong>of</strong> the traffic studies have indicated the need for operational changes and<br />
improvements in both ports. Operational improvements are required even if a full range<br />
<strong>of</strong> physical improvements is implemented. <strong>The</strong> improvement program must include<br />
both changes in how the <strong>Port</strong> terminals operate and increased capacity to the roadway<br />
system in order to maintain adequate LOS. <strong>The</strong> purpose <strong>of</strong> operational changes will<br />
include:<br />
■<br />
■<br />
■<br />
■<br />
Reduce truck traffic through maximum use <strong>of</strong> on‐dock rail movements.<br />
Increase efficiency <strong>of</strong> trucking operations, avoid peak hours to the extent feasible,<br />
and avoid sensitive routes. Shift truck trips from peak hours to <strong>of</strong>f‐peak hours<br />
(second shift and night shift) and also to weekends.<br />
Improve communications between truckers and <strong>Port</strong> terminal operators.<br />
Increase efficiency <strong>of</strong> longshore worker movements to and from the <strong>Port</strong>.<br />
This effort must be an ongoing cooperative effort <strong>of</strong> the two ports, the two city councils,<br />
terminal operators, drayage companies, cargo companies, unions, and others. This issue<br />
involves two‐way flow <strong>of</strong> goods; therefore, simply opening terminal gates at <strong>of</strong>f hours<br />
will not result in substantial changes. It must involve the entire logistics chain, including<br />
inland warehouses that receive goods. <strong>The</strong> types <strong>of</strong> operations improvements to pursue<br />
will include, but not be limited to, the following:<br />
■<br />
■<br />
■<br />
Maximize use <strong>of</strong> on‐dock rail to shift containers to rail instead <strong>of</strong> drayage movement<br />
to <strong>of</strong>f‐dock rail yards.<br />
Implement better scheduling and management practices to avoid truck trips and<br />
truck queuing during peak commute traffic periods.<br />
Improve communications via on‐road signage, changeable message signs, and<br />
appointments for gate entrances.<br />
Infrastructure Improvements<br />
<strong>The</strong> following sections describe the concept‐level improvements that are required for the<br />
transportation system based on the results <strong>of</strong> the transportation demand modeling<br />
results. <strong>The</strong> 2025 deficiency locations and recommended mitigation measures are based<br />
on the modified operations worst case scenario, with 60 percent <strong>of</strong> the terminal traffic<br />
remaining in the day shift. <strong>The</strong> other scenarios, including “24/7” with more traffic on the<br />
second and night shifts, would result in fewer deficiencies. <strong>The</strong>refore, the mitigation<br />
analysis is based on the assumption that only some <strong>of</strong> the operational improvements can<br />
be made by 2025. This is a conservative analysis. <strong>The</strong> potential roadway improvement<br />
types and locations are illustrated in Figure 7‐1.<br />
<strong>Port</strong> <strong>of</strong> <strong>Los</strong> <strong>Angeles</strong> July 2004<br />
Review Draft Page 39
Ave.<br />
Legend<br />
PROPOSED IMPROVEMENTS<br />
Interchange Improvement<br />
Intersection Improvement<br />
Roadway Widening with<br />
Intersection Improvement<br />
Bridge Improvement<br />
CITIES<br />
<strong>Los</strong> <strong>Angeles</strong><br />
RAIL FACILITIES<br />
Existing Rail<br />
Alameda Corridor<br />
ICTF On Dock ICTF (<strong>Port</strong> <strong>of</strong> LA)<br />
ICTF Near Dock ICTF<br />
YARD223rd Non-ICTF St. Rail Yards<br />
Carson St.<br />
UP<br />
DOLORES<br />
YARD<br />
Wilmington Ave.<br />
FORMER UNION PACIFIC – INDUSTRY ACCESS<br />
405<br />
Wardlow Rd.<br />
Long Beach<br />
Carson<br />
<strong>Los</strong> <strong>Angeles</strong> County<br />
Sepulveda Blvd.<br />
ICTF<br />
SUPPORT<br />
YARD<br />
UP ICTF<br />
Santa Fe Ave.<br />
710<br />
Willow St.<br />
Gaffey St.<br />
Westmont Dr.<br />
Channel St.<br />
1st St.<br />
6th St.<br />
1<br />
FORMER BURLINGTON NORTHERN SANTA FE – INDUSTRY A CESS<br />
Figueroa St.<br />
110<br />
YANG<br />
MING<br />
N. Front St.<br />
WEST<br />
BASIN<br />
ICTF<br />
Lomita Blvd.<br />
Pacific Coast Hwy.<br />
Wilminton Blvd.<br />
Anaheim St.<br />
Harry Bridges Blvd.<br />
TRAPAC<br />
West<br />
Basin<br />
Terminal Way<br />
Fries St.<br />
Ferry<br />
St<br />
Avalon Blvd.<br />
WILMINGTON<br />
Slip 1<br />
Vincent<br />
TERMINAL<br />
Thomas<br />
ISLAND ICTF<br />
Bridge<br />
Main Channel<br />
PIER A<br />
YARD<br />
EVERGREEN<br />
Slip 5<br />
YUSEN<br />
East Main Channel<br />
LAXT<br />
East<br />
Basin<br />
PIER 300<br />
ICTF<br />
BNSF<br />
WATSON<br />
YARD<br />
N. Henry<br />
Ford Ave.<br />
Alameda St.<br />
TRANSFER YARD<br />
N. Henry Ford Ave.<br />
Badger<br />
Bridge<br />
47<br />
UP MEAD<br />
YARD<br />
47 103<br />
Cerritos Channel<br />
Commodore<br />
Heim Bridge<br />
PIER S<br />
PIER T<br />
Dominguez Channel<br />
PIER A<br />
Ocean Blvd.<br />
Gerald<br />
Desmond<br />
Bridge<br />
West<br />
Basin<br />
MANUEL<br />
YARD<br />
PIER B<br />
Channel 2<br />
Back Channel<br />
Channel 3<br />
PIER B<br />
RAIL YARD<br />
PIER D<br />
PIER E<br />
Slip 3<br />
East Basin<br />
<strong>Los</strong> <strong>Angeles</strong> River<br />
PIER G<br />
Southeast Basin<br />
PIER J<br />
1<br />
SAN<br />
PEDRO<br />
Gaffey St.<br />
Pacific Ave.<br />
Harbor Blvd.<br />
Seaside<br />
APL<br />
MAERSK<br />
PIER 400<br />
ICTF<br />
PIER 400<br />
San Pedro Bay<br />
04320.04-001 7/7/04<br />
West Channel<br />
Minor St.<br />
East Channel<br />
0 2,000 4,000<br />
Feet<br />
Data Source: <strong>Port</strong> <strong>of</strong> <strong>Los</strong> <strong>Angeles</strong> 2003c<br />
Middle Breakwater<br />
Figure 7-1<br />
Potential Improvements to the Roadway System
<strong>Port</strong>wide Rail Synopsis<br />
Chapter 7. Relationship to Freight Truck Haulage<br />
Intelligent Transportation Systems Measures<br />
<strong>The</strong> <strong>Port</strong>s <strong>of</strong> <strong>Los</strong> <strong>Angeles</strong> and Long Beach have been seeking to implement and expand<br />
Intelligent Transportation Systems applications in and around the ports area for several<br />
years. An earlier version <strong>of</strong> the <strong>Port</strong>s Automated Traffic Management and Information<br />
System (ATMIS) was submitted to Caltrans in 1998 for inclusion in the federally<br />
designated Southern California Priority Corridor–<strong>Los</strong> <strong>Angeles</strong>/Ventura Region<br />
Intelligent Transportation Systems Deployment Plan. <strong>The</strong> <strong>Port</strong>s ATMIS has been<br />
identified in the Caltrans Statewide Goods Movement Intelligent Transportation Systems<br />
Action Plan, and is contained in Caltrans’ Global Gateways Development Program. <strong>The</strong><br />
objectives <strong>of</strong> the program are to improve major freight gateways and improve access at<br />
seaports, intermodal transfer facilities, and goods movement distribution centers.<br />
<strong>The</strong> <strong>Port</strong>s ATMIS, which will improve traffic flow for both ports as well as the adjacent<br />
regional transportation system, consists <strong>of</strong> the following components:<br />
■<br />
■<br />
■<br />
■<br />
<strong>Port</strong> Transportation Facility Security System/Emergency Response and Evacuation<br />
System,<br />
Advanced Transportation Management System,<br />
Advanced Traveler Information System, and<br />
Communication System.<br />
<strong>The</strong> following potential benefits <strong>of</strong> a <strong>Port</strong> ATMIS could be achieved:<br />
■<br />
■<br />
■<br />
■<br />
■<br />
■<br />
Improved security and safety,<br />
Improved multimodal mobility,<br />
Improved incident response time,<br />
Enhanced goods movement,<br />
Improved reliability and predictability <strong>of</strong> the transportation system, and<br />
Reduced travel delay and emissions.<br />
An ATMIS project for the ports involves regional, subregional, and local agencies;<br />
planning authorities; emergency response agencies; private information providers; and<br />
different modes <strong>of</strong> transportation, such as trucking companies and railroads. <strong>The</strong> <strong>Port</strong>s<br />
<strong>of</strong> <strong>Los</strong> <strong>Angeles</strong> and Long Beach, and the ACTA would be the primary partners for this<br />
project.<br />
Impact <strong>of</strong> Freight Rail on Air Quality<br />
Introduction<br />
As discussed in Chapter 2, approximately 50 percent <strong>of</strong> the import cargo at the <strong>Port</strong>s <strong>of</strong><br />
<strong>Los</strong> <strong>Angeles</strong> and Long Beach currently is carried by rail at some point during shipment:<br />
<strong>Port</strong> <strong>of</strong> <strong>Los</strong> <strong>Angeles</strong> July 2004<br />
Review Draft Page 40
<strong>Port</strong>wide Rail Synopsis<br />
Chapter 7. Relationship to Freight Truck Haulage<br />
■<br />
■<br />
■<br />
■<br />
16 percent is loaded on rail at the docks;<br />
9 percent is trucked to rail loading sites within 8 miles <strong>of</strong> the docks;<br />
14 percent is trucked to rail loading sites located 8 to 22 miles from the docks; and<br />
11 percent is trucked to warehouses and then trucked to rail facilities.<br />
<strong>The</strong> other 50 percent <strong>of</strong> the cargo is trucked on roadways to its destination:<br />
■<br />
■<br />
■<br />
32 percent is loaded on dock and trucked directly to regional markets (i.e., markets<br />
within 550 miles <strong>of</strong> the <strong>Port</strong>);<br />
18 percent is trucked to warehouses or distribution centers and then trucked to<br />
regional markets; and<br />
Less than 1 percent is loaded on dock and trucked to markets outside the region.<br />
This chapter summarizes the regulations and policies that apply to air emissions from<br />
trains and trucks, summarizes a draft 2001 baseline emissions inventory for the <strong>Port</strong>,<br />
compares the air quality effects <strong>of</strong> train and truck transport based on a study <strong>of</strong> the South<br />
Coast Air Basin, and examines the potential for air quality benefits from increasing the<br />
proportion <strong>of</strong> import cargo moved from the <strong>Port</strong> by rail.<br />
Air Quality Regulations and Policies<br />
It has long been recognized that emissions from trains and trucks can significantly affect<br />
air quality locally and regionally. For example, the South Coast Air Quality<br />
Management District (SCAQMD) estimates that on‐road heavy‐duty diesel trucks<br />
generate nearly 20 percent <strong>of</strong> the regional summertime emission <strong>of</strong> oxides <strong>of</strong> nitrogen<br />
(NOx) (SCAQMD 2003). Trains generate proportionately fewer emissions (roughly 4<br />
percent <strong>of</strong> the regionʹs NOx) but can have proportionately more localized impacts<br />
because their emissions are generated along a relatively small number <strong>of</strong> rail corridors.<br />
To control and reduce emissions from both sources, the U.S. Environmental Protection<br />
Agency (EPA) has promulgated and the California Air Resources Board (CARB) has<br />
implemented regulations that set emission standards for pollutants from vehicles. <strong>The</strong><br />
standards are for the major constituents <strong>of</strong> tailpipe emissions, including: NOx, volatile<br />
organic compounds (VOC), carbon monoxide (CO), hydrocarbons (HC), sulfur dioxide<br />
(SOx), and particulate matter less than 10 microns in diameter (PM10). EPA and CARB<br />
also have adopted non‐regulatory policies that encourage voluntary emission reductions.<br />
Emission Standards for Locomotives<br />
In 1998, EPA promulgated final emission standards (40 CFR Part 92, Control <strong>of</strong> Emissions<br />
from Locomotives and Locomotive Engines) for NOx, HC, CO, and PM10. <strong>The</strong> standards<br />
limit emissions from newly manufactured engines and from refurbished or<br />
remanufactured engines. <strong>The</strong> specific emission limits and the time schedule for<br />
complying with the limits were based on three tiers. Tier 0 standards (the least stringent)<br />
apply to locomotives built between 1973 and 2001 and require compliance with the<br />
<strong>Port</strong> <strong>of</strong> <strong>Los</strong> <strong>Angeles</strong> July 2004<br />
Review Draft Page 41
<strong>Port</strong>wide Rail Synopsis<br />
Chapter 7. Relationship to Freight Truck Haulage<br />
emission limits when the engines are remanufactured. Tier 1 standards apply to<br />
locomotives built between 2002 and 2004 and require immediate compliance upon<br />
remanufacture. Tier 2 standards (the most stringent) will apply to engines built in 2005<br />
and will apply immediately. Compared to other EPA emission standards, those for<br />
locomotives are less stringent. For example, the most stringent NOx standard for<br />
locomotives will be 5.5 g/hp‐hr in 2005; the 2007 NOx standard for heavy‐duty diesel<br />
trucks will be 0.20 g/hp‐hr. EPA has indicated that it may propose Tier 3 standards for<br />
locomotives, perhaps in 2004. However, the timing and details <strong>of</strong> such standards is<br />
uncertain at this time.<br />
Emission Standards for On-road Heavy-duty Diesel Trucks<br />
In 2000, EPA enacted the most recent, and most stringent, emission limits for on‐road<br />
heavy‐duty diesel trucks. <strong>The</strong> newest limits augment the steadily more stringent<br />
emission standards that EPA enacted between 1990 and 2004. <strong>The</strong> new standards will be<br />
phased in for new trucks manufactured between 2007 and 2010. <strong>The</strong> new emission<br />
standards for NOx and HC are reduced to 0.20 g/hp‐hr and 0.14 g/hp‐hr, respectively.<br />
EPAʹs regulation also requires manufacturers <strong>of</strong> diesel fuel to greatly reduce the sulfur<br />
content <strong>of</strong> the fuel because existing sulfur content in diesel fuel would preclude the use<br />
<strong>of</strong> efficient NOx and HC control equipment that will be required to comply with the<br />
stringent new emission limits.<br />
Voluntary Emission Reduction Policies<br />
SCAQMD has no authority to enact emission standards for locomotives or diesel trucks<br />
that are more stringent than the new EPA standards. However, the <strong>Port</strong> has worked<br />
with the air regulatory agencies to enact the following voluntary emission reduction<br />
policies to reduce cargo shipping emissions to below what would be accomplished solely<br />
by complying with regulatory limits.<br />
■<br />
■<br />
■<br />
Carl Moyer Diesel Engine Program. CARB and the regional air quality districts have<br />
implemented voluntary programs to encourage diesel truck operators to accelerate<br />
the replacement <strong>of</strong> older, high‐emission equipment with newer, low‐emission<br />
equipment. <strong>The</strong>se voluntary programs will not change the future emission standards<br />
or the long‐term regional emissions. However, they are expected to significantly<br />
increase the rate <strong>of</strong> future emission reductions from on‐road diesel trucks and<br />
thereby reduce the near‐future regional emission rates, compared to the rates <strong>of</strong><br />
improvement that EPA has forecasted nationwide.<br />
South Coast Locomotive Fleet Average Emissions Program. In July 1998, the<br />
railroads and CARB entered into a Memorandum <strong>of</strong> Mutual Understanding and<br />
Agreements to accelerate the schedule by which locomotives would comply with<br />
EPA emission standards. <strong>The</strong> railroads have committed that all locomotives serving<br />
the <strong>Port</strong> will comply with EPAʹs Tier 2 locomotive emission standards by 2010.<br />
Gateway Cities Air Quality Improvement Program. Under this program, commercial<br />
truck owners who trade in their older diesel trucks for newer models with cleanerburning<br />
engines are partially reimbursed for the cost <strong>of</strong> purchasing newer diesel<br />
trucks. This is part <strong>of</strong> a pilot program that is exploring a variety <strong>of</strong> ways to reduce<br />
diesel emissions in southeast <strong>Los</strong> <strong>Angeles</strong> County and throughout the South Coast<br />
<strong>Port</strong> <strong>of</strong> <strong>Los</strong> <strong>Angeles</strong> July 2004<br />
Review Draft Page 42
<strong>Port</strong>wide Rail Synopsis<br />
Chapter 7. Relationship to Freight Truck Haulage<br />
Air Basin. <strong>The</strong> program compensates owners <strong>of</strong> 1983 or older trucks when they buy<br />
a 1994 or newer used diesel truck that is more reliable, cleaner, and fuel efficient. An<br />
average grant is $20,000 to $25,000, and varies depending on the age <strong>of</strong> the truck and<br />
number <strong>of</strong> miles driven in the past 2 years. As an example, a typical used diesel<br />
truck costs about $35,000. Under the Clean Air Program, an owner could be<br />
reimbursed up to $25,000.<br />
Draft 2001 Baseline Emission Inventory<br />
In June 2004, the <strong>Port</strong> completed a draft <strong>Port</strong>wide baseline emission inventory using 2001<br />
data (2001 BEI). <strong>The</strong> 2001 BEI provides emission estimates for all significant sources<br />
operating in the <strong>Port</strong>, with a focus on diesel particulate matter. Five source categories are<br />
considered: ocean‐going vessels, harbor craft (e.g., tugboats, ferries, commercial fishing<br />
vessels, and dredges), <strong>of</strong>f‐road cargo handling equipment, railroad locomotives, and onroad<br />
heavy‐duty diesel trucks. <strong>The</strong> inventory does not include stationary sources, as<br />
these are included in stationary source permitting programs administered by SCAQMD.<br />
In the 2001 BEI, railroad operations are typically described in terms <strong>of</strong> line haul and<br />
switching. Because <strong>of</strong> different types <strong>of</strong> information provided by the railroad companies,<br />
emissions were estimated using two basic methods. For most <strong>of</strong> the switching activities,<br />
emission estimates were based on the percentage <strong>of</strong> time spent in the different throttle<br />
notch settings. This information was obtained from onboard observations <strong>of</strong> switch<br />
engine operations during normal shift duties and from onboard dataloggers. For linehaul<br />
activities (and a limited amount <strong>of</strong> switching activity), fuel usage was used as a<br />
surrogate measure <strong>of</strong> the level <strong>of</strong> activity <strong>of</strong> the locomotives. EPA has published<br />
emissions information for switch and line‐haul locomotive operations in both throttle<br />
notch and fuel consumption modes, and this information was used to crosscheck<br />
between the estimating methods to demonstrate the degree <strong>of</strong> agreement.<br />
Emissions from heavy‐duty diesel trucks were calculated for on‐road (<strong>of</strong>f‐terminal) travel<br />
and on‐terminal operations. Data for on‐road activity were developed by Meyer,<br />
Mohaddes Associates, Inc. (MMA), using trip generation and travel demand models in<br />
previous <strong>Port</strong> traffic studies. A <strong>Port</strong>‐specific model for year distribution was developed<br />
by CARB and SCAQMD. On‐terminal emissions were estimated using information from<br />
terminal operators regarding traffic patterns, including time spent waiting at the entry<br />
gate, time and distance on terminal while dropping <strong>of</strong>f and/or picking up cargo, and time<br />
spent waiting at exit gates. Off‐ and on‐terminal emissions were estimated by<br />
multiplying the appropriate emission factor derived from EMFAC 2002 by the time and<br />
distance parameters established for the terminals.<br />
Results <strong>of</strong> the 2001 BEI are summarized in <strong>Table</strong>s 7‐3 and 7‐4 in terms <strong>of</strong> tons per year<br />
and tons per day, respectively. <strong>The</strong>se estimates include emissions related to: 1) <strong>Port</strong><br />
operations occurring within the <strong>Port</strong> boundary/district (in‐port) and 2) the transportation<br />
<strong>of</strong> <strong>Port</strong>‐related cargo within the South Coast Air Basin (regional). In summary, the oceangoing<br />
vessels account for the largest percentage <strong>of</strong> emission for every pollutant except<br />
CO. Railroad locomotives account for 13 percent <strong>of</strong> the NOx, 9 percent <strong>of</strong> the TOG, 6<br />
percent <strong>of</strong> the CO, 6 percent <strong>of</strong> the PM10, and less than 2 percent <strong>of</strong> the SOx baseline<br />
emissions. On‐road heavy‐duty diesel trucks account for 23 percent <strong>of</strong> the NOx, 17<br />
<strong>Port</strong> <strong>of</strong> <strong>Los</strong> <strong>Angeles</strong> July 2004<br />
Review Draft Page 43
<strong>Port</strong>wide Rail Synopsis<br />
Chapter 7. Relationship to Freight Truck Haulage<br />
percent <strong>of</strong> the TOG, 21 percent <strong>of</strong> the CO, 9 percent <strong>of</strong> the PM10, and less than 1 percent<br />
<strong>of</strong> the SOx baseline emissions.<br />
Comparison <strong>of</strong> Rail and Truck Emissions<br />
In March 2004, the Association <strong>of</strong> American Railroads released a report by L.S. Caretto<br />
entitled, A Comparison <strong>of</strong> Rail and Truck Emissions per Ton‐Mile <strong>of</strong> Freight. In the<br />
report, Caretto estimates and compares air emissions from truck and rail sources in the<br />
South Coast Air Basin and San Joaquin Valley Air Basin for the period from 2000 to 2012.<br />
<strong>The</strong> estimates in the report take into account Tier 0, 1, and 2 standards for locomotives<br />
and Tier 1, 2, and 3 standards for heavy‐duty diesel trucks. For the South Coast Air<br />
Basin, Caretto also takes into account the Memorandum <strong>of</strong> Understanding between<br />
CARB and railroads regarding average fleet emissions. Under the Memorandum <strong>of</strong><br />
Understanding, the railroads have agreed that average emission levels for their fleets will<br />
not exceed the Tier 2 NOx limit for calendar year 2010 and beyond.<br />
<strong>Port</strong> <strong>of</strong> <strong>Los</strong> <strong>Angeles</strong> July 2004<br />
Review Draft Page 44
<strong>Port</strong>wide Rail Synopsis Chapter 7. Relationship to Freight Truck Haulage<br />
<strong>Table</strong> 7-3. 2001 <strong>Port</strong>wide Emissions by Source Category, Tons Per Year<br />
NOx TOG CO PM 10 PM25 SOx<br />
In-<strong>Port</strong> Regional In-<strong>Port</strong> Regional In-<strong>Port</strong> Regional In-<strong>Port</strong> Regional In-<strong>Port</strong> Regional In-<strong>Port</strong> Regional<br />
Ocean-going Vessels 1,967.6 6,922.7 55.6 233.6 159.8 553.9 43.7 531.9 35.0 426.6 1,098.5 4,117.5<br />
Harbor Craft<br />
1,968.0 3,530.7 172.2 376.0 701.5 1,622.8 99.7 178.0 91.7 163.7 152.0 506.4<br />
Cargo Handling Equipment 1,862.6 1,862.6 204.5 204.5 725.5 725.5 111.6 111.6 102.6 102.6 44.1 44.1<br />
Railroad Locomotives 445.9 2,465.8 17.0 99.7 49.6 249.4 9.9 60.1 9.1 55.2 3.1 89.8<br />
On-road Heavy Duty Trucks 872.5 4,463.5 53.1 185.5 246.0 815.3 24.4 87.9 22.4 77.9 6.1 33.6<br />
Total 7,116.6 19,245.3 502.4 1,099.2 1,882.4 3,966.9 289.3 969.5 260.8 826.0 1,303.8 4,791.4<br />
<strong>Table</strong> 7-4. 2001 <strong>Port</strong>wide Emissions by Source Category, Tons Per Day<br />
NOx TOG CO PM 10 PM25 SOx<br />
In-<strong>Port</strong> Regional In-<strong>Port</strong> Regional In-<strong>Port</strong> Regional In-<strong>Port</strong> Regional In-<strong>Port</strong> Regional In-<strong>Port</strong> Regional<br />
Ocean-going Vessels<br />
5.4 19.0 0.2 0.6 0.4 1.5 0.1 1.5 0.1 1.2 3.0 11.3<br />
Harbor Craft<br />
5.4 9.7 0.5 1.0 1.9 4.4 0.3 0.5 0.3 0.4 0.4 1.4<br />
Cargo Handling Equipment 3.1 5.1 0.6 0.6 2.0 2.0 0.3 0.3 0.3 0.3 0.1 0.1<br />
Railroad Locomotives 1.2 6.8 0.0 0.3 0.1 0.7 0.0 0.2 0.0 0.2 0.0 0.2<br />
On-road Heavy Duty Trucks 2.4 12.2 0.1 0.5 0.7 2.2 0.1 0.2 0.1 0.2 0.0 0.1<br />
Total 19.5 52.7 1.4 3.0 5.2 10.9 0.8 2.7 0.7 2.3 3.6 13.1<br />
<strong>Port</strong> <strong>of</strong> <strong>Los</strong> <strong>Angeles</strong> July 2004<br />
Review Draft Page 45
<strong>Port</strong>wide Rail Synopsis<br />
Chapter 7. Relationship to Freight Truck Haulage<br />
In Caretto’s report, emissions per ton‐mile <strong>of</strong> cargo were computed separately for trucks<br />
and rail using the different sets <strong>of</strong> data available for these two modes. Emissions from<br />
trucks were based on the CARB mobile source emission model, EMFAC 2002. Rail<br />
emissions were based on projections for rail operations in the regulatory support<br />
document prepared by EPA. Truck emission data were converted to grams per ton‐mile<br />
based on average cargo load as determined by Caltrans surveys. Rail emission data were<br />
converted to gram per ton‐mile based on data from Association <strong>of</strong> American Railroads<br />
on revenue ton‐miles per gallon <strong>of</strong> fuel for rail operation.<br />
Results <strong>of</strong> the comparison <strong>of</strong> emissions for the period in the South Coast Air Basin are<br />
summarized in <strong>Table</strong> 7‐5 and Figures 7‐2 through 7‐5. Key points are as follows:<br />
1. Emissions per ton‐mile from rail cargo are less than those from truck cargo.<br />
2. Although trends are different for different pollutants, there is a general decrease in<br />
emissions for both trucks and rail over the period as standards are tightened.<br />
3. Because the standards for trucks during the period are more stringent than those for<br />
locomotives, truck emissions show a faster decrease than rail emissions between 2000<br />
and 2012. <strong>The</strong> difference between truck and rail emissions narrows over the period,<br />
largely due to the Tier 3 NOx and PM standards for trucks.<br />
Caretto also notes the possibility that new technology capable <strong>of</strong> reducing emissions<br />
from both truck and rail may be available around 2010. For example, railroads and<br />
manufacturers are looking at the possibility <strong>of</strong> hybrid locomotives that could reduce fuel<br />
consumption and hence certain emissions. Railroads also are looking at using truck<br />
engines (which are subject to stricter emission standards) for road switch locomotives.<br />
<strong>Table</strong> 7-5. Estimated Annual Average Tons Per Day <strong>of</strong> Emissions from Rail and<br />
Heavy-duty Diesel Trucks, South Coast Air Basin, 2000 and 2010<br />
Source Year NOx PM10 VOC CO<br />
Rail<br />
Trucks<br />
2000 41.2 1.0 1.8 6.2<br />
2010 17.9 0.9 1.7 7.0<br />
2000 226.7 4.8 7.8 37.7<br />
2010 160.2 3.5 6.6 30.2<br />
Source: Caretto 2004.<br />
Potential for Air Quality Benefits from Increased Use <strong>of</strong> Rail Cargo<br />
As described in Chapter 2, rail traffic to and from the <strong>Port</strong> travels along the consolidated<br />
rail line in the Alameda Corridor. Improvements to the corridor consolidated three<br />
separated at‐grade rail lines into a single, grade‐separated line running from the <strong>Port</strong>s <strong>of</strong><br />
<strong>Los</strong> <strong>Angeles</strong> and Long Beach to a rail yard in downtown <strong>Los</strong> <strong>Angeles</strong>. <strong>The</strong> fully gradeseparated<br />
line allows trains to move through the area more efficiently and at a greater<br />
speed. <strong>The</strong> grade separation also eliminates traffic delays that used to occur at grade<br />
crossings when trains passed.<br />
<strong>Port</strong> <strong>of</strong> <strong>Los</strong> <strong>Angeles</strong> July 2004<br />
Review Draft Page 46
<strong>Port</strong>wide Rail Synopsis<br />
Chapter 7. Relationship to Freight Truck Haulage<br />
Due to the greater efficiency <strong>of</strong> a consolidated line, the <strong>Port</strong> estimates that NOx emissions<br />
from locomotives in the corridor have decreased by more than 182 tons per year (based<br />
on 2002 usage <strong>of</strong> the corridor). <strong>The</strong> elimination <strong>of</strong> crossing delays also has reduced NOx<br />
emissions from motor vehicles in the corridor by approximately 28 tons per year.<br />
A key issue now being considered by the <strong>Port</strong> is whether increased use <strong>of</strong> rail cargo<br />
would have additional air quality benefits locally and/or regionally. Increasing the<br />
proportion <strong>of</strong> cargo shipped by rail to and from the ports has the potential to reduce the<br />
total truck trips associated with the shipments and therefore the total emissions from<br />
those trips. However, emission reductions and other air quality benefits will depend on<br />
several factors, including:<br />
■<br />
■<br />
■<br />
■<br />
■<br />
■<br />
<strong>The</strong> amount and proportion <strong>of</strong> the increased use <strong>of</strong> on‐dock rail versus rail that<br />
requires trucking to a rail site and/or an intermediary storage/distribution site;<br />
<strong>The</strong> ability <strong>of</strong> existing rail and transfer sites to handle increased usage and potentially<br />
to increase capacity;<br />
<strong>The</strong> ability <strong>of</strong> (and incentives for) cargo carriers and receivers to change current<br />
shipment patterns;<br />
<strong>The</strong> time required to implement changes;<br />
<strong>The</strong> narrowing <strong>of</strong> differences between train and truck emissions as Tier 3 truck<br />
standards take effect, especially if Tier 3 standards for locomotives are not enacted in<br />
the near future; and<br />
<strong>The</strong> success or failure <strong>of</strong> the <strong>Port</strong> and region in meeting emission standards set for<br />
other pollutant sources, especially given the contribution from sources not within the<br />
control <strong>of</strong> the <strong>Port</strong> or region.<br />
Impact <strong>of</strong> Freight Rail on Roadway Congestion<br />
Traffic volumes on roadways and highways in Southern California are expected to<br />
continue to increase steadily over the next 20 years. <strong>The</strong> <strong>Port</strong> Baseline Transportation<br />
Study provides a detailed assessment <strong>of</strong> both existing and projected future conditions on<br />
the regional roadways that are most impacted by <strong>Port</strong> operations, and provides<br />
recommendations for roadway improvements that should allow future roadways to<br />
operate at adequate LOS.<br />
Any cargo that is hauled by train instead <strong>of</strong> truck will help alleviate traffic congestion,<br />
and will benefit both regional freight and passenger mobility. Shifting cargo shipments<br />
from truck to rail would reduce the number <strong>of</strong> required haul trucks operating<br />
throughout the region, resulting in the following advantages to users <strong>of</strong> the regional<br />
transportation system and the agencies that maintain it:<br />
■<br />
Elimination <strong>of</strong> truck trips from the regional roadway system reduces demand on the<br />
existing infrastructure, which would result in some improvement <strong>of</strong> traffic<br />
congestion.<br />
<strong>Port</strong> <strong>of</strong> <strong>Los</strong> <strong>Angeles</strong> July 2004<br />
Review Draft Page 47
45<br />
2000 2010<br />
40<br />
Rail Emissions (tons per day)<br />
35<br />
30<br />
25<br />
20<br />
15<br />
10<br />
5<br />
Source: Caretto 2004<br />
0<br />
NOx PM10 VOC CO<br />
Figure 7-2<br />
Estimated Annual Average Tons Per Day <strong>of</strong> Rail Emissions,<br />
South Coast Air Basin, 2000 and 2010<br />
250<br />
2000 2010<br />
Truck Emissions (tons per day)<br />
200<br />
150<br />
100<br />
50<br />
04320.04-001<br />
Source: Caretto 2004<br />
0<br />
NOx PM10 VOC CO<br />
Figure 7-3<br />
Estimated Annual Average Tons Per Day <strong>of</strong> Truck Emissions,<br />
South Coast Air Basin, 2000 and 2010
1.4<br />
1.2<br />
NOx Emissions (g/ton-mile)<br />
1.0<br />
0.8<br />
0.6<br />
0.4<br />
0.2<br />
Truck NOx<br />
Rail NOx<br />
0.0<br />
2000 2002 2004 2006 2008 2010 2012<br />
Calendar Year<br />
Source: Caretto 2004<br />
Figure 7-4<br />
Estimated NOX Emissions Per Ton Mile <strong>of</strong> Rail and Truck Freight,<br />
South Coast Basin, 2000-2012<br />
0.025<br />
0.020<br />
PM Emissions (g/ton-mile)<br />
0.015<br />
0.010<br />
0.005<br />
Truck PM<br />
Rail PM<br />
04320.04-001<br />
Source: Caretto 2004<br />
0.000<br />
2000 2002 2004 2006 2008 2010 2012<br />
Calendar Year<br />
Figure 7-5<br />
Estimated PM10 Emissions Per Ton Mile <strong>of</strong> Rail and Truck Freight,<br />
South Coast Basin, 2000-2012
<strong>Port</strong>wide Rail Synopsis<br />
Chapter 7. Relationship to Freight Truck Haulage<br />
■<br />
■<br />
■<br />
Reduction <strong>of</strong> traffic congestion increases travel speed and reliability for both<br />
passenger users and the remaining cargo users <strong>of</strong> the regional roadways.<br />
Elimination <strong>of</strong> truck trips from the regional roadway system can have significant<br />
impact on lengthening the functional design life <strong>of</strong> roadway pavement.<br />
As rail operates within exclusive right‐<strong>of</strong>‐way, cargo that is shipped via rail will<br />
travel with speed and reliability that is not hindered by local roadway conditions.<br />
Chapter 2 discusses the approximate traffic volumes <strong>of</strong> trains versus trucks that are<br />
required to carry a shipload <strong>of</strong> container cargo, indicates that the shift <strong>of</strong> cargo to one<br />
train can eliminate as many as 700 truck trips from the regional roadways, and that a<br />
shipload <strong>of</strong> cargo can fill up five trains, which in turn could eliminate up to 3,500 truck<br />
trips. <strong>The</strong>se volumes are even more substantial when considered in the context <strong>of</strong><br />
passenger car equivalents (PCEs).<br />
PCEs <strong>of</strong> trucks and other heavy vehicles are considered for both LOS analysis and<br />
roadway pavement design and analysis. <strong>The</strong>se PCE factors account for the larger<br />
roadway space used by trucks, their heavier weights, and their slower acceleration rates,<br />
which result in a greater use <strong>of</strong> roadway capacity. As their name implies, PCEs provide<br />
an estimate <strong>of</strong> the approximate numbers <strong>of</strong> passenger car capacity that one truck utilizes.<br />
As trucks vary in size and weight, so do their exact PCEs; the PCE <strong>of</strong> a typical truck is<br />
most generally used for LOS analysis. <strong>Table</strong> 7‐6 summarizes PCEs for trucks that are<br />
utilized for freeway LOS analysis under Highway Capacity Manual procedures. <strong>The</strong><br />
table shows PCEs as a function <strong>of</strong> the roadway grades that characterize the surrounding<br />
terrain since steep grades tend to magnify the performance inferiority <strong>of</strong> heavy vehicles.<br />
<strong>Table</strong> 7-6. Passenger Car Equivalents for LOS Effects <strong>of</strong> Trucks on Freeways<br />
Type <strong>of</strong> Terrain<br />
Level 1.7<br />
Rolling 4.0<br />
Mountainous 8.0<br />
Source: Transportation Research Board 2000.<br />
Passenger Car Equivalent for Trucks<br />
<strong>Table</strong> 7‐6 shows that for LOS analysis, the PCE <strong>of</strong> trucks is considered to range between<br />
1.7 and 8.0, depending on the type <strong>of</strong> surrounding terrain. For the <strong>Port</strong> Baseline<br />
Transportation Study, PCE factors for intersection operations were assumed using<br />
previously applied factors used in <strong>Port</strong> studies <strong>of</strong> 2.0 for container trucks, 2.0 for chassis,<br />
and 1.1 for bobtails. For the Vincent Thomas Bridge analysis, higher PCE factors are<br />
applied to account for the grade <strong>of</strong> the bridge structure.<br />
For pavement design and analysis, the Equivalent Single Axle Load <strong>of</strong> projected truck<br />
traffic is considered. Similar in concept to the PCE, the Equivalent Single Axle Load is<br />
calculated based on specific truck volumes and mix <strong>of</strong> truck types (defined by number <strong>of</strong><br />
<strong>Port</strong> <strong>of</strong> <strong>Los</strong> <strong>Angeles</strong> July 2004<br />
Review Draft Page 48
<strong>Port</strong>wide Rail Synopsis<br />
Chapter 7. Relationship to Freight Truck Haulage<br />
axles and typical loads) expected to use a roadway. Typical Equivalent Single Axle Load<br />
values can range between 1.5 and 6.0.<br />
Utilizing a conservative equivalency factor <strong>of</strong> 2.0 (the estimated volume <strong>of</strong> 3,500 truck<br />
trips that a shipload <strong>of</strong> cargo shifted to rail would eliminate) can be considered<br />
comparable to elimination <strong>of</strong> approximately 7,000 passenger cars from the roadway<br />
system. Truck trips generated by the <strong>Port</strong> would be expected to be more concentrated on<br />
the roadways that are located near <strong>Port</strong> facilities, and become increasingly dispersed as<br />
distances from the <strong>Port</strong> increase. Dispersion <strong>of</strong> truck traffic on the roadway system is<br />
very difficult to estimate without the development <strong>of</strong> a regional transportation model<br />
(similar to the model developed for analysis presented in the <strong>Port</strong> Baseline<br />
Transportation Study). However, the general effect <strong>of</strong> change in traffic volumes on LOS<br />
can be assessed by considering typical traffic conditions under increasing traffic volumes.<br />
<strong>Table</strong> 7‐7 summarizes the general operational performance characteristics for different<br />
LOS conditions <strong>of</strong> a freeway segment, assuming ideal conditions and a free‐flow speed <strong>of</strong><br />
70 mph. A freeway under ideal conditions has full 12‐foot lane widths, full shoulders<br />
that are at least 6 feet wide, and no heavy vehicles.<br />
<strong>Table</strong> 7‐7 presents typical thresholds for a roadway built to freeway standards. For other<br />
roadways with lower functional classification (i.e., highways with no access control, and<br />
urban arterials and collectors) the traffic volume thresholds for each LOS condition are<br />
lower.<br />
<strong>Table</strong> 7-7. LOS for Basic Freeway Sections<br />
Level<br />
<strong>of</strong><br />
Service<br />
Flow<br />
Condition<br />
V/C Limit<br />
Volume<br />
(veh. lane/hour)<br />
Average Speed<br />
(miles/hour)<br />
A Free 0.35 700 ≥ 60 ≤ 12<br />
B Stable 0.54 1,100 ≥ 57 ≤ 20<br />
C Stable 0.77 1,550 ≥ 54 ≤ 30<br />
D High Density 0.93 1,850 ≥ 46 ≤ 40<br />
E Near Capacity 1.00 2,000 ≥ 30 ≤ 67<br />
F Breakdown Unstable < 30 > 67<br />
Source: May 1990.<br />
Density<br />
(veh./mile/lane)<br />
Even if the generation <strong>of</strong> 7,000 equivalent passenger car trips occurred over several hours<br />
and were distributed over numerous roadways, the thresholds shown in <strong>Table</strong> 7‐7<br />
indicate that absence or presence <strong>of</strong> this level <strong>of</strong> additional traffic on the roadway system<br />
could have considerable effect on the roadway LOS, particularly in the roadways located<br />
near the <strong>Port</strong>, where the cargo truck traffic would be more concentrated. Any increase in<br />
the use <strong>of</strong> rail for cargo transport will have a favorable impact on roadway LOS by<br />
eliminating some truck traffic from the regional roadway system.<br />
<strong>Port</strong> <strong>of</strong> <strong>Los</strong> <strong>Angeles</strong> July 2004<br />
Review Draft Page 49
Chapter 8. Conclusion<br />
Cargo movement into and out <strong>of</strong> the <strong>Port</strong> is a very complex process, and the amount <strong>of</strong><br />
cargo that can be moved through the <strong>Port</strong> depends upon many factors. Market analysis<br />
projects that cargo demand at the <strong>Port</strong> will increase substantially over the next 15 to 20<br />
years. However, the amount <strong>of</strong> cargo throughput that can be feasibly served by the <strong>Port</strong><br />
is restricted not only by logistical and operational constraints, but also by the capacity <strong>of</strong><br />
the transportation system. Technical studies have been completed that identify physical<br />
and operational improvements that will need to be made to the regional rail system,<br />
roadway system, and cargo storage and transfer facilities in order for the <strong>Port</strong> to meet<br />
expected future cargo demand.<br />
Forecasts project that 50 percent <strong>of</strong> future <strong>Port</strong> cargo will be carried by rail. To meet this<br />
future intermodal demand, expansion <strong>of</strong> the rail yards and cargo transfer facilities, and<br />
the development <strong>of</strong> new near‐dock capacity is recommended. In addition, track<br />
improvements and operational improvements are recommended so that the railroad<br />
system can accommodate the volumes <strong>of</strong> trains that will be needed to transport projected<br />
intermodal cargo.<br />
Maximizing the use <strong>of</strong> on‐dock and near‐dock ICTFs is beneficial because it allows for<br />
more cargo to be carried by rail, which translates to less cargo being carried by trucks.<br />
Any truck traffic that can be eliminated from the regional roadway system will have a<br />
beneficial impact on roadway congestion. Increased use <strong>of</strong> rail can also have a beneficial<br />
impact on air quality, but in order for long‐term air quality benefits to be fully realized,<br />
the implementation <strong>of</strong> the stricter Tier 3 emissions standards may be needed.<br />
<strong>The</strong> technical reports that are described in this synopsis primarily consist <strong>of</strong> preliminary<br />
and planning‐level analyses. Together they provide a comprehensive examination <strong>of</strong> the<br />
existing capabilities and future needs <strong>of</strong> the transportation system that serves the <strong>Port</strong>.<br />
For the rail system evaluation, the next steps that are recommended are completion <strong>of</strong><br />
operator interviews and sensitivity analyses to verify the assumptions that underlie the<br />
improvement recommendations, and to conduct more detailed siting and financial<br />
analyses <strong>of</strong> the potential near‐dock ICTF and rail yard expansions (<strong>Port</strong> <strong>of</strong> <strong>Los</strong> <strong>Angeles</strong><br />
2004c). However, a sufficient level <strong>of</strong> analysis has been completed to date to indicate that<br />
the <strong>Port</strong> does have the potential capacity to meet the intermodal demand that has been<br />
identified between now and 2020.<br />
<strong>Port</strong> <strong>of</strong> <strong>Los</strong> <strong>Angeles</strong> July 2004<br />
Review Draft Page 50
References<br />
Printed References<br />
Alameda Corridor transportation Authority (ACTA). 2004. Fact Sheet. Available at:<br />
. Accessed: February and May 2004.<br />
Caretto, L. S. 2004. A Comparison <strong>of</strong> Rail and Truck Emissions Per Ton‐Mile <strong>of</strong> Freight.<br />
Prepared for the Association <strong>of</strong> American Railroads. March 30, 2004.<br />
Gesamtverband der Deutschen Versicherungswirtschaft (GDV). 2003. <strong>The</strong> Container<br />
Handbook. Available: .<br />
Accessed: July 2004<br />
JWD Group. 2002. Capacity Analysis Report. November 2002.<br />
<strong>Los</strong> <strong>Angeles</strong> Harbor Department. 2004. Draft Environmental Impact Report, Berth 206‐<br />
209 Interim Container Reuse Project. SCH: 2003111044. Environmental Management<br />
Division with assistance from CH2M Hill. May 2004.<br />
May, Adolph D. 1990. Traffic Flow Fundamentals. Prentice‐Hall, Inc. Englewood Cliffs,<br />
NJ.<br />
Mercer Management Consulting. 2001. San Pedro Bay <strong>Port</strong>s Long‐Term Cargo Forecast.<br />
July 2001.<br />
<strong>Port</strong> <strong>of</strong> <strong>Los</strong> <strong>Angeles</strong>. 2003a. <strong>Port</strong> <strong>of</strong> <strong>Los</strong> <strong>Angeles</strong> Facilities Guide. 425 South Palos Verdes<br />
Street, P.O. Box 151. San Pedro, CA 90733‐0151.<br />
<strong>Port</strong> <strong>of</strong> <strong>Los</strong> <strong>Angeles</strong>. 2003b. <strong>Port</strong> <strong>of</strong> <strong>Los</strong> <strong>Angeles</strong> Rail Capacity Analysis. Prepared for<br />
the <strong>Port</strong> <strong>of</strong> <strong>Los</strong> <strong>Angeles</strong> by DMJM+Harris. March.<br />
<strong>Port</strong> <strong>of</strong> <strong>Los</strong> <strong>Angeles</strong>. 2003c. Draft <strong>Port</strong> <strong>of</strong> <strong>Los</strong> <strong>Angeles</strong> Baseline Transportation Study.<br />
Report No. JO2‐0028. Prepared for the <strong>Port</strong> <strong>of</strong> <strong>Los</strong> <strong>Angeles</strong> by Meyer, Mohaddes<br />
Associates, Inc. December.<br />
<strong>Port</strong> <strong>of</strong> <strong>Los</strong> <strong>Angeles</strong>. 2004a. Available at: . Accessed:<br />
February and March 2004.<br />
<strong>Port</strong> <strong>of</strong> <strong>Los</strong> <strong>Angeles</strong>. 2004b. Facts and figures. Available:<br />
. Accessed: June 2004.<br />
<strong>Port</strong> <strong>of</strong> <strong>Los</strong> <strong>Angeles</strong>. 2004c. San Pedro Bay <strong>Port</strong>s Market Study. Draft Report. Prepared<br />
for the <strong>Port</strong> <strong>of</strong> <strong>Los</strong> <strong>Angeles</strong> by Parsons Transportation Group. April.<br />
South Coast Air Quality Management District (SCAQMD). 2003. 2003 Air Quality<br />
Management Plan. August.<br />
<strong>Port</strong> <strong>of</strong> <strong>Los</strong> <strong>Angeles</strong> July 2004<br />
Review Draft Page 51
<strong>Port</strong>wide Rail Synopsis<br />
Chapter 8. References<br />
Transportation Research Board (TRB). 2000. Highway Capacity Manual (HCM). Special<br />
Report 209. National Research Council. Washington, DC.<br />
White, Ronald D. 2004. “New Containerships in It for the Big Haul.” <strong>Los</strong> <strong>Angeles</strong> Times<br />
(<strong>Los</strong> <strong>Angeles</strong>, CA). Page C1. June 1, 2004.<br />
Personal Communications<br />
DiBernardo, Michael. Marketing Manager. <strong>Port</strong> <strong>of</strong> <strong>Los</strong> <strong>Angeles</strong>. Email—July 6, 2004.<br />
Leue, Michael. Parsons Transportation Group. Email—July 3, 2004.<br />
<strong>Port</strong> <strong>of</strong> <strong>Los</strong> <strong>Angeles</strong> July 2004<br />
Review Draft Page 52
Glossary <strong>of</strong> Terms<br />
Term<br />
Alameda Corridor<br />
Backlands<br />
Badger Bridge<br />
BNSF Watson Yard<br />
Bobtail<br />
Centralized Traffic Control<br />
(CTC)<br />
Chassis<br />
CP Mole<br />
CP West <strong>The</strong>nard<br />
Dolores Yard<br />
Double‐stacked Car<br />
(DS‐car)<br />
East LA<br />
Definition<br />
A 20‐mile rail expressway that runs from the <strong>Port</strong>s <strong>of</strong> <strong>Los</strong><br />
<strong>Angeles</strong> and Long Beach to downtown <strong>Los</strong> <strong>Angeles</strong>,<br />
primarily along and adjacent to Alameda Street.<br />
Container storage areas.<br />
Rail Bridge that connects Terminal Island to the mainland<br />
BNSF rail yard in Wilmington near PCH (between<br />
Sanford and Eubank avenues).<br />
Truck cab without a trailer.<br />
A system <strong>of</strong> railroad operation by which the movement <strong>of</strong><br />
trains over routes and through blocks on a designated<br />
section <strong>of</strong> track is directed by signals controlled from a<br />
designated point without requiring the use <strong>of</strong> train orders<br />
and without the superiority <strong>of</strong> trains.<br />
Another word for an open trailer frame to which<br />
containers can be attached.<br />
Control Point on Terminal Island for the <strong>Port</strong> and <strong>Port</strong> <strong>of</strong><br />
Long Beach Terminal Island piers (200–400, S, T, W).<br />
Control Point at <strong>The</strong>nard Tower (0.75 mile north <strong>of</strong> PCH<br />
and Alameda).<br />
UP transfer yard located adjacent to the Alameda<br />
Corridor north <strong>of</strong> I‐405, west <strong>of</strong> Alameda Street).<br />
Articulated railcar (typically 5‐unit) that carries containers<br />
stacked two high. Equivalent to 310 feet <strong>of</strong> track.<br />
UPʹs main yard in the City <strong>of</strong> Commerce (I‐710 at I‐5).<br />
<strong>Port</strong> <strong>of</strong> <strong>Los</strong> <strong>Angeles</strong> July 2004<br />
Review Draft Page 53
<strong>Port</strong>wide Rail Synopsis<br />
Glossary<br />
Term<br />
Hobart Yard<br />
Hoot Shift<br />
Intermodal container<br />
transfer facility (ICTF)<br />
Intermodal Transport<br />
Light engine moves<br />
Manuel Yard<br />
Mode<br />
MPC Model<br />
National Market<br />
Near‐dock ICTF<br />
Non‐intermodal<br />
Off‐dock ICTF<br />
On‐dock ICTF<br />
Parking Spot<br />
Definition<br />
Main BNSF rail yard in Vernon (I‐710 between<br />
Washington and Bandini Boulevards).<br />
Work shift that occurs between the night shift and the day<br />
shift.<br />
A rail yard used to transfer containers between ships and<br />
trains or trucks and trains.<br />
Containerized cargo moved via two different modes <strong>of</strong><br />
transportation (e.g., ship, truck, rail, and barge).<br />
Train engine moves due to fueling, maintenance, or crew<br />
change requirements.<br />
UP rail yard south <strong>of</strong> UP ICTF.<br />
Type <strong>of</strong> transportation (i.e., rail, ship, and truck).<br />
Maximum Practical Capacity Model developed by<br />
DMJM+Harris. <strong>The</strong> MPC Model is a tool that directly<br />
considers rail operations, including switching, loading<br />
and unloading trains, and departing trains.<br />
Area more than 550 miles from the <strong>Port</strong>, usually served by<br />
rail.<br />
An ICTF that is in nearby, but requires travel on public<br />
streets to/from berths.<br />
This includes automobiles, slab steel, bulk, and any cargo<br />
not transported in containers.<br />
An ICTF that is removed from the port, such as the<br />
downtown/East <strong>Los</strong> <strong>Angeles</strong> yards.<br />
An ICTF that is adjacent or very near berths.<br />
Staging area for trucks.<br />
<strong>Port</strong> <strong>of</strong> <strong>Los</strong> <strong>Angeles</strong> July 2004<br />
Review Draft Page 54
<strong>Port</strong>wide Rail Synopsis<br />
Glossary<br />
Term<br />
Pier 400 ICTF<br />
Pier A Yard<br />
Regional Market<br />
Stevedoring<br />
Storage track<br />
Throughput<br />
Total Intermodal Demand<br />
Tractor<br />
Train Move<br />
Definition<br />
This is the newest on‐dock ICTF at the <strong>Port</strong>. <strong>The</strong> yard is<br />
currently operated by APM Terminals (Maersk‐Sealand),<br />
and receives rail service from BNSF.<br />
Main rail yard for PHL.<br />
Area 550 miles from the <strong>Port</strong>, usually served by truck<br />
transit.<br />
<strong>The</strong> process <strong>of</strong> loading/unloading ships.<br />
Track on which trains are stored.<br />
<strong>The</strong> amount <strong>of</strong> cargo transferred in and out <strong>of</strong> a port.<br />
Total volume <strong>of</strong> cargo that is expected to be loaded onto<br />
trains at either on‐ or <strong>of</strong>f‐dock rail yards.<br />
Truck cab without a trailer/chassis.<br />
Any move made by an empty or full train into or out <strong>of</strong> a<br />
terminal or rail yard.<br />
Twenty‐foot equivalent unit<strong>The</strong> standard measure <strong>of</strong> container volume. Originally,<br />
(TEU)<br />
all containers were 20 feet in length, now most are 40 or 50<br />
feet.<br />
Unit Train Coupled railcars varying in length between 115 and 140<br />
railcars.<br />
UP ICTF<br />
West Basin‐East<br />
Working track<br />
UP near‐doc ICTF (0.5 mile east <strong>of</strong> Alameda and<br />
Sepulveda).<br />
Proposed new on‐dock ICTF to serve TraPac. Same as<br />
West Basin‐East ICTF.<br />
Track that is actively used in rail service to run trains.<br />
<strong>Port</strong> <strong>of</strong> <strong>Los</strong> <strong>Angeles</strong> July 2004<br />
Review Draft Page 55
<strong>Port</strong>wide Rail Synopsis<br />
Glossary<br />
Term<br />
Yard switcher moves<br />
Definition<br />
Railcar movement within/between the <strong>Port</strong>/<strong>Port</strong> <strong>of</strong> Long<br />
Beach to provide ʺempties,ʺ make deliveries, or build<br />
trains.<br />
<strong>Port</strong> <strong>of</strong> <strong>Los</strong> <strong>Angeles</strong> July 2004<br />
Review Draft Page 56