August 25, 2011 - Oil India Limited
August 25, 2011 - Oil India Limited
August 25, 2011 - Oil India Limited

Create successful ePaper yourself
Turn your PDF publications into a flip-book with our unique Google optimized e-Paper software.
<strong>August</strong> <strong>25</strong>, <strong>2011</strong>
Disclaimer<br />
This presentation contains certain forward looking statements concerning OIL <strong>India</strong>’s future business<br />
prospects and business profitability, which are subject to a number of risks and uncertainties and the<br />
actual results could materially differ from those in such forward looking statements. The risks and<br />
uncertainties relating to these statements include, but not limited to, risks and uncertainties, regarding<br />
fluctuations in earnings, our ability to manage growth, competition (both domestic and<br />
international), economic growth in <strong>India</strong>, ability to attract and retain highly skilled professionals, time and<br />
cost over runs on projects, our ability to manage our international operations, government policies and<br />
actions with respect to investments, fiscal deficits, regulations, etc., interest and other fiscal costs<br />
generally prevailing in the economy. The company does not undertake to make any announcement in case<br />
any of these forward looking statements become materially incorrect in future or update any forward<br />
looking statements made from time to time by or on behalf of the company.
An Overview
<strong>Oil</strong> <strong>India</strong>: Brief Overview<br />
<strong>India</strong>’s premier <strong>Oil</strong> & Gas “Navratna” company engaged in the exploration, development, production and<br />
transportation of crude oil and natural gas in <strong>India</strong><br />
Rich Heritage<br />
Independent <strong>India</strong>’s first commercial oil discoveries, with the first made in 1953<br />
Integrated O&G<br />
Player<br />
Presence across <strong>Oil</strong> & Gas Value Chain (E&P, Transportation and Downstream)<br />
Infrastructure to support growth<br />
Large Acreage<br />
Domestic acreage: 127,260 square kilometers;<br />
International acreage: 38,605 square kilometers<br />
Strong<br />
Reserve Base<br />
Strong<br />
Financials<br />
Total 2P reserves of over 944 mmboe; with RR ratio of over 142% in FY11<br />
Revenue: 9,549 Cr (FY11), 2,669 Cr. Q1(FY12)<br />
PAT : 2,888 Cr (FY11), 850 Q1(FY12)<br />
Market cap : 31,523 Cr 1<br />
Note:<br />
1. As of Aug 19, <strong>2011</strong>
Shareholding pattern<br />
Key shareholders<br />
%<br />
Shareholding<br />
<strong>India</strong>n <strong>Oil</strong> Corporation 4.45%<br />
2.1%<br />
4.2%<br />
1.1%<br />
Bharat Petroleum Corporation 2.23%<br />
3.0%<br />
Hindustan Petroleum Corporation 2.23%<br />
11.1%<br />
ICICI Prudential Life Insurance 0.78%<br />
HDFC Standard Life Insurance 0.64%<br />
HDFC Trustee Company <strong>Limited</strong>-Equity<br />
Fund<br />
HDFC Trustee Company <strong>Limited</strong>-Top 200<br />
Fund<br />
0.61%<br />
0.60%<br />
78.4%<br />
• Listing: Listed on BSE/NSE on 30 th Sept 2009<br />
• Number of shares: 240.45 mn<br />
• Dividend: FY11 Int Dividend/share: Rs.18.00<br />
Promoters (GOI) Bodies Corporate Public & Others<br />
FII MF FI / Banks<br />
• Proposed F Dividend: Rs.19.50<br />
• Share price (H/L): Rs.1635 / Rs.1019<br />
• Market Cap: Rs. 31523 cr / USD 7.01 bn
J-11<br />
M-11<br />
1.6<br />
1.5<br />
1.4<br />
1.3<br />
1.2<br />
1.1<br />
1.0<br />
0.9<br />
0.8<br />
Performance of OIL <strong>India</strong><br />
S-09<br />
N-09<br />
J-10<br />
M-10<br />
M-10<br />
J-10<br />
S-10<br />
N-10<br />
J-11<br />
M-11<br />
OINL ONGC NIFTY SENSEX OIL & Gas Index
Our Vision<br />
"The fastest growing energy company with a global presence providing value to the<br />
shareholder"<br />
• Fastest growing Energy Company with highest profitability.<br />
• Delight customers with quality products and services at competitive prices<br />
• Learning Organization, nurturing initiatives, innovations and aspirations with best<br />
practices<br />
• Team, committed to honesty, integrity, transparency and mutual trust creating<br />
employee pride<br />
• Fully committed to safety, health and environment<br />
• Responsible corporate citizen deeply committed to socio-economic development in<br />
its areas of operations
Rich heritage of building a company<br />
• Independent <strong>India</strong>’s first commercial oil discoveries were made by<br />
Assam <strong>Oil</strong> Company<br />
– Nahorkatiya, Assam – 1953<br />
– Moran, Assam – 1956<br />
• Incorporated as Joint Sector Company on 18 February, 1959<br />
– 2/3 rd Owned by Assam <strong>Oil</strong> Company / Burmah <strong>Oil</strong> Company<br />
– 1/3 rd Owned by Government of <strong>India</strong><br />
• Became a Public Sector Undertaking, GOI on 14 October, 1981<br />
• Five decades of experience in Exploration & Production<br />
• Second largest national oil and gas company in <strong>India</strong><br />
• Achieved overwhelming response in its maiden public issue on 30<br />
September 2009
Integrated <strong>Oil</strong> & Gas Player<br />
Exploration<br />
Production<br />
Transportation<br />
Downstream<br />
Domestic: 30 E&P<br />
blocks 1<br />
International: Egypt,<br />
Gabon, Iran, Libya,<br />
Nigeria, Timor Leste,<br />
Venezuela and Yemen 2<br />
Discoveries: 16 Small to<br />
Medium 3 size discoveries<br />
during last three years<br />
(FY’09 – FY’11)<br />
50 years of experience<br />
FY’ 11 Produced <strong>25</strong>.71<br />
mmbbl of Crude oil:<br />
– 39 installations<br />
– 1,544 km pipelines<br />
FY’ 11 Produced 2.35<br />
bcm of Natural gas<br />
– 26 installations<br />
– 583 km pipelines<br />
Advanced Recovery<br />
techniques to maximize<br />
production<br />
Crude <strong>Oil</strong>:<br />
– 1,157 km pipeline ;<br />
~6 MMT capacity<br />
Multi-Product:<br />
– 660 km pipeline; 1.72<br />
MMT capacity<br />
Overseas pipeline:<br />
– 10% stake in 741 km<br />
pipeline (Sudan)<br />
Natural Gas:<br />
– 23% stake in 192 km<br />
DNPL 3 in NE<br />
Refining and marketing<br />
petroleum products:<br />
– 26% equity stake in<br />
NRL 1<br />
Gas cracker project:<br />
– 10% equity stake in<br />
BCPL 2<br />
City gas business –<br />
– Signed MOU with<br />
GAIL, HPCL, IOCL<br />
and BPCL/ONGCL<br />
Note:<br />
1. 10 blocks have been awarded under NELP IX.<br />
2. Participating interests in exploration and development blocks.<br />
3. Small to Medium size discoveries: Estimated proved plus probable reserves size of less than 30 mn barrels of oil and oil equivalent gas<br />
4. MMBOE – Million Barrels of <strong>Oil</strong> Equivalent<br />
Note:<br />
1. NRL – Numaligarh Refinery <strong>Limited</strong><br />
2. BCPL – Brahmaputra Cracker and Polymer <strong>Limited</strong><br />
3. DNPL – Duliajan-Numaligarh Pipeline <strong>Limited</strong>
Strong Domestic Acreage Base<br />
Blocks Op N/Op Total<br />
NELP 12 18 30<br />
Pre-NELPJV - 3 3<br />
PEL (Nom) 9 - 9<br />
PML 19 - 19<br />
Total 40 21 61<br />
<br />
ASSAM +AP<br />
AA-ONN<br />
AA-ONN<br />
AA-ONN<br />
AA-ONN<br />
30%<br />
90%<br />
50%<br />
85%<br />
þ<br />
þ<br />
þ<br />
þ<br />
þ<br />
þ<br />
60%<br />
60%<br />
75%<br />
RJ-ONN<br />
RJ-ONN<br />
RJ-ONN<br />
<br />
AA-ONN 20%<br />
<br />
AA-ONN 85%<br />
AAP-ON<br />
AA-ONN<br />
AA-ONN<br />
16%<br />
15%<br />
10%<br />
AA-ONN 50%<br />
Summary of Acreage (sq. km.)<br />
38,605<br />
1,979<br />
5,095<br />
15%<br />
GK-OSJ-3<br />
Strong<br />
presence in<br />
prospective<br />
East Coast<br />
6,041<br />
1<br />
16,235<br />
KG-OSN 30% KG-DWN 15%<br />
2<br />
MN-OSN<br />
20%<br />
KG-DWN 10%<br />
KG-ONN 90%<br />
MN-DWN<br />
<br />
20%<br />
MZ-ONN<br />
WB-ONN<br />
KG-DWN<br />
75%<br />
<strong>25</strong>%<br />
10%<br />
þ<br />
PEL Nomination<br />
JV/PSC (NO)<br />
NELP (NO)<br />
Total Area – 165,865 Sq. Km<br />
97,910<br />
PML Nomination<br />
NELP (Operator)<br />
Overseas (PI)<br />
<br />
CY-DWN 50%<br />
CY-DWN<br />
20%<br />
KG-DWN<br />
AN-DWN<br />
10%<br />
20%<br />
KG-DWN 15%<br />
Note:<br />
NO – Non-operator<br />
PI – Participatory Interests<br />
AN-DWN 30%<br />
1. Includes a 40% PI in the Kharsang fields of area 11 sq. km.<br />
2. Includes 3,992 Sq Km of Joint Operatorship<br />
+<br />
AN-DWN 40%<br />
AN-DWN 40%<br />
AN-DWN 30%<br />
Map Not to Scale<br />
<br />
NELP I-VIII<br />
Nomination ML(s)/PEL(s)<br />
JVC Blocks<br />
OIL as Operator<br />
+ Joint Operator
NELP IX: Blocks provisionally awarded<br />
OIL’s Investment – US$ 76.52 mn<br />
Name of the Block Operator Area Type Area (sq. km.)<br />
AA-ONN-2010/2 OIL (40%) Assam – Arakan Basin Onland 396<br />
AA-ONN-2010/3 OIL (40%) Assam – Arakan Basin Onland 171<br />
MB-OSN-2010/2 OIL (50%) Mumbai Basin Shallow Offshore 3411<br />
GS-DWN-2010/1<br />
MB-DWN-2010/2<br />
OIL & ONGC<br />
(Joint – 40% each)<br />
OIL & ONGC<br />
(Joint – 35% each)<br />
Gujarat-Saurashtra<br />
Basin<br />
Deep Water 8<strong>25</strong>5<br />
Mumbai Basin Deep Water 7063<br />
GK-OSN-2010/1 ONGC (60%) Gujarat-Kutch Basin Shallow Offshore 1,361<br />
Investment<br />
(US$ mn)<br />
28.19<br />
(OIL-11.28)<br />
8.86<br />
(OIL-3.54)<br />
24.30<br />
(OIL-12.15)<br />
1.62<br />
(OIL-0.65)<br />
1.90<br />
(OIL-0.67)<br />
154.31<br />
(OIL – 46.29)<br />
Consortium<br />
Partners (PI)<br />
ONGC-30%<br />
GAIL- 20%<br />
EWP – 10%<br />
ONGC-40%<br />
BPRL- 20%<br />
ONGC-30%<br />
BPRL- 20%<br />
GAIL-20%<br />
GAIL-30%<br />
OIL-30%<br />
GAIL – 10%<br />
KK-OSN-2010/1 ONGC (40%) Kerala Konkan Basin Shallow Offshore 2,004<br />
KK-OSN-2010/2 ONGC (40%) Kerala Konkan Basin Shallow Offshore 1,860<br />
KK-OSN-2010/3 ONGC (40%) Kerala Konkan Basin Shallow Offshore 1,874<br />
0.85 OIL-30%<br />
(OIL – 0.26) IOC – 30%<br />
0.85<br />
(OIL – 0.26)<br />
0.85<br />
(OIL – 0.34)<br />
OIL-30%<br />
IOC – 30%<br />
OIL-40%<br />
HPCL – 20%<br />
KK-DWN-2010/1 ONGC (40%) Kerala Konkan Basin Deep Water 10,019<br />
2.70<br />
(OIL – 1.08)<br />
OIL-40%<br />
BPRL – 20%<br />
OIL as Operator / Joint operator
With Dominant International Footprint<br />
50<br />
50<br />
<strong>25</strong>(Sonatrach)<br />
7,087<br />
2,710<br />
6,629<br />
LIBYA<br />
Area 86<br />
Area 102/4<br />
Area 95/96<br />
EGYPT<br />
Block 3<br />
Block 4<br />
6,7<strong>25</strong><br />
2,510<br />
<strong>25</strong> (GSPC)<br />
17.5 (Summit)<br />
1,295<br />
NIGERIA<br />
OPL 205<br />
SUDAN<br />
Pipeline<br />
741 km 10<br />
45<br />
3,761<br />
GABON<br />
Shakti<br />
IRAN<br />
Farsi Offshore<br />
3,500 20(OVL)<br />
3.5<br />
Repsol 11%<br />
Petronas 11%<br />
OVL 11%<br />
IOC 3.5%<br />
203<br />
180<br />
VENEZUELA<br />
Carabobo 1 North<br />
Carabobo 1 Central<br />
TIMOR LESTE<br />
Block K<br />
1,788<br />
12.5<br />
(Reliance)<br />
YEMEN<br />
Block 82<br />
Block 83<br />
1,857<br />
360<br />
12.75<br />
(Medco)<br />
Operator<br />
Area (Sq. Km)<br />
OIL’s Participating Interest (%)<br />
Total Area – 38,605 sq.km
Strong Reserve Base with Significant Growth Potential<br />
In MMBBL<br />
1600<br />
1400<br />
1,372<br />
As on 01/04/<strong>2011</strong><br />
1200<br />
1000<br />
944<br />
505<br />
800<br />
600<br />
400<br />
200<br />
0<br />
360<br />
505<br />
2<strong>25</strong><br />
867<br />
584<br />
280<br />
1P 2P 3P<br />
Crude <strong>Oil</strong> Natural Gas<br />
1P Reserves represent:<br />
≥ 11 Years current production of Crude <strong>Oil</strong><br />
≥ 15 Years current production of Natural Gas<br />
≥ 12 Years current production of O+OEG
Healthy and Consistent Reserve Replacement Ratio<br />
Reserve Replacement Ratio (x)<br />
2.04 2.04 1.69 1.65<br />
1.42<br />
Crude <strong>Oil</strong> and Natural Gas (O+OEG) Production and Reserve Accretion (in MMTOE)<br />
10.4 10.3<br />
9.4 9.7<br />
8.4<br />
5.1 5.1<br />
5.6 5.9 5.9<br />
FY2007 FY2008 FY2009 FY2010 FY<strong>2011</strong><br />
Production (O + OEG)<br />
Accretion<br />
Adequate reserve replenishment
Integrated In-house E&P Infrastructure To Support Growth<br />
In house Expertise and Integration across Energy Infrastructure<br />
Infrastructure to Support E&P Activities<br />
Production & Storage Facilities<br />
Two 2D and One<br />
3D Seismic Crew<br />
Six Logging<br />
Trucks<br />
72 Production<br />
Installations<br />
14 W/over Rigs 11 Drilling Rigs<br />
5,000 Km<br />
O&G<br />
Pipelines<br />
~150k KL<br />
Crude Storage
Strategy to Deliver Long Term Growth and Shareholder Value<br />
1<br />
Use Advanced Techniques to Improve<br />
Existing Productivity<br />
<br />
Continue to induct world class<br />
technology<br />
5<br />
Explore Non-conventional<br />
energy sources<br />
2<br />
Increase Reserves and<br />
Production in Existing Acreage<br />
<br />
Explore alternate energy<br />
opportunities in existing<br />
acreage as well as inorganic<br />
opportunities<br />
Further Integrate Business<br />
Portfolio and Diversify<br />
across Geographies<br />
<br />
<br />
Accelerate exploration efforts<br />
Develop fields with potential<br />
4<br />
Vertical Integration<br />
3<br />
Inorganic Growth<br />
<br />
<br />
<br />
Diversify revenues through<br />
downstream investments<br />
Improve profitability by<br />
extending into higher margin<br />
product value chain<br />
Providing <strong>Oil</strong>field Services<br />
<br />
<br />
Acquire blocks to augment<br />
existing reserve base<br />
Acquisition of companies that<br />
are value accretive
Significant Investment Lined Up<br />
Significant focus on Exploration and Development of existing acreage potential<br />
<strong>2011</strong>-2012: 31,803 mn<br />
Domestic<br />
Assets<br />
9%<br />
Overseas<br />
Projects<br />
11%<br />
M&A<br />
1%<br />
Development<br />
27%<br />
Exploration &<br />
Appraisal<br />
52%
Planned Activities in FY12<br />
Substantial Increase in 3D Surveys, Exploratory and Development Drilling Planned.<br />
3D Seismic Surveys Exploratory Drilling Development Drilling<br />
1,767<br />
34<br />
34<br />
672<br />
16<br />
<strong>25</strong><br />
FY11<br />
FY12<br />
FY11 FY12 FY11 FY12
Recent Developments
Select Highlights<br />
<br />
<br />
Achieved the highest daily rate of crude oil production of 3.93 MTPA (> 27.96 mmbbls/Year)<br />
Achieved the highest daily rate of natural gas production of 6.67 MMSCMD in North East and<br />
potential of 0.93 MMSCMD in Rajasthan<br />
Performance up to 31 March <strong>2011</strong>:<br />
Parameter Unit 2009-10 2010-11<br />
Crude <strong>Oil</strong> Production MMT 3.572 3.612*<br />
Natural Gas Production BCM 2415 2349**<br />
* A total loss of 0.127 MMT due to NRL shut-down. However, Highest ever quarterly production of 0.951 MMT achieved in Q2, 2010 .<br />
** Low upliftment by customers of NE & Rajasthan,<br />
<br />
<br />
<br />
<br />
<br />
Hydrocarbon discoveries in Assam - 06 Nos. in FY’11<br />
Entry in Offshore as Operator and Deep Water Block as Joint Operator<br />
Entry in CBM Block (Assam)<br />
Examining Shale Gas potential of Assam-Arakan Basin<br />
OIL & GAIL( <strong>India</strong>) Ltd are jointly evaluating US shale gas assets buys
Select Highlights (Contd.)<br />
• Successful commissioning of Duliajan-Numaligarh Pipeline (DNP) w.e.f 28-02-<strong>2011</strong><br />
• Completed Preliminary Activities in order to Develop CNG Network in Assam.<br />
• MOUs with BPCL, IOCL & ONGCL executed for CGD. Submitted bids for two cities.<br />
• Received Greentech HR Excellence Gold Award 2010.<br />
• Received Golden Peacock Award & Greentech Gold Award for Environment Management.<br />
• Received Environmental Excellence Award from <strong>India</strong>n Chamber of Commerce<br />
• "OIL's Assam Asset won OISD Award in the <strong>Oil</strong> & Gas Assets (onshore) for the year 2009-10<br />
• Employees Relations Department Accredited with ISO Certification<br />
• Identified Business opportunity in Bangladesh (Pipeline)<br />
• HDD, Telecommunication work & AMC for IOCL’s Guwahati-Siliguri Pipeline<br />
• Cathodic Protection work for DNPL Pipeline<br />
• ODC Project for PDO, Oman<br />
• Marketing of Telecommunication Services
Operating Performance
Crude <strong>Oil</strong> and Natural Gas Production<br />
Crude <strong>Oil</strong> Production (mm bbl)<br />
Natural Gas Production (mm scm)<br />
22.38<br />
24.95<br />
<strong>25</strong>.7<br />
0.93<br />
<strong>25</strong>.71<br />
2,341<br />
2,269<br />
2,415<br />
2,349<br />
5.68<br />
6.81<br />
553<br />
641<br />
2007-08 2008-09 2009-10 2010-11 Q1 FY'11 Q1 FY'12 2007-08 2008-09 2009-10 2010-11 Q1 FY'11 Q1 FY'12<br />
~20% increase over last year (QTQ) ~16% increase over last year (QTQ)
Production Cost<br />
Crude <strong>Oil</strong> Production Cost (USD/ Barrel)<br />
Natural Gas Production Cost (USD/ MMBTU)<br />
4.8<br />
7.6<br />
7.1<br />
7.2<br />
6.8<br />
2.0<br />
1.6<br />
1.8 1.4<br />
0.4<br />
0.4 0.4 0.3<br />
0.8<br />
1.1<br />
0.2<br />
0.1<br />
1.1<br />
0.2<br />
0.1<br />
1.2<br />
1.3<br />
0.2<br />
0.2<br />
0.1 0.1<br />
1.2<br />
0.3<br />
4.9 5.1 5.2 5.3<br />
0.2<br />
0.1<br />
0.8<br />
0.9 0.9 1.0<br />
3.3<br />
0.5<br />
2006-07 2007-08 2008-09 2009-10 2010-11<br />
Raising Cost Depreciation Depletion<br />
2006-07 2007-08 2008-09 2009-10 2010-11<br />
Raising Cost Depreciation Depletion
Financial Performance
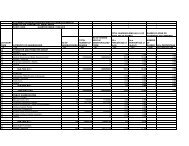
Sharing of Subsidy by Upstream Companies<br />
Rs. in Crores<br />
2007-08 2008-09 2009-10 2010-11 Q1 FY’11 Q1 FY’12<br />
ONGC 22,001 28,226 11,554 24893 5516 12046<br />
OIL 2,307 3,023 1,549 3293 730 1781<br />
GAIL 1,401 1,694 1,326 2111 445 682<br />
Total <strong>25</strong>,709 32,943 14,430 30,297 6,691 14,509<br />
% SHARING<br />
2007-08 2008-09 2009-10 2010-11 Q1 FY’11 Q1 FY’12<br />
ONGC 86% 86% 80% 82% 82% 83%<br />
OIL 9% 9% 11% 11% 11% 12%<br />
GAIL 5% 5% 9% 7% 7% 5%<br />
Total 100% 100% 100% 100% 100% 100%
Realized Price<br />
(USD/barrel)<br />
116.3<br />
83.2 81.7<br />
86.1<br />
78.1<br />
68.5<br />
58.1<br />
36.2<br />
55.6 56.2<br />
58.5<br />
39.0 39.8 41.4<br />
49.7<br />
33.8<br />
59.6<br />
42.1<br />
FY2008 FY2009 FY2010 FY<strong>2011</strong> Q1 FY'11 Q1 FY'12<br />
Gross Realized Price Realized Price after Subsidy/Discount Net Realized Price
Revenue and profitability<br />
Revenue and profitability analysis (Rs Crore)<br />
10,000<br />
9,549<br />
9,000<br />
8,000<br />
8,178<br />
8,860<br />
7,000<br />
6,000<br />
6,010<br />
6,796<br />
5,000<br />
4,000<br />
3,000<br />
2,000<br />
1640 1789<br />
2162<br />
2610<br />
2888<br />
1,817<br />
2,669<br />
1,000<br />
501<br />
850<br />
0<br />
FY2007 FY2008 FY2009 FY2010 FY<strong>2011</strong> Q1 FY'11 Q1 FY'12<br />
Income<br />
PAT<br />
Note: Exchange rate 1 USD = 48.52 INR used for figures upto FY2009; FY10 and FY11, actual exchange rates have been used.
Networth and Book Value<br />
Networth (Rs crores) and Book Value Analysis (Rs)<br />
18,000<br />
1000<br />
16,000<br />
900<br />
14,000<br />
12,000<br />
10,000<br />
8,000<br />
6,000<br />
4,000<br />
371<br />
7,933<br />
436<br />
9,331<br />
572<br />
13,745<br />
649<br />
15,602<br />
593<br />
14,<strong>25</strong>1<br />
684<br />
16,451<br />
800<br />
700<br />
600<br />
500<br />
400<br />
300<br />
200<br />
2,000<br />
100<br />
0<br />
FY2008 FY2009 FY2010 FY<strong>2011</strong> Q1 FY'11 Q1 FY'12<br />
0<br />
Networth (LHS)<br />
Book Value (RHS)
Cash Flow and EBITDA Margin<br />
Cash Flow (Rs Crores) EBITDA (Rs Crores) and EBITDA MARGIN (%)<br />
3,000<br />
120%<br />
5000<br />
4,805<br />
60%<br />
2,500<br />
2,000<br />
1,798<br />
2,135<br />
2,548<br />
100%<br />
80%<br />
4500<br />
4000<br />
3500<br />
3000<br />
43%<br />
2,841<br />
3,568<br />
42%<br />
4,380<br />
49%<br />
50%<br />
46%<br />
52%<br />
50%<br />
40%<br />
1,500<br />
1,385<br />
60%<br />
<strong>25</strong>00<br />
30%<br />
1,000<br />
608<br />
972<br />
40%<br />
2000<br />
1500<br />
1,387<br />
20%<br />
500<br />
20%<br />
1000<br />
841<br />
10%<br />
500<br />
0<br />
FY2008 FY2009 FY2010 FY<strong>2011</strong><br />
Q1<br />
FY'11<br />
Q1<br />
FY'12<br />
0%<br />
0<br />
FY2008 FY2009 FY2010 FY<strong>2011</strong> Q1 FY'11 Q1 FY'12<br />
0%<br />
Consistent and Attractive Cash Flow<br />
EBITDA<br />
EBITDA Margin
Dividends distribution and Earnings per share highlights<br />
Dividends distribution<br />
Earnings per share and Debt-Equity ratio<br />
35<br />
34<br />
33<br />
32<br />
31<br />
30<br />
29<br />
28<br />
375<br />
340<br />
305<br />
265 260<br />
275<br />
33.6<br />
33.9<br />
32.9<br />
31.3 31.2<br />
30.2<br />
FY2006 FY2007 FY2008 FY2009 FY2010 FY<strong>2011</strong><br />
400<br />
380<br />
360<br />
340<br />
320<br />
300<br />
280<br />
260<br />
240<br />
220<br />
200<br />
180<br />
160<br />
140<br />
120<br />
100<br />
80<br />
60<br />
40<br />
20<br />
0<br />
140<br />
120<br />
100<br />
80<br />
60<br />
40<br />
20<br />
0<br />
0.14<br />
0.12x<br />
0.12<br />
0.1<br />
0.06x<br />
0.08<br />
0.07x<br />
120 0.06<br />
114<br />
104<br />
86<br />
83<br />
0.04<br />
72<br />
0.02x<br />
0.02<br />
0.006x<br />
0.003x<br />
0<br />
FY2006 FY2007 FY2008 FY2009 FY2010 FY<strong>2011</strong><br />
Dividend Payout (%) - LHS<br />
Dividends (%) - RHS<br />
Earnings per share (INR)<br />
Debt/Equity<br />
The dividend per share has shown a<br />
consistent uptrend<br />
Steady increase in EPS and minimal debt<br />
on the balance sheet
Guidance: FY’12<br />
2009-10 2010-11 <strong>2011</strong>-12<br />
(Target)<br />
Crude oil production 3.57 mmt 3.61 MMT 3.76 MMT<br />
Natural gas production 2,415 mmscm 2,349 mmscm 2,633 mmscm<br />
Increase in Exploratory and Development Drilling Meterage<br />
Increase in Work Overs<br />
Enhanced Water Injection<br />
Endeavour to Enhance LPG production through NGL Recycling<br />
Endeavour to Reduce Gas Flaring by Inducting LNG Technology
Conclusion<br />
Stable Operations, Looking for Growth<br />
Company with Good Operating Track Record<br />
Sound Financial Health<br />
Company with more than 5 Decades of E&P Expertise<br />
Large Prospective E&P Acreage<br />
Entry into Deepwater/Offshore Blocks as Operator<br />
Entry into discovered assets in Venezuela, Acquisition Thrust continues<br />
Spreading its Wings : NE Pan <strong>India</strong> Global<br />
Diversifying into New Areas
Thank You