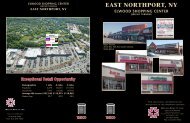
Fordham Road Bronx, New York - Welco Realty, Inc
Fordham Road Bronx, New York - Welco Realty, Inc
Fordham Road Bronx, New York - Welco Realty, Inc

Create successful ePaper yourself
Turn your PDF publications into a flip-book with our unique Google optimized e-Paper software.
FULL DEMOGRAPHIC PROFILE<br />
1990 - 2000 Census, 2003 Estimates & 2008 Projections<br />
Calculated using Proportional Block Groups<br />
Lat/Lon: 40.862148/-73.894478<br />
RF1<br />
309 E <strong>Fordham</strong> Rd<br />
<strong>Bronx</strong>, <strong>New</strong> <strong>York</strong><br />
.25 mi<br />
radius<br />
.50 mi<br />
radius<br />
1.00 mi<br />
radius<br />
1.50 mi<br />
radius<br />
TRANSPORTATION<br />
TRAVEL TIME OCCUPATION LABOR FORCE<br />
TO WORK<br />
CONSUMER EXPENDITURE<br />
2003 Est. Labor: Population Age 16+ 12,238 52,003 156,960 292,557<br />
2003 Est. Civilian Employed 36.4% 38.9% 41.4% 43.1%<br />
2003 Est. Civilian Unemployed 10.2% 10.1% 9.1% 8.5%<br />
2003 Est. in Armed Forces - 0.0% 0.0% 0.0%<br />
2003 Est. not in Labor Force 53.3% 50.9% 49.4% 48.4%<br />
2003 Labor Force: Males 46.6% 46.1% 46.0% 45.4%<br />
" 2003 Labor Force: Females 53.4% 53.9% 54.0% 54.6%<br />
2000 Occupation: Population Age 16+ 4,081 18,323 58,866 115,103<br />
2000 Mgmt, Business, & Financial Operations 5.1% 6.2% 7.0% 7.6%<br />
2000 Professional and Related 12.3% 12.9% 14.7% 16.3%<br />
2000 Service 27.0% 24.0% 23.0% 22.5%<br />
2000 Sales and Office 29.0% 29.7% 29.7% 30.2%<br />
2000 Farming, Fishing, and Forestry 0.1% 0.1% 0.1% 0.1%<br />
2000 Construction, Extraction, & Maintenance 9.0% 9.8% 9.0% 8.0%<br />
2000 Production, Transport, & Material Moving 17.5% 17.3% 16.4% 15.3%<br />
2000 Percent White Collar Workers 46.4% 48.9% 51.5% 54.2%<br />
"<br />
2000 Percent Blue Collar Workers 53.6% 51.1% 48.5% 45.8%<br />
2000 Drive to Work Alone 11.2% 14.5% 17.5% 18.8%<br />
2000 Drive to Work in Carpool 6.9% 8.1% 8.6% 8.6%<br />
2000 Travel to Work by Public Transportation 68.0% 63.9% 61.0% 60.8%<br />
2000 Drive to Work on Motorcycle - - 0.0% 0.0%<br />
2000 Walk or Bicycle to Work 9.1% 10.1% 9.7% 8.8%<br />
2000 Other Means 2.1% 1.1% 0.9% 0.8%<br />
2000 Work at Home<br />
"<br />
2.7% 2.2% 2.3% 2.1%<br />
2000 Travel to Work in 14 Minutes or Less 10.0% 10.1% 10.5% 10.5%<br />
2000 Travel to Work in 15 to 29 Minutes 13.2% 16.3% 18.7% 19.0%<br />
2000 Travel to Work in 30 to 59 Minutes 45.0% 47.2% 44.8% 43.2%<br />
2000 Travel to Work in 60 Minutes or More 31.9% 26.3% 26.0% 27.3%<br />
2000 Average Travel Time to Work 44.7 41.1 40.1 40.1<br />
2003 Est. Total Household Expenditure (in Millions) $ 171.9 $ 724.5 $ 2,393.2 $ 4,728.5<br />
2003 Est. Apparel $ 9.7 $ 40.6 $ 133.9 $ 264.4<br />
2003 Est. Contributions & Gifts $ 9.7 $ 40.7 $ 135.1 $ 267.7<br />
2003 Est. Education & Reading $ 4.4 $ 18.4 $ 60.5 $ 119.2<br />
2003 Est. Entertainment $ 8.7 $ 36.8 $ 121.7 $ 240.7<br />
2003 Est. Food, Beverages & Tobacco $ 30.8 $ 129.9 $ 428.0 $ 844.1<br />
2003 Est. Furnishings And Equipment $ 6.6 $ 28.0 $ 92.7 $ 183.5<br />
2003 Est. Health Care & Insurance $ 13.2 $ 55.3 $ 182.6 $ 360.8<br />
2003 Est. Household Operations & Shelter & Utilities $ 47.9 $ 202.0 $ 668.7 $ 1,323.4<br />
2003 Est. Miscellaneous Expenses $ 2.0 $ 8.3 $ 27.4 $ 54.1<br />
2003 Est. Personal Care $ 2.9 $ 12.4 $ 40.9 $ 80.7<br />
2003 Est. Transportation $ 36.1 $ 152.2 $ 501.8 $ 990.0<br />
This report was produced using data from private and government sources deemed to be reliable. The information herein is provided without representation or warranty.<br />
©2005, Sites USA, Tempe, Arizona, 480-491-1112 - 3 of 3 - Demographic Source: Applied Geographic Solutions / TIGER Geography 06/03