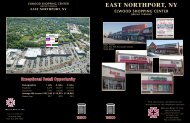
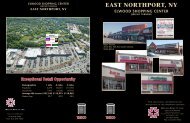
Fordham Road Bronx, New York - Welco Realty, Inc
Fordham Road Bronx, New York - Welco Realty, Inc
Fordham Road Bronx, New York - Welco Realty, Inc

You also want an ePaper? Increase the reach of your titles
YUMPU automatically turns print PDFs into web optimized ePapers that Google loves.
FULL DEMOGRAPHIC PROFILE<br />
1990 - 2000 Census, 2003 Estimates & 2008 Projections<br />
Calculated using Proportional Block Groups<br />
Lat/Lon: 40.862148/-73.894478<br />
RF1<br />
309 E <strong>Fordham</strong> Rd<br />
<strong>Bronx</strong>, <strong>New</strong> <strong>York</strong><br />
.25 mi<br />
radius<br />
.50 mi<br />
radius<br />
1.00 mi<br />
radius<br />
1.50 mi<br />
radius<br />
POPULATION<br />
MARITAL STATUS<br />
INCOME AGE<br />
HOUSEHOLDS<br />
& SEX<br />
2003 Estimated Population 17,595 74,356 221,666 409,223<br />
2008 Projected Population 17,970 77,628 229,642 423,149<br />
2000 Census Population 17,418 72,518 216,430 399,271<br />
1990 Census Population 17,071 67,994 199,067 365,165<br />
Historical Annual Growth 1990 to 2003 0.2% 0.7% 0.9% 0.9%<br />
Projected Annual Growth 2003 to 2008 0.4% 0.9% 0.7% 0.7%<br />
2003 Est. Households 5,379 22,454 71,391 137,359<br />
2008 Proj. Households 5,468 23,353 73,615 141,289<br />
2000 Census Households 5,341 21,951 69,890 134,440<br />
1990 Census Households 5,470 21,340 66,485 127,666<br />
Historical Annual Growth 1990 to 2003 -0.1% 0.4% 0.6% 0.6%<br />
Projected Annual Growth 2003 to 2008 0.3% 0.8% 0.6% 0.6%<br />
2003 Est. Population 0 to 9 Years 19.2% 19.2% 18.6% 18.2%<br />
2003 Est. Population 10 to 19 Years 18.4% 18.0% 17.3% 16.7%<br />
2003 Est. Population 20 to 29 Years 16.4% 17.2% 16.6% 15.7%<br />
2003 Est. Population 30 to 44 Years 22.5% 22.1% 22.5% 23.1%<br />
2003 Est. Population 45 to 59 Years 14.6% 14.4% 14.8% 15.3%<br />
2003 Est. Population 60 to 74 Years 6.3% 6.1% 6.8% 7.3%<br />
2003 Est. Population 75 Years Plus 2.6% 3.0% 3.3% 3.7%<br />
2003 Est. Median Age 26.5 26.5 27.6 28.7<br />
2003 Est. Male Population 47.8% 47.5% 47.4% 46.9%<br />
2003 Est. Female Population 52.2% 52.5% 52.6% 53.1%<br />
2003 Est. Never Married 45.3% 43.8% 42.4% 41.3%<br />
2003 Est. Now Married 25.4% 25.4% 26.9% 27.6%<br />
2003 Est. Separated or Divorced 20.4% 21.9% 21.3% 21.4%<br />
2003 Est. Widowed 8.9% 8.9% 9.4% 9.7%<br />
2003 Est. HH <strong>Inc</strong>ome $200,000 or More 0.3% 0.4% 0.6%<br />
2003 Est. HH <strong>Inc</strong>ome $150,000 to 199,999 0.5% 0.6% 0.7% 0.8%<br />
2003 Est. HH <strong>Inc</strong>ome $100,000 to 149,999 2.0% 2.7% 3.2% 3.5%<br />
2003 Est. HH <strong>Inc</strong>ome $75,000 to 99,999 4.6% 5.2% 5.4% 5.9%<br />
2003 Est. HH <strong>Inc</strong>ome $50,000 to 74,999 10.8% 11.5% 12.8% 13.6%<br />
2003 Est. HH <strong>Inc</strong>ome $35,000 to 49,999 13.6% 13.9% 14.3% 14.5%<br />
2003 Est. HH <strong>Inc</strong>ome $25,000 to 34,999 13.7% 13.1% 13.3% 13.2%<br />
2003 Est. HH <strong>Inc</strong>ome $15,000 to 24,999 12.9% 13.6% 13.8% 13.6%<br />
2003 Est. HH <strong>Inc</strong>ome $0 to 14,999 41.5% 39.1% 36.1% 34.3%<br />
2003 Est. Average Household <strong>Inc</strong>ome $ 31,114 $ 31,631 $ 33,777 $ 35,350<br />
2003 Est. Median HH <strong>Inc</strong>ome $ 21,895 $ 23,147 $ 25,430 $ 27,191<br />
2003 Est. Per Capita <strong>Inc</strong>ome $ 9,878 $ 9,967 $ 11,256 $ 12,185<br />
2003 Est. Number of Businesses 641 1,583 3,917 7,433<br />
2003 Est. Total Number of Employees 7,837 17,718 43,813 74,513<br />
This report was produced using data from private and government sources deemed to be reliable. The information herein is provided without representation or warranty.<br />
©2005, Sites USA, Tempe, Arizona, 480-491-1112 - 1 of 3 - Demographic Source: Applied Geographic Solutions / TIGER Geography 06/03