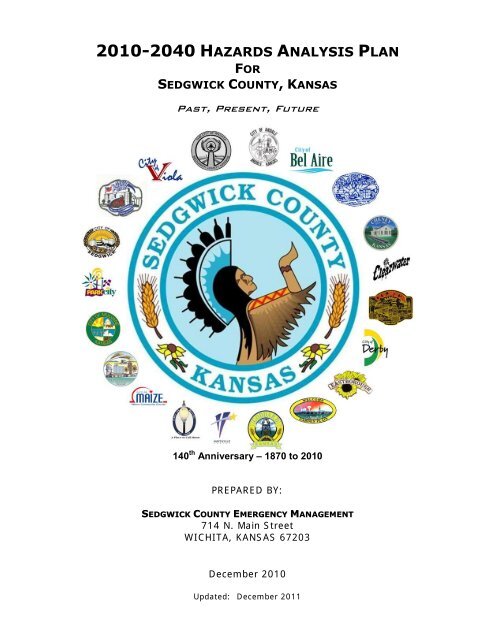
2010-2040 HAZARDS ANALYSIS PLAN for Sedgwick County, Kansas
2010-2040 HAZARDS ANALYSIS PLAN for Sedgwick County, Kansas
2010-2040 HAZARDS ANALYSIS PLAN for Sedgwick County, Kansas

You also want an ePaper? Increase the reach of your titles
YUMPU automatically turns print PDFs into web optimized ePapers that Google loves.
<strong>2010</strong>-<strong>2040</strong> <strong>HAZARDS</strong> <strong>ANALYSIS</strong> <strong>PLAN</strong><br />
FOR<br />
SEDGWICK COUNTY, KANSAS<br />
Past, Present, Future<br />
140 th Anniversary – 1870 to <strong>2010</strong><br />
PREPARED BY:<br />
SEDGWICK COUNTY EMERGENCY MANAGEMENT<br />
714 N. Main Street<br />
WICHITA, KANSAS 67203<br />
December <strong>2010</strong><br />
Updated: December 2011
<strong>2010</strong>-<strong>2040</strong> <strong>HAZARDS</strong> <strong>ANALYSIS</strong> <strong>PLAN</strong><br />
SIGNATURE OF CONCURRENCE<br />
This multi-hazard hazard analysis plan identifies those hazards that may face our communities and the risks<br />
our communities may face. Included are the probable and catastrophic implications from these identified<br />
hazards to help identify areas that may need Mitigation to reduce the probability of occurrence and minimize<br />
the effects of unavoidable incidents; Preparedness to respond to emergency/ disaster situations; Response<br />
actions during an emergency/disaster; and Recovery operations that will ensure the orderly return to normal<br />
or improved levels following an emergency/disaster.<br />
__________________________________________<br />
David Unruh<br />
Date<br />
Chair, <strong>Sedgwick</strong> <strong>County</strong> BoCC<br />
__________________________________________<br />
William Buchanan<br />
Date<br />
Manager, <strong>Sedgwick</strong> <strong>County</strong><br />
__________________________________________<br />
Carl Brewer<br />
Date<br />
Mayor, City of Wichita<br />
__________________________________________<br />
Robert Layton<br />
Date<br />
Manager, City of Wichita<br />
__________________________________________<br />
Robert Lamkey<br />
Date<br />
Director, <strong>Sedgwick</strong> <strong>County</strong> Division of Public Safety<br />
__________________________________________<br />
Randall C. Duncan<br />
Date<br />
Director, <strong>Sedgwick</strong> <strong>County</strong> Emergency Management<br />
i
<strong>2010</strong>-<strong>2040</strong> <strong>HAZARDS</strong> <strong>ANALYSIS</strong> <strong>PLAN</strong><br />
Special Acknowledgements<br />
<strong>Sedgwick</strong> <strong>County</strong> Water Supply and Wastewater Management Assessment 2004 – <strong>Sedgwick</strong> <strong>County</strong> Code<br />
En<strong>for</strong>cement, <strong>Sedgwick</strong> <strong>County</strong> Conservation District, <strong>Sedgwick</strong> <strong>County</strong> Environmental Resources<br />
Wichita Area Metropolitan Planning Organization (WAMPO)<br />
Metropolitan Transportation Plan 2035<br />
<strong>2010</strong> Freight Plan<br />
2007 Railroad Crossing Plan<br />
2008 South Area Transportation Study<br />
<strong>2010</strong> Coordinated Public Transit – Human Services Plan<br />
Derby-Mulvane Joint Area Plan <strong>2010</strong>-2030<br />
ii
<strong>2010</strong>-<strong>2040</strong> <strong>HAZARDS</strong> <strong>ANALYSIS</strong> <strong>PLAN</strong><br />
TABLE OF CONTENTS<br />
SIGNATURE OF CONCURRENCE<br />
SPECIAL ACKNOWLEDGEMENTS<br />
TABLE OF CONTENTS<br />
i<br />
ii<br />
iii<br />
INTRODUCTION<br />
I<br />
1 PURPOSE 1<br />
2 FEDERAL GUIDANCE 1<br />
2.1 NATIONAL RESPONSE FRAMEWORK (NRF) 1<br />
2.2 EMERGENCY SUPPORT FUNCTIONS 2<br />
2.3 NATIONAL INCIDENT MANAGEMENT SYSTEM (NIMS) 3<br />
2.4 NATIONAL INFRASTRUCTURE PROTECTION <strong>PLAN</strong> (NIPP) 3<br />
3 EMERGENCY MANAGEMENT 5<br />
4 HISTORY 6<br />
4.1 KANSAS 6<br />
4.2 EARLY SEDGWICK COUNTY 6<br />
4.3 EARLY TERRITORIES 9<br />
4.4 EARLY TOWNS AND CITIES 10<br />
5 DEMOGRAPHICS 21<br />
5.1 POPULATION 21<br />
5.2 MIGRATION 23<br />
5.3 LAND USE 23<br />
5.4 PROJECTED GROWTH 25<br />
5.5 METROPOLITAN STATISTICAL AREA 26<br />
5.6 WICHITA AREA METROPOLITAN <strong>PLAN</strong>NING ORGANIZATION (WAMPO) REGION 27<br />
5.7 SUSCEPTIBLE POPULATIONS 30<br />
5.7.1 ELDERLY 30<br />
5.7.2 FUNCTIONAL NEEDS/DISABILITY 30<br />
5.7.3 SPECIAL NEEDS CONSIDERATIONS 35<br />
5.7.4 HOMELESS 35<br />
5.8 SOCIAL VULNERABILITY INDEX (SOVI) 36<br />
5.9 EXPOSURE OF BUILT ENVIRONMENT 38<br />
5.10 SPATIAL HAZARD EVENTS AND LOSSES DATABASE FOR THE U.S. (SHELDUS) 38<br />
5.11 INDUSTRY OVERVIEW 41<br />
5.12 TRADE 44<br />
6 GEOLOGY/HYDROGEOLOGY 42<br />
6.1 GEOHYDROLOGY 43<br />
6.2 OIL AND GAS 45<br />
6.3 SOILS – GENERAL 48<br />
6.4 SOILS – ANIMAL DISPOSAL AND DEBRIS 50<br />
6.5 SEDGWICK BASIN PROVIDENCE/ANTICLINES 52<br />
6.6 SINKHOLES (SEE ALSO KARST) 53<br />
6.7 FAULTS 53<br />
6.8 SALT CONTAMINATION OF GROUND WATER IN SOUTH CENTRAL KANSAS 54<br />
6.9 HUTCHINSON SALT MEMBER 55<br />
6.10 KARST 57<br />
iii
<strong>2010</strong>-<strong>2040</strong> <strong>HAZARDS</strong> <strong>ANALYSIS</strong> <strong>PLAN</strong><br />
7 THREATENED AND ENDANGERED SPECIES 61<br />
8 WETLANDS 65<br />
9 SECTOR SPECIFIC AREAS 66<br />
9.1 AGRICULTURE AND FOOD SECTOR 66<br />
9.2 BANKING AND FINANCE SECTOR 70<br />
9.3 CHEMICALS AND HAZARDOUS MATERIALS SECTOR 72<br />
9.4 COMMERCIAL FACILITIES SECTOR 73<br />
9.5 COMMUNICATIONS SECTOR 76<br />
9.6 CRITICAL MANUFACTURING SECTOR 80<br />
9.7 DAMS SECTOR 83<br />
9.7.1 CHENEY DAM AND RESERVOIR 86<br />
9.7.2 LAKE AFTON PARK/KING DAM 87<br />
9.7.3 ANDALE WSD FRD NO. A-2 DAM 88<br />
9.7.4 FAWN LAKE DAM (KANSAS #3774) 89<br />
9.7.5 WICHITA-VALLEY CENTER LOCAL PROTECTION PROJECT 89<br />
9.7.6 COWSKIN CREEK LOCAL FLOOD PROTECTION PROJECT 90<br />
9.7.7 COWSKIN CREEK STORMWATER MASTER DRAINAGE <strong>PLAN</strong> 91<br />
9.8 DEFENSE INDUSTRIAL BASE SECTOR 92<br />
9.9 Emergency Services Sector 95<br />
9.9.1 LAW ENFORCEMENT 95<br />
9.9.2 FIRE DEPARTMENTS 101<br />
9.9.3 SEDGWICK COUNTY EMERGENCY MANAGEMENT (SCEM) 102<br />
9.9.4 SEDGWICK COUNTY EMERGENCY MEDICAL SERVICE (SCEMS) 103<br />
9.10 ENERGY SECTOR 105<br />
9.10.1 ELECTRICAL DISTRIBUTION SYSTEM 105<br />
9.10.2 PETROLEUM DISTRIBUTION SYSTEM 115<br />
9.10.3 NATURAL GAS DISTRIBUTION SYSTEM 117<br />
9.11 GOVERNMENT FACILITIES SECTOR 119<br />
9.12 HEALTHCARE AND PUBLIC HEALTH SECTOR 123<br />
9.13 INFORMATION TECHNOLOGY (IT) SECTOR 135<br />
9.14 MONUMENTS AND ICONS SECTOR 136<br />
9.15 Nuclear Reactors, Materials, and Waste Sector (or Nuclear Sector) 130<br />
9.16 POSTAL AND SHIPPING SECTOR 132<br />
9.17 TRANSPORTATION SYSTEMS SECTOR 135<br />
9.17.1 SAFETY 135<br />
9.17.2 SECURITY 136<br />
9.17.3 OPERATIONS AND MAINTENANCE 136<br />
9.17.4 HIGHWAYS 137<br />
9.17.5 BICYCLE AND PEDESTRIAN 149<br />
9.17.6 MOTOR CARRIERS 149<br />
9.17.7 AVIATION 151<br />
9.17.8 RAILROAD 156<br />
9.18 Water Sector 178<br />
9.18.1 WATER DISTRIBUTION SYSTEM (URBAN) 179<br />
9.18.2 EQUUS BEDS AQUIFER STORAGE AND RECOVERY (ASR) PROJECT 180<br />
9.18.3 WATER DISTRIBUTION SYSTEM (RURAL) 182<br />
9.18.4 WATERSHEDS AND DISTRICTS 188<br />
SEDGWICK COUNTY STATISTICAL DATA CHART 207<br />
RISK ASSESSMENT<br />
10 HAZARD EVENT DETERMINATIONS 208<br />
10.1 HAZARD SEVERITY RATING 208<br />
iv
<strong>2010</strong>-<strong>2040</strong> <strong>HAZARDS</strong> <strong>ANALYSIS</strong> <strong>PLAN</strong><br />
10.2 MITIGATION <strong>PLAN</strong> METHODOLOGY 209<br />
11 HAZARD VULNERABILITY VS RISK ASSESSMENT 211<br />
11.1 FLOODS 211<br />
11.2 TORNADOES 215<br />
11.3 STORMS (WINTER-SUMMER) 223<br />
11.3.1 STORM CLASSIFICATIONS 223<br />
11.3.2 STORM DAMAGE EVENTS 223<br />
11.3.3 THUNDERSTORMS 224<br />
11.3.4 HAIL 225<br />
11.3.5 SNOW AND ICE STORMS 226<br />
11.4 DROUGHT 230<br />
11.5 EARTHQUAKES 239<br />
11.6 FOG 244<br />
11.7 HAZARDOUS MATERIAL 246<br />
11.7.1 U.S. CENSUS BUREAU GENERAL DEFINITIONS 247<br />
11.7.2 HAZARDOUS MATERIAL DEFINITIONS 247<br />
11.7.3 HAZARDOUS SUBSTANCE DEFINITIONS 248<br />
11.7.4 HAZARDOUS MATERIAL CLASSIFICATIONS (USDOT) 248<br />
11.7.5 HAZARDOUS MATERIAL CATEGORIES 248<br />
11.7.6 COMMODITY CODE CLASSIFICATIONS 249<br />
11.7.7 2007 U.S. COMMODITY FLOW SURVEY 250<br />
11.7.8 HAZARDOUS MATERIALS SHIPMENTS 253<br />
11.7.9 COMMODITY TYPES 254<br />
11.7.10 U.S. EPA TOXIC RELEASE INVENTORY (TRI) 255<br />
11.7.11 NATIONAL RESPONSE CENTER 256<br />
11.7.12 HAZMAT INCIDENT SUMMARY 257<br />
11.7.13 RADIOLOGICAL CONCERNS/INCIDENTS 257<br />
11.7.14 NUCLEAR WEAPONS TRANSPORTATION 257<br />
11.7.15 METHAMPHETAMINE/CLANDESTINE LAB INCIDENTS 258<br />
11.7.16 WASTE TRANSFERS 258<br />
11.7.17 SUSCEPTIBLE POPULATION PROXIMITY 259<br />
11.8 RADIOLOGICAL 260<br />
11.8.1 NUCLEAR WEAPON (IONIZING RADIATION) 260<br />
11.8.2 RADIOLOGICAL DISPERSAL DEVICE (RDD) 261<br />
11.8.3 ELECTROMAGNETIC RADIATION/PULSE (EMR/EMP) 261<br />
11.8.4 GEOMAGNETIC STORMS 263<br />
11.8.5 NATURAL EMP VS EMP ATTACK 263<br />
11.8.6 SOLAR CYCLES/FLARES AND CORONAL MASS EJECTIONS 263<br />
11.8.7 NOAA SPACE WEATHER SCALES 265<br />
11.9 FIRE/WILDFIRE 268<br />
11.10 WEAPON OF MASS DESTRUCTION 270<br />
11.10.1 Low Explosives 270<br />
11.10.2 High Explosives 270<br />
11.10.3 Tertiary Explosives 270<br />
11.10.4 Emergency Response Calls 270<br />
11.11 POLLUTION 272<br />
11.11.1 AIR QUALITY 272<br />
11.11.2 WASTE CHEMICAL RELEASES 272<br />
11.11.3 HAZARDOUS WASTE SITES 272<br />
11.11.4 DISPOSAL/SOLID WASTE SITES 272<br />
11.12 DAMS AND LEVEES 277<br />
11.12.1 TUTTLE CREEK DAM STUDY 277<br />
11.13 EMERGING PUBLIC HEALTH THREATS 279<br />
11.13.1 HISTORY 279<br />
11.13.2 COMMUNICABLE DISEASE 279<br />
11.13.3 REPORTABLE DISEASE OUTBREAKS 280<br />
v
<strong>2010</strong>-<strong>2040</strong> <strong>HAZARDS</strong> <strong>ANALYSIS</strong> <strong>PLAN</strong><br />
11.13.4 EPIDEMIC AND PANDEMIC DISEASES 281<br />
11.13.5 NATURALLY OCCURRING OUTBREAKS 282<br />
11.13.6 BIOLOGICAL WEAPON POTENTIAL 282<br />
11.14 UTILITIES 284<br />
11.14.1 ELECTRIC 284<br />
11.14.2 PIPELINES 284<br />
11.15 TRANSPORTATION ACCIDENTS 286<br />
11.16 CIVIL DISTURBANCES 287<br />
11.16.1 HATE GROUPS 287<br />
11.16.2 GANGS 288<br />
11.16.3 ACTIVIST GROUPS 289<br />
11.16.4 TERRORISM 290<br />
11.17 SINKHOLES/SUBSIDENCE 298<br />
11.18 ASTEROIDS AND METEORITES 300<br />
11.19 CYBERSPACE THREATS 303<br />
11.19.1 THREAT AND VULNERABILITY: A 5-LEVEL PROBLEM 304<br />
11.19.2 EXAMPLE ATTACKS (2008) 305<br />
11.19.3 RESOURCES 305<br />
SUMMARY 308<br />
DEFINITIONS 313<br />
BIBLIOGRAPHY<br />
BIBLIOGRAPHY – WEB SITES<br />
APPENDIX A<br />
APPENDIX B<br />
vi
<strong>2010</strong>-<strong>2040</strong> <strong>HAZARDS</strong> <strong>ANALYSIS</strong> <strong>PLAN</strong><br />
FOREWORD<br />
The <strong>Sedgwick</strong> <strong>County</strong> Multi-Jurisdictional Hazard Analysis Plan (HAP) is an all-hazards multi-jurisdictional<br />
plan that was created to provide the public an overview of the hazards that can impact or have impacted<br />
<strong>Sedgwick</strong> <strong>County</strong> and the surrounding area. The in<strong>for</strong>mation was compiled from existing community plans,<br />
internet resources, departmental input, and specialized committees/organizations to ensure the accuracy<br />
and completeness of this plan.<br />
Historically, the 1984 plan contained general in<strong>for</strong>mation on risk and hazards and was superseded by a more<br />
comprehensive 2006 hazards analysis plan. With the advent of the U.S. Department of Homeland Security’s<br />
national plans (National Response Framework and National Infrastructure Protection Plan), this plan<br />
incorporates the essence of those plans to meet the needs of the local jurisdictions and allows <strong>for</strong> interface<br />
with the national plans in meaning and content. An explanation of this process is contained in the<br />
introduction portion of this plan and the <strong>for</strong>mat mirrors the national plans <strong>for</strong> consistency.<br />
This plan addresses a historical review of what existed and the hazards the early pioneers faced and leading<br />
up to the present risks and hazards our communities currently face. In order to better prepare <strong>for</strong> future risks<br />
and hazards our communities face, including regionally, this plan incorporates future projections (to the year<br />
<strong>2040</strong>) based on available data and trends from multiple sources.<br />
In addition, preparation of this plan incorporates planning guidance outlined in the National Response<br />
Team’s (NRT) 2001 Hazardous Materials Emergency Planning Guide (NRT-1), and the U.S. Environmental<br />
Protection Agency’s Chemical Emergency Preparedness Program ―Green Book‖ supplemental guidance<br />
entitled ―Technical Guidance <strong>for</strong> Hazardous Analysis.‖<br />
Until further notice, requests <strong>for</strong> in<strong>for</strong>mation related to industry storage reporting, layouts and emergency<br />
operating plans covered under the Superfund Amendments and Reauthorization Act (SARA) Title III will be<br />
reviewed by the Local Emergency Planning Committee (LEPC) on a case by case basis <strong>for</strong> determining<br />
applicability of K.S.A § 45-221(12) of the <strong>Kansas</strong> Open Records Act which states ―Records of emergency or<br />
security in<strong>for</strong>mation or procedures of a public agency, or plans, drawings, specifications or related<br />
in<strong>for</strong>mation <strong>for</strong> any building or facility which is used <strong>for</strong> purposes requiring security measures in or around the<br />
building or facility or which is used <strong>for</strong> the generation or transmission of power, water, fuels or<br />
communications, if disclosure would jeopardize security of the public agency, building or facility.‖ This<br />
includes specific in<strong>for</strong>mation regarding critical infrastructure contained within or serving <strong>Sedgwick</strong> <strong>County</strong>.<br />
vii
<strong>2010</strong>-<strong>2040</strong> <strong>HAZARDS</strong> <strong>ANALYSIS</strong> <strong>PLAN</strong><br />
SECTION 1<br />
INTRODUCTION
<strong>2010</strong>-<strong>2040</strong> <strong>HAZARDS</strong> <strong>ANALYSIS</strong> <strong>PLAN</strong><br />
1 PURPOSE<br />
The purpose of a hazards analysis plan is to identify the potential hazards facing a community - whether<br />
they are natural, technological or socially related. The plan follows a three-step decision making process<br />
and is designed to consider all potential hazards within the planning district and to identify which hazards<br />
are of high priority and should be addressed in the emergency planning process. The three components<br />
or processes of the plan include:<br />
Hazards Identification – Typically provides specific in<strong>for</strong>mation on situations that have the<br />
potential <strong>for</strong> causing injury to life or damage to property and the environment. It is an approach<br />
<strong>for</strong> prevention, mitigation, preparedness, response, continuity, and recovery that addresses a full<br />
range of threats and hazards, including natural, technological, and socially caused.<br />
Vulnerability Analysis – Vulnerabilities include potential human impact, property impact, business<br />
impact, and impact on resources both internal and external. It also looks at the magnitude of the<br />
disaster/emergency, frequency of occurrence, speed of onset, and severity.<br />
Potential Human Impact – Identifies the possibility of death or injury to people<br />
Potential Business Impact - Considers the potential loss of market share and business<br />
interruption to include:<br />
Employees unable to report to work<br />
Customers unable to reach facility<br />
Company in violation of contractual agreements<br />
Imposition of fines and penalties or legal costs<br />
Interruption of critical supplies<br />
Interruption of product distribution<br />
Potential Property Impact – Identifies the potential <strong>for</strong> losses and damages to include vital<br />
records, equipment, products and services, lifeline services, and operations.<br />
Internal and External Resources – Identifies the need to respond and recover to include<br />
lifeline services, agreements, training, and backup systems<br />
Risk Assessment – is the predicted or probable impact that a hazard would have on the people,<br />
services, and specific facilities in the community. (FEMA IS-235) This includes life safety (hazard<br />
areas, high-risk populations, etc), essential facilities, and critical infrastructure. Risks can range<br />
from negligible to catastrophic.<br />
OTHER <strong>PLAN</strong>S<br />
The <strong>Sedgwick</strong> <strong>County</strong> Local Emergency Operations Plan (LEOP) utilizes the in<strong>for</strong>mation contained in<br />
this plan to address response procedures by public and private agencies in the event of an<br />
emergency or disaster. The <strong>Sedgwick</strong> <strong>County</strong> All-Hazards Mitigation Plan identifies the effects of the<br />
hazards presented in this plan to minimize or eliminate those hazards facing our communities. This<br />
plan also assists and aids in the development of individualized emergency and crisis plans prepared<br />
by public and private agencies and individuals.<br />
2 FEDERAL GUIDANCE<br />
2.1 NATIONAL RESPONSE FRAMEWORK (NRF)<br />
The National Response Framework (NRF) presents the guiding principles that enable all response<br />
partners to prepare <strong>for</strong> and provide a unified national response to disasters and emergencies. It<br />
1
ESF #1<br />
ESF #2<br />
ESF #3<br />
ESF #4<br />
ESF #5<br />
ESF #6<br />
ESF #7<br />
ESF #8<br />
ESF #9<br />
ESF #10<br />
ESF #11<br />
ESF #12<br />
ESF #13<br />
ESF #14<br />
ESF #15<br />
<strong>2010</strong>-<strong>2040</strong> <strong>HAZARDS</strong> <strong>ANALYSIS</strong> <strong>PLAN</strong><br />
establishes a comprehensive, national, all-hazards approach to domestic incident response. It is built<br />
upon scalable, flexible, and adaptable coordinating structures to align key roles and responsibilities<br />
across the Nation. It describes specific authorities and best practices <strong>for</strong> managing incidents that range<br />
from the serious but purely local, to large-scale terrorist attacks or catastrophic natural disasters. The<br />
National Response Framework defines the principles, roles, and structures that organize how we respond<br />
as a nation. The National Response Framework:<br />
Describes how communities, tribes, states, the federal government, private-sectors, and<br />
nongovernmental partners work together to coordinate national response;<br />
Describes specific authorities and best practices <strong>for</strong> managing incidents; and builds upon the<br />
National Incident Management System (NIMS), which provides a consistent template <strong>for</strong><br />
managing incidents.<br />
The term ―response‖ as used in NRF includes immediate actions to save lives, protect property and the<br />
environment, and meet basic human needs. Response also includes the execution of emergency plans<br />
and actions to support short-term recovery. In <strong>Sedgwick</strong> <strong>County</strong>, the Local Emergency Operations Plan<br />
(LEOP) applies the NRF principles that guide the response, roles and responsibilities, response actions,<br />
response organizations, and planning requirements to achieve an effective local and regional response to<br />
any incident that occurs.<br />
2.2 EMERGENCY SUPPORT FUNCTIONS<br />
Emergency Support Functions (ESFs) are used by the Federal Government and many State and local<br />
governments as the primary mechanism to organize and provide resources needed <strong>for</strong> efficient incident<br />
management. ESFs align categories of resources and provide strategic objectives <strong>for</strong> their use.<br />
ESFs utilize standardized resource management concepts such as typing, inventorying, and tracking to<br />
facilitate the dispatch, deployment, and recovery of resources be<strong>for</strong>e, during, and after an incident.<br />
CRITICAL INFRASTRUCTURE/KEY RESOURCE AS IT RELATES TO INCIDENT MANAGEMENT<br />
Critical<br />
Infrastructure/Key<br />
Resource<br />
Agriculture & Food X X X<br />
Banking & Finance X X<br />
Chemical X X<br />
Commercial Facilities X X X X X<br />
Communications X X<br />
Critical Manufacturing X X X X X X X<br />
Dams X X<br />
Defense Industrial<br />
Base<br />
X<br />
X<br />
Emergency Services X X X X X X X X X X X X X X<br />
Energy<br />
Government Facilities X X X X X<br />
Healthcare & Public<br />
Health<br />
X X X X<br />
In<strong>for</strong>mation<br />
Technology<br />
X X X<br />
Monuments & Icons X X X X X<br />
Nuclear Reactors,<br />
Materials & Waste<br />
X X X<br />
Postal & Shipping X X X X<br />
Transportation<br />
Systems<br />
X X X<br />
Water X X X<br />
2
<strong>2010</strong>-<strong>2040</strong> <strong>HAZARDS</strong> <strong>ANALYSIS</strong> <strong>PLAN</strong><br />
2.3 NATIONAL INCIDENT MANAGEMENT SYSTEM (NIMS)<br />
In Homeland Security Presidential Directive 5 (HSPD-5), Management of Domestic Incidents, the<br />
President directed the Secretary of Homeland Security to develop, submit <strong>for</strong> review to the Homeland<br />
Security Council, and administer a National Incident Management System (NIMS). This system will<br />
provide a consistent nationwide approach <strong>for</strong> Federal, State, local, and tribal governments to work<br />
effectively and efficiently together to prepare <strong>for</strong>, prevent, respond to, and recover from domestic<br />
incidents, regardless of cause, size, or complexity. The NIMS enhances the management of domestic<br />
incidents by establishing a single, comprehensive system <strong>for</strong> incident management and will help achieve<br />
greater cooperation among Departments and agencies at all levels of government.<br />
2.4 NATIONAL INFRASTRUCTURE PROTECTION <strong>PLAN</strong> (NIPP)<br />
The National Infrastructure Protection Plan provides the unifying structure <strong>for</strong> the integration of a wide<br />
range of ef<strong>for</strong>ts <strong>for</strong> the enhanced protection and resiliency of the critical infrastructure and key resources<br />
(CIKR) into a single program. The overarching goal of the NIPP is to build a safer, more secure, and<br />
more resilient America by preventing, deterring, neutralizing, or mitigating the effects of deliberate ef<strong>for</strong>ts<br />
by terrorists to destroy, incapacitate, or exploit elements of the CIKR and to strengthen national<br />
preparedness, timely response, and rapid recovery of CIKR in the event of an attack, natural disaster, or<br />
other emergency. It establishes the overarching concepts relevant to all CIKR sectors identified under<br />
the authority of Homeland Security Presidential Directive 7 (HSPD-7), and addresses the physical, cyber,<br />
and human considerations required <strong>for</strong> effective implementation of protective programs and resiliency<br />
strategies.<br />
Risk Management<br />
The NIPP specifies the key initiatives, milestones, and metrics required to achieve the CIKR protection<br />
mission. It sets <strong>for</strong>th a comprehensive risk management framework and clearly defined roles and<br />
responsibilities <strong>for</strong> the Department of Homeland Security (DHS), Federal Sector-Specific Agencies<br />
(SSAs), and other Federal, State, local, tribal, territorial, and private sector partners. The cornerstone of<br />
the NIPP is its risk management framework, which establishes the processes <strong>for</strong> combining<br />
consequence, vulnerability, and threat in<strong>for</strong>mation to produce a comprehensive, systematic, and rational<br />
assessment of national or sector risk.<br />
The NIPP, the National Preparedness Guidelines (NPG), and the National Response Framework (NRF)<br />
together provide a comprehensive, integrated approach to the homeland security mission. The NIPP<br />
establishes the overall risk-in<strong>for</strong>med approach that defines the Nation’s CIKR protection posture, while<br />
the NRF provides the approach <strong>for</strong> domestic incident management. The NPG sets <strong>for</strong>th national priorities,<br />
doctrine, and roles and responsibilities <strong>for</strong> building capabilities across the prevention, protection,<br />
3
<strong>2010</strong>-<strong>2040</strong> <strong>HAZARDS</strong> <strong>ANALYSIS</strong> <strong>PLAN</strong><br />
response, and recovery mission areas. Increases in CIKR protective measures in the context of specific<br />
threats or that correspond to threat conditions provide an important bridge between NIPP steady-state<br />
protection and the incident management activities under the NRF.<br />
Sector-Specific Agency<br />
HSPD-7 designates a Federal Sector-Specific Agency (SSA) to lead CIKR protection ef<strong>for</strong>ts in each<br />
sector. The directive allows <strong>for</strong> the Department of Homeland Security to identify gaps in existing CIKR<br />
sectors and establish new sectors to fill these gaps. Each SSA developed a Sector-Specific Plan that<br />
details the application of the NIPP framework to the unique characteristics of their sector.<br />
A sector is a logical collection of assets, systems, or networks that provide a common function to the<br />
economy, government, or society. There are a total of 18 CIKR sectors, identified by the criteria set <strong>for</strong>th<br />
in HSPD-7. This document established U.S. policy <strong>for</strong> enhancing CIKR protection by establishing a<br />
framework <strong>for</strong> NIPP partners to identify, prioritize, and protect the Nation's CIKR from terrorist attacks.<br />
4
<strong>2010</strong>-<strong>2040</strong> <strong>HAZARDS</strong> <strong>ANALYSIS</strong> <strong>PLAN</strong><br />
CRITICAL INFRASTRUCTURE / KEY RESOURCE (CI/KR) SECTORS<br />
Critical Infrastructure: Those elements of a system so vital that disabling any of them could incapacitate<br />
the entire system.<br />
Current CIP policy, described in HSPD-7, defines responsibilities <strong>for</strong> DHS, sector-specific agencies, and<br />
other departments and agencies. It instructs federal departments and agencies to identify, prioritize, and<br />
coordinate the protection of critical infrastructure to prevent, deter, and mitigate the effects of attacks. The<br />
Secretary of Homeland Security is assigned several responsibilities, including establishing uni<strong>for</strong>m<br />
policies, approaches, guidelines, and methodologies <strong>for</strong> integrating federal infrastructure protection and<br />
risk management activities within and across sectors. To ensure the coverage of critical sectors, HSPD-7<br />
designated sector specific agencies <strong>for</strong> the critical infrastructure sectors identified. These agencies are<br />
responsible <strong>for</strong> infrastructure protection activities in their assigned sectors, which include coordinating and<br />
collaborating with relevant federal agencies, state and local governments, and the private sector to carry<br />
out their responsibilities and facilitating the sharing of in<strong>for</strong>mation about physical and cyber threats,<br />
vulnerabilities, incidents, potential protective measures, and best practices. Further, the sector-specific<br />
agencies are to continue to encourage the development of in<strong>for</strong>mation-sharing and analysis mechanisms<br />
and to support sector-coordinating mechanisms. Table 1 identifies the infrastructure sectors specified in<br />
federal policy and the related sector-specific agencies.<br />
3 EMERGENCY MANAGEMENT<br />
KSA 48-904(a) defines emergency management as the ―…preparation <strong>for</strong> and the carrying out of all<br />
emergency functions, other than functions <strong>for</strong> which military <strong>for</strong>ces or other federal agencies are primarily<br />
responsible, to prevent, minimize and repair injury and damage resulting from disaster.‖<br />
Emergency management provides a systematic, proactive approach guiding departments and agencies<br />
at all levels of government, the private sector, and nongovernmental organizations to work seamlessly<br />
regardless of cause, size, location, or complexity, in order to reduce the loss of life, property, and harm to<br />
the environment. While DHS identifies five elements (prepare <strong>for</strong>, respond to, recover from, and mitigate)<br />
traditional emergency management identifies four elements (mitigation, preparation, response, and<br />
recovery). This is an all-hazards approach which includes natural disasters, acts of terrorism, and other<br />
man-made disasters. Each of the management phases described above are not linear and can be<br />
intertwined with the Department of Homeland Security’s mission areas of prevent, protect, respond, and<br />
recover.<br />
Comprehensive Emergency Management System<br />
Disaster<br />
Mitigation – Taking sustained actions to reduce or eliminate long-term risks to people and<br />
property from hazards and their effects;<br />
Preparedness – Planning, training, and building the emergency management profession to<br />
prepare effectively <strong>for</strong>, mitigate against, respond to, and recover from any hazard;<br />
Response – Conducting emergency operations to save lives and property through positioning<br />
emergency equipment, personnel, and supplies, through evacuating potential victims, through<br />
providing food, water, shelter, and medical care to those in need, and through restoring critical<br />
public services; and<br />
Recovery – Rebuilding communities so individuals, businesses, and governments can function on<br />
their own, return to normal life, and protect against future hazards…‖<br />
KSA 48-904(d) defines disaster as ―…the occurrence or imminent threat of widespread or severe<br />
damage, injury or loss of life or property resulting from any natural or manmade cause, including, but not<br />
limited to, fire, flood, earthquake, wind, storm, epidemics, contagious or infectious disease, air<br />
contamination, blight, drought, infestation, explosion, riot, terrorism or hostile military or paramilitary<br />
action.‖<br />
5
<strong>2010</strong>-<strong>2040</strong> <strong>HAZARDS</strong> <strong>ANALYSIS</strong> <strong>PLAN</strong><br />
SECTION 2<br />
DEMOGRAPHICS
<strong>2010</strong>-<strong>2040</strong> <strong>HAZARDS</strong> <strong>ANALYSIS</strong> <strong>PLAN</strong><br />
4 HISTORY<br />
4.1 KANSAS<br />
<strong>Kansas</strong> became United States territory in 1803 as part of the Louisiana Purchase. The <strong>Kansas</strong> Territory<br />
consisted of a wide range of buffalo and Native American Indians living among the grasslands of the<br />
prairie with gypsum hills and limestone <strong>for</strong>mations surrounded by rivers and streams. As the pioneers<br />
proceeded into this frontier, they were met with droughts, grasshopper plagues, blizzards, and other<br />
natural phenomenon testing their will of endurance. Trails and dirt roads meant <strong>for</strong> commerce and trade<br />
along with military security helped the struggling pioneer spirit in securing their right to join the 33 states<br />
of the Union and become the 34th star on the flag on January 29, 1861 under the motto ―Ad Astra per<br />
Aspera," meaning "To the Stars with Difficulty."<br />
4.2 EARLY SEDGWICK COUNTY 1<br />
The county was organized in 1870 and was named <strong>for</strong> Union General John <strong>Sedgwick</strong> who was killed at<br />
the Battle of Spotsylvania in 1864. On March 1870, the Wichita town site plot was filed in El Dorado, the<br />
first county seat. It is unknown whether or not Francisco Vasquez de Coronado visited the Wichita<br />
location in 1541 while searching <strong>for</strong> the fabled cities of gold, but by 1757 a French map drawn by Du<br />
Pratz shows the junction of the Arkansas Rivers as ―A Gold Mine.‖ In 1836, Jesse Chisholm led an<br />
expedition from St. Louis to the convergence of the Arkansas and Little Arkansas rivers possibly in search<br />
of this ―gold.‖<br />
Be<strong>for</strong>e European settlement of <strong>Sedgwick</strong> <strong>County</strong>, the Osage Indians occupied<br />
the land along with Pawnees and the <strong>Kansas</strong> or ―Kaws‖ as they were<br />
nicknamed by the French. The ―Paducas‖ as the Osage Indians called them,<br />
ranged the western plains and are believed to have been the Cheyenne<br />
Indians as first encountered by M. Du Fissinet in 1719 and M. De Bourgamont<br />
in 1724, on the head of the Smoky Hill River. Commencing about 1832, the<br />
Indian population of <strong>Kansas</strong> was increased by seventeen tribes, who were<br />
located on reservations in the eastern fourth of the state, occupying about that<br />
entire region. When the Santa Fe Trail was established, it became the<br />
objective point of Indians from the Dakotas to the Rio Grande. To protect this<br />
route of traffic, and later the settlements, the government at various times<br />
constructed and maintained in <strong>Kansas</strong> twelve <strong>for</strong>ts and numbers of military<br />
posts.<br />
The Arkansas River is the Indian word "<strong>Kansas</strong>" with the French prefix of<br />
"Ark," a bow. The Wichita Indians were transients, fugitives from their distant<br />
homes, driven out by the exigencies of cruel war. They built their town of<br />
grass houses at the junction of the two rivers St. Peter and St. Paul of<br />
Coronado, or "Neshutsa" and "Neshutsa Shinka" of the Osages, in whose<br />
territory it was located, which became known all over the plains as "The<br />
Wichita Town," and on their village site has arisen the largest city in the state.<br />
The word "Wichita" is not a Wichita word at all, but an Osage word, and it was from the Osages<br />
themselves, many years ago, it was learned that the word meant "Scattered Lodges" or "Scattered<br />
Villages."<br />
The Native Americans known collectively as ―Wichitas‖ were remnants of tribes affiliated together when<br />
first known to settlers more than a century ago. They were composed of elements of the Wichitas,<br />
Wacoes, Towacanies and Kechies, who spoke the Wichita language, and the Caddoes, Ionies and<br />
Nadarkoes, who spoke the Caddo language. In 1863, came the Wichitas, who located near the mouth of<br />
1 HISTORY OF WICHITA AND SEDGWICK COUNTY, KANSAS – Past and Present – Including and Account of the Cities, Towns<br />
and Villages of the <strong>County</strong>, Hon. O.H. Bentley, Vol 1, C.F. Cooper & Company, Chicago, 1910<br />
6
<strong>2010</strong>-<strong>2040</strong> <strong>HAZARDS</strong> <strong>ANALYSIS</strong> <strong>PLAN</strong><br />
the Little River, and with whom the writer and others engaged in mercantile traffic, as also with the<br />
Osages, who made this valley their hunting ground. Their camps or villages were four or five miles up the<br />
Little River. At about the same time bands of Shawnees, Delawares, Kickapoos and others came and<br />
settled on neighboring streams.<br />
The river was the western hunting ground of the Osage Indians when the first explorers visited them on<br />
the Osage River. At that time they had a name which signified it was the young or offspring of the big<br />
river. The Arkansas was "Ne Shutsa" (red water); the Little Arkansas river, "Ne Shutsa Shinka" (the young<br />
or little red water), associating the two rivers as parent and child. 2<br />
This was the favorite hunting ground of the Little Osages, who usually came out in June and again in<br />
September, under their chief, Mint-sho-shin-ka (Little Bear), and No-po-wal-la, second chief. They<br />
camped along the Little Arkansas in the timber and made their lodges of rows of green poles set in the<br />
ground about eight feet apart, bent over and tied together, <strong>for</strong>ming an arch about six feet high; other poles<br />
would be lashed to the sides with willow withes, and all covered with dry buffalo skins, <strong>for</strong>ming very<br />
com<strong>for</strong>table houses, ten, twenty or more feet in length. Buffaloes were here in endless numbers, except<br />
in the winter months. The Osage (Wa Sashes), Wichita and plains Indians used the bow and arrow in<br />
killing buffalo.<br />
In the fall of 1863 some 1,500 Wichita Indians came and made their village on the little river near its<br />
junction. The name of their camp was Wichita, from which the present city of Wichita derives its name.<br />
They flourished on buffalo meat and the fine gardens of corn, beans, squash and melons they raised the<br />
next summer. They built cone-shaped houses of poles, thatched with grass, ten to twenty-five feet in<br />
diameter, fifteen to twenty feet high, very com<strong>for</strong>table and durable.<br />
They were a kind, gentle, honest people. At the same time there came from the South camps of<br />
Kickapoos, Shawnees, Delawares and others, who settled on the Walnut and White Water. These Indians<br />
were the friends of all the wild Indians of the plains, and so long as they remained the Southwestern<br />
frontier was safe from hostile attack. With these Indians as guides, we traveled all the plains in safety,<br />
and visited the wild tribes and thoroughly explored the country of the Cimarron, Canadian and Washita,<br />
the winter home of the wild tribes. These rivers some years later were stated by military men to be an<br />
unknown country, when the fact was that some of us knew that country well as early as 1864, and visited<br />
the wild tribes in their winter camps with teams and wagons <strong>for</strong> the purpose of trade, and came and went<br />
at all times, winter or summer, without difficulty, loss or hardship.<br />
There were pretty lively times along the Little Arkansas after the Wichitas came. The Osages were here<br />
part of the time. Parties of Kaw Indians occasionally came. The plains Indians came here visiting their<br />
friends, the Wichitas. Col. J. H. Leavenworth was sent to this point by the government to arrange with the<br />
wild Indians <strong>for</strong> a treaty of peace, as we could communicate with them at all times, and to him in a large<br />
measure should be given the credit <strong>for</strong> the success of the treaty of 1865.<br />
The most influential man among these Indians was Jesse Chisholm, a Cherokee, who was beloved of all<br />
the Indians. Jesse Chisholm laid out the trail bearing his name, from the Little Arkansas south to the north<br />
<strong>for</strong>k of the Canadian, and the stream running through Wichita was named <strong>for</strong> him, as he was the first<br />
person to build a house on it. The Treaty of the Little Arkansas was held on the east bank of the Little<br />
Arkansas, about six miles above its mouth, in the middle of October, 1865. The commissioners on the<br />
part of the United States were William S. Harney, Kit Carson, John B. Sanborn, William W. Bent, Jesse H.<br />
Leavenworth, Thomas Murphy, and James Steel. The Indians were represented by Moke-ta-ve-to (Black<br />
Kettle), Oh-to-ah-ne-so-to-wheo (Seven Bulls), Oh-has-tee (Little Raven), Oh-hah-mah-hah (Storm), and<br />
other chiefs and head men on the part of the Indians.<br />
2 HISTORY OF WICHITA AND SEDGWICK COUNTY, KANSAS – Past and Present – Including and Account of the Cities, Towns<br />
and Villages of the <strong>County</strong>, Hon. O.H. Bentley, Vol 1, C.F. Cooper & Company, Chicago, 1910<br />
7
<strong>2010</strong>-<strong>2040</strong> <strong>HAZARDS</strong> <strong>ANALYSIS</strong> <strong>PLAN</strong><br />
The Indians, several hundred in number, camped along the river, on either side, as did the one or two<br />
companies of soldiers who were present. The Wichita, Waco, Caddo, Ioneye, Towakony, Kechi, and<br />
other Indians, some 1,500 in number, were living here at the time, and were scattered along down the<br />
river to the junction. They had cultivated extensive gardens, and had scaffolds covered with sliced<br />
pumpkins, beans and corn, drying <strong>for</strong> winter use, with plenty of melons in their gardens, which were a<br />
feast to visiting brethren.<br />
About six miles above the junction was the western terminus of the great Osage trail from the Neosho<br />
and Verdigris to the Little Arkansas, evidently long in use, from the deep gullies washed in the trails on<br />
the slopes of the hills.<br />
In 1867 a detachment of the Fifth United States Infantry, under command of Col. Thomas F. Barr, was<br />
stationed near the mouth of the river, by the Indian village, where Wichita now stands. These troops<br />
brought the cholera epidemic with them, killing many Indians and about a dozen settlers from Butler<br />
<strong>County</strong>. About 1867 began the exodus of the Indians to the Indian Territory (Oklahoma).<br />
There were a number of Indian scares in <strong>Sedgwick</strong> <strong>County</strong>, and although no fighting took place here, a<br />
detachment of the Fifth United States infantry, under command of Col. Barr, was stationed on the site of<br />
Wichita in 1867. A number of the men, at the expiration of their term of enlistment, became settlers in the<br />
vicinity. During the last Indian scare, which occurred in 1874, more than 1,000 people from <strong>Sedgwick</strong>,<br />
Kingman, Sumner and Harvey counties came to Wichita in a single day. In a few days they all returned to<br />
their homes.<br />
During the year 1870 immigration poured into the county rapidly. The Osage Trust Lands embraced the<br />
territory of the county as far north as the north line of the second of the southern tiers of sections, in<br />
Township 26, a little over four miles north of the northern limits of the present site of Wichita, and, <strong>for</strong><br />
contiguity to the embryo city, the principal settlements were made on these lands.<br />
<strong>Sedgwick</strong> <strong>County</strong> was the northern terminus of the Chisholm Trail <strong>for</strong> a short time (1872-1876), and<br />
subsequently developed into an important cattle center. The Wichita and Southwestern Railroad<br />
Company (a branch of the Santa Fe) arrived in 1872, playing a crucial role in the development of the<br />
county's economic role in the state.<br />
In 1867, a blizzard with severe cold and deep snow came along about that time. It was so cold a loaded<br />
team could be driven across the stream on the ice. In 1874 and 1876, grasshopper infestation destroyed<br />
numerous crops coupled with drought conditions. On January 1, 1886, blizzard conditions existed<br />
throughout <strong>Kansas</strong>. On February 11, 1888, a smallpox epidemic occurred including Wichita which totaled<br />
47 cases and two deaths.<br />
The early development of the aircraft industry, beginning just prior to and during the 1920 saw the<br />
establishment of Cessna, Beech, Boeing, and other companies that made Wichita the center of the<br />
industry. Wichita is still a leader in military, commercial, and small aircraft production.<br />
8
<strong>2010</strong>-<strong>2040</strong> <strong>HAZARDS</strong> <strong>ANALYSIS</strong> <strong>PLAN</strong><br />
Otoe <strong>County</strong><br />
4.3 EARLY TERRITORIES 3<br />
Between February 17, 1860 and February 24, 1864, Otoe<br />
<strong>County</strong> embraced townships 21, 22, 23, and the northern 2/3<br />
of 24 in ranges 1 through 4 east of the sixth principal meridian.<br />
The boundaries were defined in the creating statute as:<br />
"Commencing at the northwest corner of Butler <strong>County</strong>; thence<br />
west to the 6th principal meridian; thence to a point 4 miles<br />
south of the 5th standard parallel, on the north line of the<br />
Osage reservation; thence east to a point due south of the<br />
southwest corner of Butler <strong>County</strong>; thence north to the place of beginning." Named <strong>for</strong> the Otoe [Oto]<br />
Indian tribe of Nebraska, the tribal name is derived from 'wat-ota,' meaning 'seekers of pleasure' or<br />
'lechers,' a name given them when they separated from their kindred tribes, the Iowa and Missouri.<br />
Apparently never organized, most of the territory once comprising Otoe is included in the present county<br />
of Butler, with the remainder in the eastern parts of Harvey and <strong>Sedgwick</strong> counties.<br />
Peketon <strong>County</strong><br />
Between February 21, 1860 and February 26, 1867, Peketon<br />
<strong>County</strong> included all territory west of the 6th principal meridian,<br />
and south of township 16 south, more than one-quarter of the<br />
state. The northeast corner was at the southwest corner of<br />
Dickinson <strong>County</strong>; from which point the northern boundary of<br />
Peketon ran west past what is now the <strong>Kansas</strong>/Colorado state<br />
line into southeastern Colorado, and the eastern boundary<br />
went south to the border of Indian Territory (now the state of<br />
Oklahoma). ―Peketon‖ is possibly from a Sac Indian word meaning flat land, but no definitive explanation<br />
has ever been found. Although Peketon <strong>County</strong> had a county seat )Beach Valley), it was never<br />
organized, and its territory became a part of Marion <strong>County</strong> in 1867.<br />
Washington <strong>County</strong><br />
Between August 30, 1855 and February 20, 1857, Washington<br />
<strong>County</strong>’s boundary was described as "Commencing at the<br />
southern boundary of the territory of <strong>Kansas</strong>, 15 miles west of a<br />
due south course from the mouth of Walnut creek, on the<br />
Arkansas river, and running from thence north 100 miles,<br />
thence west to the east line of Arapahoe county, thence south<br />
along said line to the place of beginning." The legislative Act of<br />
1855 originally created Washington <strong>County</strong> which included all<br />
of the unorganized territory in the south and west of the territory. It included the area of the present<br />
counties of Barber, Barton, Clark, Comanche, Edwards, Ford, Grant, Gray, Greeley, Hamilton, Harper,<br />
Harvey, Haskell, Hodgeman, Kearney, Kingman, Kiowa, Lane, the southwest corner of Marion, the<br />
southern part of McPherson, Meade, Morton, Ness, Pawnee, Pratt, Reno, Rice, Russell, Scott, <strong>Sedgwick</strong>,<br />
Seward, Staf<strong>for</strong>d, Stanton, Stevens, nearly all of Sumner, and Wichita. The <strong>County</strong> was named in honor<br />
of George Washington (1732-1799), first president of the United States. The name of Washington was<br />
given to a northeastern county in February 1857, leaving the original territory without a name until<br />
Peketon <strong>County</strong> was established in February 1860. Washington <strong>County</strong> was never organized, and there<br />
is no evidence that a county seat was ever established.<br />
3 <strong>Kansas</strong> State Historical Society<br />
9
<strong>2010</strong>-<strong>2040</strong> <strong>HAZARDS</strong> <strong>ANALYSIS</strong> <strong>PLAN</strong><br />
Hunter <strong>County</strong><br />
Between August 30, 1855 and February 24, 1864, the<br />
boundaries of Hunter <strong>County</strong> were created as: "Beginning at<br />
the southeast corner of Butler <strong>County</strong>; thence south to the<br />
southern boundary of the territory; then west 30 miles; thence<br />
north to a point west of the point of beginning; then 30 miles to<br />
the place of beginning." The new county was thus thirty miles<br />
east to west and about seventy-eight miles north to south.<br />
Probably named <strong>for</strong> Robert Mercer Taliaferro Hunter (1809-<br />
1887), a Virginia congressman and senator, who favored the admission of <strong>Kansas</strong> under the Lecompton<br />
Constitution. He was expelled from the Senate in 1861 <strong>for</strong> supporting the rebellion, and he served in the<br />
Confederate Senate and as Confederate Secretary of State. Hunter <strong>County</strong> was one of the original 33<br />
counties created by the first territorial legislature in 1855. In 1860, Irving <strong>County</strong> was created out of the<br />
northern part of Hunter. The county was never organized, and in 1864 it was annexed into Butler <strong>County</strong>.<br />
The greater portion of what was Hunter <strong>County</strong> is now included in Cowley <strong>County</strong>, with the remainder<br />
scattered among <strong>Sedgwick</strong>, Sumner, Butler, Elk, Chautauqua, and Greenwood counties.<br />
4.4 EARLY TOWNS AND CITIES<br />
Afton – The post office was established June 22, 1874 until July 10, 1886.<br />
Aleppo – A small hamlet of <strong>Sedgwick</strong> <strong>County</strong> is situated about 15 miles west of Wichita, the county seat,<br />
and 5 miles northwest of Goddard, from which place the inhabitants receive mail by rural free delivery.<br />
Goddard is the most convenient railroad station. 4 The post office was established May 26, 1891 until<br />
December 14, 1903.<br />
Andale – An incorporated town of <strong>Sedgwick</strong> <strong>County</strong> named after the founder’s names Anderson and<br />
Dale, is a station on the Missouri Pacific R. R., in Sherman Township, 19 miles northwest of Wichita. The<br />
post office was established January 16, 1889. Originally established June 4, 1863, the town of Magnolia<br />
in Allen <strong>County</strong> was discontinued and reinstated in <strong>Sedgwick</strong> <strong>County</strong> February 27, 1877 until June 26,<br />
1879. The town of Magnolia was again moved to present day Andale. Andale has a bank, a money<br />
order post office with one free delivery route which supplies mail to the inhabitants of that section of the<br />
county, a Catholic church and school, some good mercantile establishments, express and telegraph<br />
facilities, and does considerable shipping of grain and other farm products. The population in 1910 was<br />
237.<br />
Anness – Established February 25, 1887 until January 31, 1952. Originally established July 15, 1879,<br />
the town of Kalamazoo in Kingman <strong>County</strong> was discontinued and reinstated in <strong>Sedgwick</strong> <strong>County</strong> March<br />
16, 1883 until February 25, 1887 where it was moved to the site of Anness. A money order post office of<br />
<strong>Sedgwick</strong> <strong>County</strong>, is in Erie township, some 30 miles southwest of Wichita and not far from the Sumner<br />
county line. It is a station on the Atchison, Topeka & Santa Fe R. R. that runs from Wichita to Englewood,<br />
has a grain elevator, an express office, and through its retail stores supplies the people of that section<br />
with staple articles. The population was reported as 70 in 1910.<br />
Bayneville – Established September 3, 1884 until June 30, 1934.<br />
Bel Aire – Originally <strong>for</strong>med in January 1955 as an improvement district, the district was incorporated as<br />
a City on November 26, 1980 after the unanimous approval of the three members of the <strong>Sedgwick</strong><br />
<strong>County</strong> Board of Commissioners, and became a city of the Third Class ahead of Park City. The City of<br />
Bel Aire received State recognition to become a City of the Second Class in 1998. The one-million gallon<br />
water tower was constructed in 2002 along with a water and sewer plant.<br />
4 <strong>Kansas</strong>: A Cyclopedia of State History, Standard Pub. Co. Chicago : 1912<br />
10
<strong>2010</strong>-<strong>2040</strong> <strong>HAZARDS</strong> <strong>ANALYSIS</strong> <strong>PLAN</strong><br />
Bentley – A town in <strong>Sedgwick</strong> <strong>County</strong> named <strong>for</strong> Orsemus Hills Bentley, a state senator and one of the<br />
leading promoters of the <strong>Kansas</strong> Midland Railroad, later part of the Frisco, is located near the Arkansas<br />
river in Eagle township, and is a station on the St. Louis & San Francisco R. R., about 20 miles northwest<br />
of Wichita. The post office was established on March 6, 1883. It has a bank, a weekly newspaper (the<br />
News), a money order post office, telegraph and express service, telephone connection, and is the<br />
principal trading and shipping point <strong>for</strong> that section of the county. The population in 1910 was 200.<br />
Birch – Established February 11, 1879 until April 24, 1879, and again established July 23, 1879 until July<br />
14, 1894.<br />
Blendon – Established January 18, 1875 until January 10, 1884 when it moved to present day Goddard.<br />
Camp Davidson / Butterfield /Beecher – n order to protect settlers from hostile Indians and outlaw<br />
bands during the Arkansas River crossing, a detachment from Fort Harker was sent to establish Camp<br />
Davidson in June 1868 which was located on the convergence of the Little Arkansas and Arkansas Rivers<br />
(near Wichita North High School) on or near the site where J. R. Mead founded his trading post in the fall<br />
of 1863. The post changed its name to Camp Butterfield in October 1868 until finally Camp Beecher in<br />
November 1868 be<strong>for</strong>e the outpost was abandoned in October 1869.<br />
Cheney (see also Marshall) – Established September 20, 1883. Originally established May 8, 1876 until<br />
September 20, 1883, the town of Marshall moved to present day Cheney. An incorporated city of the<br />
third class in <strong>Sedgwick</strong> <strong>County</strong> named after Benjamin P. Cheney, of Boston, a onetime director of the<br />
Santa Fe Railroad , is located in Morton township, 26 miles west of Wichita, and is a station on the<br />
Wichita & Pratt division of the Atchison, Topeka & Santa Fe R. R. It has 2 banks, a grain elevator, a<br />
weekly newspaper (the Sentinel), hotels, mercantile houses, good public schools, etc. The population in<br />
1910 was 734. From its international money order post office three rural routes emanate, supplying daily<br />
mail to a large number of inhabitants of the Ninnescah valley. It has express, telegraph and telephone<br />
facilities, and is probably the most important shipping point on that division of the Santa Fe, with the<br />
exception of Kingman.<br />
Clarion – Established June 2, 1871 until January 23, 1882. The town was re-established March 1882<br />
until January 8, 1885.<br />
Clearwater – In 1868, Edward Murray settled on the north bank of the Ninnescah River and established a<br />
trading post <strong>for</strong> Texas cattlemen. Later it was taken over and renamed the Ninnescah Ranch which<br />
became a notorious place <strong>for</strong> outlaws complete with saloons. It was first settled in 1870 and on April 5,<br />
1871, the town of Clear Water (Indian word <strong>for</strong> Ninnescah) was established near the abandoned<br />
Ninnescah Ranch. In 1872, four streets were platted north/south and east/west and consisted of 252 lots<br />
with only a dozen marked <strong>for</strong> buildings. In 1874, the town experienced an Indian scare of reports of<br />
burning and scalping; however, the Indians never came with 70 miles of the area. By the summer of<br />
1876, Mr. Fred Barber got a contract to break ground on the present site of Clearwater (one mile<br />
southeast of Clear Water). It was not until 1884 when the Missouri Pacific Railroad built a line to<br />
Clearwater and the Santa Fe Railroad in 1886 that the town of Clear Water finally disappeared on<br />
February 17, 1894 when the post office moved to Clearwater. 5 By 1910, it was reported the town had a<br />
population of 569. In 1910, Clearwater had two banks, a money order post office with three rural routes,<br />
express and telegraph offices, telephone connections, a weekly newspaper (The Courant), Baptist,<br />
Christian, Methodist and Presbyterian churches, good public schools, and is the principal trading and<br />
shipping point <strong>for</strong> a rich agricultural district in the Ninnescah valley.<br />
Clonmel – Established March 14, 1905 until June 30, 1938.<br />
Colwich – Colwich was named <strong>for</strong> the Wichita and Colorado Railway (Col - Wich) which was responsible<br />
<strong>for</strong> the town being started, although several other possibilities exist <strong>for</strong> the name, to include naming the<br />
5 Ghost Towns of <strong>Kansas</strong>, Volume 2, Daniel Fitzgerald, 1979<br />
11
<strong>2010</strong>-<strong>2040</strong> <strong>HAZARDS</strong> <strong>ANALYSIS</strong> <strong>PLAN</strong><br />
town Louisa. After Eldridge and Hatfield disappeared, they lost their buildings and people to Colwich in<br />
late 1885 and early 1886. On September 1, 1885, the Eagle Townsite Company purchased the<br />
southeast quarter of Section 16 and granted a right-of-way to the Wichita and Colorado Railway on<br />
November 9, 1885. Between November 20, 1885 and January 1, 1886, 150 lots were sold, and the town<br />
was incorporated June 6, 1887. The earliest newspapers were The Colwich Rambler (February 10 to<br />
March 10, 1887) and The Colwich Courier (April 28, 1887 to December 30, 1892). Hog and cattle<br />
stockyards were built to the east of the depot in 1887. The opening of the Oklahoma Territory in 1893<br />
and an economic slump in the Wichita area during the 1890’s contributed to a significant loss of<br />
population. Although the railroad’s water tanks were considered the first fire protection, sometime around<br />
1900 firefighting equipment was purchased and used by volunteers, and notifications were made through<br />
the local telephone operator. The Westar Energy Gordon Evans Station went into service in 1961 and is<br />
located adjacent to the east city limits. 6<br />
Coronado – Established February 23, 1877 until January 9, 1882.<br />
Cosmosa – Established June 13, 1870 until April 21, 1871 be<strong>for</strong>e changing its name to Park City which<br />
was abandoned on April 24, 1876.<br />
Cowskin – Established December 8, 1870 until February 25, 1873 when the name was changed to Waco<br />
be<strong>for</strong>e finally discontinuing on January 14, 1905.<br />
Delano – Established April 5, 1871 until January 14, 1876, and again April 7, 1879 until December 6,<br />
1880 be<strong>for</strong>e finally annexed to the City of Wichita.<br />
Derby – Originally established as Sand Ford September 30, 1870, the, the name was changed to El Paso<br />
March 13, 1871. However, but because of confusion of the Texas town, there name was changed to<br />
Derby on July 5, 1881. Legend has it a railroad engineer saw some lads on their horses rushing up to<br />
meet the train and the scene reminded him of an English derby. The town is located on the Arkansas<br />
River and the Atchison, Topeka & Santa Fe R. R. 11 miles southeast of Wichita. It has a bank, a money<br />
order post office with three rural routes, telegraph and express offices, telephone connections, Catholic,<br />
Evangelical and Presbyterian churches, good public schools, several general stores, a hotel, etc., and is<br />
the principal shipping point <strong>for</strong> a rich agricultural district in the Arkansas valley. The population in 1910<br />
was 261.<br />
Diana – Established March 26, 1878 until August 1, 1881.<br />
Dry Creek – Established April 5, 1871 until October 15, 1872.<br />
Eastborough – In 1928, when Alton Smith announced "Wichita's finest residential section," the Fourth<br />
National Bank had just installed the city's first air-conditioning equipment; an airplane had just made the<br />
first night landing at Municipal Airport; and Wichita No. 1, a gusher, was brought in on the northern<br />
outskirts of Wichita. Eastborough was originally envisioned by Burdon Hunter, a British architect, and<br />
planned an English village complete with quaint English streets, named and patterned after the small<br />
boroughs of his native land. Eastborough's first developers included Alton H. Smith; Harrison W. Albright;<br />
and Harry T. Morgan. They planned the 215 acre tract, as Hunter had envisioned. Sale of Eastborough<br />
Village started April 10, 1929, but because the oil boom there was a lack of streets or adequate sewer<br />
system which resulted in its only appeal to be annexed by Wichita in 1930, which was turned down. That<br />
same year, with the Chamber of Commerce urging and supporting it, Eastborough Estates was <strong>for</strong>med to<br />
rescue the area. It was planned to incorporate when the first thirty homes were completed. The<br />
Woodlawn Addition operated by Earl Hutton had opened 12 years be<strong>for</strong>e Eastborough and already was<br />
sold out. The two subdivisions were ready to incorporate as a third class city. However, they could not<br />
agree upon a name <strong>for</strong> the street between them. The Woodlawn Addition wanted the street named<br />
Woodlawn. The Eastborough Addition wanted it named Eastborough Avenue. No mention was made as<br />
6 Colwich Community Pictorial History, 1972<br />
12
<strong>2010</strong>-<strong>2040</strong> <strong>HAZARDS</strong> <strong>ANALYSIS</strong> <strong>PLAN</strong><br />
to who would pave it. Alas, all was resolved - the original tract plus Woodlawn (a four square block area)<br />
incorporated as a 425 acre third class city June 1, 1937 upon the approval of the <strong>Sedgwick</strong> <strong>County</strong><br />
commissioners. Since 1937, Eastborough has developed into a small town covering two square miles<br />
with 21 streets. The third class city, once a long way from Wichita, is now completely surrounded by the<br />
larger first class city. There were several failing attempts to "annex" Eastborough; however, it is said that<br />
in 1951 or 1952 Pat Patterson got a <strong>Kansas</strong> City, <strong>Kansas</strong> Representative to pass a bill stating<br />
Eastborough could annex Wichita.<br />
Eldridge – Union Township had its beginnings in 1869 when Henry Pate and his four sons pre-empted<br />
1,200 acres of land. The first settlement in Union Township was Eldridge, which was located three miles<br />
north and one-half miles west of Colwich on the Charles Hyde farm in Section 4. Supplies and mail had<br />
to be brought down river by boat from Park City, located five miles east of his farm. Eldridge was named<br />
after Mr. Hyde’s colonel in the Civil War, and the post office was granted May 22, 1872. Eldridge School<br />
(District 59), organized in 1873 and located in Section 33 in Eagle Township, was the first district that<br />
served people in Colwich. 7 The post office closed April 3, 1886.<br />
Fayette – Established May 12, 1875 until March 17, 1884.<br />
Ferris – Established May 15, 1877 until October 3, 1882.<br />
Finlay – Originally established March 20, 1877 until March 19, 1879 when the name was changed to<br />
Herald be<strong>for</strong>e finally discontinuing until November 21, 1882.<br />
Furley – A village of <strong>Sedgwick</strong> <strong>County</strong> and a station on the Chicago, Rock Island & Pacific R. R. 15<br />
miles northeast of Wichita. The post office was established September 20, 1887 and closed June 30,<br />
1953. It had a money order post office with one rural route, a telegraph and express office, general<br />
stores and Implement houses, and is the principal shipping point <strong>for</strong> a rich agricultural district in the<br />
northeastern part of the county. The population in 1910 was 52.<br />
Germania – see Saint Mark and Germania<br />
Garden Plain – One of the leading towns of <strong>Sedgwick</strong> <strong>County</strong> the township was established August 19,m<br />
1875 until it closed on January 25, 1881. The post office was re-established January 15, 1883 and the<br />
town is located in the township of the same name with a station on the Wichita & Pratt division of the<br />
Atchison, Topeka & Santa Fe R. R. 20 miles west of Wichita. In 1910, it had a bank, a money order post<br />
office with one rural route, telegraph and express offices, telephone connections with the surrounding<br />
towns, general stores, hardware and implements houses, and is the shipping point <strong>for</strong> a rich agricultural<br />
district. Garden Plain was incorporated in 1902 and in 1910 reported a population of 296.<br />
Gladys – Established May 10, 1888 until November 14, 1891.<br />
Goddard – The town was named <strong>for</strong> J. F. Goddard, vice-president and general manager of the Santa Fe<br />
Railroad beginning in 1910. By 1873, Attica Township was established west of Wichita and drew many<br />
settlers from eastern states and European countries. A school house was built just north of the current<br />
city of Goddard. During this time a small settlement developed ten miles west of Wichita. It was called the<br />
Ten-Mile Post, and later, it was known as the Ten-Mile Corner. A town was established February 11,<br />
1875 and named Blendon. The Blendon Post Office was established in 1875. About the same time that<br />
Blendon was being built, another town was trying to develop southwest of Goddard on the A. L. Lyman<br />
farm. A post office, store and restaurant were established. A little creek running through the farm<br />
reminded Mary Lyman of her favorite song, "Flow Gently Sweet Afton." Consequently, she named both<br />
the creek and the post office "Afton." A Methodist church was planned at Blendon during 1882-1883, but<br />
be<strong>for</strong>e construction started the Santa Fe Railroad made its second survey and located the railroad 1 1/2<br />
miles south through the current city of Goddard. The town site of Goddard was platted on the John<br />
7 Colwich Community Pictorial History, 1972<br />
13
<strong>2010</strong>-<strong>2040</strong> <strong>HAZARDS</strong> <strong>ANALYSIS</strong> <strong>PLAN</strong><br />
Coleman farm. He homesteaded the land in 1875. The title to the NE 1/4-31-27 <strong>Sedgwick</strong> <strong>County</strong> was<br />
acquired by a patent from the U.S. Government. This had been a part of the Osage Indians Trust Lands.<br />
In 1883 Coleman sold the farm to C. M. Faulk, who, after 30 days, sold it to E. Wilder. He platted the<br />
original town of Goddard on September 20, 1883. Goddard received its name from J. F. Goddard, a<br />
surveyor, who was also the vice president and general manager of the Santa Fe Railroad Company. By<br />
March, 1884, the railroad tracks reached the present site of Goddard. A box car, on a siding, was set up<br />
as a telegraph office. The post office was started January 10, 1884. The depot, shown above, was<br />
completed in 1886. After Goddard became a town, the Blendon and Afton post offices were combined<br />
with Goddard. Several buildings were moved to Goddard from Blendon. A two-story town hall was moved<br />
to the corner of 3rd and Oak Street and a blacksmith shop was located on Cedar Street. The lumber <strong>for</strong><br />
the Methodist church at Blendon was reloaded, hauled to Goddard, and erected on its present site.<br />
Goddard was incorporated in 1910. Like most towns, Main Street was the primary place of business in<br />
early years. Some of the business included, W.W. Graves Restaurant and Henshaw Rooming House,<br />
A.B. Rishels's Palace Garage, the Goddard Bank which also contained the Post Office, Nolan's<br />
Mercantile store, and Kirker - Marsh Undertakers. Most of the buildings along the west side of Main Street<br />
were destroyed by fire in 1919. In the center of town, in the middle of Main Street, was an old windmill.<br />
The famous town pump was 146 feet deep. A large cement tank provided water <strong>for</strong> the horses when the<br />
farmers drove into town. The old landmark was taken down in 1953 in spite of strong opposition and Main<br />
Street was oiled. Work started on a $104,000 sewer project and disposal plant. An $80,000 water supply<br />
project was started including a water tower which was erected on the east side of the 100 block of North<br />
Main Street. This tower was dismantled in the late 1980's and replaced by the present water tower<br />
constructed in 1975.<br />
Good River – Established May 17, 1876 until October 30, 1882.<br />
Greenwich – A village of Payne township, <strong>Sedgwick</strong> <strong>County</strong>, is a station on the Missouri Pacific R. R. 10<br />
miles northeast of Wichita. The post office was established September 3, 1874, with one rural route, an<br />
express office, general stores, a feed mill, etc., and is a shipping point of some importance. The<br />
population in 1910 was 72.<br />
Hatfield – The town was located two and one-half miles east and a half mile north of Colwich. In 1883, a<br />
group of men from Wichita projected a railway line from Wichita to McPherson. Two settlers anticipating<br />
the arrival of the railroad built their corn fields into a town site. Two streets were laid out, several<br />
buildings were erected, and a post office was granted on June 20, 1884 which continued until February 1,<br />
1886 be<strong>for</strong>e moving to Maize. 8<br />
Haysville – W. Hays came to this area in the early 1870s. Prior to his arrival here he had served as a<br />
postmaster in Colorado and as Sheriff of <strong>Sedgwick</strong> <strong>County</strong>. In 1891 he platted the land that he owned so<br />
a town could be built. This land was E 1/2 NE 1/4 of section 6 and W 1/2 NW 1/4 of section 5, Township<br />
29 Range 1 East, <strong>Sedgwick</strong> <strong>County</strong> and totaled 161.15 acres. In 1874 a grist mill was built on the bank of<br />
the Cowskin to process corn that was harvested in the area. On November 13, 1887, Haysville was<br />
destroyed by a city-wide fire. At first there were no church buildings so meetings were held at homes,<br />
schools and the grist mill. The first churches to Haysville were the Methodist and the Prairie Home<br />
Christian Church. School District 57, Haysville's first school, was built in 1876 and consolidated with<br />
District 187 in 1946 to <strong>for</strong>m District 261. The Chicago, Rock Island and Pacific Railway bought land west<br />
of Haysville's Main Street in 1892. In 1903 a depot was opened and passenger trains shuttled people to<br />
and from Wichita. Some of the first businesses in this new town were a meat market, a couple of stores,<br />
lumberyard and a blacksmith. The post office was established in 1877, and the Haysville State Bank in<br />
1919. Haysville’s entire historic district was destroyed in the 1999 tornado. Destruction of the historic<br />
buildings began at the red brick schoolhouse at 79th and Seneca and continued north along Main taking<br />
out the elevator, bank, churches and more. The only thing left standing on the east side of main was the<br />
original bank vault.<br />
8 Ibid.<br />
14
<strong>2010</strong>-<strong>2040</strong> <strong>HAZARDS</strong> <strong>ANALYSIS</strong> <strong>PLAN</strong><br />
Helen – Established December 10, 1877 until November 27, 1882.<br />
Herald – See Finlay<br />
Hukle – Originally named Boone (Sumner <strong>County</strong>) and established January 20, 1879, Hukle was<br />
established in <strong>Sedgwick</strong> <strong>County</strong> March 11, 1887 until January 31, 1903.<br />
Iowaville – Established February 20, 1874 until July 31, 1902.<br />
Jamesburgh – Established June 24, 1873 until November 11, 1880 be<strong>for</strong>e being annexed by the City of<br />
Wichita.<br />
Kalamazoo – See Anness<br />
Kechi – A village in <strong>Sedgwick</strong> <strong>County</strong> Indian name <strong>for</strong> "water turtle," is located in the township of the<br />
same name on the Chicago, Rock Island & Pacific R. R., 8 miles northeast of Wichita, the county seat.<br />
The post office was established May 29, 1888. It has several stores, a feed mill, telegraph and express<br />
offices. The population in 1910 was 100.<br />
Lakin – Originally established February 21, 1872 in <strong>Sedgwick</strong> <strong>County</strong> until April 2, 1873 be<strong>for</strong>e moving<br />
the present day Halstead (Harvey <strong>County</strong>).<br />
Lamont – Established April 27, 1877 until March 24, 1884.<br />
Louise – Established April 27, 1877 until March 24, 1884.<br />
Magnolia (see also Andale) – The town was situated about three miles southwest of Andale with the post<br />
office established in 1877. When the Missouri Pacific Railroad bypassed the town by three miles in 1886,<br />
the town moved to the present town of Andale by 1891. 9<br />
Manchester – Established April 2, 1887 until September 9, 1889.<br />
Marshall and Bridgeport – David Moore was the first settler in Grand River Township and in the fall of<br />
1872 started the Lone Tree ranch (named <strong>for</strong> the only tree between Wichita and Kingman). In 1872, the<br />
towns of Marshall and Bridgeport, located only a mile apart, were begun west of the Ninnescah River.<br />
Marshall was named <strong>for</strong> Wichita Eagle founder Marsh Murdock, and the post office was established in<br />
Marshall in 1874. Bridgeport was established by Hiram Witten when he opened a general store two miles<br />
west of the river and one mile north of Brandis Station on the Kingman Trail (Highway 54). Bridgeport, in<br />
an ef<strong>for</strong>t to build a bridge across the Ninnescah River, obtained wood pilings from Medicine Lodge;<br />
however, Marshall was the first town platted and in doing so left Bridgeport a deserted town.<br />
The Kingman Trail later became the Cannonball Green Stage Line, making regular stops at Marshall.<br />
North of the bridge a water mill was built as well as a number of stores in Marshall. During the 1880’s,<br />
Marshall with a population over 100 became a flourishing trading post but missed the Santa Fe Railroad<br />
line in 1883 by 2½ miles north due to Wichita securing the right-of-way to the west line of <strong>Sedgwick</strong><br />
<strong>County</strong>. Late in 1883, the entire town moved Cheney, and by September of that year the post office<br />
ceased operations, leaving behind a grove of Cottonwood trees beside the river. 10<br />
Maize – Named <strong>for</strong> the Indian corn produced in the area.<br />
9 Ghost Towns of <strong>Kansas</strong>, Volume 2, Daniel Fitzgerald, 1979<br />
10 Ibid.<br />
15
<strong>2010</strong>-<strong>2040</strong> <strong>HAZARDS</strong> <strong>ANALYSIS</strong> <strong>PLAN</strong><br />
Minneha – The town moved between Cloud in Butler <strong>County</strong> and Midland in <strong>Sedgwick</strong> <strong>County</strong> between<br />
August 28, 1871 and March 8, 1880. Cloud in Butler <strong>County</strong> was renamed Andover in 1880, and in<br />
<strong>Sedgwick</strong> <strong>County</strong> Minneha was originally named Manchester be<strong>for</strong>e being re-established as Minneha<br />
September 9, 1889 until being discontinued October 15, 1900.<br />
Mount Hope – An incorporated city of the third class in <strong>Sedgwick</strong> <strong>County</strong> and named <strong>for</strong> a town in<br />
Michigan, is located in Greeley Township on the Arkansas River and the Missouri Pacific R. R. 25 miles<br />
northwest of Wichita. The post office was established December 24, 1873. In 1910, it had a bank, a<br />
weekly newspaper (the Clarion), all lines of mercantile stores, telegraph and express offices, and a<br />
money order post office with two rural routes. The population according to the census of 1910 was 519, a<br />
gain of over 60 per cent since 1900. The town was originally founded about 1880.<br />
Mulvane – Named <strong>for</strong> Topeka railroad contractor Joab Mulvane, the little incorporated city in Sumner<br />
<strong>County</strong>, though located partly in Rock<strong>for</strong>d township of <strong>Sedgwick</strong> <strong>County</strong>, is on the Arkansas river and the<br />
Atchison, Topeka & Santa Fe R. R. 19 miles northeast of Wellington, the county seat, it has 2 banks, a<br />
flour mill, a feed mill, an ice and cold storage plant, electric light plant, creamery, natural gas, a weekly<br />
newspaper (the News), and a large number of well stocked retail establishments. It is supplied with<br />
telegraph and express offices and has an international money order post office with two rural routes. The<br />
population according to the census of 1910 was 1,084. The town was laid out in 1879, and the first<br />
building was erected by Dr. Whitehorn. The first store was opened by J. S. Brown, the first dwelling was<br />
built by Lee Wilson, J. N. Trickey opened the first dry goods store and the Mulvane House was erected by<br />
A. C. Craw<strong>for</strong>d. The post office was established in Oct., 1879, with J. B. Brown as first postmaster.<br />
Newton – Established June 6, 1871 in <strong>Sedgwick</strong> <strong>County</strong> be<strong>for</strong>e being transferred to Harvey <strong>County</strong>.<br />
North Wichita – Established May 29, 1888 until January 31, 1901.<br />
Oatville – Established October 2, 1884 until November 30, 1936.<br />
Ohio Centre – Established October 6, 1873 until October 27, 1887.<br />
Park City (see Cosmosa) – Park City was established in 1870, 14 miles northwest of Wichita and five<br />
miles west of Valley Center, on the north banks of the Arkansas River. At one time, Park City was the<br />
only rival to Wichita <strong>for</strong> the county seat. Wichita wanted the Santa Fe railroad south from Newton. While<br />
it was necessary to vote bonds, Park City set out to defeat those bonds. Fictitious names were used, nonresidents,<br />
some dead and gone, were all used in the fight of the railroad bonds. Park City had 300<br />
inhabitants and 1,000 votes. In the end, Wichita won out and resulted in the demise of Park City by 1879<br />
and only leaving a depression in the ground. The current Park City began as an Improvement district in<br />
1953 with a restaurant or two, a couple of churches and a grocery store. The district grew from a<br />
quarter section of farmland purchased by developers into a 3,321-acre (13.44 km 2 ) community. After the<br />
unanimous approval of the three members of the <strong>Sedgwick</strong> <strong>County</strong> Board of Commissioners, led by Ron<br />
Darlington, Donavan Foster and Jack Whitson (Park City’s second mayor and current city administrator),<br />
Park City became a city of the Third Class on November 26, 1980. The new city held a special election on<br />
February 17, 1981, in which Raymond J. Reiss was elected mayor along with five council members to<br />
<strong>for</strong>m the first governing body. (Park City Post, November <strong>2010</strong>)<br />
Payne – Established February 5, 1884 until March 11, 1884.<br />
Peck – Established October 27, 1887 to the present day.<br />
Peotone – Established April 11, 1877 until May 27, 1899 and renamed Viola.<br />
Ruby – Established February 11, 1879 until June 30, 1894.<br />
16
<strong>2010</strong>-<strong>2040</strong> <strong>HAZARDS</strong> <strong>ANALYSIS</strong> <strong>PLAN</strong><br />
Saint Mark and Germania – By 1880, Sherman Township had been created and settled by German<br />
immigrants. The Saint Mark post office was established February 4, 1879 and discontinued December<br />
14, 1903. Germania, located one and a half miles west of Saint Mark, was established April 9, 1877 and<br />
discontinued March 9, 1881, re-established April 19, 1881 and then discontinued November 30, 1896.<br />
Both communities had a school building, post office, stock of general merchandise, drug store, hotel,<br />
blacksmith, shoemaker, tinsmith and carpenter shop. 11<br />
Sand Ford – See El Paso.<br />
Schulte – A hamlet in <strong>Sedgwick</strong> <strong>County</strong> is located in Waco Township. The post office was originally<br />
established June 27, 1906 until June 15, 1910. It was re-established July 30, 1910 until January 15,<br />
1934on the <strong>Kansas</strong> City, Mexico & Orient R. R., 12 miles southwest of Wichita, the county seat. It has a<br />
general store, livery barn, telegraph and express offices, etc. It receives mail from Oatville. The<br />
population in 1910 was 70.<br />
<strong>Sedgwick</strong> – The third largest town in Harvey <strong>County</strong> and named <strong>for</strong> <strong>Sedgwick</strong> <strong>County</strong>, is located on the<br />
Atchison, Topeka & Santa Fe R. R. and the Little Arkansas river, 10 miles south of Newton, the county<br />
seat. It is an incorporated city of 626 inhabitants according to the census of 1910, has 2 banks, an opera<br />
house, a weekly newspaper (the Panagraph), telegraph and express offices, and an international money<br />
order post office with four rural routes. It is the oldest town in the county, having been laid off in June,<br />
1870, by the <strong>Sedgwick</strong> Town Company, of which T. S. Floyd was president. The first store, which was the<br />
first in the county, was built in July of that year by William H. Owen. The post office was established June<br />
27, 1870 with T. S. Floyd as postmaster. The money order department was added in 1877. The first<br />
school house in the county was erected here in 1870 and the first term was taught by C. S. Bullock and<br />
wife. The first newspaper was the <strong>Sedgwick</strong> Gazette, the initial number of which was issued in Jan.,<br />
1871. The Citizens' Savings bank was organized and began business in 1872. The town was<br />
incorporated as a city of the third class in March of that year. The city government was suspended in<br />
1877 on account of a clerical error in the charter. It was revived again in 1881 and reorganization took<br />
place followed by an election of officers in April, 1882.<br />
Sedowa – Established June 9, 1886 until February 28, 1903.<br />
Sheldon – Originally established July 18, 1871 in <strong>Sedgwick</strong> <strong>County</strong> being transferred to Harvey <strong>County</strong><br />
and discontinuing October 22, 1885.<br />
Sunny Dale – Established February 15, 1877 until September 14, 1894 when the name was changed to<br />
Sunnydale. The settlement was disbanded July 31, 1901.<br />
Valley Center – In 1870, Grant Township was established, which included the present townships of<br />
Grant and Valley Center. Alexander Jester was one of the first settlers three miles northwest of Valley<br />
Center (named <strong>for</strong> the topography of the area) in 1868. 12 The post office was established April 25, 1872<br />
until February 9, 1874. It was re-established on June 24, 1875 and later the city was incorporated as a<br />
city of the third class in <strong>Sedgwick</strong> <strong>County</strong>. In the spring of 1885, as Wichita experienced a growth boom<br />
and in an ef<strong>for</strong>t to have workers in Wichita commute back and <strong>for</strong>th to Valley Center, a means of<br />
transportation was needed. A transit company was organized to build and manage an interurban<br />
between Wichita and Valley Center (see Transportation). The interurban owners added a park,<br />
constructed a dam on the river <strong>for</strong> boating, a swimming pool, baseball diamond, and other amenities to<br />
attract people. The first businesses included an overall factory and broom factory, and in 1886 Burton<br />
Car Works and a livery stable. 13 In 1910, the town had a broom manufacturing establishment, a bank, a<br />
weekly newspaper (the Index), schools and churches, a number of general stores, telegraph and express<br />
11 Colwich Community Pictorial History, 1972<br />
12 Valley Center: Its Founding & Major Events, Frank Hutchings, Valley Center, 1976<br />
13 The Founding of Valley Center, Genevieve May Rapp, Pgs 67-74, Wichita, 1931<br />
17
<strong>2010</strong>-<strong>2040</strong> <strong>HAZARDS</strong> <strong>ANALYSIS</strong> <strong>PLAN</strong><br />
offices, and an international money order post office with three rural routes. The population in 1910 was<br />
381. This is the shipping and receiving point <strong>for</strong> a large agricultural and stock raising district and is<br />
headquarters <strong>for</strong> a number of men extensively engaged in stock breeding.<br />
Viola – An incorporated city of the third class in <strong>Sedgwick</strong> <strong>County</strong> and named after the township in which<br />
it is located, is on the Atchison, Topeka & Santa Fe and the <strong>Kansas</strong> City, Mexico & Orient railroads, 24<br />
miles southwest of Wichita, the county seat. It has a bank, a telephone exchange owned by a local<br />
company, general stores, telegraph and express offices, and a money order post office with one rural<br />
route. The population in 1910 was 156. It is located in a good agricultural district <strong>for</strong> which it is the<br />
receiving and shipping point.<br />
Waco – Formerly known as Cowskin, the town is in <strong>Sedgwick</strong> <strong>County</strong>, is located 12 miles south of<br />
Wichita and 4 from Haysville, the nearest shipping point. It has one general store. Mail is delivered from<br />
Peck. The population in 1910 was 41.<br />
Wichita – The history of the city begins with the establishment of a trading post at that point in 1863 by J.<br />
R. Mead. The Wichita Indians were then occupying the land and the town was named <strong>for</strong> that tribe. The<br />
word means "Scattered Lodges," and <strong>for</strong> a long time the little town lived up to its appellation. As early as<br />
1860 William Mathewson, the original Buffalo Bill, freighted through Wichita, and in 1869 settled on a<br />
claim near the town site. On July 9, 1868, a military post office was established with Col. Barr, who was in<br />
command of the militia stationed there, as postmaster.<br />
Shortly afterward a civil post office was established with Milo B. Kellogg, manager of Durfee's ranch, as<br />
postmaster. About the same time the Wichita town company was organized by Gov. S. J. Craw<strong>for</strong>d, W.<br />
W. H. Lawrence, J. R. Mead, E. P. Bancroft, A. F. Horner and I. S. Munger. A survey of the site was made<br />
by Mr. Finn. William Greiffenstein bought Moore's place, now comprising a part of the city, and <strong>for</strong> a long<br />
time there was a rivalry between the two sites.<br />
In 1870 Mr. Munger opened a hotel and the Wichita Vidette was started by F. A. Sowers. Be<strong>for</strong>e the<br />
railroad was completed there was bitter rivalry between Wichita and Park City, which stood 14 miles to<br />
the northwest on the Arkansas. An attempt was made to divert the cattle trade to the Park City route, and<br />
<strong>for</strong> a long time it seemed that this might be successful. However, Wichita succeeded in securing the<br />
county seat and in May, 1872, the railroad reached this point and settled the rivalry. By that time quite a<br />
city had grown up, handling the vast cattle trade of the southwest and having all the undesirable<br />
conditions connected with a rapidly growing frontier town.<br />
18
<strong>2010</strong>-<strong>2040</strong> <strong>HAZARDS</strong> <strong>ANALYSIS</strong> <strong>PLAN</strong><br />
In 1871 Wichita was incorporated as a city of the<br />
third class. At the election 156 votes were polled<br />
and the following officers were elected: Mayor, E.<br />
B. Allen; attorney, D. C. Hackett; police judge, H.<br />
E. Vantrees; clerk, O. W. Brownwell; treasurer, N.<br />
A. English; marshal, M. Meagher; councilmen, W.<br />
B. Hutchinson, S. C. Johnson, C. Schattner,<br />
George Schlichter, A. H. Fabrique and George<br />
Vantillburg. The next year, having sufficient<br />
population, the <strong>for</strong>m of government was changed<br />
to that of a city of the second class. In March,<br />
1872, the United States land office was moved<br />
here from Augusta, Butler county. The first school<br />
was held in an army dugout in the winter of 1869-<br />
70. A $5,000 school house was built in 1871.<br />
March 18, 1871, Wichita had its first big fire when<br />
the W.R. Rouse Queensware Store, and the John<br />
1887 City Map of Wichita<br />
Peyton Saddle and Harness Shop, burned to the<br />
ground. The Wichita Eagle and the Wichita Beacon were both founded in 1872, and have since been<br />
among the leading newspapers of the state. The first financial institution was the Arkansas Valley bank,<br />
started in 1870 by W. C. Woodman. Although the cattle driving business closed in 1875 the growth of<br />
Wichita kept on as rapidly as be<strong>for</strong>e. In 1880 a board of trade was organized with $20,000 capital, the<br />
waterworks were installed in 1882 and the street railway the next year. Improvements of all kinds went on<br />
very rapidly, new additions were laid out, lots were sold and houses built miles from the business section<br />
of the city. In 1888, on the occasion of the auction sale of the lots in a new addition, the Wichita Eagle<br />
wrote an editorial calling a halt on speculation and telling the people that the time had come to quit buying<br />
and selling at inflated values. With that the boom was over, the lots were turned back to cow pastures and<br />
cornfields and the city paid <strong>for</strong> the boom with fifteen years of comparative depression.<br />
The Coronado club, which later became the Wichita commercial club, was organized in 1897. The<br />
chamber of commerce was organized in 1901. The growth of the city in the last ten years has been<br />
wholesome as well as remarkable. The population in 1900 was 24,671, and in 1910 it was 52,450, an<br />
increase of more than 100 per cent. The post office receipts of 1900 were $73,934, against $232,326 in<br />
1910, and the bank deposits show a tenfold increase. The building permits <strong>for</strong> 1910 were three times<br />
those of 1908. Among the buildings erected in 1910 was the Beason building, which at the time was the<br />
tallest "skyscraper" in <strong>Kansas</strong>. It is ten stories high, cost $380,000, and accommodates 1,000 people. The<br />
public and private improvements <strong>for</strong> 1910 cost $7,000,000. Seven of the eleven banks have been<br />
organized since 1902. The value of city property and improvements is more than $3,000,000.<br />
There was an average of 110 freight and passenger trains per day in 1910. The value of the city's<br />
manufactured products <strong>for</strong> the year 1909 was $9,000,000. Among the important manufacturing concerns<br />
are 5 flour mills with a daily capacity of 4,100 barrels, a broom factory with a daily capacity of 2,000<br />
dozen, 2 packing plants with an annual production of 60,000,000 pounds, 4 alfalfa mills, 3 overall<br />
factories, 6 planning mills using more than 12,000 cars of lumber annually, and 6 foundries. There are in<br />
all 230 different manufacturing concerns in the city, and 138 wholesale houses, shipping over 50,000 cars<br />
of the finished product to its tributary territory. The wholesale and jobbing interests are represented by<br />
500 traveling men who live in the city, and the volume of business in 1909 was $30,000,000.<br />
By 1910, the area of Wichita is about 20 square miles, with 30 miles of paving, 35 miles of street railway,<br />
6 miles of water mains, 75 miles of sewer, 11 public parks, 100 miles of natural gas mains, 6,500<br />
telephones in use, 16 publishing houses, 2 daily newspapers (the Beacon and the Eagle), 20 public<br />
school buildings, 3 Catholic academies, 2 business colleges, an art school, 2 music conservatories, 2<br />
colleges ranking with the best in the state—Fairmount College and Friends' University—11 banks, good<br />
hotels, etc. The amount spent <strong>for</strong> building in 1910 was $6,000,000. There are a number of large office<br />
19
<strong>2010</strong>-<strong>2040</strong> <strong>HAZARDS</strong> <strong>ANALYSIS</strong> <strong>PLAN</strong><br />
buildings and department stores, 6 sanitariums, 10 theaters, one of the finest Masonic buildings in the<br />
country, costing $250,000, a Masonic home and grounds worth a similar amount, a $150,000 Federal<br />
building, and a city hall which cost about the same, a chamber of commerce, a commercial club, a fair<br />
association which holds one of the largest fairs in the state, a Commercial League, 2 country clubs,<br />
owning fine buildings, all of which are busy promoting the development and best interests of the town.<br />
The women's clubs, of which there are four, have memberships of several hundred each and large, well<br />
furnished club rooms.<br />
Wichita Heights – Established May 22, 1888 until October 15, 1900.<br />
20
<strong>2010</strong>-<strong>2040</strong> <strong>HAZARDS</strong> <strong>ANALYSIS</strong> <strong>PLAN</strong><br />
5 DEMOGRAPHICS 14<br />
5.1 POPULATION<br />
<strong>Sedgwick</strong> <strong>County</strong> is situated in the South-Central portion of <strong>Kansas</strong> in the Arkansas River Valley. The<br />
April 1, 2000 U.S. Census indicated there were 452,869 residents (176,444 households) identified within<br />
a 1,008 square mile area or 449 persons per square mile. The <strong>2010</strong> U.S. Census indicates 498,365<br />
residents or an increase of 10% since 2000. The county seat and largest city within the county is Wichita<br />
with a population of 382,368. Population growth within <strong>Sedgwick</strong> <strong>County</strong> has been approximately 12.5%<br />
since the 1990 U.S. Census, and an 11.1% increase <strong>for</strong> the city of Wichita since 2000. City of Wichita<br />
land area in <strong>2010</strong> was 162.98 square miles or about 16.2% of <strong>Sedgwick</strong> <strong>County</strong>’s total land area.<br />
Other <strong>2010</strong> data communities within <strong>Sedgwick</strong> <strong>County</strong> are as follows: Andale (928), Bentley (530), Derby<br />
(22,158), Eastborough (773), Haysville (10,826), Bel Aire (6,769), Park City (7,297), Valley Center<br />
(6,822), Clearwater (2,481), Goddard (4,344), Maize (3,420), Cheney (2,094), Colwich (1,327), Viola<br />
(130), Mulvane (6,111), <strong>Sedgwick</strong> (1,695), Mount Hope (813), Garden Plain (773), Oaklawn-Sunview<br />
CDP (3,276), and Kechi (1,909). The following township populations are provided (excludes cities) in<br />
descending order.<br />
14 http://www.wampoks.org/Publications/Metropolitan+Transportation+Plan+2035.htm<br />
21
<strong>2010</strong>-<strong>2040</strong> <strong>HAZARDS</strong> <strong>ANALYSIS</strong> <strong>PLAN</strong><br />
<strong>2010</strong> Census Township Populations<br />
Rock<strong>for</strong>d 22,784 Illinois 1,860<br />
Riverside 13,615 Garden Plain 1,838<br />
Salem 9,486 Sherman 1,716<br />
Kechi 9,027 Afton 1,531<br />
Gypsum 7,379 Eagle 1,205<br />
Attica 6,725 Greeley 1,035<br />
Grant 4,973 Payne 937<br />
Park 4,615 Waco 725<br />
Valley Center 4,356 Grand River 603<br />
Minneha 3,417 Lincoln 523<br />
Ninnescah 3,231 Viola 479<br />
Morton 2,667 Erie 100<br />
Union 2,410 Delano 11<br />
Ohio 1,980<br />
Comparisons of township populations (excluding cities) between the 2000 and <strong>2010</strong> census are shown:<br />
22
<strong>2010</strong>-<strong>2040</strong> <strong>HAZARDS</strong> <strong>ANALYSIS</strong> <strong>PLAN</strong><br />
<strong>Sedgwick</strong> <strong>County</strong> is also part of the Metropolitan Statistics Area (MSA) that consists of Butler, Harvey and<br />
Sumner Counties. According to the <strong>2010</strong> U.S. Census, a total of 623,061 resided within the Wichita<br />
MSA, up from the 2000 census of 571,173 or an increase of 9.2%.<br />
5.2 MIGRATION<br />
5.3 LAND USE<br />
Density of land development also affects travel patterns and the built environment. Like many urban<br />
areas, the population density of the Wichita urban area decreased over the last several decades. Density<br />
went from 1,718 people per square mile in 1985 to 1,338 people per square mile in 2007. This means that<br />
the people in the region have spread out. Decreasing population density, in addition to the spreading out<br />
of land uses, means that people in the region need to go farther to get from their home to work and other<br />
common destinations.<br />
23
<strong>2010</strong>-<strong>2040</strong> <strong>HAZARDS</strong> <strong>ANALYSIS</strong> <strong>PLAN</strong><br />
The following map shows the year of construction <strong>for</strong> residential and commercial facilities in <strong>Sedgwick</strong><br />
<strong>County</strong>.<br />
24
<strong>2010</strong>-<strong>2040</strong> <strong>HAZARDS</strong> <strong>ANALYSIS</strong> <strong>PLAN</strong><br />
5.4 PROJECTED GROWTH<br />
The following map shows the <strong>for</strong>ecasted growth of jobs and population and does not reflect anticipated<br />
local government boundaries.<br />
25
<strong>2010</strong>-<strong>2040</strong> <strong>HAZARDS</strong> <strong>ANALYSIS</strong> <strong>PLAN</strong><br />
The following map shows anticipated local government boundaries by the year 2030 as projected by the<br />
Wichita Area Metropolitan Planning Organization (WAMPO):<br />
5.5 METROPOLITAN STATISTICAL AREA<br />
Population within the Wichita Metropolitan Statistical Area is anticipated to increase over the next 30<br />
years with the greatest growth in Butler and <strong>Sedgwick</strong> counties.<br />
26
<strong>2010</strong>-<strong>2040</strong> <strong>HAZARDS</strong> <strong>ANALYSIS</strong> <strong>PLAN</strong><br />
The following table provides comparisons between each of the Wichita MSA counties based on the<br />
population figures shown:<br />
U.S. CENSUS BUREAU STATE & COUNTY QUICK FACTS – POPULATION<br />
Population Variable <strong>Kansas</strong> Butler Harvey <strong>Sedgwick</strong> Sumner<br />
<strong>2010</strong> U.S. Census 2,853,118 65,880 34,684 498,365 24,132<br />
Population Change (2000-<strong>2010</strong>) 4.8% 7.7% 4.2% 10.0% -9.5%<br />
Under 5 Years Old 7.3% 6.8% 6.6% 8.2% 6.4%<br />
Under 18 Years Old 25.0% 26.4% 25.0% 27.1% 25.6%<br />
65 Years and Older 13.0% 12.8% 16.8% 11.5% 15.0%<br />
Language Other than English (2000) 8.7% 3.3% 8.1% 10.8% 3.4%<br />
Persons with a Disability Age 5+<br />
(2000)<br />
429,687 9,198 5,214 73,458 4,485<br />
Persons Below Poverty Level (2008) 11.3% 8.7% 9.7% 12.3% 11.5%<br />
5.6 WICHITA AREA METROPOLITAN <strong>PLAN</strong>NING ORGANIZATION (WAMPO) REGION 15<br />
This region includes all of <strong>Sedgwick</strong> <strong>County</strong>, a portion of<br />
Butler <strong>County</strong> including Andover, and a small portion of<br />
Sumner <strong>County</strong> including Mulvane. The WAMPO region<br />
includes a total of 21 cities both inside and outside of the<br />
urbanized area.<br />
The median age of residents in the WAMPO region is<br />
34; 33 <strong>for</strong> males and 35 <strong>for</strong> females. The median age of<br />
residents in the region is slightly younger than the<br />
residents in the State of <strong>Kansas</strong> and the nation, where<br />
the median age is 36. The aging population will affect<br />
the future transportation system. A large segment of<br />
the population (the Baby Boomers) who are currently in<br />
their 40s, 50s, and early 60s will age into their 60s, 70s,<br />
and 80s over the course of this plan. As this segment of the population ages, changes in the way they<br />
currently use the transportation system could occur. For example, some Baby Boomers might rely more<br />
on transit, some might move to an assisted living facility that provides a communal bus <strong>for</strong> its residents,<br />
some might continue to drive, and others might rely on friends and family <strong>for</strong> transportation.<br />
15 http://www.wampoks.org/Publications/Metropolitan+Transportation+Plan+2035.htm<br />
27
<strong>2010</strong>-<strong>2040</strong> <strong>HAZARDS</strong> <strong>ANALYSIS</strong> <strong>PLAN</strong><br />
RECENT TRENDS<br />
There have been significant changes in the demographics of the region. The following trends have<br />
occurred between 1990 and 2000:<br />
The minority population has increased at a faster rate than the White Alone population. Between<br />
1990 and 2000, the minority population grew by 60%, while the White Alone population grew by<br />
only 5%.<br />
The minority population increased from 14% of the total population in 1990 to 20% in 2000.<br />
The ten year change between 1990 and 2000 in the percentage of the minority population could indicate<br />
that the <strong>2010</strong> census in<strong>for</strong>mation may show another increase. This could be significant <strong>for</strong> the<br />
transportation system due o the difference in vehicle ownership between different population groups.<br />
RACIAL PROFILE<br />
According to the 2000 Census, the majority of the population (80%) is classified as White Alone. The<br />
remaining 20% consist of a variety of different minority groups shown below.<br />
The largest minority group is Black or African-American Alone. Hispanic or Latino populations are also<br />
considered minorities, but are not indicated in the chart because it is a national origin classification.<br />
Hispanic or Latino makes up 8% of the population in the region.<br />
28
<strong>2010</strong>-<strong>2040</strong> <strong>HAZARDS</strong> <strong>ANALYSIS</strong> <strong>PLAN</strong><br />
VEHICLE AVAILABILITY<br />
The majority of households in the WAMPO region have access to at least one vehicle (93%). However,<br />
there is a disproportionate share of minority households that do not have access to a vehicle, as seen<br />
below:<br />
1 in 9 minority households do not have access to a vehicle.<br />
1 in 12 White Alone households do not have access to a vehicle.<br />
If the minority population continues to increase at a faster rate than the White Alone population, this could<br />
increase the need <strong>for</strong> other modes of transportation such as transit, walking, or biking.<br />
INCOME<br />
The median household income in the region is slightly higher ($43,000) than both <strong>Kansas</strong> ($41,000) and<br />
the U.S. $42,000). However, there is still a significant portion of the region’s households that are<br />
classified as low-income.<br />
LOW‐INCOME<br />
For the purpose of analysis of low‐income, the definition to define an area <strong>for</strong> low‐income used was<br />
drawn from the WAMPO Title VI & Environmental Justice Policy. This policy defines low‐income<br />
households as ―those that have a median household income of less than or equal to 70% of the total<br />
WAMPO region’s median income, which equals $29,855‖. In many cases, each individual specialized<br />
transportation or transit provider develops their own threshold <strong>for</strong> determining what is considered<br />
low‐income. For example; Wichita Transit defines low‐income through the use of the Social and<br />
Rehabilitation Services (SRS) poverty guidelines that are published on an annual basis.<br />
29
<strong>2010</strong>-<strong>2040</strong> <strong>HAZARDS</strong> <strong>ANALYSIS</strong> <strong>PLAN</strong><br />
As shown on the previous map, the majority of census tracts with median household incomes below the<br />
defined low‐income is located within the core of the City of Wichita. The City of El Dorado also has<br />
areas in which the population is identified as being low‐income. This map identifies potential areas of<br />
low‐income cliental and is not to be used to identify poverty levels.<br />
HOUSING<br />
There were approximately 211,000 housing units in the region to house its 495,000 residents in 2008.<br />
Given that an estimated 7.3% (2000 Census) of the housing units at any one time are vacant, there were<br />
approximately 195,000 households in 2008. This means that the average household size in the region is<br />
approximately 2.5 people per household. This is comparable to the national average of 2.6 people and<br />
the State of <strong>Kansas</strong> average of 2.4 people. The number of housing units is projected to increase by<br />
approximately 21% to 254,000 by 2035. The average growth rate per year of the number of housing units<br />
mirrors the yearly growth rate of the population at 0.8 % per year. The number and location of these<br />
housing units impact the demand <strong>for</strong> transportation services.<br />
5.7 SUSCEPTIBLE POPULATIONS<br />
5.7.1 ELDERLY<br />
As the elderly population continues to grow, the demands of specialized transportation and transit<br />
services in the CTD #12 region are expected to also grow. Those aged 65 and older represent 11.8% of<br />
the CTD #12 region’s population, which is below the national average of 12.4%. Harvey <strong>County</strong> has the<br />
largest percentage of elderly individuals (16.8%), while <strong>Sedgwick</strong> <strong>County</strong> has the least with 11.4% of its<br />
population identified as elderly. The elderly make up 12.6% of Butler <strong>County</strong>’s population.<br />
According to the 2000 U.S. Census data, the cities of Augusta, El Dorado, Newton, and Wichita in the<br />
CTD #12 region all have census tracts where 20% or more of the population is classified as elderly. The<br />
following map shows the population distribution of those aged 65 years of age and older in <strong>Sedgwick</strong><br />
<strong>County</strong> based on the 2000 U.S. census Bureau.<br />
5.7.2 FUNCTIONAL NEEDS/DISABILITY<br />
The 2000 U.S. Census defines a disability as a long-lasting condition that impacts sensory, physical,<br />
mental, self‐care, and employment capabilities. Data is collected by the 2000 Census <strong>for</strong> each disability<br />
by age group. Susceptible populations within the county according to the census indicate almost 8% or<br />
35,697 of the population are under age 5 and 11.4% or 51,574 of the population is age 65 or older.<br />
The 2000 Census identifies approximately 155,000 individuals in the Consolidated Transit District (CTD)<br />
#12 region (see also Transportation Section) with at least one <strong>for</strong>m of a disability. The CTD #12 region<br />
has a slightly lower percentage of the total disabled population (28%) when compared to the national<br />
average (31%). The 28% of disabled population in the CTD #12 region are identified by the following<br />
disabilities: sensory disability (3%), physical disability (7%), mental disability (4%), self-care disability<br />
(2%), go-outside-home disability (5%), and employment disability (7%).<br />
As individuals age there is a greater chance that they will develop some sort of disability. The following<br />
table reflects the total number of individuals who reported a <strong>for</strong>m of disability during the 2000 U.S.<br />
Census <strong>for</strong> the CTD #12 region.<br />
30
<strong>2010</strong>-<strong>2040</strong> <strong>HAZARDS</strong> <strong>ANALYSIS</strong> <strong>PLAN</strong><br />
Maps showing percent of population with disabilities by age and type in <strong>Sedgwick</strong> <strong>County</strong> are shown on<br />
the following pages and are based on 2000 U.S. Census in<strong>for</strong>mation which last reported this category.<br />
Percent of Population with a Disability in <strong>Sedgwick</strong> <strong>County</strong> – Aged 5 Years of Age and Older<br />
31
<strong>2010</strong>-<strong>2040</strong> <strong>HAZARDS</strong> <strong>ANALYSIS</strong> <strong>PLAN</strong><br />
Percent of Population with a Disability in Wichita Metro Area – Aged 5 Years of Age and Older<br />
Percent of Population with a Disability in <strong>Sedgwick</strong> <strong>County</strong> – Aged 65 Years of Age and Older<br />
32
<strong>2010</strong>-<strong>2040</strong> <strong>HAZARDS</strong> <strong>ANALYSIS</strong> <strong>PLAN</strong><br />
Percent of Population with a Go-Outside-Home Disability in <strong>Sedgwick</strong> <strong>County</strong><br />
Percent of Population with a Mental Disability in <strong>Sedgwick</strong> <strong>County</strong><br />
33
<strong>2010</strong>-<strong>2040</strong> <strong>HAZARDS</strong> <strong>ANALYSIS</strong> <strong>PLAN</strong><br />
Percent of Population with a Physical Disability in <strong>Sedgwick</strong> <strong>County</strong><br />
Percent of Population with a Sensory Disability in <strong>Sedgwick</strong> <strong>County</strong><br />
34
<strong>2010</strong>-<strong>2040</strong> <strong>HAZARDS</strong> <strong>ANALYSIS</strong> <strong>PLAN</strong><br />
Percent of Population with a Self-Care Disability in <strong>Sedgwick</strong> <strong>County</strong><br />
Although the 2000 U.S. Census does not account <strong>for</strong> the mobility requirements of a disabled individuals<br />
(i.e., driving, transit, etc.), this is still an indicator of specialized transportation needs in the CTD #12<br />
region. It should also be noted that although an individual may have a disability that is defined by the<br />
2000 U.S. Census, many specialized transportation providers determine disability eligibility on a case by<br />
case basis.<br />
5.7.3 SPECIAL NEEDS CONSIDERATIONS<br />
With the occurrence of a hazard event, the population groups that are most at risk are ―Special Needs‖<br />
populations. A Special Needs person is one who would require special assistance in the event of a<br />
hazard, more so than the average person. These populations include individuals (primarily non-workers)<br />
located in hospitals, nursing homes, group homes, schools, jails and prisons, and other such facilities.<br />
Special needs groups require assistance not just during a hazard event, but also be<strong>for</strong>e and after the<br />
event (i.e. during mitigation/preparation and response/recovery ef<strong>for</strong>ts). Disasters are socially created;<br />
there<strong>for</strong>e, mitigation ef<strong>for</strong>ts should focus on those populations that are most vulnerable. A spatial hazards<br />
evaluation of potential risks to special needs populations helps to identify visually where there is an<br />
intersection between the locations of hazard occurrences and Special Needs populations. This is<br />
essential in determining where to direct future ef<strong>for</strong>ts and resources.<br />
5.7.4 HOMELESS<br />
According to <strong>Sedgwick</strong> <strong>County</strong> COMCARE’s homepage 16 , there are 52,000 residents in <strong>Sedgwick</strong> <strong>County</strong><br />
living in poverty and one in 10 people living in poverty will experience homelessness. The United Way of<br />
the Plains’ 2009 Point-in-Time Homeless Survey 17 identified around 475 people are homeless on any<br />
given night.<br />
16 http://sedgwickcounty.org/comcare/<br />
17 http://unitedwayplains.org/index.php?option=com_docman&task=cat_view&gid=212&Itemid=96<br />
35
<strong>2010</strong>-<strong>2040</strong> <strong>HAZARDS</strong> <strong>ANALYSIS</strong> <strong>PLAN</strong><br />
Homeless Shelters<br />
St. Anthony Family Shelter (Catholic Charities) – 13 units providing emergency shelter and case<br />
management services <strong>for</strong> families with children.<br />
Emergency Lodge (Salvation Army) – 18 bed emergency shelter providing crisis assessment,<br />
prevention, intervention, stabilization, in<strong>for</strong>mation/referral services to homeless families and<br />
single women In Wichita who are without services.<br />
Harbor House (Catholic Charities) – 13 room shelter serving victims of domestic violence.<br />
Inter-Faith Inn (Inter-Faith) – 24-hour full service facility <strong>for</strong> homeless individuals and families.<br />
Ti-Wiconi Safe Haven (Inter-Faith) – full service facility <strong>for</strong> the chronically mentally ill homeless in<br />
Wichita.<br />
Open Door (United Methodist) – provides food, clothing and shelter<br />
StepStone – The organization owns and operates 9 two- and three-bedroom homes and 5 twobedroom<br />
duplex units in Wichita and helps women and children who have been victims of<br />
domestic violence.<br />
Transitional Housing Program (Salvation Army) – 24 bed facility with a comprehensive program<br />
designed to assist homeless families and single women achieve the skills and abilities to live<br />
independently.<br />
Wichita Children’s Home – is the only emergency, temporary residential center <strong>for</strong> children in<br />
<strong>Sedgwick</strong> <strong>County</strong>.<br />
Union Rescue Mission - provides food, clothing and shelter to homeless men 18 years of age and<br />
older.<br />
Lord’s Diner (Wichita Catholic Diocese) – serves 450 people nightly<br />
5.8 SOCIAL VULNERABILITY INDEX (SOVI) 18<br />
Social vulnerability is influenced by factors such as age, race and ethnicity, gender, education,<br />
disabilities, and financial resources (Cutter et al., 2000). The Social Vulnerability Index (SoVI) measures<br />
the social vulnerability of U.S. counties to environmental hazards. The index is a comparative metric that<br />
facilitates the examination of the differences in social vulnerability among counties. SoVI is a valuable tool<br />
<strong>for</strong> policy makers and practitioners. It graphically illustrates the geographic variation in social vulnerability.<br />
It shows where there is uneven capacity <strong>for</strong> preparedness and response and where resources might be<br />
used most effectively to reduce the pre-existing vulnerability. SoVI also is useful as an indicator in<br />
determining the differential recovery from disasters.<br />
The index synthesizes 42 socioeconomic and built environment variables, which the research literature<br />
suggests contribute to reduction in a community’s ability to prepare <strong>for</strong>, respond to, and recover from<br />
hazards. The data were culled from national data sources, primarily those from the United States Census<br />
Bureau.<br />
The socioeconomic and built environment data were compiled and geo-referenced by the Hazards<br />
Research Lab at the University of South Carolina. The socioeconomic and built environment variables<br />
were standardized and input into a principal components analysis to reduce the number of variables into<br />
a smaller set of indicators. Adjustments were made to the component’s directionality (negative, positive)<br />
to insure that positive loadings were associated with increasing vulnerability, and negative loadings with<br />
decreasing vulnerability. Once the directions of the loadings were determined, the components were<br />
added together to determine the numerical social vulnerability score <strong>for</strong> each county. For SoVI 2000,<br />
there are 11 significant components and these explain 78% of the variance in the data. Among them are<br />
socioeconomic status, elderly and children, development density, rural agriculture, race, gender, ethnicity,<br />
infrastructure employment, and county debt/revenue. As shown below and the following maps, <strong>Sedgwick</strong><br />
<strong>County</strong> is Medium in social vulnerability rankings within the State of <strong>Kansas</strong> and nationally.<br />
18 http://webra.cas.sc.edu/hvri/products/sovi.aspx<br />
36
<strong>2010</strong>-<strong>2040</strong> <strong>HAZARDS</strong> <strong>ANALYSIS</strong> <strong>PLAN</strong><br />
<strong>County</strong> State SOVI 2000 National Percentile Ranking<br />
<strong>Sedgwick</strong> <strong>County</strong> <strong>Kansas</strong> 0.75736 53.9<br />
37
<strong>2010</strong>-<strong>2040</strong> <strong>HAZARDS</strong> <strong>ANALYSIS</strong> <strong>PLAN</strong><br />
5.9 EXPOSURE OF BUILT ENVIRONMENT<br />
As indicated in the <strong>2010</strong> <strong>Kansas</strong> Hazard Mitigation Plan 19 , this section quantifies the buildings exposed to<br />
potential hazards in <strong>Sedgwick</strong> <strong>County</strong>. The following table provides the value of the county’s built<br />
environment, which in addition to the population in<strong>for</strong>mation presented above <strong>for</strong>ms the basis of the<br />
vulnerability and risk assessment presented in this plan.<br />
ESTIMATED VALUES FOR THE KEY BUILDING OCCUPANCIES (USES) FOR KANSAS<br />
(2005 VALUATIONS)<br />
Residential Commercial Industrial Agriculture Religion Government Education Total<br />
($000) ($000) ($000) ($000) ($000) ($000) ($000) ($000)<br />
20,664,216 3,452,698 632,176 29,078 196,221 32,515 95,756 25,102,660<br />
BUILDING EXPOSURE<br />
The figure above shows the distribution of the value of this exposure across the state. This in<strong>for</strong>mation<br />
was derived from inventory data associated with FEMA’s loss estimation software HAZUS-MH MR 2 (May<br />
2006). HAZUS-MH classifies building stock types into seven categories: residential, commercial,<br />
industrial, agriculture, religion, government, and education. Values associated with each of these<br />
categories reflect 2005 valuations, based on RSMeans (a supplier of construction cost in<strong>for</strong>mation)<br />
replacement costs. According to the HAZUS-MH inventory, the total replacement value of buildings within<br />
<strong>Sedgwick</strong> <strong>County</strong> is approximately $25.1 billion compared to the State of <strong>Kansas</strong> which is $154.7 billion.<br />
5.10 SPATIAL HAZARD EVENTS AND LOSSES DATABASE FOR THE U.S. (SHELDUS) 20<br />
SHELDUS is a county-level hazard data set <strong>for</strong> the U.S. <strong>for</strong> 18 different natural hazard events types such<br />
thunderstorms, hurricanes, floods, wildfires, and tornados. For each event the database includes the<br />
beginning date, location (county and state), property losses, crop losses, injuries, and fatalities that<br />
affected each county.<br />
19 http://kansastag.ks.gov/AdvHTML_doc_upload/<strong>2010</strong>%20State%20Mitigation%20Plan%20Draft%207-20-10.pdf<br />
20 http://webra.cas.sc.edu/hvri/products/sheldus.aspx<br />
38
<strong>2010</strong>-<strong>2040</strong> <strong>HAZARDS</strong> <strong>ANALYSIS</strong> <strong>PLAN</strong><br />
The data were derived from several existing national data sources such as National Climatic Data<br />
Center's monthly Storm Data publications and NGDC's Tsunami Event Database. Only those events that<br />
generated more than $50,000 in damages or at least one death were included in SHELDUS. Since 1995,<br />
SHELDUS additionally includes all events that are reported in NCDC's Storm Data with a specific dollar<br />
amount.<br />
MAP OF KANSAS SHOWING TOTAL LOSSES PER CAPITA<br />
MAP OF KANSAS SHOWING TOTAL LOSSES PER SQUARE MILE<br />
(Ref. Data and maps were compiled and geo-referenced by the Hazards Research Lab at the University<br />
of South Carolina)<br />
39
<strong>2010</strong>-<strong>2040</strong> <strong>HAZARDS</strong> <strong>ANALYSIS</strong> <strong>PLAN</strong><br />
FUTURE TRENDS<br />
The population of the WAMPO region is expected to grow from approximately 495,000 people in 2008 to<br />
just under 602,000 people by 2035. This is a projected increase of 107,000 people, or 22%, over 27<br />
years.<br />
40
<strong>2010</strong>-<strong>2040</strong> <strong>HAZARDS</strong> <strong>ANALYSIS</strong> <strong>PLAN</strong><br />
5.11 INDUSTRY OVERVIEW<br />
The total number of jobs in the WAMPO region in 2008 was approximately 292,000. By 2035 the number<br />
of jobs is expected to increase 21% to approximately 352,000 jobs. The anticipated annual rate of job<br />
growth mirrors the anticipated population growth rate at 0.8% per year<br />
The types of jobs that are in the region can be classified in two general categories: retail and non-retail. A<br />
much larger percentage of the work <strong>for</strong>ce, 77% (223,832 workers), was employed in non-retail jobs in<br />
2008. The remaining 23% (67,850 workers) of the work <strong>for</strong>ce was employed in retail jobs. However, by<br />
2035 the percentage of people employed in retail jobs is expected to increase to 26%. An increase in<br />
retail jobs could potentially have a significant impact on the transportation system since retail centers or<br />
stores are destinations <strong>for</strong> not only employees, but customers and freight movers as well.<br />
Industry Type<br />
The City of Wichita sits within a large trade area that encompasses a population of more than 1 million<br />
people within a 100-mile radius. The MSA includes Butler, Harvey, <strong>Sedgwick</strong>, and Sumner counties.<br />
<strong>Sedgwick</strong> <strong>County</strong> represents the largest portion of the area's population with an estimated 467,008<br />
residents in 2006. Forbes.com ranked Wichita 112 <strong>for</strong> Best Places <strong>for</strong> Business and Careers. From the<br />
earliest days of the aircraft industry, Wichita has been a leading producer of general aviation and<br />
commercial aircraft. McConnell Air Force Base was activated in 1951 and has remained an important<br />
factor in the community. Wichita maintains a moderate cost-of-living rate of 94.1, which is little below<br />
average among 289 urban areas in the United States. Wichita has a large manufacturing industry. The<br />
Herfindahl Index of Industrial Specialization is a measure of the size of firms in relation to the industry and<br />
an indicator of the amount of competition among them. The result is proportional to the average market<br />
share, weighted by market share. As such, it can range from 0 to 1.0, moving from employment evenly<br />
distributed across all sectors to all employment concentrated in one sector. An analysis of employment<br />
data from the BEA.gov website revealed that Wichita has a Herfindahl Index of .89 which means that<br />
employment is more concentrated in a few sectors. This is largely due to the high percentage of jobs in<br />
the manufacturing industry, which is 17 percent according to BEA statistics.<br />
According to in<strong>for</strong>mation contained in the U.S. Census Bureau’s 2004 Business Patterns Report, there<br />
were 11,963 establishments and 234,212 paid employees with an annual payroll of over $8.3 billion. on<br />
the following page were identified in <strong>Sedgwick</strong> <strong>County</strong>.<br />
41
<strong>2010</strong>-<strong>2040</strong> <strong>HAZARDS</strong> <strong>ANALYSIS</strong> <strong>PLAN</strong><br />
MAJOR INDUSTRY<br />
NAICS<br />
No. of No. of Paid<br />
Description<br />
Code<br />
Establishments Employees<br />
11 Forestry, Fishing, Hunting, and Agriculture Support 11 59<br />
21 Mining 142 925<br />
22 Utilities 21 872<br />
23 Construction 1,210 12,832<br />
31-33 Manufacturing 582 51,569<br />
42 Wholesale Trade 698 17,336<br />
44-45 Retail Trade 1,788 26,160<br />
48-49 Transportation and Warehousing 324 7,017<br />
51 In<strong>for</strong>mation 194 6,282<br />
52 Finance and Insurance 857 9,626<br />
53 Real Estate and Rental and Leasing 610 3,565<br />
54 Professional, Scientific and Technical Services 1,117 14,673<br />
55 Management of Companies and Enterprises 123 4,397<br />
NAICS<br />
Code<br />
Description<br />
No. of No. of Paid<br />
Establishments Employees<br />
56 Admin, Support, Waste Management, Remediation Services 574 12,357<br />
61 Educational Services 97 3,376<br />
62 Health Care and Social Assistance 1,189 31,124<br />
71 Arts, Entertainment and Recreation 152 2,210<br />
72 Accommodation and Food Services 998 19,871<br />
81 Other Services (Except Public Administration) 1,237 9,920<br />
99 Unclassified Establishments 39 43<br />
Total 11,963 234,212<br />
Ref: U.S. Census Bureau 2004 <strong>County</strong> Business Patterns (NAICS)<br />
42
<strong>2010</strong>-<strong>2040</strong> <strong>HAZARDS</strong> <strong>ANALYSIS</strong> <strong>PLAN</strong><br />
Wichita has a variety of industries, providing products and services that are recognized world-wide. There<br />
are approximately 15,000 business establishments in the Wichita metro area, 97% of which are small-to<br />
medium-sized firms with less than 100 employees.<br />
43
<strong>2010</strong>-<strong>2040</strong> <strong>HAZARDS</strong> <strong>ANALYSIS</strong> <strong>PLAN</strong><br />
5.12 TRADE<br />
The City of Wichita and <strong>Sedgwick</strong> <strong>County</strong> are part of the North American International Trade Corridor<br />
Partnership (NAITCP) that promotes trade and sustainable economic development within the framework<br />
of the NAITCP to foster commerce, tourism, education, and leadership among member communities.<br />
According to the U.S. Department of Commerce’s Office of Trade and Economic Analysis (OTEA), an<br />
average of $4,975,084,600 of products were exported from <strong>Kansas</strong> to the world market between 1997<br />
and 2001. Of the 34 product groups, two are identified as world classified as a hazardous materials<br />
transport. Between 1997 and 2001, exports of product group chemical manufacturers and petroleum/coal<br />
products averaged $287,661,600 and $151,692,200, respectively.<br />
The following map shows the current (2006) and <strong>for</strong>ecast (2030) value of <strong>Kansas</strong> freight flows by type of<br />
movement, and associated shares of the total <strong>for</strong> each. Although the overall percentage of through<br />
movements is expected to decline slightly from 2006 to 2030 (54 to 51 percent), these movements (which<br />
are overwhelmingly concentrated on the State’s major highway and rail trade corridors) will still dominate<br />
overall movements in the State.<br />
It is important to note that interstate movements are expected to grow significantly, making up 36 percent<br />
of total movements by 2030. This indicates that a greater portion of freight movements in <strong>Kansas</strong> will be<br />
directly related to economic activities within the State, a reflection of the general health of <strong>Kansas</strong><br />
industries.<br />
The total volume and value of shipments into, out of, through, and within <strong>Kansas</strong> <strong>for</strong> 2006 and 2030.<br />
These movements can be divided into three types:<br />
Through movements accounted <strong>for</strong> 54 percent ($476.3 billion) of all freight movements in<br />
<strong>Kansas</strong> by value in 2006; this share is expected to decline to 51 percent ($861.7 billion) by 2030;<br />
44
<strong>2010</strong>-<strong>2040</strong> <strong>HAZARDS</strong> <strong>ANALYSIS</strong> <strong>PLAN</strong><br />
Interstate and International movements constituted 34 percent (or $306.3 billion) in 2006 but<br />
are expected to grow to 36 percent of the total ($618.5 billion) in 2030; and<br />
Intrastate shipments made up 12 percent of the total or $111.2 billion in 2006; this pro-portion is<br />
expected to increase to 13 percent or $224.1 billion by 2030.<br />
45
<strong>2010</strong>-<strong>2040</strong> <strong>HAZARDS</strong> <strong>ANALYSIS</strong> <strong>PLAN</strong><br />
SECTION 3<br />
GEOGRAPHY
<strong>2010</strong>-<strong>2040</strong> <strong>HAZARDS</strong> <strong>ANALYSIS</strong> <strong>PLAN</strong><br />
6 GEOLOGY/HYDROGEOLOGY 21<br />
Except <strong>for</strong> the northeast corner, the county lies within the Arkansas River Lowlands section of the Central<br />
Lowland physiographic province. The highest point, about 1,540 feet above mean sea level (MSL), is on the<br />
west edge approximate five miles southwest of Andale. The lowest point, about 1,220 feet above MSL, is<br />
where the Arkansas River flows out of the county to the south.<br />
DEPOSITS AND DEPTHS<br />
21 http://www.kgs.ku.edu/General/Geology/<strong>Sedgwick</strong>/index.html<br />
42
<strong>2010</strong>-<strong>2040</strong> <strong>HAZARDS</strong> <strong>ANALYSIS</strong> <strong>PLAN</strong><br />
6.1 GEOHYDROLOGY<br />
The Arkansas River enters the county at the northwest corner, flows in a southeasterly direction to a point<br />
north of Wichita, where it turns south and flows out of the county near the southeast corner. The Little<br />
Arkansas River enters the county near the center of the north boundary, flows east-southeast, and joins the<br />
Arkansas River at Wichita. South of the Arkansas River, drainage is by Big Slough, Cowskin Creek, the<br />
Ninnescah River, and their tributaries. A narrow strip along the eastern edge of the county is drained by<br />
east-flowing tributaries of the Walnut River (Walnut River Basin).<br />
43
<strong>2010</strong>-<strong>2040</strong> <strong>HAZARDS</strong> <strong>ANALYSIS</strong> <strong>PLAN</strong><br />
HYDROLOGY AND DEPOSITS IN SEDGWICK COUNTY<br />
Drainage of the county is by way of the Arkansas River and its tributaries mainly within the Lower Arkansas<br />
Basin. Sub-basins located within the Lower Arkansas Basin include: Gar-Peace; North Fork Ninnescah;<br />
South Fork Ninnescah; Ninnescah; Middle Arkansas-Slate; Little Arkansas; Upper Walnut River; and, Lower<br />
Walnut River.<br />
Mineral resources in <strong>Sedgwick</strong> <strong>County</strong> include oil and gas, salt, gypsum, anhydrate, sand, and gravel. Oil<br />
was first discovered in 1928. Hutchinson Member salt deposits in the Wellington Formation of early Permian<br />
age underlie the western half of the county. The deposits range in thickness from a feather edge near the<br />
center of the county to about 300 feet along the western edge. Gypsum and anhydrate are in the Wellington<br />
Formation east of the Arkansas River Valley. Sand and gravel deposits of Pleistocene age underlie about<br />
one-third of the county with most pits near the Arkansas and Little Arkansas Rivers.<br />
44
<strong>2010</strong>-<strong>2040</strong> <strong>HAZARDS</strong> <strong>ANALYSIS</strong> <strong>PLAN</strong><br />
6.2 OIL AND GAS<br />
The map shown above shows 68 active oil and gas fields in <strong>Sedgwick</strong> <strong>County</strong> and account <strong>for</strong> average of<br />
123 oil wells (128 in <strong>2010</strong>) and 4 gas producing wells. There are also 23 abandoned oil and gas fields in<br />
<strong>Sedgwick</strong> <strong>County</strong> which include:<br />
Cannonball North<br />
Chambers Northeast<br />
Chavez<br />
Cottage<br />
Crestview<br />
Eastborough<br />
Eastborough North<br />
Gehring-Rick<br />
Gladys Southeast<br />
Gladys Southwest<br />
Greenwich South<br />
Hinkle<br />
Hohn<br />
Kechi<br />
Kerley<br />
Minneha<br />
Minneha Northwest<br />
Oatville<br />
Petrie Northwest<br />
Prairie Creek<br />
Schulte<br />
Sum-Wick<br />
Ulmer<br />
According to <strong>Kansas</strong> Geological Survey in<strong>for</strong>mation, the total estimated production <strong>for</strong> these fields was<br />
reported to be 121,975 barrels (bbls) of crude oil and 12,379 million cubic feet of natural gas <strong>for</strong> the year<br />
2009. The following tables show the field names, production zones, year of discovery, amount of oil<br />
produced, amount of gas produced, total acreage of the field, and number of wells per field.<br />
45
<strong>2010</strong>-<strong>2040</strong> <strong>HAZARDS</strong> <strong>ANALYSIS</strong> <strong>PLAN</strong><br />
OIL AND GAS FIELDS IN SEDGWICK COUNTY<br />
46
<strong>2010</strong>-<strong>2040</strong> <strong>HAZARDS</strong> <strong>ANALYSIS</strong> <strong>PLAN</strong><br />
OIL AND GAS FIELDS IN SEDGWICK COUNTY<br />
47
<strong>2010</strong>-<strong>2040</strong> <strong>HAZARDS</strong> <strong>ANALYSIS</strong> <strong>PLAN</strong><br />
6.3 SOILS – GENERAL<br />
MAP UNIT DESCRIPTIONS 22<br />
Lesho-Lincoln-Canadian: Occupying about eight percent of the county, these floodplain and terrace soils<br />
are shallow to deep over sand; are nearly level and somewhat poorly drained, well drained, and<br />
somewhat excessively drained; have a sandy substratum; and <strong>for</strong>med in alluvial sediments. The majority<br />
of soil types include Lesho (25%), Lincoln (20%), and Canadian (20%). About 35% of the remaining soils<br />
include the well drained Elandco, Naron and Pratt soils; and, the poorly drained Plevna and somewhat<br />
poorly drained Waldeck soils.<br />
Naron-Farnum-Carwile: Located in terrace positions above flood plain soils and below upland soils and<br />
occupying about nine percent of the county, these soils are deep, nearly level, well drained and<br />
somewhat poorly drained soils that have loamy subsoil; <strong>for</strong>med in old alluvial sediments. Loam and<br />
sandy substratum soils include Naron (40%) and Farnum (25%); while the remaining soils are Carwile<br />
(25%) and a 10% mixture of somewhat poorly drained Drummond soils, well drained Farnum soils, and<br />
moderately well drained Tabler soils.<br />
Elandco-Canadian: Occupying about eight percent of the county, these floodplain and terrace soils are<br />
deep, nearly level, and well drained with loamy subsoil <strong>for</strong>med in alluvial sediments. Soil consistency is<br />
about 45% Elandco, 30% Canadian, and 25% of the following soil types: somewhat poorly drained Lesho<br />
soils; somewhat excessively drained Lincoln soils; poorly drained Plevna soils; moderately well drained<br />
Tabler soils; and, somewhat poorly drained Waldeck soils.<br />
Goessel-Tabler-Farnum: Occupying about nine percent of the county and located on terraces and<br />
uplands east of the Little Arkansas River and north of Wichita, these soils are deep, nearly level, gently<br />
sloping, moderate to well drained soils that have a clayey or loamy subsoil; <strong>for</strong>med in old alluvial<br />
22 Soil Survey of <strong>Sedgwick</strong> <strong>County</strong>, <strong>Kansas</strong>, U.S. Dept of Agriculture, 1979<br />
48
<strong>2010</strong>-<strong>2040</strong> <strong>HAZARDS</strong> <strong>ANALYSIS</strong> <strong>PLAN</strong><br />
sediments. Soil consistency is about 30% Goessel, 25% Tabler, 25% Farnum, and 20% of the following<br />
well drained soil types: Blanket, Elandco, Irwin, and Rosehill soils.<br />
Irwin-Goessel-Rosehill: Occupying about 17 percent of the county and located on uplands in the eastern<br />
part of the county, these soils are deep to moderately deep, nearly level to sloping, moderately to well<br />
drained soils that have a clayey subsoil; <strong>for</strong>med in old alluvial sediments and shale residuum. Soil<br />
consistency is about 35% Irwin, 25% Goessel, 20% Rosehill, and 20% of the following: well drained<br />
Blanket, Clime, Elandco, and Farnum soils; and, moderately well drained Tabler soils.<br />
Shellabarger-Milan-Renfrow: Occupying about nine percent of the county and located on uplands in the<br />
southwestern part of the county adjoining the Ninnescah River drainage system, these soils are deep,<br />
gently sloping to sloping, well drained soils that have a loamy or clayey subsoil; <strong>for</strong>med in old alluvial<br />
sediments and shaly clay residuum. Soil consistency is about 25% Shellabarger, 25% Milan, 25%<br />
Renfrow, and 30% of the following: well drained Blanket, Canadian, Farnum, Naron, Owens, and Vernon<br />
soils; moderately well drained Tabler soils; somewhat poorly drained Crawile soils; and, poorly drained<br />
Plevna soils.<br />
Renfrow-Blanket-Owens: Occupying about five percent of the county and located on uplands in the<br />
western part of the county in the Ninnescah River watershed, these soils are deep and shallow, nearly<br />
level to strongly sloping, well drained soils that have clayey subsoil; <strong>for</strong>med in clay shale residuum and<br />
old clayey alluvial sediments. Soil consistency is about 50% Renfrow, 30% Blanket, 10% Owens, and<br />
10% of the following: well drained Milan and Vernon soils; moderately well drained Tabler soils; and,<br />
somewhat poorly drained Carwile soils.<br />
Blanket-Farnum-Vanoss: Occupying about 35 percent of the county and located on uplands in the central<br />
third of the county, these soils are deep, nearly level to sloping, well drained soils that have loamy or<br />
clayey subsoil; <strong>for</strong>med in old clayey, silty, and loamy sediments. Soil consistency is about 35% Blanket,<br />
30% Farnum, 15% Vanoss, and 20% of the following: well drained Elandco and Milan soils; moderately<br />
well drained Tabler soils; and, somewhat poorly drained Drummond and Waurika soils.<br />
49
<strong>2010</strong>-<strong>2040</strong> <strong>HAZARDS</strong> <strong>ANALYSIS</strong> <strong>PLAN</strong><br />
6.4 SOILS – ANIMAL DISPOSAL AND DEBRIS<br />
The following United States Department of Agriculture (USDA) interactive map 23 shows soils within the<br />
Area of Interest (AOI) that may or may not be considered <strong>for</strong> large animal disposal:<br />
23 http://websoilsurvey.nrcs.usda.gov/app/WebSoilSurvey.aspx<br />
50
<strong>2010</strong>-<strong>2040</strong> <strong>HAZARDS</strong> <strong>ANALYSIS</strong> <strong>PLAN</strong><br />
The following United States Department of Agriculture (USDA) interactive map shows soils within the<br />
Area of Interest (AOI) that may or may not be considered <strong>for</strong> large scale debris and rubble:<br />
51
<strong>2010</strong>-<strong>2040</strong> <strong>HAZARDS</strong> <strong>ANALYSIS</strong> <strong>PLAN</strong><br />
6.5 SEDGWICK BASIN PROVIDENCE/ANTICLINES<br />
The <strong>Sedgwick</strong> Basin, a broad south-plunging shallow embayment of the Anadarko Basin covers an area<br />
of about 8,500 sq mi in south-central <strong>Kansas</strong> encompassing 9 counties. It is bounded by the Central<br />
<strong>Kansas</strong> Uplift to the west, the Nemaha Anticline to the east, and the Anadarko Basin to the south. The<br />
northern margin is the poorly defined structural saddle dividing it from the Salina Basin. A series of narrow<br />
anticlines that are sub parallel to the Nemaha Anticline provide the primary traps. 24 It is a major pre-<br />
Desmoinesian post-Mississippian structural feature. The Nemaha Anticline bounds the basin on the east,<br />
the Pratt Anticline <strong>for</strong>ms its west flank, and an indistinct saddle separates it from the Salina Basin on the<br />
north. The strata in the basin are characterized by facies change and by increased thickness southward<br />
from the shelf area into the deeper part of the Anadarko Basin proper.<br />
Surface beds are Permian and Tertiary in age. The "Equus beds" of Pleistocene age <strong>for</strong>m an extensive<br />
cover over the northern part of the basin, obscuring the bedrock. Sedimentary rocks of Cambrian-<br />
Ordovician, Silurian-Devonian, Mississippian, and Pennsylvanian-Permian age are as much as 5,500 feet<br />
thick in the deepest part of the basin.<br />
Several minor structures, approximately parallel with the Nemaha Anticline, have been recognized in the<br />
basin. These include the Bluff City Anticline, Conway Syncline, Elbing Anticline, Halstead-Graber<br />
Anticline, and the southern end of the Voshell Anticline. 25<br />
The Bluff City anticline, which approximately<br />
parallels the Abilene anticline, extends from the<br />
Florence-Urschel field in Marion <strong>County</strong> through<br />
the Elbing field in northwest Butler <strong>County</strong> to Bluff<br />
City in southeast Harper <strong>County</strong>. The Valley<br />
Center oil field may be regarded as being on the<br />
Bluff City structure.<br />
A deeply buried structure in <strong>Sedgwick</strong> <strong>County</strong> that<br />
contains the Valley Center oil pool (produces from<br />
the Viola) is known as the Valley Center anticline.<br />
The fold is developed principally in Mississippian<br />
and older rocks and probably is faulted. It may be<br />
regarded as lying in the long structural trend known<br />
as the Bluff City anticline. 26<br />
The <strong>Sedgwick</strong> Basin is an important hydrocarbon producing area in <strong>Kansas</strong>. Subsurface structural and<br />
isopach (thickness) maps and cross-sections illustrate the depositional and tectonic history of the area. It<br />
has undergone several episodes of compression followed by tensional de<strong>for</strong>mation during the Paleozoic,<br />
which <strong>for</strong>med anticlinal and fault bounded structures that were conducive to hydrocarbon accumulation.<br />
Also, there were several episodes of sea-level fall and attending subaerial exposure that produced<br />
uncon<strong>for</strong>mities and reservoir porosity. Approximately 110 million barrels of oil and 118 MCF of natural gas<br />
have been produced over the last 92 years in the area. The <strong>Sedgwick</strong> Basin was an embayment of the<br />
epicontinental Permian sea. There are two large structures in the area; the Elbing anticline and the Valley<br />
Center anticline. Hydrocarbons appear to have accumulated on the crest of these structures in multiple<br />
horizons. Each horizon has unique characteristics that enable them to hold hydrocarbons. 27<br />
24 Salina Basin Province and <strong>Sedgwick</strong> Basin Province, <strong>Kansas</strong> Geological Survey<br />
25 Geologic History of <strong>Kansas</strong>, <strong>Kansas</strong> Geological Survey, Bulletin 162<br />
26 <strong>Kansas</strong> Geological Survey, Bulletin 90, Part 6 ―Geologic Structures in <strong>Kansas</strong><br />
27 Depositional and Structural History of the <strong>Sedgwick</strong> Basin, South Central <strong>Kansas</strong> in Relation to Petroleum Entrapment, Jessica A.<br />
Puyear, S. J. Mazzullo, Department of Geology, Fairmount College of Liberal Arts and Sciences<br />
52
<strong>2010</strong>-<strong>2040</strong> <strong>HAZARDS</strong> <strong>ANALYSIS</strong> <strong>PLAN</strong><br />
6.6 SINKHOLES (SEE ALSO KARST)<br />
Sinkholes are <strong>for</strong>med either by solution-subsidence or solution-collapse and have been reported in 26 of<br />
the 105 <strong>Kansas</strong> counties. Surface sinkholes, where numerous, affect ground-water conditions of the<br />
area. The geographic distribution of many sinkholes, is controlled by the outcrop or subcrop pattern of a<br />
relatively soluble stratigraphic unit. Pierce and Courtier (1937) found that recent sinkholes on the<br />
Mississippian surface in southeastern <strong>Kansas</strong> are controlled to some extent by the location of old<br />
sinkholes; seemingly, these areas are more susceptible to recurrent slump. In McPherson, Harvey, and<br />
<strong>Sedgwick</strong> Counties the sinkholes have <strong>for</strong>med near the eastern limit of the Wellington salt (Williams and<br />
Lohman, 1949).<br />
6.7 FAULTS<br />
A portion of the KGS Preliminary Lineament Map of <strong>Kansas</strong> by Lee Gerhardt (Bulletin 250, Part 1) shows<br />
the proximity of <strong>Sedgwick</strong> <strong>County</strong> to the Nemaha Ridge and Humboldt Fault Zone<br />
RELATIONSHIP OF GEOLOGIC FEATURES TO SEDGWICK COUNTY<br />
Three anticlines or ridges shown below have been identified in <strong>Sedgwick</strong> <strong>County</strong> and are classified by the<br />
KGS as inactive faults (Fig. 5). The Bluff City-Valley Center-Elbing Anticline is a result of reverse faulting<br />
and associated with the Midcontinent Rift. Interpreted left-lateral offset in the Wichita igneous complex<br />
(Wichita Granite Pluton) demonstrating left-lateral wrench faulting along the southern portion of the<br />
Nemaha. A 4 mi (6 km) offset is believed to have occurred contemporaneously with the uplift of the<br />
Nemaha.<br />
MAP OF INACTIVE FAULTS, SEDGWICK COUNTY<br />
53
<strong>2010</strong>-<strong>2040</strong> <strong>HAZARDS</strong> <strong>ANALYSIS</strong> <strong>PLAN</strong><br />
Evidence of extension of the Chesapeake Fault Zone from Missouri into <strong>Kansas</strong> has recently been<br />
recognized. Although it is not continuous, the northwest-trending disturbed zone is traceable <strong>for</strong> a<br />
distance of almost 600 miles in Missouri, <strong>Kansas</strong>, and Nebraska. The structure is essentially a grade 6 to<br />
10 miles wide with the floor down dropped as much as 1,000 feet. In Wabaunsee <strong>County</strong> the Nemaha<br />
Anticline is cut by the feature. 2<br />
6.8 SALT CONTAMINATION OF GROUND WATER IN SOUTH CENTRAL KANSAS 28<br />
South-central <strong>Kansas</strong> contains unconsolidated (uncemented) sand and gravel aquifers of the Great Bend<br />
Prairie, the Equus Beds, and the Arkansas River valley. Areas with known or potential saltwater<br />
contamination in south-central <strong>Kansas</strong> are shown below. Areas identified as "known" natural salt<br />
contamination have saltwater within the freshwater aquifer. In the areas labeled "potential" natural salt<br />
contamination, subsurface bedrock <strong>for</strong>mations containing salt or saltwater are in contact with the<br />
overlying freshwater aquifers.<br />
Possible sources of excess salinity in ground water include 1) recharge by irrigation water, 2)<br />
contamination of surface water or soil by waste water, road salt, and other sources, 3) contamination by<br />
oil-field brine and salt-mine waste, and 4) naturally occurring sources of salt.<br />
Recharge by irrigation water and contaminated surface-water typically causes modest salinity increases<br />
in ground water, while contamination by oil-field brines and salt mining can be highly concentrated. Salt<br />
contamination associated with oil or mining activities is typically localized.<br />
28 http://www.kgs.ku.edu/Publications/pic2/pic2_1.html<br />
54
<strong>2010</strong>-<strong>2040</strong> <strong>HAZARDS</strong> <strong>ANALYSIS</strong> <strong>PLAN</strong><br />
EXTENT OF SALT CONTAMINATION<br />
Natural sources of salt contamination of freshwater aquifers include salt- and saltwater-bearing bedrock<br />
<strong>for</strong>mations. Severe drought can lead to salt-contamination problems not observed during normal or<br />
excess precipitation. During periods of little or no recharge, ground water continues to discharge naturally<br />
from freshwater aquifers, decreasing the thickness of the freshwater zone overlying the saltwater.<br />
Regional pumping is likely to be greater during droughts and can further decrease the thickness of the<br />
freshwater aquifer. 29<br />
6.9 HUTCHINSON SALT MEMBER<br />
During most of the Permian Period, shallow seas covered what is now <strong>Kansas</strong>. When the Hutchinson<br />
Salt Member <strong>for</strong>med, the sea was restricted to central <strong>Kansas</strong> probably as an isolated arm of the main<br />
ocean to the south, or cut off entirely. The rate of evaporation exceeded the inflow of water, and as<br />
evaporation continued and the salt content of the water increased, thick layers of salt built up on the sea<br />
bottom.<br />
Degradation in the chemical quality of freshwater in streams and aquifers has adversely affected the<br />
suitability of water <strong>for</strong> public use. This degradation commonly occurs as a result of the natural discharge<br />
of saline water from the Wellington Formation. The dissolution, generally caused by fresh water from<br />
surficial deposits penetrating the member) occurs along the eastern edge of the Hutchinson Salt Member<br />
shown in the maps below, and gypsum units of the Wellington Formation where they are in proximity to<br />
freshwater systems. Dissolution of the salt has resulted in the <strong>for</strong>mation of a discontinuous zone of<br />
solution cavities and collapsed beds. This zone, which extends southward from Salina toward the<br />
Oklahoma State line, is termed the Wellington Aquifer (approximately 1,500 square miles).<br />
29 Salt in <strong>Kansas</strong>, <strong>Kansas</strong> Geological Survey, Bulletin 214<br />
55
<strong>2010</strong>-<strong>2040</strong> <strong>HAZARDS</strong> <strong>ANALYSIS</strong> <strong>PLAN</strong><br />
MAPS OF TOP AND THICKNESS OF THE HUTCHINSON SALT MEMBER WITH STRUCTURE CONTOURS<br />
(KGS Chemical Quality Series 9, Plate 3, 1981)<br />
The lower portion of the Wellington Formation ranges in thickness between 150 feet in Saline <strong>County</strong> to<br />
250 feet in Sumner <strong>County</strong>, averaging about 200 feet thick. The Hutchinson Salt Member overlies the<br />
lower Wellington Formation, and the upper Wellington member (averaging 250 feet thick) consists of gray<br />
shale with minor amounts of gypsum, anhydrite, dolomite, and siltstone. Above the Wellington Formation<br />
is Ninnescah Shale with up to 300 feet in overlying undifferentiated Tertiary and Quaternary deposits.<br />
The eastern edge of the Hutchinson Salt Member is actively being eroded, or dissolved, by contact with<br />
ground water. Salt is mined in <strong>Kansas</strong> using two methods: underground mining and solution mining.<br />
Because <strong>Kansas</strong> is in the central part of the U.S. and relatively close to major natural gas fields, a<br />
number of pipelines run through the state. These pipelines take advantage of hydrocarbon storage<br />
facilities in the salt in central <strong>Kansas</strong>.<br />
Salt dissolution, either natural or human-induced, is also responsible <strong>for</strong> surface subsidence areas<br />
(sinkholes) in <strong>Kansas</strong>. Salt layers in the subsurface are dissolved by water, creating underground void<br />
spaces. When those voids can no longer support the weight above, the rock layers collapse, causing<br />
subsidence at the ground surface. Human-induced subsidence areas are rare, but when they occur, they<br />
are usually attributed to salt mining or oil and gas operations.<br />
56
<strong>2010</strong>-<strong>2040</strong> <strong>HAZARDS</strong> <strong>ANALYSIS</strong> <strong>PLAN</strong><br />
The Hutchinson Salt Member of the Permian Wellington Formation is present in the subsurface under<br />
much of central and south-central <strong>Kansas</strong>. The Hutchinson Salt Member is seen as a laterally persistent<br />
but thin rock unit covering 27,000 square miles within the State of <strong>Kansas</strong>. The updip east edge is<br />
solution-eroded due to natural access to the water table.<br />
For over 100 miles, time active dissolution front in which the Hutchinson Salt is being dissolved by ground<br />
water on its updip east edge is marked by the erratic and poorly mapped "Wellington lost circulation zone"<br />
of oil well drillers. This is a zone of partial to total dissolution of rock salt due to natural causes in which<br />
the void space created by salt removal has only partially been closed by collapse and gravity slumping,<br />
leaving cavernous void space <strong>for</strong>ming a brine-filled conduit which is capable of either yielding large<br />
quantities of brine when pumped or of taking large quantities of fluid such as drilling mud.<br />
The only natural dissolution of the Hutchinson Salt occurs along this updip east salt face. In Pleistocene<br />
time and continuing to the present, surface subsidence above the solution front resulted in sink and valley<br />
<strong>for</strong>mation. A succession of such subparallel north-south valleys, now sediment filled, <strong>for</strong>med as the salt<br />
dissolved and the salt front receded westward. In the deepest part of the solution-slump valleys near the<br />
Little Arkansas River in <strong>Sedgwick</strong> <strong>County</strong>, <strong>for</strong>med as a result of the removal of 300 feet or more of salt,<br />
the water-bearing sand and gravel fill of Pleistocene age reaches a thickness of 275 feet. 30<br />
The ultimate physical cause of the sinkholes has been and is the removal of salt by solution from the<br />
underlying Wellington <strong>for</strong>mation. Bass (1926a) has shown that the salt beds in the Wellington extend into<br />
this area and that the line of sinkholes in McPherson, Harvey, and <strong>Sedgwick</strong> counties practically<br />
coincides with the present eastern margin of the salt beds. 31<br />
6.10 KARST<br />
As indicated by the <strong>Kansas</strong> Geological Survey (KGS), Karst features in carbonate and evaporite-bearing<br />
rocks pose significant engineering hazards and challenges <strong>for</strong> the protection of water supplies from<br />
contamination in parts of <strong>Kansas</strong>. Elsewhere in the state, playas, (pseudo-karst features) may act as<br />
sources of recharge to underlying shallow aquifers and may be in need of protection from plugging or<br />
ground-water contamination from agricultural practices.<br />
Evaporite dissolution has been and is on-going in parts of central and western <strong>Kansas</strong> due to both natural<br />
processes and human activities and has resulted in features ranging over several orders of magnitude in<br />
size. In western <strong>Kansas</strong> playas are common features on the High Plains surface where it is underlain by<br />
thick sequences of unconsolidated Cenozoic deposits.<br />
Where these geomorphic features occur near urban areas, such as Wichita and Hutchinson, and along<br />
the transportation routes, they may present construction problems or impact water supplies that were<br />
un<strong>for</strong>eseen during project planning. Karst can be either of the following types of features:<br />
All of the diagenetic features - macroscopic and microscopic, surface and subterranean - that are<br />
produced during the chemical dissolution and associated modification of a carbonate sequence<br />
(James and Choquette, 1988, pg. 2); or,<br />
A solution-controlled lad<strong>for</strong>m type, characterized by an exclusive surface morpohology,<br />
subsurface drainage and collapse features, which is specifically developed in calcaeous rock.<br />
(Sweeting, 1973, pg.333)<br />
Sinkholes (dolines) are closed depressions. They can be cone or bowl shaped and circular or elliptical in<br />
plan view. The diameter is usually greater than the depth. Average dolines vary in size from 2-100<br />
meters deep and from 10-1,000 meters in diameter. Dolines are regarded as the fundamental unit of<br />
karst relief. (Sweeting, 1973)<br />
30 Part I: Salt Deposits of <strong>Kansas</strong>: Regional Geology-Hutchinson Salt Member of the Wellington Formation, <strong>Kansas</strong> Geological<br />
Survey Bulletin 214<br />
31 South-Central <strong>Kansas</strong> – Geologic History, <strong>Kansas</strong> Geological Survey, Bulletin 79<br />
57
<strong>2010</strong>-<strong>2040</strong> <strong>HAZARDS</strong> <strong>ANALYSIS</strong> <strong>PLAN</strong><br />
Collapse features are closed depressions <strong>for</strong>med by subsurface collapse that may or may not be the<br />
result of subaerial karst. Dissolution by circulation of deep-seated hydrothermal fluids and structural<br />
collapse above tectonic pullaparts are other possible mechanisms <strong>for</strong> the <strong>for</strong>mation of these features.<br />
Five major classes of dolines have been recognized by Jennings (1985):<br />
http://www.kgs.ku.edu/SEISKARST/definitions.html<br />
(http://www.kgs.ku.edu/geohydro/karst/karst_view.cfm) 32<br />
Shown above is distribution of karst features in the Flint Hills region (outlined in black) and adjacent areas<br />
of eastern <strong>Kansas</strong>. Plotted on the map are 1-mile square sections of land where spring and sinkhole<br />
32 <strong>Kansas</strong> Geological Survey Open File Report 2005-50, Midcontinent Meeting <strong>for</strong> the National Karst Map Project-Field Trip Notes<br />
58
<strong>2010</strong>-<strong>2040</strong> <strong>HAZARDS</strong> <strong>ANALYSIS</strong> <strong>PLAN</strong><br />
locations have been documented in the literature. Sections in yellow and red indicate areas the<br />
occurrence of sinkholes and springs, respectively. Modified from the Karst Data Viewer<br />
Karst features in the Flint Hills region includes eastern <strong>Sedgwick</strong> <strong>County</strong> where the Wellington Formation<br />
is located, and where several sinkhole areas have been identified. Areas north and east of <strong>Sedgwick</strong><br />
<strong>County</strong> have been shown to have continued movement of groundwater through the limestones which<br />
have created an integrated network of solution-widened fractures and conduits of varying size. The<br />
character of the bedrock units changes from interedded shales and limestones to interbedded fractured<br />
and slumped shales and solutioned evaporates. Variable thicknesses of Pliocene to Recent sediments<br />
mantle the bedrock in much of the Wellington-McPherson and Arkansas River Lowland regions. At the<br />
surface closed depressions mark subsidence features resulting from natural or anthropogenically-induced<br />
dissolution.<br />
Natural evaporite dissolution in Central <strong>Kansas</strong> has impacted the Lower Permian Wellington Formation,<br />
the Ninnescah Shale, overlying Lower Cretaceous bedrock units, and Cenozoic deposits. The Wellington<br />
consists of a lower unnamed member, the middle Hutchinson Salt Member, and an upper unnamed<br />
member. The Hutchinson Salt is present in the subsurface under much of central and south central<br />
<strong>Kansas</strong> and adjacent north central Oklahoma. The Hutchinson is almost entirely bedded salt with minor<br />
interbedded shales, anhydrite, and gypsum. The upper member of the Wellington and the overlying<br />
Ninnescah consist primarily of gray shale and siltstone with minor amounts of gypsum and anhydrite.<br />
Lower Cretaceous units consist of shales, siltstones, and sandstones that belong to the Kiowa and<br />
Dakota <strong>for</strong>mations. Unconsolidated Tertiary and Quaternary deposits overlie the bedrock surface over<br />
much of this part of central <strong>Kansas</strong>, including the Equus beds, and alluvium and terrace deposits<br />
associated with the Smoky, Saline, Solomon, and Arkansas River valleys. Dip on the bedrock units is<br />
westward, and the updip edge of the Hutchison Salt Member trends from Salina southward through<br />
Newton, Wichita, and Wellington.<br />
Evolution of the Smoky Hill and the Arkansas drainages is intimately tied to subsidence along the updip<br />
edges of the Permian bedrock units due to evaporite dissolution, primarily in the Hutchinson Salt Member<br />
of the Wellington Formation. Recurrent deep-seated structural movement of basement blocks has<br />
activated new and reactivated existing fracture sets, which allowed small downward flows of fresh<br />
groundwater across dominantly shaly rocks. Throughout the Cenozoic, erosion has been actively<br />
stripping off the overlying Cretaceous and Permian bedrock units, bringing the updip edge of the<br />
evaporite-bearing rocks closer to land surface and within the realm of circulating fresh ground water.<br />
Unloading associated with erosion of the overburden changed the stress field and resulted in the<br />
development of joint and fracture systems in the Permian shale and siltstone units above the evaporite<br />
deposits. These joints and fracture systems facilitated greater downward flows of ground water across<br />
the low permeability shales and siltstones of the upper Wellington and Ninnescah. Within the shale units,<br />
volume expansion associated with the conversion of anhydrite to gypsum would have also opened new<br />
fractures in the shales and siltstones. Thus, the shallow fresh ground water system began to dissolve the<br />
evaporites and initiate subsidence of the overlying strata.<br />
Dissolution removed evaporites causing fracturing of the overlying shale and siltstone units and<br />
subsidence of the land surface, all of which helped to localize the river drainage and alluvial deposition<br />
along the developing dissolution zone. Consequently, Equus beds sediments now fill a 50-mile long<br />
trench along a corridor of more than 300 square miles in extent from McPherson to Wichita created by the<br />
dissolution of more than 200 feet of halite. Collectively, the fractured shale and karsified underlying<br />
Chase Group limestone units <strong>for</strong>m a zone eastward of the dissolution front extending from Salina<br />
southward to the <strong>Kansas</strong>-Oklahoma border and is referred to the Wellington aquifer. With the drainage<br />
localized above the dissolution zone, fracturing and subsidence of overlying shales and siltstones<br />
accelerated due to increased flushing by local ground water flow systems. In some cases overlying,<br />
permeable sand and gravel deposits filled open fractures and solution channels to enhance permeability<br />
of the brecciated bedrock. These fracture fillings resulted in a more integrated network of permeable<br />
fractures that increased the flow rate of the shallow ground water system and the intensity of the<br />
evaporite dissolution. Increased intensity of the dissolution has resulted in coalescence of sinkhole and<br />
closed depression features into subsidence basins and has further enhanced fracture and solution<br />
59
<strong>2010</strong>-<strong>2040</strong> <strong>HAZARDS</strong> <strong>ANALYSIS</strong> <strong>PLAN</strong><br />
channel permeability. The <strong>for</strong>mation of sinkholes and subsidence features at the surface is a reminder<br />
that the dissolution front and adjacent dissolution zone continue to develop naturally and in many cases,<br />
enhanced by human activity.<br />
Conceptual modeling indicates that groundwater in the Wellington aquifer moves southward and the flow<br />
is controlled by the combined effects of topographic relief, regional variations in aquifer permeability and<br />
thickness, and the effects of underground disposal of oil-field brines. Local flow systems associated with<br />
the river valleys are believed to be the primary cause of salt dissolution and the local development of the<br />
Wellington aquifer framework. Although previous investigations indicate dissolution has occurred through<br />
the Quarternary period, dissolution has accelerated in the last half century as a result of extensive oil and<br />
gas drilling and related activities.<br />
KGS’s October <strong>2010</strong> project report ―Modeling CO2 Sequestration in Saline Aquifer and Depleted Oil<br />
Reservoir to Evaluate Regional CO2 Sequestration Potential of Ozark Plateau Aquifer System, South-<br />
Central <strong>Kansas</strong>‖ is helping to identify lineaments, potential fracture systems, faults, and karst features in a<br />
regional study area which includes <strong>Sedgwick</strong> <strong>County</strong>. This project focuses locally on the Mississippian<br />
reservoir and the underlying Arbuckle Group Saline Aquifer at the Wellington Field area, Sumner <strong>County</strong>,<br />
<strong>Kansas</strong>, encompassing approximately 10 square miles, and regionally on the Arbuckle Group Saline<br />
Aquifer extending over a 20,000+ square mile area across 17+ counties in southern <strong>Kansas</strong>. Currently,<br />
the basement structure maps from gravity/magnetic analysis is being compared with Arbuckle structural<br />
maps and remote sensing analysis to characterize fault/fracture in the Arbuckle Group Saline Aquifer. A<br />
flow-unit based geomodel has been constructed, using depth-constrained cluster analysis of<br />
petrophysical data, over a 9-Township area around the Plant Site Disposal Well #10, <strong>Sedgwick</strong> <strong>County</strong>,<br />
<strong>Kansas</strong>, and initial simulation studies show that aquitards within the Arbuckle prevent vertical migration of<br />
the CO2 plume towards the primary cap rock.<br />
60
<strong>2010</strong>-<strong>2040</strong> <strong>HAZARDS</strong> <strong>ANALYSIS</strong> <strong>PLAN</strong><br />
7 THREATENED AND ENDANGERED SPECIES<br />
State and federally listed species are protected in <strong>Kansas</strong> as designated by the <strong>Kansas</strong> Nongame and<br />
Endangered Species Conservation Act of 1975. The act places the responsibility <strong>for</strong> identifying and<br />
undertaking appropriate conservation measures <strong>for</strong> listed species directly upon the Department of Wildlife<br />
and Parks through statutes and regulations. Regulations require the department to issue special action<br />
permits <strong>for</strong> activities that affect species listed as threatened and endangered in <strong>Kansas</strong>. Department<br />
personnel conduct environmental reviews of these proposed activities, and if necessary issue action<br />
permits with special conditions that help offset negative effects to listed species and critical habitats.<br />
The tables below show the numbers of threatened, endangered, species in need of conservation, and<br />
candidate species identified with <strong>Sedgwick</strong> <strong>County</strong>. A map showing the general locations of these<br />
species is shown on the next page.<br />
THREATENED (THR) & ENDANGERED (END) SPECIES<br />
Arkansas DarterEtheostoma cragini<br />
State: THR Federal: CAN Critical Habitat: YES<br />
Arkansas River ShinerNotropis girardi<br />
State: END Federal: THR Critical Habitat: YES<br />
Arkansas River Speckled ChubMacrhybopsis tetranema<br />
State: END Federal: NA Critical Habitat: YES<br />
Bald EagleHaliaeetus leucocephalus<br />
State: THR Federal: THR Critical Habitat: YES<br />
Eastern Spotted SkunkSpilogale putorius<br />
State: THR Federal: NA Critical Habitat: YES<br />
Eskimo Curlew Numenius borealis<br />
State: END Federal: END Critical Habitat: NO<br />
Least Tern Sterna antillarum<br />
State: END Federal: END Critical Habitat: NO<br />
Piping Plover Charadrius melodus<br />
State: THR Federal: THR Critical Habitat: NO<br />
Silver ChubMacrhybopsis storeriana<br />
State: END Federal: NA Critical Habitat: YES<br />
Snowy Plover Charadrius alexandrines<br />
State: THR Federal: NA Critical Habitat: NO<br />
Whooping Crane Grus americana<br />
State: END Federal: END Critical Habitat: NO<br />
Legend: CAN – Candidate, NA – Not Applicable<br />
SPECIES IN NEED OF CONSERVATION (SNC)<br />
Black Tern Chlidonias niger<br />
State: SNC Federal: NA Critical Habitat: NA<br />
Bobolink Dolichonyx oryzivorus<br />
State: SNC Federal: NA Critical Habitat: NA<br />
Cerulean Warbler Dendroica cerulea<br />
State: SNC Federal: NA Critical Habitat: NA<br />
Chihuahuan Raven Corvus cryptoleucus<br />
State: SNC Federal: NA Critical Habitat: NA<br />
Eastern Hognose Snake Heterodon platirhinos<br />
State: SNC Federal: NA Critical Habitat: NA<br />
Ferruginous Hawk Buteo regalis<br />
State: SNC Federal: NA Critical Habitat: NA<br />
Golden Eagle Aquila chrysaetos<br />
State: SNC Federal: NA Critical Habitat: NA<br />
Plains Minnow Hybognathus placitus<br />
State: SNC Federal: NA Critical Habitat: NA<br />
River Shiner Notropis blennius<br />
State: SNC Federal: NA Critical Habitat: NA<br />
Short-eared Owl Asio flammeus<br />
State: SNC Federal: NA Critical Habitat: NA<br />
Southern Flying Squirrel Glaucomys volans<br />
State: SNC Federal: NA Critical Habitat: NA<br />
Western Hognose Snake Heterodon nasicus<br />
State: SNC Federal: NA Critical Habitat: NA<br />
Whip-poor-will Camprimulgus vociferus<br />
State: SNC Federal: NA Critical Habitat: NA<br />
Legend: NA – Not Applicable<br />
Source: <strong>Kansas</strong> Department of Wildlife and Parks, Threatened and Endangered Species<br />
61
<strong>2010</strong>-<strong>2040</strong> <strong>HAZARDS</strong> <strong>ANALYSIS</strong> <strong>PLAN</strong><br />
64
<strong>2010</strong>-<strong>2040</strong> <strong>HAZARDS</strong> <strong>ANALYSIS</strong> <strong>PLAN</strong><br />
8 WETLANDS<br />
An area is classified as a wetland if it displays three criteria: Hydric soils; hydrophytic vegetation; and<br />
wetlands hydrology. <strong>Sedgwick</strong> <strong>County</strong> has two soils that have been designated as hydric soils (soils that<br />
typically hold water). Plevna soils are almost always wetlands and Carwile soils can also be wetlands.<br />
Additionally, the Natural Resource Conservation Service has determined 10,357 acres of wetlands exist on<br />
497 agricultural tracts in the <strong>County</strong>. These wetlands generally exist on Plevna or Carwile soils.<br />
<strong>Sedgwick</strong> <strong>County</strong> has soils that contain small areas of inclusions which may be wetlands. Soils which may<br />
have inclusions are: Blanket Silt Loam (Ba), Elandco Silt Loam (Ea), Elandco Silt Loam, frequently flooded<br />
(Ec), Farnum Loam (Fa), Farnum Loam, 1-3% Slope (Fb), Lesho Loam (La), Lincoln (Lb), Pratt Loamy Fine<br />
Sand (Pc), Tabler-Drummond Complex (Tb), Vanoss Silt Loam (Va), Waldeck Sandy Loam (Wa), and<br />
Waurika Silt Loam (Wb).<br />
Further in<strong>for</strong>mation can be found in the <strong>Sedgwick</strong> <strong>County</strong> Water Supply and Wastewater Management<br />
Assessment (2004) report from the <strong>Sedgwick</strong> <strong>County</strong> Conservation District. Individual township maps with<br />
potential identified areas are available through <strong>Sedgwick</strong> <strong>County</strong> Emergency Management.<br />
65
<strong>2010</strong>-<strong>2040</strong> <strong>HAZARDS</strong> <strong>ANALYSIS</strong> <strong>PLAN</strong><br />
SECTION 4<br />
SECTOR SPECIFIC AREAS
<strong>2010</strong>-<strong>2040</strong> <strong>HAZARDS</strong> <strong>ANALYSIS</strong> <strong>PLAN</strong><br />
9 SECTOR SPECIFIC AREAS<br />
9.1 AGRICULTURE AND FOOD SECTOR<br />
This sector provides <strong>for</strong> the fundamental need <strong>for</strong> food. The infrastructure includes supply chains <strong>for</strong> feed<br />
and crop production. This sector also carries out the post harvesting of the food supply, including processing<br />
and retail sales. Threats to this sector include physical vulnerabilities. The following agencies are<br />
responsible <strong>for</strong> this sector:<br />
Local: <strong>Sedgwick</strong> <strong>County</strong> Extension Office<br />
State: <strong>Kansas</strong> Department of Agriculture<br />
Federal: Department of Agriculture and Department of Health and Human Services<br />
The Agriculture and Food Sector is vast, comprising the Nation’s agricultural production and food systems<br />
from farm to table. Because of the open nature of many portions of the Agriculture and Food Sector, attacks<br />
using food or agricultural infrastructure or resources as a means to deliver biological, chemical, or<br />
radiological agents could have a devastating impact on public health and the economy.<br />
The sector includes the supply chains <strong>for</strong> feed, animals, and animal products; crop production and the supply<br />
chains of seed, fertilizer, and necessary related materials; and the post-harvesting components of the food<br />
supply chain, from processing through distribution to consumption.<br />
Agroterrorism supported critical infrastructure/key resource assessments helps to identify vulnerabilities and<br />
potential mitigation strategies <strong>for</strong> those identified vulnerabilities. Agroterrorism targets include livestock,<br />
crops, water supplies, food in grocery stores, farm workers, food processors, and restaurants.<br />
The Agriculture and Food Sector shares dependencies and interdependencies with other CIKR sectors,<br />
including: Banking and Finance, Chemical, Energy, Government Facilities, Healthcare and Public Health,<br />
In<strong>for</strong>mation Technology, Transportation Systems, and Water.<br />
Crop<br />
FIELD CROPS IN 2005, SEDGWICK COUNTY KANSAS<br />
Planted<br />
(1,000 acres)<br />
Harvested<br />
(1,000 acres)<br />
Yield per<br />
harvested acre<br />
(bushels)<br />
Production<br />
(1,000 bushels)<br />
Corn (<strong>for</strong> Grain) 36.2 33.8 141.0 4,752.0<br />
Sorghum (<strong>for</strong> Grain) 65.9 62.4 74.0 4,641.8<br />
Soybeans 35.1 34.7 40.0 1,388.5<br />
Winter Wheat 202.5 194.9 39.0 7,635.0<br />
Cotton (Upland)* 1.3 1.2 520 Pounds 1,300 Bales<br />
*Note: Gins close to Wichita are located in Winfield and Anthony<br />
There are 16 grain elevators located in <strong>Sedgwick</strong> <strong>County</strong> at the following locations: Andale, Furley, Cheney,<br />
Clearwater, Clonmel, Colwich, Garden Plain, Haysville, Mount Hope, Peck, Valley Center, and Wichita. An<br />
additional grain elevator is located near the <strong>Sedgwick</strong>-Sumner <strong>County</strong> line in Mulvane.<br />
66
<strong>2010</strong>-<strong>2040</strong> <strong>HAZARDS</strong> <strong>ANALYSIS</strong> <strong>PLAN</strong><br />
GRAIN ELEVATORS IN SEDGWICK COUNTY<br />
Map No. Company Map No. Company<br />
1 Halstead Coop - Mount Hope 10 Cargill Inc<br />
2 Andale Coop – Andale 11 Garden Plain Coop - Cheney<br />
3 Andale Coop – Colwich 12 Garden Plain Coop - Garden Plain<br />
4 Andale Coop - Valley Center 13 Garden Plain Coop - Clonmel<br />
5 Andale Coop – Furley 14 DeBruce Grain Inc #1<br />
6 Bartlett Grain Co LP 14 DeBruce Grain Inc #2<br />
7 Mid <strong>Kansas</strong> Coop 15 Mulvane Coop - Clearwater<br />
8 Beachner Grain Inc 16 Mulvane Coop - Peck<br />
9 CCGP Inc 17 Mulvane Coop - Mulvane<br />
Note: Andale Coop elevators typically utilize truck grain haulers only and ship to Wichita <strong>for</strong> processing<br />
Company/Terminal<br />
Cargill - Horizon Milling LLC–NA<br />
715 E 13 th Street<br />
Cereal Food Processors, Inc<br />
701 East 17 th Street<br />
Western Grain, Inc<br />
3101 N Washington<br />
DeBruce Grain<br />
5755 S Hoover Road<br />
Bartlett Grain Company, Inc<br />
3311 N Emporia<br />
ADM/Farmland<br />
1400 E 25 th Street<br />
Farmers Grain Cooperative<br />
3101 N Washington Street<br />
Total storage<br />
capacity in<br />
bushels<br />
5,000,000<br />
Upright<br />
2,000,000<br />
Upright<br />
1,285,000<br />
Upright<br />
710,000<br />
Flat<br />
20,238,000<br />
Upright<br />
2,700,000<br />
Flat<br />
8,470,000<br />
Upright<br />
10,503,000<br />
Upright<br />
1,985,000<br />
Upright<br />
Loadout capacity<br />
in bushels per<br />
hour (bph)<br />
Wheat Flour<br />
Capacity<br />
(cwts)<br />
10,000 21,000<br />
N/A 16,000<br />
16,000 N/A<br />
56,000 N/A<br />
50,000 N/A<br />
N/A<br />
N/A<br />
16,000 N/A<br />
Receiving<br />
Rail,<br />
Truck<br />
Rail,<br />
Truck<br />
Rail,<br />
Truck<br />
Rail,<br />
Truck<br />
Rail,<br />
Truck<br />
Rail,<br />
Truck<br />
Rail,<br />
Truck<br />
Loadout<br />
Rail,<br />
Truck<br />
N/A<br />
Rail,<br />
Truck<br />
Rail,<br />
Truck<br />
Rail,<br />
Truck<br />
Rail,<br />
Truck<br />
Rail,<br />
Truck<br />
Railroad<br />
Carriers<br />
BNSF,<br />
Union<br />
Pacific<br />
BNSF,<br />
Union<br />
Pacific<br />
BNSF,<br />
Union<br />
Pacific<br />
BNSF,<br />
Union<br />
Pacific<br />
BNSF,<br />
Union<br />
Pacific,<br />
Other<br />
BNSF<br />
BNSF,<br />
Union<br />
Pacific<br />
67
<strong>2010</strong>-<strong>2040</strong> <strong>HAZARDS</strong> <strong>ANALYSIS</strong> <strong>PLAN</strong><br />
Food Processors and Rendering Plants<br />
Cargill, Inc<br />
Corporate Offices:<br />
Cargill Cattle Feeders & Meat Solutions, 151 N Main Wichita KS<br />
Research & Development, 2901 N Mead Wichita KS<br />
Flour Blending<br />
Grain and Oilseed Supply Chain – NA (GOSCNA) Division:<br />
Crush Facility, 1425 N Mosley Wichita KS<br />
Main Office, 715 E 13 th Street Wichita KS<br />
Refinery, 1417 N Barwise Wichita KS<br />
Premier Blending Inc<br />
816 E Funston Wichita KS<br />
Custom <strong>for</strong>mulating, processing, packaging, and distributing flour based mixes and season blends in<br />
a 60,000 square foot facility<br />
Railroad: BNSF<br />
Switching Carrier: BNSF<br />
Meat Rendering Plant<br />
Darling International (<strong>for</strong>merly National By-Products LLC)<br />
2155 N Mosley Wichita, KS<br />
Largest publicly traded food processing by-products recycling company in the United States. The<br />
Company recycles used restaurant cooking oil and by-products from the beef, pork and poultry<br />
processing industries into useable products such as tallow, feed-grade fats and meat and bone meal.<br />
Meat Processors<br />
Dold Foods (Division of GA Hormel Co Inc)<br />
2929 Ohio Wichita, KS<br />
Farmland Foods Inc<br />
2323 S Sheridan Wichita, KS<br />
Indian Hills Meat & Poultry<br />
920 E Lewis Wichita, KS<br />
McGreevy’s Mid West Co Inc<br />
230 N West Wichita, KS<br />
Penalosa Jerky Co<br />
300 S Greenwich Wichita, KS<br />
Richards Cold Storage<br />
111 S Park Wichita, KS<br />
Stroot Locker Inc<br />
111 N Main – Goddard KS<br />
115 N 1 st Avenue – Mulvane KS<br />
Swiss Burger Brand Meat Co<br />
3763 N Emporia Wichita, KS<br />
Food Service Distributor<br />
F&E Wholesale Grocery, Inc.<br />
(Wichita, KS 67201<br />
(Branch of Ben E. Keith Foods, ninth largest broad-line foodservice distributor in the nation)<br />
68
<strong>2010</strong>-<strong>2040</strong> <strong>HAZARDS</strong> <strong>ANALYSIS</strong> <strong>PLAN</strong><br />
The following map shows the locations of licensed feedlots and animal disposal facilities located within<br />
<strong>Sedgwick</strong> <strong>County</strong> as reported by the <strong>Kansas</strong> Department of Health and Environment, and the <strong>Kansas</strong> Animal<br />
Health Department with color coded map locations. A table reflecting the owners, types of livestock and<br />
number of animals typically maintained at those locations are also shown with corresponding map locations.<br />
FEEDLOTS AND DISPOSAL FACILITIES IN SEDGWICK COUNTY<br />
MAP NO. FACILITY MAP NO. FACILITY<br />
1 Simon Dairy Farm 27 Richard J Kramer<br />
2 Linnebur Farms 28 John Dugan<br />
3 Wilfred & Agnes Doll 29 Lloyd Youngers Dairy<br />
4 Gerald Ballmann 30 Francis & Catherine Farms Inc<br />
5 Betzen Farm 31 Emmett M Simon<br />
6 Simon Gorges Joint Venture 32 Charles E Becker<br />
7 Seiwert Dairy 33 Stuhlsatz Farms<br />
8 Mathias F Simon 34 Leon Zoglman Dairy<br />
9 Simon Farms 35 Jerome May<br />
10 Meyersick Hog Feeders 36 Joseph Baalmann<br />
11 Fred E Hammertzheim 37 Hillman Farms<br />
12 Louis & Earl Wetta 38 Wells M & M Dairy<br />
13 Felix Gorges 39 David Klausmeyer<br />
14 Klein Dairy 40 Dan Lauer Dairy Farm<br />
15 Sliv’s Boy Dairy 41 Jim Simon<br />
16 3K Holstein Farm Inc 42 La Pasture<br />
17 Hays-Z-Acres 43 Ray Kennedy<br />
18 Honey-May Farm 44 John Wehman<br />
19 Simon farms Partnership 45 Pauly’s Five Star Dairy Inc<br />
20 Phil Blocker 46 William Spexarth<br />
21 Goode Dairy 47 Karole Martin<br />
22 W Dean Lorenz 48 R & V Hog Farm<br />
23 Thomas M Schauf 49 Carp Brothers<br />
24 John A Leis 50 Wetta Egg Farm<br />
25 Gerald Martin 51 National By-Products<br />
26 Seidl Dairy 52 Smarsh Farms<br />
69
<strong>2010</strong>-<strong>2040</strong> <strong>HAZARDS</strong> <strong>ANALYSIS</strong> <strong>PLAN</strong><br />
9.2 BANKING AND FINANCE SECTOR<br />
This sector provides the financial infrastructure and consists of commercial banks, insurance companies,<br />
mutual funds, government-sponsored enterprises, pension funds, and other financial institutions that carry<br />
out transactions including clearing and settlement. Threats to this sector include cyber and physical<br />
vulnerabilities. The following agencies are responsible <strong>for</strong> this sector:<br />
State: Office of the State Bank Commissioner<br />
Federal: Department of the Treasury<br />
The Banking and Finance Sector is the backbone <strong>for</strong> the world economy, overseeing:<br />
Deposit, consumer credit, and payment systems.<br />
Credit and liquidity products.<br />
Investment products.<br />
Risk-transfer products (including insurance).<br />
As direct attacks and public statements by terrorist organizations demonstrate, the sector is a high-value and<br />
symbolic target. Additionally, large-scale power outages, recent natural disasters, and economic troubles<br />
demonstrate the wide range of potential threats facing the sector. Faced with these threats, financial<br />
regulators and private-sector owners and operators work collaboratively to maintain a high degree of<br />
resiliency. Terrorist organizations view the sector as a valuable and symbolic target. Large-scale power<br />
outages, recent natural disasters, and economic troubles demonstrate the range of potential threats facing<br />
the sector. The Banking and Finance Sector shares dependencies and interdependencies with other CIKR<br />
sectors, including: Communications, Energy, In<strong>for</strong>mation Technology, and Transportation Systems.<br />
BANK TOTAL CONSOLIDATED ASSETS IN WICHITA AREA<br />
Bank Consolidated Assets ($)<br />
Wichita MSA<br />
Deposits ($)<br />
Net Loans/Leases ($)<br />
Bank of America NA 1,465,221,449 1,406,210 731,831,064<br />
Wachovia/Wells Fargo 510,083,000 392,278 327,474,000<br />
Bank of the West 60,000,590 163,632 43,255,690<br />
Commerce Bank NA 17,958,713 637,103 10,295,847<br />
UMB Bank 10,219,530 58,875 3,432,588<br />
Capitol Federal Savings Bank 8,392,268 470,403 5,462,358<br />
Intrust Bank 3,694,100 2,283,255 2,381,310<br />
Fidelity Bank 1,726,870 1,124,554 945,973<br />
Sunflower Bank 1,711,000 95,953 954,708<br />
RCB Bank 1,412,482 0 705,000<br />
Emprise Bank 1,396,660 815,635 789,308<br />
Central National Bank 833,054 79,836 510,394<br />
<strong>Kansas</strong> State Bank 679,160 26,935 578,222<br />
Community National Bank 641,413 40,280 440,220<br />
Security Savings Bank FSB 549,908 126,506 390,251<br />
Equity Bank NA 434,154 199,347 298,153<br />
Bank of <strong>Kansas</strong> 365,852 93,544 283,454<br />
Southwest National Bank 356,723 303,493 302,413<br />
First State Bank and Trust 321,448 58,024 244,056<br />
Cornerbank 234,746 39,012 117,122<br />
Legacy Bank 233,072 178,697 195,075<br />
The Citizens State Bank 228,842 73,443 115,034<br />
Rose Hill Bank 222,198 171,580 147,256<br />
Central Bank and Trust Co. 219,626 14,643 151,957<br />
Citizens Bank of <strong>Kansas</strong> NA 207,378 16,946 81,749<br />
Reference: Wichita Business Journal, <strong>2010</strong> Book of Lists<br />
70
<strong>2010</strong>-<strong>2040</strong> <strong>HAZARDS</strong> <strong>ANALYSIS</strong> <strong>PLAN</strong><br />
There are 202 banks and branches located within <strong>Sedgwick</strong> <strong>County</strong> to include the cities of Andover, Mulvane<br />
and <strong>Sedgwick</strong>. The following breakdown shows the number of banks and branches by city:<br />
Andale – 1<br />
Andover (Butler <strong>County</strong>) – 7<br />
Bentley – 1<br />
Cheney – 1<br />
Clearwater – 2<br />
Colwich – 1<br />
Derby – 14<br />
Eastborough – 0<br />
Goddard – 2<br />
Haysville – 5<br />
Maize – 2<br />
McConnell AFB – 1<br />
Mount Hope – 1<br />
Mulvane (<strong>Sedgwick</strong> & Sumner <strong>County</strong>) – 2<br />
Park City – 1<br />
<strong>Sedgwick</strong> (<strong>Sedgwick</strong> & Harvey <strong>County</strong>) – 1<br />
Valley Center – 3<br />
Viola – 0<br />
Wichita – 159<br />
71
<strong>2010</strong>-<strong>2040</strong> <strong>HAZARDS</strong> <strong>ANALYSIS</strong> <strong>PLAN</strong><br />
9.3 CHEMICALS AND HAZARDOUS MATERIALS SECTOR<br />
This sector consists of trans<strong>for</strong>ms natural raw materials into commonly used products benefiting society’s<br />
health, safety, and productivity. The chemical industry represents a $450 billion enterprise and produces<br />
more than 70,000 products that are essential to automobiles, pharmaceuticals, food supply, electronics,<br />
water treatment, health, construction, and other necessities. Threats to this sector include cyber and<br />
physical vulnerabilities. The following agencies are responsible <strong>for</strong> this sector:<br />
State: <strong>Kansas</strong> Department of Homeland Security<br />
Federal: Department of Homeland Security<br />
Facilities in some manner use, manufacture, store, transport, or deliver chemicals, encompassing everything<br />
from petrochemical plants to pharmaceutical manufacturers. The Chemical Sector infrastructure can be<br />
divided into three key functional areas in the Chemical Sector value chain:<br />
• Manufacturing plants<br />
• Transport systems<br />
• Distribution systems (including storage/stockpile/supply areas)<br />
Based on the end product produced, the Chemical Sector can be divided into five segments.<br />
• Basic Chemicals: industrial chemicals manufactured in large quantities such as sulfuric acid,<br />
nitrogen, oxygen, chlorine, and fertilizers.<br />
• Specialty Chemicals: manufactured in lower volumes and include adhesives, sealants, flavors and<br />
fragrances, food additives, explosives, institutional and industrial cleaners, and other specialties.<br />
• Agricultural Chemicals: chemical pesticides, fungicides, insecticides, and herbicides.<br />
• Pharmaceuticals: includes medicines, biological products, diagnostic substances, and vitamins.<br />
• Consumer Chemicals: generally packaged goods and include soap, detergents, bleaches,<br />
toothpaste, shampoo, cosmetics, perfume, paints, and many more.<br />
Across the Chemical Sector, facilities are highly dependent on many other CIKR sectors to maintain<br />
operations, including: Communications, Emergency Services, Energy, In<strong>for</strong>mation Technology,<br />
Transportation Systems, and Water. In addition, many sectors rely on the Chemical Sector to maintain their<br />
functionality, including: Agriculture and Food, Critical Manufacturing, Defense Industrial Base, Emergency<br />
Services, and Healthcare and Public Health.<br />
72
<strong>2010</strong>-<strong>2040</strong> <strong>HAZARDS</strong> <strong>ANALYSIS</strong> <strong>PLAN</strong><br />
9.4 COMMERCIAL FACILITIES SECTOR<br />
The Commercial Facilities Sector includes a wide range of business, commercial, residential, and<br />
recreational facilities where large numbers of people congregate. Commercial facilities allow the general<br />
public to move freely without the deterrent of highly visible security barriers. However, this freedom of<br />
movement makes these facilities vulnerable to attack. This sector is diverse in both scope and function, and<br />
is divided into eight subsectors:<br />
Entertainment and Media<br />
Lodging<br />
Outdoor Events<br />
Public Assembly<br />
Real Estate<br />
Resorts<br />
Retail<br />
Sports Leagues<br />
The Commercial Facilities Sector encompasses a wide range of facilities, such as hotels and convention<br />
centers, commercial offices and apartment buildings, stadiums, theme parks, and shopping centers.<br />
The Commercial Facilities Sector shares dependencies and interdependencies with other CIKR sectors,<br />
including: Agriculture and Food, Banking and Finance, Communications, Defense Industrial Base,<br />
Emergency Services, Energy, Government Facilities, Healthcare and Public Health, Monuments and Icons,<br />
Postal and Shipping, Transportation Systems, and Water.<br />
LODGING – HOTELS AND MOTELS<br />
Name Occupancy Name Occupancy<br />
Hyatt Regency Hotel 303 Value Place 121<br />
Hilton Wichita Airport 302 Wichita Super 8 Motel 119<br />
Wichita Marriott Hotel 294 Clubhouse Inn & Suites 118<br />
Holiday Inn select 251 Hotel at Old Town 115<br />
The Broadview Hotel 231 Com<strong>for</strong>t Inn South 114<br />
The Clarion Inn & Suites 185<br />
Candlewood Suites –<br />
Northeast<br />
108<br />
Holiday Inn Hotel & Suites 150 Motel 6 – East 107<br />
Best Western Hotel & Suites<br />
North<br />
149 Fairfield Inn 104<br />
Motel 6 - Airport 142 Homewood Suites by Hilton 104<br />
La Quinta Inn & Suites 140 Value Place 104<br />
Best Western Airport Inn 129 Value Place 104<br />
Courtyard by Marriott 128 Northrock Suites 103<br />
Hampton Inn West 121<br />
BANQUET FACILITIES<br />
Name Total Square Ft Name Total Square Ft<br />
Century II Convention<br />
Center<br />
198,800 Wichita Country Club 14,000<br />
Eberly Farms Inc 130,000 Wichita Scottish Rite 11,750<br />
Hyatt Regency Wichita 31,770 All Star Adventures 10,000<br />
Exploration Place 29,000 Hotel at Old Town 10,000<br />
The Cotillion 28,500<br />
The Palomino Grill at<br />
Terradyne<br />
10,000<br />
The Broadview Hotel 24,370 Corporate Caterers of Wichita 7,700<br />
Best Western Airport Inn 22,240<br />
Botanica, The Wichita<br />
Gardens<br />
6,315<br />
Hilton Wichita Airport 22,000 Garvey Center 6,000<br />
Best Western Hotel & Suites<br />
North<br />
16,104 Tallgrass Country Club 5,200<br />
Wichita Marriott 15,000 Courtyard by Marriott 4,500<br />
MALLS AND SHOPPING CENTERS<br />
73
<strong>2010</strong>-<strong>2040</strong> <strong>HAZARDS</strong> <strong>ANALYSIS</strong> <strong>PLAN</strong><br />
Name<br />
Bradley Fair<br />
The Waterfront<br />
Brittany Center<br />
Brookhollow Center<br />
Carriage Park<br />
Clifton Square Shopping Village<br />
Comotara Center<br />
Delano Shopping District<br />
Eastgate Plaza<br />
Maple Ridge Centre<br />
NewMarket Square<br />
Name<br />
Normandie Village<br />
Northwest Centre<br />
Old Town District<br />
Parklane Shopping Center<br />
Pawnee Plaza Mall<br />
Plaza West Shopping Center<br />
Simons Towne East Square Mall<br />
Simons Towne West Square Mall<br />
The Shops at Tallgrass<br />
Twin Lakes Shopping Center<br />
Wichita Mall<br />
ANNUAL CONVENTIONS AND EVENTS<br />
(<strong>2010</strong> Figures)<br />
Name<br />
Estimated<br />
Estimated<br />
Name<br />
Attendance<br />
Attendance<br />
Wichita River Festival 300,000<br />
<strong>Kansas</strong> Horse Council<br />
Equifest of <strong>Kansas</strong><br />
17,500<br />
National Baseball Congress 75,000<br />
<strong>Kansas</strong> Humane Society<br />
Woofstock<br />
16,000<br />
Music Theater of Wichita 70,000 Women’s Fair Annual Show 14,000<br />
<strong>Kansas</strong> State High School<br />
Wichita Symphony<br />
68,000<br />
Activities Assoc 100 th Annual<br />
Orchestra<br />
State Track & Field Meet<br />
10,000<br />
Wichita Flight Festival 50,000 Prairie Fire Marathon 10,000<br />
Wichita Garden Show 45,000<br />
WABA Home Show 40,000<br />
<strong>Kansas</strong> Sports, Boat and<br />
Travel Show<br />
Mid America Youth<br />
Basketball<br />
Preferred Health Systems<br />
Wichita Open<br />
Wichita Farm & Ranch<br />
Show<br />
Wichita Kennel Club<br />
Sunflower Cluster Annual<br />
Dog Show<br />
Mid America Youth<br />
Basketball<br />
NJCAA Region VI Basketball<br />
Tournament<br />
10,000<br />
37,000 USA Volleyball World League 10,000<br />
30,000<br />
25,000<br />
Darryl Starbird Annual Rod &<br />
Custom Car Show<br />
Susan G Komen Wichita<br />
Race <strong>for</strong> the Cure<br />
9,000<br />
8,000<br />
25,000 Tallgrass Film Festival 8,000<br />
21,000<br />
20,000<br />
Wichita Wagonmaster’s<br />
Downtown Chili Cookoff<br />
Wichita Junior Livestock<br />
Show & Sale Annual<br />
September Convention<br />
8,000<br />
7,400<br />
ARENAS AND STADIUMS<br />
Name Capacity Name Capacity<br />
Intrust Bank Arena 15,000 Lawrence Dumont Stadium 6,111<br />
Cessna Stadium 30,000 Charles Koch Arena 10,506<br />
Eck Stadium 7,851 Hartman Arena 6,500<br />
74
<strong>2010</strong>-<strong>2040</strong> <strong>HAZARDS</strong> <strong>ANALYSIS</strong> <strong>PLAN</strong><br />
Branch<br />
Robert D. Love Central Branch YMCA<br />
402 N. Market Wichita, KS<br />
YMCA WICHITA AREA LOCATIONS<br />
Branch<br />
Northwest Branch YMCA<br />
13838 W. 21st St. North Wichita, KS<br />
East Branch YMCA<br />
9333 E. Douglas Wichita, KS<br />
North Branch YMCA<br />
3330 N. Woodlawn Wichita, KS<br />
Richard A. DeVore South Branch YMCA<br />
3405 S. Meridian Wichita, KS<br />
West Branch YMCA<br />
6940 Newell Wichita, KS<br />
75
<strong>2010</strong>-<strong>2040</strong> <strong>HAZARDS</strong> <strong>ANALYSIS</strong> <strong>PLAN</strong><br />
9.5 COMMUNICATIONS SECTOR<br />
The Communications Sector is an integral component of the U.S. economy, as it underlies the operations of<br />
all businesses, public safety organizations, and government. Over the last 25 years, the sector has evolved<br />
from predominantly a provider of voice services into a diverse, competitive, and interconnected industry<br />
using terrestrial, satellite, and wireless transmission systems.<br />
Long-established processes and procedures <strong>for</strong> network security and rapid response and recovery under all<br />
hazards ensure the continued operation of vital communications services. Focused risk management and<br />
infrastructure protection are integral to the sector’s business continuity planning and network design<br />
processes.<br />
The Communications Sector shares dependencies and interdependencies with other CIKR sectors,<br />
including: Agriculture and Food, Banking and Finance, Chemical, Defense Industrial Base, Emergency<br />
Services, Energy, Healthcare and Public Health, In<strong>for</strong>mation Technology, Postal and Shipping,<br />
Transportation Systems, and Water.<br />
Six long distance landline carriers have chosen to establish local points-of-presence here, with hundreds of<br />
employees maintaining the Wichita area network.<br />
Google Map Showing Locations of Communications Facilities<br />
Nearly all of Wichita's business areas are equipped with fiber optic and are hosted by three competing<br />
networks (Cox Business Services, SBC and TelCove). All services are available in Wichita - from traditional<br />
switched and centrex-based dial tone services to self-healing SONET networks, frame relay and Advanced<br />
Intelligence Networks. Five competing long distance landline carriers are stationed in Wichita - AT&T,<br />
Gabriel Communications, MCI, Sprint and Wiltel, with one long distance point-of-presence (Sprint PCS).<br />
The following listing shows those radio and broadcast stations within the Wichita metropolitan area as<br />
obtained from City-Data.com.<br />
76
<strong>2010</strong>-<strong>2040</strong> <strong>HAZARDS</strong> <strong>ANALYSIS</strong> <strong>PLAN</strong><br />
STRONGEST AM RADIO STATIONS IN WICHITA:<br />
KFTI (1070 AM; 10 kW; Wichita, KS; Owner: Journal Broadcast Corporation)<br />
KMYR (1410 AM; 5 kW; Wichita, KS; Owner: Agape Communications, Inc.)<br />
KFH (1330 AM; 5 kW; Wichita, KS; Owner: Entercom Wichita License, LLC)<br />
KQAM (1480 AM; 5 kW; Wichita, KS; Owner: ABC, INC.)<br />
KNSS (1240 AM; 1 kW; Wichita, KS; Owner: Entercom Wichita License, LLC)<br />
KSGL (900 AM; 0 kW; Wichita, KS; Owner: Agape Communications, Inc.)<br />
KRMG (740 AM; 50 kW; Tulsa, OK; Owner: CXR Holdings, Inc.)<br />
KFAQ (1170 AM; 50 kW; Tulsa, OK; Owner: Journal Broadcast Corporation)<br />
WHB (810 AM; 50 kW; <strong>Kansas</strong> City, MO; Owner: Union Broadcasting, Inc.)<br />
KOMA (1520 AM; 50 kW; Oklahoma City, OK; Owner: Renda Broadcasting Corp. Of Nevada)<br />
KGGF (690 AM; 10 kW; Coffeyville, KS; Owner: KGGF-KUSN, INC.)<br />
KTBZ (1430 AM; 25 kW; Tulsa, OK; Owner: Clear Channel Broadcasting Licenses, Inc.)<br />
KRVN (880 AM; 50 kW; Lexington, NE; Owner: Nebraska Rural Radio Association)<br />
STRONGEST FM RADIO STATIONS IN WICHITA:<br />
K261BL (100.1 FM; Wichita, KS; Owner: Word Of Life Ministries, Inc.)<br />
K204DQ (88.7 FM; Wichita, KS; Owner: Calvary Chapel Of Twin Falls, Inc.)<br />
KEYN-FM (103.7 FM; Wichita, KS; Owner: Entercom Wichita License, LLC)<br />
KYFW (88.3 FM; Wichita, KS; Owner: Bible Broadcasting Network, Inc.)<br />
KRZZ-FM (96.3 FM; Derby, KS; Owner: Capstar Tx Limited Partnership)<br />
KMUW (89.1 FM; Wichita, KS; Owner: Wichita State University)<br />
KRBB (97.9 FM; Wichita, KS; Owner: Capstar Tx Limited Partnership)<br />
KFBZ (105.3 FM; Haysville, KS; Owner: Entercom Wichita License, LLC)<br />
KDGS (93.9 FM; Andover, KS; Owner: Entercom Wichita License, LLC)<br />
KFDI-FM (101.3 FM; Wichita, KS; Owner: Journal Broadcast Corporation)<br />
KZSN (102.1 FM; Hutchinson, KS; Owner: Capstar Tx Limited Partnership)<br />
KKRD (107.3 FM; Wichita, KS; Owner: Capstar Tx Limited Partnership)<br />
KICT-FM (95.1 FM; Wichita, KS; Owner: Journal Broadcast Corporation)<br />
K218DR (91.5 FM; Bel Aire, KS; Owner: Educational Media Foundation)<br />
KYQQ (106.5 FM; Arkansas City, KS; Owner: Journal Broadcast Corporation)<br />
KANR (92.7 FM; Belle Plaine, KS; Owner: Daniel D. Smith)<br />
KTLI (99.1 FM; El Dorado, KS; Owner: Adonai Radio Group, Inc.)<br />
KHCC-FM (90.1 FM; Hutchinson, KS; Owner: Hutchinson Community Jr. College)<br />
KMXW (92.3 FM; Newton, KS; Owner: Journal Broadcast Corporation)<br />
KFXJ (104.5 FM; Augusta, KS; Owner: Journal Broadcast Corporation)<br />
TV BROADCAST STATIONS AROUND WICHITA:<br />
KTQW-LP (Channel 53; Wichita, KS; Owner: Knowledge L.C.)<br />
K59DA (Channel 59; Wichita, KS; Owner: Trinity Broadcasting Network)<br />
K15DD (Channel 15; Wichita, KS; Owner: Ventana Television, Inc.)<br />
KFVT-LP (Channel 40; Wichita, KS; Owner: Locke Supply Co.)<br />
KSNW (Channel 3; Wichita, KS; Owner: Emmis Television License Corporation Of Wichita)<br />
KSAS-TV (Channel 24; Wichita, KS; Owner: Clear Channel Broadcasting Licenses, Inc.)<br />
KAKE-TV (Channel 10; Wichita, KS; Owner: Gray MidAmerica TV Licensee Corp.)<br />
KWCV (Channel 33; Wichita, KS; Owner: WLBB Broadcasting, L.L.C.)<br />
KCTU-LP (Channel 55; Wichita, KS; Owner: River City Broadcasting Corp.)<br />
KSMI-LP (Channel 51; Wichita, KS; Owner: River City Broadcasting Corp.)<br />
KSCC (Channel 36; Hutchinson, KS; Owner: Mercury Broadcasting Company, Inc.)<br />
KWCH-TV (Channel 12; Hutchinson, KS; Owner: Media General Broadcasting Of So. Carolina Holdings, Inc.)<br />
KPTS (Channel 8; Hutchinson, KS; Owner: <strong>Kansas</strong> Public Telecommunications Service, Inc.)<br />
77
<strong>2010</strong>-<strong>2040</strong> <strong>HAZARDS</strong> <strong>ANALYSIS</strong> <strong>PLAN</strong><br />
Federal Communications Commission (FCC) Towers and Licenses<br />
FCC Registered Cell Phone Towers: 6<br />
FCC Registered Antenna Towers: 648<br />
FCC Registered Commercial Land Mobile Towers: 19<br />
FCC Registered Private Land Mobile Towers: 180<br />
FCC Registered Broadcast Land Mobile Towers: 24<br />
FCC Registered Microwave Towers: 325<br />
FCC Registered Paging Towers: 34<br />
FCC Registered Maritime Coast & Aviation Ground Towers: 89<br />
FCC Registered Amateur Radio Licenses: 1,261<br />
78
<strong>2010</strong>-<strong>2040</strong> <strong>HAZARDS</strong> <strong>ANALYSIS</strong> <strong>PLAN</strong><br />
79
<strong>2010</strong>-<strong>2040</strong> <strong>HAZARDS</strong> <strong>ANALYSIS</strong> <strong>PLAN</strong><br />
9.6 CRITICAL MANUFACTURING SECTOR<br />
The Critical Manufacturing Sector is composed of four broad manufacturing industries: primary metal<br />
manufacturing; machinery manufacturing; electrical equipment, appliance, and component manufacturing;<br />
and transportation equipment manufacturing.<br />
Primary Metal Manufacturing Industry – comprised of two manufacturing and processing industries:<br />
The iron and steel mills and Ferro alloy manufacturing industry includes the direct reduction of iron<br />
ore; manufacturing pig iron in molten or solid <strong>for</strong>m; converting pig iron into steel; and manufacturing<br />
Ferro alloys. In addition, this industry involves making steel; manufacturing shapes such as bars,<br />
plates, rods, sheets, strips, or wire; and <strong>for</strong>ming pipe and tube.<br />
Alumina and aluminum production and processing, the second primary metal manufacturing industry,<br />
converts aluminum-bearing bauxite ore into products such as alumina, aluminum ingots, and rolled<br />
or drawn aluminum products including plate, sheet, foil, and extrusions.<br />
Machinery Manufacturing Industry – manufactures engine, turbine, and power transmission equipment.<br />
Machinery manufacturing includes generators, governors, and water, gas, steam, wind, and hydraulic<br />
turbines.<br />
Electrical Equipment, Appliance, and Component Manufacturing – produces a wide variety of electrical<br />
equipment and parts including power, distribution, and specialty trans<strong>for</strong>mers; electric motors, generators,<br />
and motor generator sets; switchgear and switchboard apparatus; relays; and industrial controls.<br />
Transportation Equipment Manufacturing – comprised of three related industries:<br />
Motor Vehicle Manufacturing: produces passenger cars, trucks, locomotives, motorcycles,<br />
motorcycle parts and components, and commercial ships.<br />
Aerospace Product and Parts Manufacturing: produces commercial and private aircraft; aircraft<br />
components and avionics; and satellites, space plat<strong>for</strong>ms, and launch vehicles.<br />
Railroad Rolling Stock Manufacturing: manufactures and rebuilds locomotives and their frames and<br />
parts. Additionally, this industry provides rail, light-rail, and rapid-transit cars <strong>for</strong> freight and<br />
passenger service, as well as railroad and track-maintenance equipment.<br />
The Critical Manufacturing Sector shares dependencies and interdependencies with other CIKR sectors,<br />
including: Chemical, Communications, Defense Industrial Base, Emergency Services, Energy, In<strong>for</strong>mation<br />
Technology, and Transportation Systems.<br />
AIRCRAFT MANUFACTURING<br />
Wichita ranks first in the world in production of general aviation aircraft and is also an important centre <strong>for</strong><br />
military aircraft manufacture. Learjet, now owned by Bombardier, Beech Aircraft, now owned by Hawker,<br />
and Cessna, now a Textron company, remains in Wichita because of their large manufacturing equipment<br />
investments and a skilled labor pool. About two-thirds of Wichita's manufacturing base is made up of airplane<br />
building, employing about 44,000 people.<br />
AIR-MAC, lnc Quality CNC Machining Aircraft Products - Over 32 years of experience in CNC<br />
machining top quality aircraft, auto and other products.<br />
Ametek B & S Aircraft Parts - FAA approved repair station with the ability to overhaul / repair starter<br />
generators, fuel systems, boost pumps and more.<br />
Apex Engineering Inc. - Aircraft parts and assemblies<br />
The Boeing Company - Engineering, fabrication, assembly and modification <strong>for</strong> both commercial and<br />
military aircraft.<br />
Bombardier Aerospace - Manufacturer of Advanced Business Jet Aircraft. The world's fourth largest<br />
manufacturer of civil aircraft.<br />
80
<strong>2010</strong>-<strong>2040</strong> <strong>HAZARDS</strong> <strong>ANALYSIS</strong> <strong>PLAN</strong><br />
Cessna Aircraft Company - Worldwide headquarters supporting a fleet of 2,400 Citation jets and<br />
150,000 piston and turboprop aircraft.<br />
Excel Manufacturing, Inc. - Aircraft structural component, commercial precision parts, machining and<br />
sheet metal fabrication<br />
Graco Supply Co. - Quality adhesives, sealants, paints, coatings, primers, lubricants, tapes, cleaners<br />
and MRO products <strong>for</strong> the Aerospace, Aircraft and Industrial markets.<br />
H & H Tool LLC - Full line of Monogram Wedgelock fasteners and tooling.<br />
Hawker Beechcraft - Worldwide headquarters and principal business aviation manufacturing site.<br />
L & M Aircraft LLC - Distributor of aircraft parts <strong>for</strong> corporate and light planes that are not readily<br />
available through ordinary distributors or manufacturing channels.<br />
Spirit AeroSystems - The world's largest supplier of commercial airplane assemblies and<br />
components.<br />
OTHER MANUFACTURING<br />
According to the Wichita Eagle, during the past 15 years, manufacturing employment has held steady at<br />
about 26 percent.<br />
Architectural Art Mfg., Inc. - Extruded metal expansion joint covers and trench / access covers<br />
BG Products, Inc. - Manufactures and distributes specialty lubricants, greases and chemicals<br />
Center Industries Corporation - Nonprofit Manufacturing Company<br />
Chance Industries, Inc. - Builds quality amusement products <strong>for</strong> all areas of the amusement industry.<br />
Chance Rides is the largest manufacturer of amusement rides in the United States.<br />
Electromech Technologies - Custom design and manufacturing facility specializing in<br />
electromechanical equipment<br />
Galaxy Audio - Manufactures professional audio equipment<br />
Great Plains Industries - Design, manufacturing, and marketing liquid handling products <strong>for</strong> the<br />
chemical and petroleum industries<br />
Greenway Electric - Specializing in Automated Process Control Systems<br />
Heartland Plastics - A blow molding company that specializes in small to medium sized production<br />
runs of polyethylene and polypropylene items.<br />
High Touch, Inc. - Automation products and support<br />
Insul-Vest - Manufacturer of high temperature insulation blankets<br />
Isodyne, Inc. - Tool-less Braid Termination System<br />
KCE Welding & Fabrication - Welding and metal fabrication shop<br />
Koch Industries, Inc. is the second largest privately held company in the United States with interests<br />
in oil, gas, chemicals, chemical technology, agriculture, construction materials, real estate, capital<br />
services and financial investments.<br />
Liquidynamics - Manufacturers and suppliers of Commercial/ Industrial liquid handling equipment<br />
and components<br />
Love Box Company - Package Designing and Development<br />
MSI Automation - Direct source <strong>for</strong> induction heating, saw blade brazing machines, and heat treating<br />
equipment.<br />
Quality Tool Service - Tool Grinding<br />
Sharpline Converting, Inc. - Manufacturer of decorative pressure sensitive vinyl graphics <strong>for</strong> use on<br />
automobiles, recreational vehicles, marine products, and <strong>for</strong> architectural signage.<br />
Sky-Eye Camera Systems - Mobile remote-controlled video camera designed to videotape surgery<br />
and used in Anatomy classes.<br />
Vornado Air Circulation Systems, Inc. - Designs, manufactures and markets proprietary consumer<br />
electric air fans and heaters<br />
Occidental Chemicals (OxyChem) - Chemicals produced by the Wichita complex are also used in<br />
thousands of consumer products, including soaps and detergents, purified drinking water,<br />
pharmaceuticals, photographic film, skin care products, paper, processed fruits and vegetables,<br />
refrigerants, and soft drinks.<br />
Weckworth Manufacturing, Inc. - Contract manufacturer<br />
81
<strong>2010</strong>-<strong>2040</strong> <strong>HAZARDS</strong> <strong>ANALYSIS</strong> <strong>PLAN</strong><br />
Westland Corporation - Manufactures barrels and screws <strong>for</strong> plastic processing machinery<br />
82
<strong>2010</strong>-<strong>2040</strong> <strong>HAZARDS</strong> <strong>ANALYSIS</strong> <strong>PLAN</strong><br />
9.7 DAMS SECTOR<br />
The Dams Sector is comprised of facility owners and operators at the Federal, State, and local levels, and<br />
the private sector. These assets encompass conventional dams, levees, dikes, industrial waste<br />
impoundments, and other similar water retention and/or water control facilities. Dams are vital to the<br />
infrastructure and provide a wide range of economic, environmental, and social benefits, including<br />
hydroelectric power, river navigation, water supply, flood control, and recreation.<br />
However, dams and levees can fall victim to natural disasters or terrorist acts resulting in loss of human life,<br />
economic loss including property damage, and extensive environmental damage.<br />
The Dams Sector shares dependencies and interdependencies with other CIKR sectors, including:<br />
Agriculture and Food, Emergency Services, Energy, Transportation Systems, and Water.<br />
DAM LOCATIONS IN SEDGWICK COUNTY<br />
Specific in<strong>for</strong>mation on each of the dams is located on the following pages and was provided by<br />
the <strong>Kansas</strong> Water Office and accessible through the U.S. Army Corps of Engineers National<br />
Inventory of Dams database. There are 26 dams that have no reported in<strong>for</strong>mation in the<br />
database and four dams with unknown hazard classes.<br />
83
<strong>2010</strong>-<strong>2040</strong> <strong>HAZARDS</strong> <strong>ANALYSIS</strong> <strong>PLAN</strong><br />
# Dam Name River<br />
1 <strong>Kansas</strong> #4895<br />
2<br />
West Sector Whitewater<br />
WS Dam 20<br />
(Harvey <strong>County</strong>)<br />
DAMS IN SEDGWICK COUNTY<br />
Year<br />
Owner<br />
Storage<br />
Built<br />
Type<br />
Owner Name Hazard<br />
Tributary –<br />
Goosebury 1955 50 - S & R Properties Inc Unknown<br />
Creek<br />
Tributary –<br />
Sand Creek<br />
1979 1973<br />
82<br />
Local<br />
Gov’t<br />
Whitewater River<br />
Watershed<br />
Significant<br />
3 <strong>Kansas</strong> #3787<br />
Tributary –<br />
Prairie Creek<br />
1946 50 - Ulmer Low<br />
4 <strong>Kansas</strong> #3786 - - - - - -<br />
5 <strong>Kansas</strong> #3780<br />
Tributary –<br />
Prairie Creek<br />
1945 60 - Koerner Low<br />
6 <strong>Kansas</strong> #3773 - - - - - -<br />
7 <strong>Kansas</strong> #3772 - - - - - -<br />
8 <strong>Kansas</strong> #3771 - - - - - -<br />
9 <strong>Kansas</strong> #3770 - - - - - -<br />
10 <strong>Kansas</strong> #3769<br />
11 <strong>Kansas</strong> #3768<br />
Tributary –<br />
Chisholm<br />
Creek<br />
Tributary –<br />
Chisholm<br />
Creek<br />
1954 95 Private Richetal Low<br />
1948 90 - King Low<br />
12 <strong>Kansas</strong> #3767 - - - - - -<br />
13 <strong>Kansas</strong> #3753<br />
Tributary -<br />
Arkansas<br />
1943 50 - Phelps Low<br />
14 <strong>Kansas</strong> #3750<br />
Tributary –<br />
Arkansas<br />
1946 90 - Williams Low<br />
15<br />
Mt Hope WJD No. 54, Tributary – Big<br />
Local<br />
1981 151.24<br />
DD No. 3<br />
Slough Creek<br />
Gov’t<br />
Mt Hope WJD No. 54 Low<br />
16 <strong>Kansas</strong> #3741 - - - - - -<br />
17<br />
Andale WSD FRD No. A- Tributary –<br />
Local<br />
1963 407.2<br />
2<br />
Cowskin Creek<br />
Gov’t<br />
City of Andale High<br />
18 <strong>Kansas</strong> #3751<br />
Tributary –<br />
Cowskin Creek<br />
1956 55 - Martin Low<br />
19 <strong>Kansas</strong> #4891<br />
Tributary –<br />
Middle Fork<br />
1970 60 - Thomison Low<br />
20 <strong>Kansas</strong> #3781<br />
Tributary –<br />
Whitewater<br />
Creek<br />
1939 120 - Luzzati Low<br />
21<br />
Fawn Lake Dam, <strong>Kansas</strong><br />
#3774<br />
22 <strong>Kansas</strong> #3788<br />
23 Beech Lake Dam<br />
24 <strong>Kansas</strong> #3782<br />
Tributary –<br />
East Branch<br />
Chisholm<br />
Creek<br />
Tributary –<br />
Fourmile Creek<br />
Tributary –<br />
Gypsum Creek<br />
Tributary –<br />
Spring Branch<br />
Creek<br />
1950 50 -<br />
Fawn Lake Home<br />
Owners Assoc<br />
High<br />
1954 95 - Reed Low<br />
1953 430 Private<br />
Beech Aircraft<br />
Corporation<br />
High<br />
1957 75 - Tracts Low<br />
25 <strong>Kansas</strong> #3784<br />
Tributary –<br />
Spring Creek<br />
1950 60 - Fernpray Low<br />
26<br />
Rainbow Lake, <strong>Kansas</strong> Tributary –<br />
#4892<br />
Cowskin Creek<br />
1970 80 - Carlson Unknown<br />
27 <strong>Kansas</strong> #3765<br />
Tributary –<br />
Cowskin Creek<br />
1940 50 - Decker Low<br />
28 <strong>Kansas</strong> #3764 - - - - - -<br />
29 <strong>Kansas</strong> #4894<br />
Tributary –<br />
Cowskin Creek<br />
1979 146 - Falkowski Unknown
<strong>2010</strong>-<strong>2040</strong> <strong>HAZARDS</strong> <strong>ANALYSIS</strong> <strong>PLAN</strong><br />
DAMS IN SEDGWICK COUNTY – CONT’D<br />
# Dam Name River<br />
Year<br />
Owner<br />
Storage<br />
Built<br />
Type<br />
Owner Name Hazard<br />
30 <strong>Kansas</strong> #3760<br />
Tributary –<br />
Cowskin Creek<br />
1958 55 Private J.R. Dine Low<br />
31 <strong>Kansas</strong> #3759 - - - - - -<br />
32 <strong>Kansas</strong> #3754<br />
Tributary – Dry<br />
1936 55 - Girrens Low<br />
Creek<br />
33<br />
Strunk (Legg) Dam, Tributary – Dry<br />
<strong>Kansas</strong> #3756<br />
Creek<br />
1941 100 - Harold Strunk Significant<br />
34 <strong>Kansas</strong> #3755<br />
Tributary – Dry<br />
Creek<br />
1957 75 - Stockemer Significant<br />
35 <strong>Kansas</strong> #1887<br />
Afton Creek<br />
Tributary<br />
1934 57 Private R.R. Moore Low<br />
36 <strong>Kansas</strong> #1884<br />
Afton Creek<br />
W.E.<br />
1931 107 Private<br />
Tributary<br />
McGreevy<br />
Low<br />
37 <strong>Kansas</strong> #3742 - - - - - -<br />
38<br />
Lake 40 & 8 Dam, Tributary –<br />
Voiture 58 of<br />
1918 110 -<br />
<strong>Kansas</strong> #3743 Spring Creek<br />
40 & 8 Inc<br />
Significant<br />
39<br />
Spring Creek<br />
Local Spring Creek<br />
Sand Creek 1962 853<br />
Watershed Dam 3<br />
Gov’t Watershed<br />
Low<br />
40<br />
Spring Creek<br />
Watershed Dam L-1<br />
41 Cheney Dam<br />
North Fork<br />
Tributary –<br />
Ninnescah<br />
North Fork<br />
Ninnescah<br />
1962 336<br />
83<br />
Local<br />
Gov’t<br />
1963 151780 Federal<br />
Spring Creek<br />
Watershed<br />
Dept of Interior<br />
– Bureau of<br />
Reclamation<br />
42 <strong>Kansas</strong> #3739 - - - - - -<br />
43 <strong>Kansas</strong> #1890 Clear Creek 1935 83 Private Karl Koster Low<br />
44 <strong>Kansas</strong> #1891 - - - - - -<br />
45 <strong>Kansas</strong> #3747 - - - - - -<br />
46 <strong>Kansas</strong> #3746<br />
47 <strong>Kansas</strong> #1885<br />
48 <strong>Kansas</strong> #1886<br />
Tributary –<br />
Clear Creek<br />
Clearwater<br />
Creek<br />
Tributary<br />
Clearwater<br />
Creek<br />
Tributary<br />
Low<br />
High<br />
1941 55 - Wheeler Low<br />
1932 179 Private<br />
Clara Lint &<br />
Walter Morris<br />
Low<br />
1932 71 Private Davis Low<br />
49<br />
Walter & Anna Miller, Afton Creek<br />
Walter & Anna<br />
1938 228 Private<br />
<strong>Kansas</strong> #1893 Tributary<br />
Miller<br />
Low<br />
50 <strong>Kansas</strong> #1888 Pole Cat Creek 1935 74 Private J.H. Downing Low<br />
51<br />
Walter P Innes,<br />
<strong>Kansas</strong> #3748<br />
Clear Creek 1952 70 Private Unknown Low<br />
52 Lake Afton Dam<br />
53 <strong>Kansas</strong> #1892<br />
54<br />
Spring Creek<br />
Watershed Dam R-1<br />
Tributary –<br />
Clearwater<br />
Creek<br />
Clearwater<br />
Creek<br />
Tributary<br />
North Fork<br />
Tributary –<br />
Ninnescah<br />
1942 6146<br />
1936 94<br />
1972 432<br />
Local<br />
Gov’t<br />
-<br />
Local<br />
Gov’t<br />
<strong>Sedgwick</strong><br />
<strong>County</strong><br />
Vanfossan<br />
Spring Creek<br />
Watershed<br />
55 <strong>Kansas</strong> #3744 - - - - - -<br />
56<br />
Spring Creek Tributary -<br />
Local Spring Creek<br />
1962 610<br />
Watershed Dam R-3 Ninnescah<br />
Gov’t Watershed<br />
Low<br />
57 <strong>Kansas</strong> #3740 - - - - - -<br />
58 <strong>Kansas</strong> #3745 - - - - - -<br />
59 <strong>Kansas</strong> #3749 - - - - - -<br />
60<br />
Jno. McQuillan,<br />
<strong>Kansas</strong> #3752<br />
Tributary -<br />
Ninnescah<br />
High<br />
Low<br />
Low<br />
1940 90 Private Chambers Low
<strong>2010</strong>-<strong>2040</strong> <strong>HAZARDS</strong> <strong>ANALYSIS</strong> <strong>PLAN</strong><br />
DAMS IN SEDGWICK COUNTY – CONT’D<br />
# Dam Name River<br />
Year<br />
Owner<br />
Storage<br />
Built<br />
Type<br />
Owner Name Hazard<br />
Tributary –<br />
61 <strong>Kansas</strong> #4893 Clearwater 1970 55 - Boblun Unknown<br />
Creek<br />
62 <strong>Kansas</strong> #3757 - - - - - -<br />
63 <strong>Kansas</strong> #3758 - - - - - -<br />
64 <strong>Kansas</strong> #3761 - - - - - -<br />
65 <strong>Kansas</strong> #3762<br />
Tributary -<br />
Ninnescah<br />
1957 60 - Chambers Significant<br />
66 <strong>Kansas</strong> #1889 - - - - - -<br />
67 <strong>Kansas</strong> #3763 - - - - - -<br />
68<br />
W.F. Wattles, <strong>Kansas</strong><br />
#1894<br />
Spring Creek 1939 119 Private W.F. Wattles Low<br />
69 <strong>Kansas</strong> #3766 - - - - - -<br />
70<br />
Haley Dam, <strong>Kansas</strong><br />
#3777<br />
Dry Creek 1950 50 - Lois E Haley Significant<br />
71 <strong>Kansas</strong> #3776 - - - - - -<br />
72<br />
73<br />
Columbian Acres<br />
Dam No. 1, <strong>Kansas</strong><br />
#3778<br />
Columbian Acres<br />
Dam No. 2, <strong>Kansas</strong><br />
#3779<br />
E.A. Goodin, <strong>Kansas</strong><br />
#3785<br />
Tributary –<br />
Spring Creek<br />
Tributary –<br />
Spring Creek<br />
1953 70 -<br />
1953 70 -<br />
84<br />
Columbian<br />
Acres Inc<br />
Columbian<br />
Acres Inc<br />
74<br />
Tributary –<br />
Spring Creek<br />
1949 90 Private Goodin Significant<br />
Tributary –<br />
75 <strong>Kansas</strong> #3783 Spring Branch 11955 70 - Arnold Low<br />
Creek<br />
Tributary –<br />
76 <strong>Kansas</strong> #3789 Spring Branch 1954 60 - Frost Low<br />
Creek<br />
77<br />
<strong>Kansas</strong> #3870 (Butler<br />
<strong>County</strong>)<br />
- - - - - -<br />
78 <strong>Kansas</strong> #3790 - - - - - -<br />
79<br />
Tributary –<br />
Middle Walnut WJD<br />
Local Middle Walnut<br />
Eight Mile 1985 389<br />
No. 60, FRD No. 12A<br />
Gov’t WJD No. 60<br />
Creek<br />
Low<br />
80 <strong>Kansas</strong> #7743<br />
Tributary –<br />
Jester Creek<br />
1996 65 Private<br />
Definitions<br />
Lloyd<br />
McGuiley<br />
Storage: in acre-feet, this is defined as the total storage space in a reservoir below the normal retention<br />
level, including dead and inactive storage and excluding any flood control or surcharge storage.<br />
Hazard definitions as defined in <strong>Kansas</strong> Administrative Regulation 5-40-9 are as follows:<br />
LOW HAZARD POTENTIAL (CLASS A) – Dams located in rural or agricultural areas where failure may<br />
damage farm buildings, limited agricultural land, or county, township and private roads.<br />
SIGNIFICANT HAZARD POTENTIAL (CLASS B) – Dams located in predominately rural or agricultural areas<br />
where failure may endanger few lives, damage isolated homes, secondary highways or minor railroads or<br />
cause interruption of use or service of relatively important public utilities.<br />
HIGH HAZARD POTENTIAL (CLASS C) – Dams located in areas where failure may cause extensive loss of<br />
life, serious damage to homes, industrial and commercial facilities, important public utilities, main highways<br />
or railroads.<br />
http://crunch.tec.army.mil/nid/webpages/nid.cfm<br />
Low<br />
Low<br />
Low
<strong>2010</strong>-<strong>2040</strong> <strong>HAZARDS</strong> <strong>ANALYSIS</strong> <strong>PLAN</strong><br />
85
<strong>2010</strong>-<strong>2040</strong> <strong>HAZARDS</strong> <strong>ANALYSIS</strong> <strong>PLAN</strong><br />
9.7.1 CHENEY DAM AND RESERVOIR<br />
Under Public Law 86-787, the Cheney Division was authorized on September 14, 1960 by act of Congress<br />
(74 Stat. 1026). The Cheney Division of the U.S. Department of the Interior Bureau of Reclamation (DOI<br />
BOR) Wichita Project consists of Cheney Dam and Reservoir on the North Fork of the Ninnescah River. This<br />
division of the project provides a supplemental water supply to the city of Wichita, flood control <strong>for</strong> protection<br />
of downstream areas, and recreation and fish and wildlife benefits. Because of the flood control features of<br />
the division, approximately 3,700 acres of land downstream from the dam can be irrigated, although no<br />
stored water is to be provided <strong>for</strong> irrigation purposes.<br />
Municipal water supply storage is used to supplement<br />
the present supply pumped from wells. On an equaluse<br />
basis - well water and reservoir water - the supply<br />
is estimated to be adequate until the year <strong>2010</strong>. A<br />
pumping plant and pipeline was constructed and is<br />
operated by the city of Wichita to convey water from<br />
Cheney Dam to the water treatment plant in the city.<br />
Construction of Cheney Dam began in 1962 and was<br />
completed in 1965. The upstream slope of the earthen<br />
filled dam is protected by soil cement, and a 12-foot<br />
horizontal layer of topsoil and grass protects the downstream slope. Structural dam height is 126.2 feet, and<br />
the crest of the dam provides a roadway 30 feet wide. The spillway is an uncontrolled morning-glory inlet<br />
leading into a 9.5-foot circular conduit and stilling basin.<br />
TRIBUTARY INFLOW AND INUNDATION FAILURE FROM CHENEY DAM<br />
The river outlet works consist of an intake structure, an 11-foot-diameter conduit to the gate chamber<br />
containing two 6- by 7.5-foot high-pressure regulating gates and two 6- by 7.5-foot high-pressure emergency<br />
86
<strong>2010</strong>-<strong>2040</strong> <strong>HAZARDS</strong> <strong>ANALYSIS</strong> <strong>PLAN</strong><br />
gates. Downstream of the river outlet works gate chamber is a 15-foot-diameter flat bottom conduit and<br />
stilling basin. The municipal outlet works consists of a vertical intake structure with four 6-foot-square motor<br />
operated slide gates <strong>for</strong> selective withdrawal of water from elevations 1379.0, 1389.0, 1399.0, and 1409.0, a<br />
foot bridge, and a 6- by 8-foot emergency gate leading into an 8-foot-diameter circular conduit to the axis of<br />
the dam, at which point flows are carried by an 8-foot-diameter steel pipe in a 12.5-foot-diameter conduit.<br />
DOI BOR studies indicate that flooding caused by tributary inflow (similar to 100-year flooding conditions) of<br />
the Ninnescah River below the Cheney Dam would be swollen to approximately one mile in width to points<br />
just south of Cheney and up to 1-1/2 miles in width as it travels southward and eastward.<br />
Failure of the dam would cause an inundation of up to two miles from the Ninnescah River, passing along<br />
Cheney on the east and north of Viola. However, the southern half of the City of Clearwater would be<br />
inundated with flood waters 33 river miles from Cheney Dam in approximately 13 hours depending on soil<br />
conditions.<br />
9.7.2 LAKE AFTON PARK/KING DAM<br />
Lake Afton Park is owned and operated by <strong>Sedgwick</strong> <strong>County</strong> and occupies a 720-acre site and is located five<br />
(5) miles southwest of the city of Goddard. The park includes a 258-acre lake with construction starting in<br />
1939 and completed in 1942 by the federal Work Projects Administration (WPA). King Dam is located on the<br />
south end of the lake and crosses the main branch of the Clearwater Creek. The <strong>Sedgwick</strong> <strong>County</strong> Judge<br />
James V. Riddel Boy’s Ranch and sewage lagoon are located immediately SW of the dam nears the<br />
spillway. The earthen dam measures 4,037 feet across with a structural height of 55 feet (dam height 47<br />
feet) and a 400-foot spillway width. Hydraulic height is at 41 feet or six feet below dam height. Elevation of<br />
the spillway is 1,367 above mean sea level.<br />
AERIAL VIEW OF LAKE AFTON PARK KING DAM<br />
Maximum storage capacity is 6,146 acre-feet or 421,000 square yards with a drainage area of 6,579 square<br />
acres or approximately 10.3 square miles. The maps below show the 100-year flooding <strong>for</strong> Lake Afton and<br />
adjoining streams as well as failure of the dam.<br />
87
<strong>2010</strong>-<strong>2040</strong> <strong>HAZARDS</strong> <strong>ANALYSIS</strong> <strong>PLAN</strong><br />
Lake Afton Flood Inundation Map<br />
100-Year Flood<br />
Lake Afton Flood Inundation Map -<br />
Partial<br />
The topographic maps above generally show the approximate area affected from a 100-year flood event and<br />
a partial inundation due to failure of the dam. The impact area is estimated at 10.3 square miles and based<br />
on an elevation contouring of 1,350 feet above mean sea level, of 17 feet below spillway elevation.<br />
9.7.3 ANDALE WSD FRD NO. A-2 DAM<br />
Served by a tributary from Cowskin Creek, the dam is located southwest of the City of Andale and was<br />
constructed in 1963. Length of the earthen dam is 1,500 feet and 17.5 feet wide, with a spillway width of 144<br />
feet. Structural height is 24 feet with a hydraulic height of 21 feet. Maximum storage capacity is 407 acrefeet<br />
with a surface area of approximately ten acres. Inundation from a failure of the dam would affect an<br />
area approximately 0.8 of a square mile.<br />
ANDALE WSD FRD NO. A-2 DAM AND INUNDATION AREA<br />
88
<strong>2010</strong>-<strong>2040</strong> <strong>HAZARDS</strong> <strong>ANALYSIS</strong> <strong>PLAN</strong><br />
9.7.4 FAWN LAKE DAM (KANSAS #3774)<br />
Served by a tributary from East Branch Chisholm Creek, the dam was constructed in 1950 and is located in<br />
southwest Bel Aire near Harding and North 37 th Street. Length of the earthen dam is 430 feet and 13 feet<br />
wide. Structural height is 14 feet with a hydraulic height of 13 feet. Maximum storage capacity is 50 acrefeet.<br />
Inundation from a failure of the dam would affect an area approximately 0.3 of a square mile.<br />
9.7.5 WICHITA-VALLEY CENTER LOCAL PROTECTION PROJECT<br />
The floodway (aka Big Ditch) was authorized by Congress under the Flood Control Act (approved 22 June<br />
1936), Public Law 738, HR 8455; U.S. Army Corps of Engineers (USACE) Project Document HD 308<br />
―Wichita-Valley Center Flood Control Project.‖ Work was initiated by the USACE on May 8, 1950 and<br />
completed in March 1959, costing approximately $20 million and consisting of a protected area covering<br />
about 47,000 acres or about 73.4 square miles. The protected area consists of urban and rural lands, in and<br />
adjacent to the cities of Valley Center and Wichita, <strong>Kansas</strong>, against floods from the Little Arkansas River;<br />
Arkansas River; Big Slough; Cowskin Creek; and Chisholm Creek and its west, middle, and east branch<br />
tributaries.<br />
The project consisted of 97.3 miles of levees, 40.2 miles of toe drains with 68 relief wells, 40.9 miles of<br />
channels, 72 drainage structures through levees, and five (5) major pump stations. Runoff from the<br />
intercepted areas is contained in areas reserved <strong>for</strong> ponding. There are 32 major interior ponding areas that<br />
provide storage <strong>for</strong> the proper operation of the project. The required storage is based on a once in 25-year<br />
storm frequency, which is considered to furnish a reasonable degree of protection.<br />
1954 Levee Construction–SW Wichita 1956 Levee Construction–South Wichita<br />
The Wichita-Valley Center Flood Control Project also has a companion project, the West Branch Chisholm<br />
Creek Local Flood Protection Project. The flows of Chisholm Creek and its middle and west branch<br />
tributaries are collected by a system of levees and channels beginning about nine miles north of the Wichita<br />
and are diverted into the Arkansas River 2 miles northwest of Wichita.<br />
89
<strong>2010</strong>-<strong>2040</strong> <strong>HAZARDS</strong> <strong>ANALYSIS</strong> <strong>PLAN</strong><br />
Descriptive Data: The average height of the levees and the average depth of the channels are 9.5 feet.<br />
Length in Miles<br />
Item of Improvement Channel Levees<br />
Chisholm Creek Diversion 6.44 ---<br />
Middle Branch Extension .08 ---<br />
Middle Branch 2.08 ---<br />
West Branch 1.96 ---<br />
Subtotal 11.56 24.1<br />
Big Slough-Cowskin Floodway 17.21 34.1<br />
Arkansas River Training Levees 1.43 18.5<br />
Little Arkansas River Floodway 2.99 11.2<br />
East Branch Interception and Wichita<br />
Drainage Canal, Arkansas River 7.67 0.3<br />
Riverside Levees 8.5<br />
Total 40.86 97.3<br />
The combined flows of Chisholm Creek, the Little Arkansas River, and the Arkansas River, in excess of<br />
existing channel capacities, are diverted to the west of the city of Wichita by a leveed floodway. From there,<br />
the flows are diverted to the Arkansas River at a point south of Wichita by improved channels, levees, and<br />
canals along Big Slough and Cowskin Creek. Flood flows of the east branch of Chisholm Creek are diverted<br />
into the Wichita drainage canal, which extends through the eastern portion of the city of Wichita and<br />
confluences with the Arkansas River south of the city. The average height of the levees and the average<br />
depth of the channels are 9.5 feet.<br />
Although the USACE owns the floodway, there is 6,400 acres of land maintained annually by the City of<br />
Wichita Public Works Storm Water Utility and jointly funded by the City of Wichita and <strong>Sedgwick</strong> <strong>County</strong>.<br />
The USACE conducts annual visual inspections of the levees and provides its findings to the City of Wichita.<br />
Since construction of the floodway, the USACE estimates the project has prevented about $247 million in<br />
flood damages.<br />
Maintenance<br />
About $6.7 billion in property is protected by the Big Ditch, roughly from I-235 on the west to Hillside on the<br />
east. The protected area also includes Haysville. The Big Ditch is the first levee system in the country to<br />
undergo accreditation, part of stricter guidelines put in <strong>for</strong>ce since Hurricane Katrina decimated parts of New<br />
Orleans, where levees broke. The city and county missed a Feb. 2, 2009 deadline, to certify the levees that<br />
make up the Big Ditch. FEMA has started the decertification process and plans to draw new flood zone maps<br />
within the next two years. Consultants say four main areas within the flood control project can't be certified<br />
as effective without repairs: the Broadway Bridge between 49th and 50th streets North; a levee near 46th<br />
North and Salina; a levee near Washington and I-235; and a levee near 61st South and Madison. Repairs<br />
are needed because flood control standards are getting tougher to meet but also because the dirt levees are<br />
eroding in places due to tree roots. Engineers estimate that $7.7 million in work will need to be done within<br />
the next five years and another $8.4 million within the next 10 years. And $2.3 million in fencing is needed.<br />
Source: The Wichita Eagle<br />
9.7.6 COWSKIN CREEK LOCAL FLOOD PROTECTION PROJECT<br />
The Cowskin Creek Basin is located in the western part of Wichita, <strong>Kansas</strong>. This basin has sustained<br />
significant recurring flooding problems directly impacting residential areas. The November 1998 flood<br />
resulted in significant damage to about 200 homes and many businesses, some of which were damaged<br />
beyond 50 percent of their value. Under Section 205 of the Flood Control Act of 1948, as amended<br />
(Continuing Authority -- Flood Control), the joint City of Wichita and U.S. Army Corps of Engineer (USACE)<br />
project is currently in the final stages of development of the construction contract plans and specifications<br />
phase. The recommended plan of improvement would include channelization of a portion of Cowskin Creek<br />
with construction of an overbank area to convey the high flows during a flood event.<br />
90
<strong>2010</strong>-<strong>2040</strong> <strong>HAZARDS</strong> <strong>ANALYSIS</strong> <strong>PLAN</strong><br />
9.7.7 COWSKIN CREEK STORMWATER MASTER DRAINAGE <strong>PLAN</strong><br />
An evaluation by Black and Veatch in 2003 was conducted on the storm water drainage system within the<br />
122 square mile (78,000 acres) Cowskin Creek watershed. The watershed is generally bounded by 311 th<br />
Street West, 77 th Street North, 71 st Street West, and <strong>Kansas</strong> Highway 42 (K-42). Tributary confluences of<br />
the Cowskin Creek include: Dry Creek, Calfskin Creek, North Fork of the Calfskin Creek, Middle Fork of<br />
Calfskin Creek, and Westlink. There were 20 potential improvement projects identified to reduce the levels<br />
of flooding in the Cowskin Creek watershed. The projects consisted of a series of natural channel<br />
improvements, detention, diversion, individual structural improvements, and home buyouts.<br />
91
<strong>2010</strong>-<strong>2040</strong> <strong>HAZARDS</strong> <strong>ANALYSIS</strong> <strong>PLAN</strong><br />
9.8 DEFENSE INDUSTRIAL BASE SECTOR<br />
This sector supplies the military with the means to protect the nation by producing weapons, aircraft, and<br />
ships and providing essential services, including in<strong>for</strong>mation technology and supply and maintenance.<br />
Threats to this sector include cyber vulnerabilities. The following agencies are responsible <strong>for</strong> this sector:<br />
State: <strong>Kansas</strong> Adjutant General/<strong>Kansas</strong> National Guard<br />
Federal: Department of Defense/McConnell Air Force Base<br />
The Defense Industrial Base (DIB) Sector includes hundreds of thousands of domestic and <strong>for</strong>eign entities<br />
and subcontractors that per<strong>for</strong>m work <strong>for</strong> the Department of Defense (DOD) and other Federal departments<br />
and agencies. These entities research, develop, design, produce, deliver, and maintain military weapons<br />
systems, subsystems, components, or parts. Defense-related products and services provided by the DIB<br />
Sector equip, in<strong>for</strong>m, mobilize, deploy, and sustain <strong>for</strong>ces conducting military operations worldwide.<br />
The size and diversity of the sector results in an extraordinarily large and complex collection of industrial<br />
sites and operators across 15 subsectors and more than 90 segments governed by multiple regulations,<br />
laws, treaties, and precedents.<br />
The Defense Industrial Base Sector provides the products and services that are essential to mobilize and<br />
sustain the Nation's military operations. The sector includes companies per<strong>for</strong>ming under direct contract with<br />
the Department of Defense, its subcontractors, and companies providing materials and services. Unlike<br />
other sectors, the Defense Industrial Base is defined by the customer rather than by the goods and services<br />
themselves.<br />
The size and diversity of the sector results in an extraordinarily large and complex collection of industrial<br />
sites and operators who work within numerous subsectors and segments, which are governed by multiple<br />
regulations, laws, treaties, and precedents. The facilities that are included in this sector are very different<br />
from one another, so standardized risk assessments are not possible.<br />
While new high-tech security and programs are both complex and expensive, defense-related businesses<br />
place a great deal of emphasis on protecting their assets and functions. The sector has prioritized the need<br />
to share in<strong>for</strong>mation and develop assessment and security procedures that are implemented across the<br />
sector. Currently, there are no Defense Industrial Base entities based within Kingman <strong>County</strong>; there<strong>for</strong>e, this<br />
sector is not covered in this plan.<br />
The Defense Industrial Base Sector shares dependencies and interdependencies with other CIKR sectors,<br />
including: Communications, Critical Manufacturing, Energy, In<strong>for</strong>mation Technology, and Transportation<br />
Systems.<br />
MCCONNELL AIR FORCE BASE (AFB)<br />
McConnell's history began in October 1924, when Wichita hosted more than 100,000 people <strong>for</strong> the National<br />
Air Congress. The event was used by city planners to raise funds <strong>for</strong> a proposed Wichita Municipal Airport.<br />
The event was a success and ground-breaking ceremonies <strong>for</strong> the airport were held on Jun 28, 1929. In<br />
August 1941, the <strong>Kansas</strong> Air National Guard was activated as the first military unit assigned to the Wichita<br />
airport. Military presence at the airport consisted primarily of aircraft material and procurement operations<br />
until June 4, 1951 when the 3520th Combat Crew Training Wing was activated there to conduct B-47 combat<br />
crew training. The Air Force sought to make the airport a permanent military installation, and the city of<br />
Wichita was awarded $9.4 million to build a new airfield, later to become known as Mid-Continent Airport.<br />
The Wichita Municipal Airport changed its name to Wichita Air Force Base on May 15, 1953. The base was<br />
renamed McConnell Air Force Base on April 12, 1954 in honor of two of the three flying McConnell brothers<br />
of World War II. Air Training Command was host at the base from 1951 through 1958, when the Strategic<br />
Air Command took over.<br />
92
<strong>2010</strong>-<strong>2040</strong> <strong>HAZARDS</strong> <strong>ANALYSIS</strong> <strong>PLAN</strong><br />
Besides hosting bombers, McConnell spent a quarter<br />
century supporting 18 Titan II missile silos of the<br />
381st Strategic Missile Wing that were planted in the<br />
surrounding region. As with Titan II projects at Davis-<br />
Monthan, Arizona, and Little Rock, Arkansas, the<br />
construction at McConnell used a three-phase<br />
approach designed to cut down additional expenses<br />
caused by ―concurrency.‖ Using this approach, 18<br />
silos were constructed, <strong>for</strong>ming a rough horseshoe<br />
around Wichita with the open end pointing slightly to<br />
the west of north. Launcher locations <strong>for</strong> the 532nd<br />
Strategic Missile Squadron included Wellington (2),<br />
Conway Springs, Viola, Norwich, Rago, Murdock,<br />
Kingman, and Mount Vernon. The 533rd Strategic<br />
Missile Squadron would have responsibility <strong>for</strong> silos<br />
at Potwin, El Dorado, Leon (3), Smileyville, Rock, Winfield, and Ox<strong>for</strong>d. Additional support facilities were<br />
constructed on base<br />
From 1963 through 1972, McConnell served as a Tactical Air Command base with the 381st Strategic<br />
Missile Wing as its major tenant. TAC units operating at McConnell during this period included: the 388th<br />
Tactical Fighter Wing, flying F-105s. Host unit responsibilities again transferred to SAC on Dec. 1, 1972. At<br />
that time, the 384th Air Refueling Wing arrived at McConnell, including first the 91st Air Refueling Squadron,<br />
which began air refueling operations in June 1971, and later the 384th Air Refueling Squadron, which began<br />
its KC-135A operations in September 1973. McConnell's role in support of the nation's strategic defense<br />
continued. In June 1983, Air Force officials selected McConnell to be one of the future homes <strong>for</strong> the B-1B<br />
Lancer bomber.<br />
Meanwhile, the first KC-135R, a re-engined, quieter, more fuel-efficient version of the "Stratotanker," was<br />
received by the 384th Air Refueling Wing on July 1984. The 384th Air Refueling Wing became the host wing<br />
on June 5, 1985. By Aug. 5, 1985, McConnell became the only Air Force base to be equipped completely<br />
with R-model aircraft <strong>for</strong> its refueling operations. The 381st Strategic Missile Wing ended Titan II operations<br />
and was inactivated on August 8, 1986.<br />
The 384th Air Refueling Wing was re-designated as the 384th Bombardment Wing (Heavy) on July 1, 1987.<br />
The new wing became one of only four B-1B units in the Air Force with the arrival of its first Lancer bomber<br />
on Jan. 4, 1988.<br />
On April 26,1991, a tornado touched down on McConnell, leaving a trail of devastation as it traveled<br />
southwest to northeast across the base. Nine major facilities on the main base were totally destroyed,<br />
including the hospital and most of the base's Services facilities. The base housing complex lost 102 units in<br />
the storm and ten other facilities received minor damage. There were no deaths and only 16 injuries on base.<br />
This was attributed to advance warning from McConnell's weather <strong>for</strong>ecasters.<br />
In June 1992, the Air Force realigned SAC, TAC and Military Airlift Command into two-Air Combat Command<br />
and Air Mobility Command. McConnell's 384th Bombardment Wing was renamed the 384th Bomb Wing,<br />
and the unit assumed a conventional bombing role along with its strategic mission. In October 1993, the Air<br />
Force announced the 384th Bomb Wing would inactivate, become the 384th Bomb Group <strong>for</strong> 10 months<br />
beginning Jan. 1, 1994, and begin to transfer its conventional B-1B mission to the <strong>Kansas</strong> Air National Guard<br />
unit at McConnell, the 184th Fighter Group. This KSANG unit, which became the 184th Bomb Group on July<br />
1, 1994, is the first Air National Guard unit ever to be assigned a heavy bomber mission. In January 1994,<br />
AMC was assigned as McConnell's host major command. The 22nd Air Refueling Wing was announced as<br />
McConnell's new host unit, and the buildup of the wing's four KC-135R tanker squadrons began. By October<br />
1994, the 22nd became one of only three Air Force core tanker wings.<br />
93
<strong>2010</strong>-<strong>2040</strong> <strong>HAZARDS</strong> <strong>ANALYSIS</strong> <strong>PLAN</strong><br />
Today, the air base has about 3,500 military and civilian personnel and serves as<br />
home to Team McConnell. Team McConnell is primarily made up of the 22nd Air<br />
Refueling Wing (ARW), the 931st Air Reserve Group, and the <strong>Kansas</strong> Air National<br />
Guard's 184th Refueling Wing. The 22nd Air Refueling Wing, under Air Mobility<br />
Command, currently operates 48 KC-135 Stratotankers, supporting worldwide aerial<br />
refueling and airlift operations. This provides Global Reach <strong>for</strong> troops, equipment and<br />
supplies, and supports global contingency and conventional operations.<br />
94
<strong>2010</strong>-<strong>2040</strong> <strong>HAZARDS</strong> <strong>ANALYSIS</strong> <strong>PLAN</strong><br />
9.9 Emergency Services Sector<br />
This sector covers saving lives and property from accidents and disaster. This sector includes fire, rescue,<br />
emergency medical services, and law en<strong>for</strong>cement organizations. Threats to this sector include cyber and<br />
physical vulnerabilities. The following agencies are responsible <strong>for</strong> this sector:<br />
Local: Fire, Law En<strong>for</strong>cement, Emergency Medical Services, Emergency Management<br />
State: <strong>Kansas</strong> Division of Emergency Management/<strong>Kansas</strong> Highway Patrol, <strong>Kansas</strong> Fire Marshall<br />
Federal: Department of Homeland Security<br />
The Emergency Services Sector comprises the assets, systems, networks, and functions that are critical to<br />
maintain, protect, and preserve our safety and health in case of a natural or manmade disaster or terrorist<br />
incident. By protecting these elements, the sector is better able to support all critical infrastructure, essential<br />
governmental missions, and public services. These functions are vital to community security, public health<br />
and safety, economic vitality, and way of life.<br />
Through partnerships with public- and private-sector entities, this sector’s mission is to accomplish the<br />
following:<br />
Save lives;<br />
Protect property and the environment;<br />
Assist communities impacted by disasters (natural or manmade); and,<br />
Aid recovery from emergency situations.<br />
The Emergency Services Sector is a system of preparedness, response, and recovery that <strong>for</strong>ms a<br />
coordinated approach to preventing—and mitigating the effects of—natural and manmade disasters.<br />
Four distinct disciplines comprise this sector:<br />
Law En<strong>for</strong>cement<br />
Fire and Rescue Services<br />
Emergency Management<br />
Emergency Medical Services<br />
In addition, the sector includes specialized capabilities such as Explosive Ordnance Disposal, Special<br />
Weapons and Tactics and Tactical Operations, Hazardous Materials, Search and Rescue, Urban Search and<br />
Rescue, Public Safety Answering Points, and Public Works.<br />
The Emergency Services Sector collaborates with multiple infrastructure sectors that supply essential<br />
operational elements, including Communications, Energy, In<strong>for</strong>mation Technology, and Water. In addition,<br />
two sectors that support emergency responders are Healthcare and Public Health and Transportation<br />
Systems.<br />
9.9.1 LAW ENFORCEMENT<br />
Law En<strong>for</strong>cement Bureau<br />
9.9.1.1 SEDGWICK COUNTY SHERIFF OFFICE<br />
The Law En<strong>for</strong>cement Bureau of the <strong>Sedgwick</strong> <strong>County</strong> Sheriff’s Office encompasses the entire<br />
commissioned side of the Sheriff’s Office. The Law En<strong>for</strong>cement Bureau has four separate Divisions each<br />
with a unique responsibility.<br />
The Sheriff’s Patrol Division covers all 1,008 miles of <strong>Sedgwick</strong> <strong>County</strong> and responds to all calls <strong>for</strong> service<br />
from our citizens. The Patrol Division includes the Community Liaison Unit and the Community Policing Unit.<br />
The Community Liaison Unit’s prime responsibility is to deliver hundreds of hours of public safety programs<br />
95
<strong>2010</strong>-<strong>2040</strong> <strong>HAZARDS</strong> <strong>ANALYSIS</strong> <strong>PLAN</strong><br />
like D.A.R.E. to the public. The Community Policing Unit utilizes a problem solving model to address time<br />
intensive citizen problems that may have otherwise gone unaddressed.<br />
The Investigations Division is responsible <strong>for</strong> the investigation and case preparation of criminal cases that<br />
have been reported to the Sheriff’s Office. The division is comprised of detectives who work many varied<br />
tasks that include: <strong>for</strong>ensics laboratory, D.E.A. Task Force, Intelligence, Narcotics, E.M.C.U (Exploited and<br />
Missing Child Unit) A.T.F. Task Force and the F.B.I. Joint Terrorism Task Force.<br />
The Support Division is comprised of the Training Section, the Records Section and the Property and<br />
Evidence Section. The Training Section ensures ongoing recruitment, training and continuing education <strong>for</strong><br />
all Sheriff Office employees. The Training Section also supervises the Firearm/Range that is responsible <strong>for</strong><br />
all firearms training. Sheriff Records maintains all registration <strong>for</strong> sexual offenders within <strong>Sedgwick</strong> <strong>County</strong>,<br />
as well as all cases generated by Sheriff Deputies and all <strong>Sedgwick</strong> <strong>County</strong> Detention Facility records. The<br />
Property and Evidence Unit oversees the protection, disposal and distribution of all seized and collected<br />
property and assets.<br />
The Judicial Division is the fourth division in the bureau, and is vital to Courtroom Security <strong>for</strong> the 18th<br />
Judicial District Court. The deputies assigned to the Court docket ensure movement of inmates to and from<br />
the courts is done in a timely manner and without incident. Warrant deputies are in constant motion all over<br />
<strong>Sedgwick</strong> <strong>County</strong> obeying and serving the orders of the court. Extradition is accountable <strong>for</strong> transporting<br />
prisoners across the country as needed as well as within <strong>Kansas</strong>. The Civil Process Section is comprised of<br />
civilian personnel administering official procedure of court ordered documents.<br />
96
<strong>2010</strong>-<strong>2040</strong> <strong>HAZARDS</strong> <strong>ANALYSIS</strong> <strong>PLAN</strong><br />
Detention Bureau<br />
The Detention Bureau of the <strong>Sedgwick</strong> <strong>County</strong> Sheriff’s Office is composed of the operations and support<br />
divisions. Each has a vital role in the efficient operation of the detention facility. The Operations Division<br />
addresses the day-to-day work and concerns of housing over 1,500 inmates in a safe, secure and humane<br />
manner. The Support Division provides those necessary services to augment and support the Operations<br />
Division. Working in a modern pre-trial housing facility is a profession that requires a deep commitment to<br />
ensuring that all inmates in the Sheriff’s custody are provided with safe and humane treatment consistent<br />
with applicable standards, laws and community expectations. A commitment to public service is only the<br />
beginning. To become a detention deputy requires that one must first pass a rigorous background<br />
investigation, followed by eleven weeks of <strong>for</strong>mal academy instruction. This is then followed by a six-week<br />
Field Training program. Only then is a detention deputy ready to begin a career in which not everyone can<br />
succeed. While in custody, all inmates are provided with the essentials of human life; including<br />
medical/mental health care, nutritious meals, a clean environment and the opportunity <strong>for</strong> maintaining family<br />
and personal contacts. The Detention Bureau resembles the operation of a small city. This city operates a<br />
medical clinic, a school (GED classes), postal system (the opening and inspection of inmate mail), law<br />
en<strong>for</strong>cement (to maintain discipline) and a court system (when the inmate fails to follow the facility rules).<br />
Prison/Work Release Facilities<br />
<strong>Sedgwick</strong> <strong>County</strong> Adult Detention Facility: 1,119 prisoners (expandable)<br />
141 W. Elm<br />
Wichita, <strong>Kansas</strong><br />
Note: Prison composition is approximately 60% felon and 40% misdemeanor. There are currently<br />
no plans <strong>for</strong> evacuation of prisoners in the advent of a hazardous material incident.<br />
<strong>Sedgwick</strong> <strong>County</strong> Work Release Facility: 250 prisoners (maximum holding)<br />
401 S Emporia<br />
Wichita, <strong>Kansas</strong><br />
Note: Prison composition is 100% convicted felons under the <strong>Kansas</strong> Department of Corrections.<br />
There are currently plans <strong>for</strong> evacuation of prisoners in the advent of a hazardous material incident.<br />
Reserve Bureau<br />
The Reserve Bureau of the Sheriff’s Office worked a total of 4,000 volunteer hours in 2009. These hours<br />
were spent in patrol, warrants, investigations, tag en<strong>for</strong>cement, detention, training and special assignments.<br />
The hours worked by the Reserve are equivalent to over 4 full-time Sheriff’s deputies and have a value of<br />
nearly $200,000 <strong>for</strong> the citizens of <strong>Sedgwick</strong> <strong>County</strong>. The Reserve assisted the Sheriff’s Office, Wichita<br />
Police Department and the <strong>Kansas</strong> Highway Patrol on sobriety check lanes and saturation patrols. The<br />
Reserve also provided assistance to major warrants sweeps involving the Sheriff’s Office, Wichita Police and<br />
the Drug En<strong>for</strong>cement Agency. Special assignments included community fairs at Bel Aire, Cheney, Kechi,<br />
Valley Center, Mulvane; the McConnell Air Force Base Open House and numerous fund raisers including the<br />
KAKE Wichita Marathon, Link 4 Life Run, and the Mid-West Wine Fest.<br />
9.9.1.2 WICHITA POLICE DEPARTMENT<br />
WPD is the largest police department in the state of <strong>Kansas</strong>. It is comprised of 653 Commissioned Officers<br />
and 192 civilian employees, and operates on a $55 million yearly budget. The men and women of the<br />
Wichita Police Department proudly serve their Wichita community, which includes almost 400,000 citizens<br />
and covers 153 square miles. The department’s operations are divided into three divisions: Field Services,<br />
Investigations and Support Services. Most of the Investigations and Support Services operations are housed<br />
in City Hall at 455 N. Main. Field Services personnel operate from four substations that are strategically<br />
located in four quadrants of the city: North, South, East and West. Each substation is home to approximately<br />
130 commissioned and civilian employees including Beat Officers, Community Policing Beat Coordinators,<br />
School Resource Officers, Special Community Action Team Officers and Traffic Officers.<br />
97
<strong>2010</strong>-<strong>2040</strong> <strong>HAZARDS</strong> <strong>ANALYSIS</strong> <strong>PLAN</strong><br />
Investigations Division<br />
The Wichita Police Department's Investigations Division is comprised of four Bureaus; the Property Crimes<br />
Bureau, the Crimes Against Persons Bureau, the Special Investigations Bureau, and the Technical Services<br />
Bureau, which includes the Crime Lab Investigators (CSI). Personnel in these bureaus are responsible <strong>for</strong><br />
follow-up investigations of criminal cases. They work closely with victims, witnesses, citizens, and other law<br />
en<strong>for</strong>cement agencies to solve problems and crimes. In February of 1999 the Investigations Division<br />
underwent reorganization. Five specialized sections were created in the Property Crimes Bureau consisting<br />
of Robbery/Simple Assault, Burglary, Auto Theft, Larceny, and Financial Crimes. A Gang/Felony Assault<br />
unit was created within the Crimes Against Persons Bureau to coordinate and investigate all gang related<br />
crimes.<br />
Field Services Division<br />
The Wichita Police Department's Field Services Division is comprised of uni<strong>for</strong>med personnel and is<br />
organized into four bureaus. Each of the bureaus (Patrol North, Patrol South, Patrol East, and Patrol West)<br />
operates out of a patrol substation located in their assigned quadrants. This enables rapid response to<br />
emergency calls <strong>for</strong> services and provides easier citizen access to services. In addition each Patrol Bureau is<br />
responsible <strong>for</strong> delivering law en<strong>for</strong>cement services through the community policing philosophy.<br />
Also assigned to the Field Services Division are four SCAT units which are the en<strong>for</strong>cement teams of<br />
community policing. The Field Services Division has seven School Resource Officers assigned to area high<br />
schools to work as liaisons between the Board of Education and the Wichita Police Department.<br />
The latest moves toward community orientated policing has been a combined and concentrated ef<strong>for</strong>t<br />
between the neighborhoods, businesses and the police department to address the prostitution problem and<br />
to continue to increase the quality of life <strong>for</strong> our citizens. Plus the Wichita Police Department has partnered<br />
98
<strong>2010</strong>-<strong>2040</strong> <strong>HAZARDS</strong> <strong>ANALYSIS</strong> <strong>PLAN</strong><br />
up with the <strong>Kansas</strong> Department of Corrections and is taking an active role in the <strong>Sedgwick</strong> <strong>County</strong> Re-entry<br />
Program.<br />
Each of the bureaus, including their respective beats, are shown below and on the following pages.<br />
A six officer team is assigned to each of<br />
the ten patrol beats. They include four beat<br />
officers, one SCAT* officer and one officer<br />
serving as a community policing officer. The<br />
focus of the beat team is to assess the<br />
problems within the beat and work together<br />
with the community to develop and<br />
implement solutions to those problems.<br />
The East Bureau's Community Policing<br />
Officers are based out of the East<br />
Substation, the Towne East Square<br />
Shopping Mall located at 7700 E. Kellogg,<br />
and an Office Facility located at 4135 E.<br />
Harry. The community policing officer is<br />
responsible <strong>for</strong> collecting crime analysis and<br />
staffing in<strong>for</strong>mation and meeting with the<br />
patrol officers, neighborhood associations,<br />
community groups, and others in order to<br />
coordinate police services that are tailored to<br />
the unique needs of the beat.<br />
A six officer team is assigned to each of the ten<br />
patrol beats. They include four beat officers, one<br />
SCAT officer and one officer serving as a<br />
community policing officer. The focus of the beat<br />
team is to assess the problems within the beat<br />
and work together with the community to develop<br />
and implement solutions to those problems.<br />
The West Bureau's Community Policing Officers<br />
are based out of the West Substation and an<br />
office at 5803 W. Central. The community<br />
policing officer is responsible <strong>for</strong> collecting crime<br />
analysis and staffing in<strong>for</strong>mation and meeting<br />
with the patrol officers, neighborhood<br />
associations, community groups, and others in<br />
order to coordinate police services that are<br />
tailored to the unique needs of the beat.<br />
99
<strong>2010</strong>-<strong>2040</strong> <strong>HAZARDS</strong> <strong>ANALYSIS</strong> <strong>PLAN</strong><br />
*Community En<strong>for</strong>cement Unit / Special Community Action Team (SCAT<br />
A six officer team is assigned to each of<br />
the nine patrol beats. They include four<br />
beat officers, one SCAT officer and one<br />
officer serving as a community policing<br />
officer. The focus of the beat team is to<br />
assess the problems within the beat and<br />
work together with the community to<br />
develop and implement solutions to<br />
those problems.<br />
The North Bureau's Community Policing<br />
Officers are based out of the Atwater<br />
Neighborhood City Hall located at 2755<br />
E. 19th St. North and Evergreen<br />
Neighborhood City Hall located at 2700<br />
N. Woodland. The community-policing<br />
officer is responsible <strong>for</strong> collecting crime<br />
analysis and staffing in<strong>for</strong>mation and<br />
meeting with the patrol officers,<br />
neighborhood associations, community<br />
groups, and others in order to coordinate<br />
police services that are tailored to the<br />
unique needs of the beat.<br />
A six officer team is assigned to each of the nine patrol<br />
beats. They include four beat officers, one SCAT<br />
officer and one officer serving as a community policing<br />
officer. The focus of the beat team is to assess the<br />
problems within the beat and work together with the<br />
community to develop and implement solutions to<br />
those problems.<br />
The South Bureau's Community Policing Officers are<br />
based out of the South Substation located at 211 E.<br />
Pawnee. The community-policing officer is responsible<br />
<strong>for</strong> collecting crime analysis and staffing in<strong>for</strong>mation<br />
and meeting with the patrol officers, neighborhood<br />
associations, community groups, and others in order to<br />
coordinate police services that are tailored to the<br />
unique needs of the beat.<br />
100
<strong>2010</strong>-<strong>2040</strong> <strong>HAZARDS</strong> <strong>ANALYSIS</strong> <strong>PLAN</strong><br />
Support Services Division<br />
The Support Services Division provides services to the entire department as well as the community. The<br />
Division is made up of the Administrative Services Bureau, Records Bureau, Special Operations Bureau and<br />
the Training Bureau.<br />
The Special Operations Bureau overlooks many sections, including the Accident Follow-up Unit<br />
which investigates hit and run accidents, impaired driver violations and the charging of criminal cases. The<br />
Air Section, which serves as the full-time helicopter unit <strong>for</strong> the Police Department and the City of Wichita,<br />
and the Police Reserves also operate within the operational structure of the Bureau. In addition, four<br />
auxiliary units, the Mounted Unit, Special Weapons and Tactics Team (SWAT), Honor Guard and Explosive<br />
Ordnance Unit are assigned to Special Operations. The Administrative Services Bureau houses the<br />
In<strong>for</strong>mation Services Unit which collects and tracks crime data in the city. This web site and the statistical<br />
data is provided and maintained by this section.<br />
The Warrant Office works with Municipal Court and other local, state, and federal agencies to ensure that<br />
court documents are served in a timely manner.<br />
The Records Bureau is responsible <strong>for</strong> the entry of data and filing of incident reports and criminal cases. Our<br />
S.P.I.D.E.R. section, which stands <strong>for</strong> Special Police In<strong>for</strong>mation Data Entry and Retrieval, is operated within<br />
the Records Bureau and provides field officers and investigators in<strong>for</strong>mation through the National Crime<br />
In<strong>for</strong>mation Computer (N.C.I.C).<br />
The Training Bureau is responsible <strong>for</strong> recruiting, pre-employment screening and training of new officers as<br />
well as the continued training of veteran officers in such areas as firearms proficiency, use of <strong>for</strong>ce, and<br />
community relations.<br />
9.9.1.3 OTHER MUNICIPAL DEPARTMENTS<br />
The cities of Andale, Bel Aire, Bentley, Cheney, Clearwater, Colwich, Derby, Eastborough, Garden Plain,<br />
Goddard, Haysville, Kechi, Maize, Mount Hope, Mulvane, Park City, <strong>Sedgwick</strong>, and Valley Center each have<br />
police departments that per<strong>for</strong>m routine patrols of their respective jurisdictions. The city of Viola is patrolled<br />
by the <strong>Sedgwick</strong> <strong>County</strong> Sheriff Office.<br />
9.9.2 FIRE DEPARTMENTS<br />
<strong>Sedgwick</strong> <strong>County</strong> is comprised of three (3) paid departments, seven (7) in-county volunteer departments, two<br />
(2) supporting volunteer departments, and one (1) fire reserve unit.<br />
City of Wichita – The department started as a volunteer fire company on February 14, 1871 and established<br />
as a paid department 1886. It is comprised of 400 firefighters and staff covering a 154.7 square mile area<br />
from 18 fire stations and approximately 344,300 citizens. Firefighters respond to over 35,000 alarms each<br />
year, including 1,800 fires and almost 23,200 medical alarms. Wichita retains an ISO rating of 3.<br />
City of Derby – The department was established July 1, 2005 after more than 53 years as a volunteer<br />
service. It is comprised of 10 firefighters and staff, augmented by 34 volunteer firefighters, covering a 7.4<br />
square mile area from two (2) fire stations and almost 23,000 citizens. Firefighters respond to over 220 fire<br />
calls and almost 500 medical calls (2005) each year. The City of Derby has an ISO rating of 4.<br />
<strong>Sedgwick</strong> <strong>County</strong> Fire District #1 – Established in 1955, this department serves ten (10) cities, covering a<br />
response area of 657 square miles from eight fire stations and approximately 85,000 citizens. A total of 138<br />
firefighters and staff make an average of 511 fire and medical responses per month. The following<br />
Insurance Service Organization (ISO) ratings have been assigned: ISO 2 <strong>for</strong> Haysville, ISO 3 <strong>for</strong> Bel Aire<br />
and Andale; ISO 4 <strong>for</strong> Maize, Park City, Kechi, Goddard, and Garden Plain; ISO 5 <strong>for</strong> unincorporated areas<br />
within 5 miles of a fire station; and an ISO rating of 10 <strong>for</strong> all remaining areas.<br />
101
<strong>2010</strong>-<strong>2040</strong> <strong>HAZARDS</strong> <strong>ANALYSIS</strong> <strong>PLAN</strong><br />
Note:<br />
<strong>Sedgwick</strong> <strong>County</strong> and the City of Wichita fire departments have two jointly shared response<br />
teams: a Hazardous Materials (HazMat) Team equipped <strong>for</strong> regional response, and a<br />
SWAT Medic Team made up of fire paramedics.<br />
In-<strong>County</strong> volunteer fire departments in <strong>Sedgwick</strong> <strong>County</strong> include the cities of Valley Center, Bentley, Mt<br />
Hope, Cheney, Colwich, Clearwater, and Viola. Although portions of the cities of Mulvane and <strong>Sedgwick</strong> are<br />
located in <strong>Sedgwick</strong> <strong>County</strong>, each city has separate dispatch call centers and units are rarely dispatched by<br />
<strong>Sedgwick</strong> <strong>County</strong> Emergency Communications.<br />
Fire Reserve Unit: This unit is managed by <strong>Sedgwick</strong> <strong>County</strong> Emergency Management and averages about<br />
30 volunteers. It can be used independently or to assist the City of Wichita and <strong>Sedgwick</strong> <strong>County</strong> Fire<br />
Departments <strong>for</strong> fire and medical calls. Due to the level of training and experience, this unit has also<br />
developed into a hiring pool <strong>for</strong> the paid departments.<br />
9.9.3 SEDGWICK COUNTY EMERGENCY MANAGEMENT (SCEM)<br />
SCEM emphasizes planning, preparing, and coordinating local, state and federal governments’ ef<strong>for</strong>ts in<br />
dealing with all types of emergencies and hazards, natural or man-made, including Homeland Security,<br />
which might affect citizens of <strong>Sedgwick</strong> <strong>County</strong>. This preparation is necessary to improve the community’s<br />
overall coordination and ongoing preparedness. SCEM is the county’s liaison with State and Federal<br />
agencies responsible <strong>for</strong> emergency management, and responsible <strong>for</strong> bringing together all of the needed<br />
resources during times of crisis through utilizing all governmental, public and private organizations and<br />
agencies to accomplish the appropriate response to the needs of the community during times of crisis, and<br />
the recovery period afterwards. SCEM is expected to be the Chief of Staff, Coordinator and Advisor to the<br />
local officials be<strong>for</strong>e, during, and following disaster emergencies. In this role, SCEM brings awareness of<br />
potential, as well as existing problems, and suggests solutions based on the needs of a community and<br />
available resources. During times of crisis the Emergency Manager keeps local officials apprised of<br />
situations in order <strong>for</strong> them to make the best decisions possible <strong>for</strong> response and recovery issues.<br />
102
<strong>2010</strong>-<strong>2040</strong> <strong>HAZARDS</strong> <strong>ANALYSIS</strong> <strong>PLAN</strong><br />
SCEM is the first line of contact with the State during times of crisis. The Emergency Manager is charged<br />
with requesting additional resources at the State level based upon the situation. Local disaster declarations<br />
are submitted to the Chair of the Board of <strong>County</strong> Commissioners whenever it has been determined that<br />
resources will exceeded what is available, and to provide mutual aid as needed to expedite the response and<br />
recovery from the disaster or emergency and submitted to the State. The <strong>Sedgwick</strong> <strong>County</strong> Emergency<br />
Operations Center (EOC), which may temporarily serve as the seat of government during times of<br />
disasters/emergencies, is activated whenever an emergency or disaster occurs and warrants the need <strong>for</strong><br />
multiple local public agencies to interface with field operations under the Incident Commander(s). In the<br />
event of a large scale disaster, the EOC may act as part of a multi-agency coordinating system (MACS) with<br />
state and federal agencies. Amateur radio capabilities from Radio Amateur Civil Emergency Service<br />
(RACES) volunteers provide additional communications capability apart from other analog or digital systems.<br />
9.9.4 SEDGWICK COUNTY EMERGENCY MEDICAL SERVICE (SCEMS)<br />
<strong>Sedgwick</strong> <strong>County</strong> Emergency Medical Service (EMS) is the primary agency responsible <strong>for</strong> the pre-hospital<br />
care and transportation of persons who become acutely ill or injured and are in need of ambulance transport<br />
to a hospital using Advanced Life Support ambulances. Additionally <strong>Sedgwick</strong> <strong>County</strong> EMS provides<br />
scheduled ambulance transportation services <strong>for</strong> persons who require routine transfer by ambulance based<br />
on a medical necessity.<br />
<strong>Sedgwick</strong> <strong>County</strong> EMS serves a population of approximately 477,000 in a geographic area of approximately<br />
1000 square miles. There are 18 frontline ambulances in the EMS fleet that are stationed at 15 post locations<br />
throughout the <strong>County</strong> that are either owned in whole or shared with another agency. In 2008, <strong>Sedgwick</strong><br />
<strong>County</strong> EMS responded to 47,226 calls <strong>for</strong> service. In addition to full-time and part-time staff, the Department<br />
receives first responder support from Volunteer Emergency Medical Technicians in Derby, and Valley Center<br />
and the Wichita and <strong>Sedgwick</strong> <strong>County</strong> Fire Departments.<br />
103
<strong>2010</strong>-<strong>2040</strong> <strong>HAZARDS</strong> <strong>ANALYSIS</strong> <strong>PLAN</strong><br />
<strong>Sedgwick</strong> <strong>County</strong> EMS is a regional Basic Life Support Training Center <strong>for</strong> the American Heart Association<br />
and paramedics offer Cardio-Pulmonary Resuscitation (CPR) classes <strong>for</strong> the community. EMS has also been<br />
proactive in the community to enhance the public's knowledge and understanding of services. In addition to<br />
CPR classes, <strong>Sedgwick</strong> <strong>County</strong> EMS frequently participates in programming in local schools. One of the<br />
most popular programs includes EMS paramedics visiting classrooms to educate children on accessing the<br />
emergency system, demonstrating EMS equipment used during service, and a tour of the ambulance. This<br />
program is designed to make them more familiar with EMS should they ever need to access the system. In<br />
addition to these programs, safety belt and child safety seats are a part of EMS injury prevention ef<strong>for</strong>ts.<br />
EMS staff promotes proper usage during school programs and community events.<br />
104
<strong>2010</strong>-<strong>2040</strong> <strong>HAZARDS</strong> <strong>ANALYSIS</strong> <strong>PLAN</strong><br />
9.10 ENERGY SECTOR<br />
This sector provides the electric power used by all sectors, including critical infrastructures, and the refining,<br />
storage, and distribution of oil and gas. The sector is divided into electricity and oil and natural gas. Threats<br />
to this sector include cyber and physical vulnerabilities. The following agencies are responsible <strong>for</strong> this<br />
sector:<br />
Local: Public and Private Utilities, Petrochemical Companies<br />
State: <strong>Kansas</strong> Division of Emergency Management/<strong>Kansas</strong> Highway Patrol, <strong>Kansas</strong> Fire Marshall<br />
Federal: Department of Energy<br />
The Energy Sector consists of thousands of geographically dispersed electricity, oil, and natural gas assets<br />
that are connected by systems and networks. Without a stable energy supply, health and welfare is<br />
threatened and the economy of the United States cannot function.<br />
The energy infrastructure is divided into three interrelated segments:<br />
Electricity<br />
Petroleum<br />
Natural gas<br />
The energy sector is composed of several interrelated subsectors including: electricity, petroleum, and<br />
natural gas. Each of these segments are comprised of their own production and distribution systems, over<br />
85% of which are privately owned and operated.<br />
All CIKR sectors are dependent on the Energy Sector <strong>for</strong> electricity to light and operate homes, offices, and<br />
factories and on petroleum products to transport goods to and from their facilities. Many sectors are also<br />
dependent on natural gas <strong>for</strong> heating and/or product processing.<br />
Significant interdependencies exist with the Chemical and Transportation Systems Sectors that provide<br />
critical assets and services to the production and distribution of energy. However, due to the ubiquitous use<br />
of energy, the Energy Sector shares other dependencies and interdependencies with all other CIKR sectors,<br />
including: Emergency Services, Water, Dams, Communications, Banking and Finance, and Government<br />
Facilities.<br />
9.10.1 ELECTRICAL DISTRIBUTION SYSTEM<br />
There are five electric companies that service <strong>Sedgwick</strong> <strong>County</strong>: Butler Rural Cooperative Association,<br />
<strong>Sedgwick</strong> <strong>County</strong> Cooperative Association, Sumner-Cowley Electric Cooperative, Black Hills Energy, and<br />
Westar Energy. There is also one municipal operated electric plant operated and maintained by the City of<br />
Mulvane. Westar Energy supplies non-cooperative electric through the following plants and respective<br />
megawatts (MW): Gordon Evans Energy Center (845MW), Murray Gill Energy Center (317MW), and Wolf<br />
Creek Nuclear Generating Station in Coffey <strong>County</strong> (548MW). Fuel sources are coal (62%), natural gas –<br />
fueled oil (28%), and nuclear (10%). The following map shows the coverage areas of the electric companies:<br />
105
<strong>2010</strong>-<strong>2040</strong> <strong>HAZARDS</strong> <strong>ANALYSIS</strong> <strong>PLAN</strong><br />
ELECTRIC COMPANY COVERAGE AREAS IN SEDGWICK COUNTY<br />
As shown in the map above, <strong>Sedgwick</strong> <strong>County</strong> is supplied by electrical power from two power stations: Lang<br />
Substation in Lyon <strong>County</strong>, and Wolf Creek Nuclear Generating Substation in Coffey <strong>County</strong>. There are two<br />
primary substations in <strong>Sedgwick</strong> <strong>County</strong> that steps down electrical services <strong>for</strong> consumers: Benton<br />
Substation near 143 rd Street East and K-254, and Gordon Evans Generating Power Plant/Substation.<br />
The Cheney substation supplies power to the Cheney reservoir pump station and is the sole line of supply of<br />
electricity. The Cheney pump station has 5-4,000 volt (135 amp) 1,000 HP pumps electronically controlled<br />
by the filter plant in Wichita (manual controls are on site). There are currently no backup generators <strong>for</strong><br />
emergency power at the Cheney pump station in the advent of power loss. Three substations service the<br />
Wichita water (Hess) pump station, and two substations service the Wichita well field.<br />
9.10.1.1 SOUTHWEST POWER POOL (SPP)<br />
SPP is regulated by the Federal Energy Regulatory Commission (FERC). SPP was approved as a FERC<br />
Regional Transmission Organization (RTO) in 2004. SPP is a founding member of the North American<br />
Electric Reliability Council (NERC). SPP became a NERC Regional Entity in 2007, which gives the<br />
responsibility of en<strong>for</strong>cing reliability standards <strong>for</strong> users, owners, and operators of the bulk power system in<br />
the SPP footprint.<br />
106
<strong>2010</strong>-<strong>2040</strong> <strong>HAZARDS</strong> <strong>ANALYSIS</strong> <strong>PLAN</strong><br />
This NERC map shows the other NERC Regional Entities and the three electric interconnections. (Nebraska<br />
is not included as part of the SPP region on this map, because SPP’s Nebraska members are part of the<br />
MRO Regional Entity, not the SPP Regional Entity. Nebraska is part of the SPP Regional Transmission<br />
Organization.)<br />
The SPP Regional Transmission Organization manages the power grid in all or part of eight states; and also<br />
have a member in Mississippi. SPP also serves as the Independent Coordinator of Transmission (ICT) <strong>for</strong><br />
Entergy on a contract basis.<br />
107
<strong>2010</strong>-<strong>2040</strong> <strong>HAZARDS</strong> <strong>ANALYSIS</strong> <strong>PLAN</strong><br />
Note: These statistics are <strong>for</strong> the RTO footprint; the map depicts transmission <strong>for</strong> both the<br />
RTO and ICT (Entergy) footprints.<br />
108
<strong>2010</strong>-<strong>2040</strong> <strong>HAZARDS</strong> <strong>ANALYSIS</strong> <strong>PLAN</strong><br />
Note: As the map above shows, <strong>Kansas</strong> has both fossil and wind generating resources.<br />
Note: Proposed transmission expansions into the year 2030.<br />
109
<strong>2010</strong>-<strong>2040</strong> <strong>HAZARDS</strong> <strong>ANALYSIS</strong> <strong>PLAN</strong><br />
Current Priority Projects <strong>for</strong> <strong>Kansas</strong><br />
Mid-<strong>Kansas</strong> Electric Company and Sunflower Electric Power Corporation to construct 55 miles 345<br />
kV double circuit transmission line from Spearville to Comanche <strong>County</strong> in southwest <strong>Kansas</strong><br />
Mid-<strong>Kansas</strong> Electric Company to construct 55 miles of double circuit 345 kV transmission line from<br />
Comanche <strong>County</strong> to Medicine Lodge in southwest <strong>Kansas</strong><br />
Mid-<strong>Kansas</strong> Electric Company and Westar Energy to construct 75 miles double circuit 345 kV<br />
transmission line from Medicine Lodge to Wichita in south <strong>Kansas</strong><br />
Mid-<strong>Kansas</strong> Electric Company and Oklahoma Gas and Electric Company to construct 108 miles of<br />
double circuit 345 kV transmission line from Medicine Lodge to Woodward EHV in northwest<br />
Oklahoma and southwest <strong>Kansas</strong><br />
110
<strong>2010</strong>-<strong>2040</strong> <strong>HAZARDS</strong> <strong>ANALYSIS</strong> <strong>PLAN</strong><br />
SPP completed the first phase of the new ITP process: the first ITP 20-Year Assessment (ITP20). The <strong>2010</strong><br />
ITP20 identified grid upgrades projected to be needed by 2030 to accommodate possible future scenarios<br />
and provide a strong transmission grid. The <strong>2010</strong> ITP20 Plan consists of 1,494 miles of 345 kV lines and<br />
eleven 345 kV step-down trans<strong>for</strong>mers.<br />
FUTURE TRENDS<br />
It is <strong>for</strong>ecasted that the demand <strong>for</strong> electricity in the United States will grow at an average rate of 1.57%<br />
annually <strong>for</strong> the next decade, with growth <strong>for</strong> the SPP region averaging 1.16% annually. 33<br />
There is more potential wind energy in the footprint than SPP could absorb. We have over 28,000 MW of<br />
wind in-service and under development in the RTO generation interconnection queue, waiting to be added to<br />
the grid. Compare this to SPP’s <strong>2010</strong> system peak on the hottest summer day of ~53,000 MW. Projections in<br />
33 * NERC 2009 Long-Term Reliability Assessment 2009-2018<br />
111
<strong>2010</strong>-<strong>2040</strong> <strong>HAZARDS</strong> <strong>ANALYSIS</strong> <strong>PLAN</strong><br />
the National Renewable Energy Lab/Department of Energy’s Eastern Wind Integration and Transmission<br />
Study (EWITS) <strong>for</strong>ecasts 60 – 95 GW of wind development in SPP.<br />
Some states in the SPP footprint have passed standards requiring a certain amount of electricity to come<br />
from renewable sources by a deadline. If the federal government passed a renewable standard, the need<br />
would increase <strong>for</strong> the SPP region to export wind energy to other parts of the country. For <strong>Kansas</strong>, the<br />
standards project a 10% increase <strong>for</strong> 2011, a 15% increase by 2016, and a 20% increase by 2020.<br />
Note: Wind energy in service as of January 2011.<br />
112
<strong>2010</strong>-<strong>2040</strong> <strong>HAZARDS</strong> <strong>ANALYSIS</strong> <strong>PLAN</strong><br />
Note: Projected projects <strong>for</strong> wind generating locations<br />
9.10.1.2 WESTAR ENERGY<br />
Westar Energy is an investor-owned part of the Southwest Power Pool (SPP) and has approximately 687,000<br />
residential, commercial and industrial customers of which 220,826 customers are in <strong>Sedgwick</strong> <strong>County</strong>.<br />
Susceptible Concerns<br />
Electrical service enters <strong>Sedgwick</strong> <strong>County</strong> via Westar<br />
Energy’s 345,000-volt overhead power lines in<br />
northeast and southwest portions of the <strong>County</strong>. The<br />
electricity is supplied from two power stations: Lang<br />
Substation in Lyon <strong>County</strong>, and Wolf Creek Nuclear<br />
Generating Substation in Coffey <strong>County</strong>.<br />
These transmission lines intersect Benton Substation<br />
(143 rd Street East and K-254), and Gordon Evans<br />
Generating Power Plant/Substation prior to having<br />
electrical power stepped down <strong>for</strong> electrical services<br />
to consumers.<br />
There are six mid-sized 138,000-volt service<br />
substations encircling the City of Wichita that supply<br />
electrical power to 43 smaller consumer oriented<br />
64,000-volt substations.<br />
Although the majority of 64,000-volt substations service block sections of the City of Wichita, several of the<br />
substations are only dedicated to one customer (i.e. Cheney reservoir pump station, OxyChem, and<br />
McConnell Air Force Base). Typically, power can be restored to affected portions of the city within several<br />
hours according to Westar Energy. Critical facilities such as hospitals have back-up emergency generators;<br />
however, health care facilities and child/day care facilities typically do not.<br />
113
<strong>2010</strong>-<strong>2040</strong> <strong>HAZARDS</strong> <strong>ANALYSIS</strong> <strong>PLAN</strong><br />
The dedicated substations are not connected on a ―grid‖ system and could be disrupted <strong>for</strong> days or longer.<br />
Water supply from the Cheney reservoir pump station would be disrupted since there is currently no backup<br />
generators <strong>for</strong> emergency power at the Cheney pump station in the advent of power loss. Both OxyChem<br />
and McConnell Air Force base would be dependent on back-up generators until electrical power could be<br />
restored. One of the additional concerns <strong>for</strong> power loss in the community would be potential mechanical<br />
failure in industrial facilities.<br />
9.10.1.3 BUTLER RURAL ELECTRIC COOPERATIVE (BUTLER REC)<br />
Butler REC supply’s electric power to 7,000 meters through 1,850 miles of transmission and distribution lines<br />
and own 13 substations or delivery points. Through membership in <strong>Kansas</strong> Electric Power Cooperative, they<br />
own part of the nuclear generating facility at Wolf Creek. This also allows access to power grids, enabling the<br />
purchase of hydro-power, the least expensive power available, from the Southwest Power Pool. Butler REC<br />
provides electric power to residential, commercial and industrial accounts in portions of Butler, Chase,<br />
Cowley, Greenwood, Harvey, Marion, and <strong>Sedgwick</strong> counties.<br />
9.10.1.4 SEDGWICK COUNTY COOPERATIVE ASSOCIATION<br />
The <strong>Sedgwick</strong> <strong>County</strong> Electric Cooperative Association, Inc. has 17 employees, 5,061 services, over 4,200<br />
members, approximately 1,090 miles of energized lines, six substations, and over 95 million kWh sold yearly.<br />
9.10.1.5 SUMNER-COWLEY ELECTRIC COOPERATIVE<br />
Sumner-Cowley currently provides electric service to rural areas in all of Sumner country, half of Cowley<br />
<strong>County</strong>, and areas of Harper, <strong>Sedgwick</strong> and Kingman counties. The service area encompasses<br />
approximately 2,500 square miles, with approximately 4,300 meters and nearly 2,000 miles of line.<br />
Headquartered in Wellington, Sumner-Cowley is one of 27 distribution electric cooperatives serving<br />
consumer members in the state of <strong>Kansas</strong><br />
114
<strong>2010</strong>-<strong>2040</strong> <strong>HAZARDS</strong> <strong>ANALYSIS</strong> <strong>PLAN</strong><br />
9.10.2 PETROLEUM DISTRIBUTION SYSTEM<br />
The following map shows petroleum and natural gas transmission pipelines in <strong>Sedgwick</strong> <strong>County</strong>.<br />
Transmission pipelines move products from the production area or refinery to outlets such as bulk storage<br />
terminals or loading facilities. Local distribution systems may also transport liquid petroleum and natural gas.<br />
Liquid petroleum distribution systems transport product from the bulk storage facility by rail car or tank trucks.<br />
Local natural gas distribution companies (LDCs) use pipelines to move natural gas from a city gate or town<br />
border station to distribution systems. Local distribution systems transport natural gas through mains that<br />
are usually located along or under city streets to service lines that connect to homes and businesses.<br />
Gathering pipelines link the production areas to central collection points.<br />
PIPELINES IN SEDGWICK COUNTY<br />
COFFEYVILLE RESOURCES CRUDE TRANSPORTATION, LLC<br />
Coffeyville Resources Refining & Marketing, LLC, the heart of CVR Energy's petroleum business, operates<br />
an 115,000 barrel per day highly sophisticated oil refinery located in Coffeyville, Kan. The refinery is a<br />
catalytic cracking/delayed coking refinery that processes moderately heavy, medium sulfur crude oil from a<br />
broad array of domestic and international sources and predominantly produces clean transportation products<br />
such as gasoline, diesel fuels, and propane. Of the refinery's approximate 115,000 barrel per day<br />
requirement <strong>for</strong> crude oil, about 75 percent is purchased from international and domestic crude oil suppliers,<br />
and the balance is sourced by Coffeyville Resources Crude Transportation, LLC through its 35,000 barrel per<br />
day crude oil gathering system serving <strong>Kansas</strong>, northern Oklahoma, western Missouri and southwest<br />
Nebraska. With field offices in Bartlesville, Okla., and Plainville and Winfield, Kan., the gathering system is<br />
comprised of over 300 miles of pipelines and associated tankage and truck transportation facilities.<br />
115
<strong>2010</strong>-<strong>2040</strong> <strong>HAZARDS</strong> <strong>ANALYSIS</strong> <strong>PLAN</strong><br />
CONOCOPHILLIPS PIPE LINE COMPANY (CPPL)<br />
CPPL operates more than 12,000 miles of pipeline and more than 80 storage terminals in the United States.<br />
CPPL transports both raw and finished refined products, including crude oil, propane, and refined products<br />
such as gasoline, diesel and jet fuel. Motor fuels are stored in terminals were tanker trucks pick them up <strong>for</strong><br />
delivery to local retail outlets. CPPL operates approximately 900 miles of pipeline throughout the state of<br />
<strong>Kansas</strong>. These various pipelines transport refined petroleum products to various terminals and storage<br />
facilities within <strong>Kansas</strong>. CPPL’s refined product pipelines deliver to terminals located in Oklahoma, Texas,<br />
<strong>Kansas</strong>, Missouri, Indiana, and Illinois.<br />
JAYHAWK PIPELINE, LLC<br />
Jayhawk is owned by the National Cooperative Refinery Association (NCRA) in McPherson, <strong>Kansas</strong>, and<br />
transports approximately 135,000 barrels per day of crude oil in both intrastate and interstate commerce.<br />
Jayhawk connects all of the major crude oil pipelines in 22 <strong>Kansas</strong> counties and operates 850 miles of<br />
gathering and trunk lines in the states of <strong>Kansas</strong>, Nebraska, Oklahoma, and Texas.<br />
MAGELLAN MIDSTREAM PARTNERS, LP<br />
Magellan operates a hazardous liquid transmission pipeline consisting of low-sulfur No. 2 fuel oil and<br />
unleaded gasoline through <strong>Sedgwick</strong> <strong>County</strong> along with a terminal at 1120 S Meridian Avenue in Valley<br />
Center.<br />
NATIONAL COOPERATIVE REFINERY ASSOCIATION (NCRA)<br />
Headquartered in McPherson, NCRA is an inter-regional petroleum cooperative owned by three regional<br />
cooperatives distributing products manufactured by NCRA. NCRA owns an underground petroleum storage<br />
installation at Conway just west of McPherson and a crude oil trucking fleet of approximately 65 transports<br />
which operate in western <strong>Kansas</strong>. NCRA, which operated in six (6) <strong>Kansas</strong> counties, also owns 100% of<br />
Jayhawk Pipeline LLC, 66% of Kaw Pipe Line Company, and 50% of Osage Pipe Line LLC. Products<br />
produced include: gasoline, fuel oil #1 and #2, diesel fuel, butane, and propane.<br />
NUSTAR PIPELINE OPERATING PARTNERSHIP LP<br />
NuStar Pipeline is a subsidiary of NuStar Energy LP based in San Antonio, Texas with 9,063 miles of<br />
pipelines, 86 terminal facilities, four (4) crude oil storage tank facilities, and two (2) asphalt refineries. The<br />
Central East Region, which is a subsidiary of NuStar Pipeline Operating Partnership, transports refined<br />
petroleum products, including gasoline, diesel, and propane in the Midwest. The system includes 2,530<br />
miles or pipelines that transport an average of 203,000 barrels per day and 21 distribution terminals with a<br />
storage capacity of 4.8 million barrels. Storage facilities located at McPherson and El Dorado have a storage<br />
capacity of approximately 1.1 million barrels.<br />
ONEOK NORTH SYSTEM LLC<br />
ONEOK North System is a 1,600-mile interstate common carrier pipeline system with facilities to transport,<br />
store and deliver a full range of NGL products to include: refined motor fuels, ethane, propane, butanes, and<br />
natural gasoline in 20 south/north central and northeast <strong>Kansas</strong> counties.<br />
SEMCRUDE, L.P.<br />
SemCrude purchases crude oil and condensates from independent producers and operators as well as<br />
aggregators and independent refiners located in Colorado, <strong>Kansas</strong> and Oklahoma. Specifically, SemCrude<br />
gathers, transports and stores crude oil and condensates from North America’s Gulf Coast, Central Energy<br />
Corridor to Canada. The crude oil and condensate is transported via tank trucks and pipelines to third party<br />
pipelines as well as to the Cushing, Oklahoma interchange.<br />
116
<strong>2010</strong>-<strong>2040</strong> <strong>HAZARDS</strong> <strong>ANALYSIS</strong> <strong>PLAN</strong><br />
9.10.3 NATURAL GAS DISTRIBUTION SYSTEM<br />
BLACK HILLS ENERGY<br />
Black Hills Corporation serves 750,000 utility customers<br />
in Colorado, Iowa, <strong>Kansas</strong>, Montana, Nebraska, South<br />
Dakota, and Wyoming. Black Hills Energy, a division of<br />
Black Hills Corporation, serves 107,000 natural gas<br />
customers in 54 <strong>Kansas</strong> communities. The company’s<br />
non-regulated businesses generate wholesale<br />
electricity, produce natural gas, oil and coal, and market<br />
energy. Black Hills operates in 21 counties in<br />
southwest (towns) and south central (transmission)<br />
<strong>Kansas</strong>.<br />
ENTERPRISE PRODUCTS OPERATING, LLC<br />
Enterprise Products transports natural gas, natural gas liquids, petrochemicals, and crude oil through 32,000<br />
miles of onshore and offshore pipelines. The Mid-America Pipeline system operates approximately 2,068<br />
miles of pipelines ranging in diameter from four (4) to 12 inches throughout 34 counties in the State of<br />
<strong>Kansas</strong>. Products include: iso-butane, naptha, normal butane, natural gasoline, propane, Y-grade<br />
(demethanized mix) ethane propane mix (E/P), natural gas, unleaded gasoline, and diesel fuel.<br />
HAWKERBEECH GAS STORAGE<br />
According to 2009 Department of Energy reporting, the <strong>for</strong>mer Stanlaker North Derby Underground Gas<br />
Storage reservoir has a working gas capacity of 50,785 Mcf, total field capacity of 1,050,000 million cubic<br />
feet (Mcf), and a maximum daily delivery of 750 Mcf through a transmission pipeline to the HawkerBeech<br />
plant on Webb Road in East Wichita.<br />
KANSAS GAS SERVICE (KGS)<br />
KGS is a division of ONEOK, Inc, provides clean, safe, and reliable natural gas to more than 647,000<br />
residential, commercial and industrial customers across the state of <strong>Kansas</strong>. Natural gas is delivered to the<br />
company’s distribution systems from transmission lines, some of which are owned by KGS, at operating<br />
pressures typically between 150 pounds per square inch (psig) and 1,000 psig. Natural gas is then delivered<br />
through distribution pipelines that generally operate at 60 psig or less. KGS maintains, operates, and<br />
monitors approximately 19,075 miles of transmission, distribution and service pipelines.<br />
MID-CONTINENT MARKET CENTER, L.L.C. (MCMC)<br />
MCMC is a 194-mile intrastate pipeline system primarily located in Kingman, <strong>Sedgwick</strong> and Butler counties<br />
in south central <strong>Kansas</strong>. MCMC offers both intrastate and NGPA 311 transportation services. Major sources<br />
of gas supply <strong>for</strong> MCMC are the ONEOK Field Services Company’s Cheney plant, Pioneer Resources’<br />
Spivey plant, Panhandle Eastern Pipeline Company and Southern Star Central Gas Pipeline, Inc. pipeline<br />
interconnects. Markets served include several Wichita, <strong>Kansas</strong>-area industrial customers and distribution<br />
customers. The pipeline operates between 500 and 600 psig. MCMC has two mainline compressor stations,<br />
Haysville and Colwich, with a combined total 8,000 horsepower. MCMC has three storage facilities: Brehm,<br />
Konold and Yaggy. Brehm Storage has 1,989 Bcf of working capacity, 1,230 horsepower of compression and<br />
the ability to deliver up to 35 MMcf per day and inject up to 20 MMcf per day. Konold Storage has 0.7 Bcf of<br />
working capacity, 720 horsepower of compression and the ability to deliver and inject up to 10 MMcf per day.<br />
Yaggy Storage is currently removed from service<br />
117
<strong>2010</strong>-<strong>2040</strong> <strong>HAZARDS</strong> <strong>ANALYSIS</strong> <strong>PLAN</strong><br />
ONEOK FIELD SERVICES COMPANY, LLC<br />
ONEOK, Inc., an Oklahoma corporation, is a diversified energy company involved in natural gas processing,<br />
gathering, storage and transmission in the Mid-Continent areas of the United States. The company’s<br />
gathering and processing segment gathers and processes natural gas, and fractionates natural gas liquids<br />
through its subsidiary, ONEOK Field Services Company.<br />
Specifically, ONEOK Field Services Company has a processing capacity of approximately 2.0 Bcf/d with<br />
approximately 13,800 miles of gathering pipelines that supply the gas processing plants. The gas<br />
processing operation primarily includes the extraction of mixed natural gas liquids from natural gas, and their<br />
fractionation (separation) into component products (ethane, propane, iso-butane, normal butane and natural<br />
gasoline). The component products are used by and sold to diverse customer base of end users <strong>for</strong><br />
petrochemical feedstock, residential uses, and blending into motor oils.<br />
The gathering operation connects unaffiliated and affiliated producing wells to the processing plants. It<br />
consists of the gathering of natural gas through pipeline systems, including compression, treatment, and<br />
dehydration services. In <strong>Kansas</strong>, ONEOK Field Services operates approximately 6,000 miles of pipeline,<br />
5,400 gas wells, 3 processing plants, and 215,000 horsepower of natural gas compression.<br />
ONEOK NGL PIPELINE, LLC<br />
ONEOK NGL Pipeline, L.L.C., operates approximately 1,800 miles of pipelines through the state of <strong>Kansas</strong><br />
that gather and transport products known as Natural Gas Liquids (NGL). These products, at any given time,<br />
can be a varied mixture of NGL, LPG (Liquid Petroleum Gas) or HVL (Highly Volatile Liquids). They are a<br />
mixture consisting of ethane, propane, butane, natural gasoline, ethane-propane mixture, and propylene.<br />
The <strong>Kansas</strong> pipeline system gathers raw NGL and transports the products to a fractionation and storage<br />
facility in Med<strong>for</strong>d (Oklahoma), Hutchinson and Bushton (<strong>Kansas</strong>). Once the products have been<br />
fractionated, they are distributed to areas in Central <strong>Kansas</strong> and Gulf Coast markets. This system consists<br />
of pipelines ranging from 3 inches to 16 inches in diameter.<br />
QUEST PIPELINES (KPC), L.P.<br />
Quest Pipelines (KPC) owns and operates a 1,120-mile interstate gas pipeline which transports natural gas<br />
from Oklahoma and Western <strong>Kansas</strong> to the metropolitan Wichita and <strong>Kansas</strong> City markets. Further, it is one<br />
of the only three pipeline system currently capable of delivering gas into the <strong>Kansas</strong> City metropolitan<br />
market. The KPC system includes three compressor stations with a total of 14,680 horsepower and has a<br />
capacity of approximately 160 Mmcf/day. KPC has supply interconnections with the Transok, Panhandle<br />
Eastern and ANR pipeline systems, allowing distribution from the Anadarko and Arkoma basins, as well as<br />
the western <strong>Kansas</strong> and Oklahoma panhandle producing regions. KPC’s two primary customers are <strong>Kansas</strong><br />
Gas Service (KGS) and Missouri Gas Energy (MGE), both of which are served under long-term natural gas<br />
transportation contracts. KGS, a division of ONEOK, Inc. is the local distribution company in <strong>Kansas</strong> <strong>for</strong><br />
<strong>Kansas</strong> City and Wichita as well as a number of other municipalities; while MGE, a division of Southern<br />
Union Company, is a natural gas distribution company that serves over a 500,000 customers in 155 western<br />
Missouri communities.<br />
SOUTHERN STAR CENTRAL GAS PIPELINE, INC<br />
Headquartered in Owensboro, Kentucky, Southern Star is a natural gas transmission system spanning over<br />
6,000 miles in the Midwest and Mid-Continent regions of the United States. Transmission lines cross 66<br />
counties throughout <strong>Kansas</strong> into adjacent states.<br />
118
<strong>2010</strong>-<strong>2040</strong> <strong>HAZARDS</strong> <strong>ANALYSIS</strong> <strong>PLAN</strong><br />
9.11 GOVERNMENT FACILITIES SECTOR<br />
This sector ensures security and freedom and administers key public functions. Threats to this sector<br />
include cyber, natural (related to cyber) and physical vulnerabilities. The following agencies are responsible<br />
<strong>for</strong> this sector:<br />
Local: Public and Private Utilities, Petrochemical Companies<br />
State: <strong>Kansas</strong> Division of Emergency Management/<strong>Kansas</strong> Highway Patrol, <strong>Kansas</strong> Fire Marshall<br />
Federal: Department of Homeland Security<br />
The Government Facilities Sector includes facilities owned or leased by all levels of government domestically<br />
or overseas. Many of these facilities are open to the public, such as courthouses, educational facilities,<br />
libraries, and archives. Other facilities not open to the public contain highly sensitive in<strong>for</strong>mation, materials,<br />
processes, and equipment, such as military installations, embassies, and research facilities. These facilities<br />
are differentiated from other CIKR sectors because they are uniquely governmental.<br />
The Government Facilities Sector ensures the safety and security of governmental facilities owned or leased<br />
by all levels of government domestically or overseas. Many government facilities are open to the public <strong>for</strong><br />
business activities, commercial transactions, or recreational activities. Other facilities are not open to the<br />
public because they contain highly sensitive in<strong>for</strong>mation, materials, processes, and equipment.<br />
The sector also includes the Education Facilities Subsector, which covers prekindergarten through 12th<br />
grade (preK-12) schools, institutions of higher education, and business and trade schools. This subsector<br />
includes both government-owned facilities and facilities owned by private-sector entities, so it faces some<br />
unique challenges.<br />
In addition to physical structures, the sector considers cyber elements that contribute to the protection of<br />
sector assets, such as access control systems and closed-circuit television systems, and individuals who<br />
possess tactical, operational, or strategic knowledge or per<strong>for</strong>m essential functions.<br />
Government facilities face a range of natural and human-caused threats. These facilities are attractive<br />
targets <strong>for</strong> terrorist groups and criminals because they provide unique services, per<strong>for</strong>m sensitive functions,<br />
and have significant symbolic value.<br />
The Government Facilities Sector shares dependencies and interdependencies with all other CIKR sectors,<br />
including but not limited to the Communications, Energy, In<strong>for</strong>mation Technology, and Water. The Education<br />
Facilities Subsector shares dependencies and interdependencies with the following sectors: Agriculture and<br />
Food, Chemical, Commercial Facilities, Emergency Services, and Transportation Systems.<br />
School Districts<br />
119
<strong>2010</strong>-<strong>2040</strong> <strong>HAZARDS</strong> <strong>ANALYSIS</strong> <strong>PLAN</strong><br />
A total of 155 public and private schools (to include technical trade, colleges and universities) governed by<br />
the <strong>Kansas</strong> Board of Education were identified and are shown on the following page.<br />
EDUCATIONAL INSTITUTIONS IN SEDGWICK COUNTY<br />
The following table shows a breakdown of school attendance <strong>for</strong> the school year <strong>2010</strong>-2011:<br />
<strong>2010</strong>-2011 ENROLLMENT<br />
PUBLIC SCHOOL DISTRICTS IN SEDGWICK COUNTY<br />
USD<br />
K-12 Special Special Ed Non- 4-Year Old<br />
Grades Ed 3 & 4 yr Graded At-Risk<br />
Pre-K Totals<br />
259 47,401 0 398 33 1,947 9 49,788<br />
260 6,577 0 91 41 44 0 6,753<br />
261 4,948 0 83 86 150 0 5,267<br />
262 2,562 0 22 71 36 0 2,691<br />
263 1,828 0 46 0 31 35 1,940<br />
264 1,184 0 12 95 11 21 1,323<br />
265 5,059 0 50 13 59 0 5,181<br />
266 6,543 0 57 0 36 0 6,636<br />
267 1,973 0 12 0 0 0 1,985<br />
268 784 0 4 0 20 5 813<br />
Totals 78,859 0 775 339 2,334 70 82,377<br />
PRIVATE ACCREDITED SCHOOL DISTRICTS<br />
No. of K-12 Special Special Ed Non- 4-Year Old<br />
Districts Grades Ed 3 & 4 yr Graded At-Risk<br />
Pre-K Totals<br />
5 10,114 0 0 0 0 60 10,174<br />
120
<strong>2010</strong>-<strong>2040</strong> <strong>HAZARDS</strong> <strong>ANALYSIS</strong> <strong>PLAN</strong><br />
EDUCATIONAL INSTITUTION BREAKDOWN<br />
Colleges and Universities<br />
Newman University: 2,000 (Average)<br />
Wichita State University: 15,049<br />
Friends University: 3,247<br />
College and University Satellite Locations<br />
Southwestern College, <strong>2040</strong> S Rock Rd<br />
Southwestern College, 7011 W Central Avenue<br />
Southwestern College, McConnell AFB<br />
Cowley College – Aviation Tech Center, 7603 E Pawnee<br />
Cowley College Southside Education Center, 4501 E 47th S<br />
Baker University, 3450 N Rock Rd<br />
Butler <strong>County</strong> Community College<br />
Embry-Riddle Aeronautical University, 2801 S Rock Rd<br />
Tabor College, 7348 W 21 st Street<br />
University of Phoenix, 3020 N Cypress Dr<br />
Vatterott College, 3639 N Comotara<br />
Webster University, McConnell AFB<br />
Webster University, 53474 Lawrence Court<br />
Word of Life Institute and Bible College, 3811 N Meridian<br />
Industrial Technical and Trade Schools<br />
AGC Construction Training Center, 8201 E 34 th N<br />
Carpenters Apprentice Training Center, 1225 W Carey Ln<br />
Center <strong>for</strong> Financial Training, 150 N Main Street<br />
Electrical Joint Apprenticeship and Training Cmte, 810 W 13 th Street<br />
Job Corps MTC/Flint Hills, 402 E 2 nd Street<br />
Joint Apprenticeship Committee Inc, 1330 E 1 st Street<br />
KANSEL, 334 N Topeka, Suite 103<br />
Letizia’s College Art of Dress Design, 1502 S Hillside<br />
Norris Training Systems, 400 N Woodlawn<br />
There are three major universities within <strong>Sedgwick</strong> <strong>County</strong>: Wichita State University, Friends University, and<br />
Newman University.<br />
WSU has an enrollment, as of <strong>2010</strong>, of 14,806 students, of which approximately 4,500 are part-time<br />
students. Furthermore, according to the university’s website, only eight percent of undergraduate students<br />
live on-campus. This suggests that most of the student body is commuting to class by personal vehicle or<br />
public transportation. Parking at Wichita State is primarily focused around the northern end of the campus.<br />
These spaces are also around the major sports facilities on campus, such as Koch Arena and Eck Stadium.<br />
Parking is restricted <strong>for</strong> commuters when the basketball or baseball team has a game. Currently, Koch Arena<br />
has a capacity of 10,506, which routinely sells out games. Eck Stadium has a capacity of 7,851.<br />
Friends University is located between Kellogg and Maple Streets east of Meridian Avenue. The West Maple<br />
route serving the university on the northern edge of campus is one of the most travelled routes in the system,<br />
according to Wichita Transit. This is due to route being the only service to the west side of Wichita. Again,<br />
this bus runs on the hour. Friends has a markedly smaller enrollment than WSU, 2,800 students spread over<br />
multiple campuses across <strong>Kansas</strong>, and a higher proportion of undergraduate students live on-campus. Some<br />
of these students at other campuses and in Wichita are non-traditional continuing learners of whom Friends<br />
counts in the official total student enrollment. (Source: Friends University)<br />
121
<strong>2010</strong>-<strong>2040</strong> <strong>HAZARDS</strong> <strong>ANALYSIS</strong> <strong>PLAN</strong><br />
Newman University is located south of Kellogg and west of Southwest Blvd. The enrollment is 2,746 and all<br />
students with a junior status or younger are required to live on campus in student housing, however, an exact<br />
number of students living on campus is unknown.<br />
A total of 155 public and private schools (to include technical trade, colleges, and universities) in 20 school<br />
districts governed by the <strong>Kansas</strong> Board of Education were identified in <strong>Sedgwick</strong> <strong>County</strong>. Of these, 54<br />
schools or 36% of all schools were found to be within ½-half mile of a major roadway, pipeline, or railroad<br />
track right-of-way. Since the total attendance of children and staff <strong>for</strong> the county was shown to be 102,431,<br />
approximately 23,306 children are located within one-half mile of a major roadway, pipeline, or railroad track<br />
right-of-way.<br />
122
<strong>2010</strong>-<strong>2040</strong> <strong>HAZARDS</strong> <strong>ANALYSIS</strong> <strong>PLAN</strong><br />
9.12 HEALTHCARE AND PUBLIC HEALTH SECTOR<br />
This sector mitigates the risk of disasters and attacks and also provides recovery assistance if an attack<br />
occurs. The sector consists of health departments, clinics, and hospitals. Threats to this sector include<br />
physical vulnerabilities. The following agencies are responsible <strong>for</strong> this sector:<br />
Local: Public and Private Utilities, Petrochemical Companies<br />
State: <strong>Kansas</strong> Division of Emergency Management/<strong>Kansas</strong> Highway Patrol, <strong>Kansas</strong> Fire Marshall<br />
Federal: Department of Health and Human Services<br />
The systems, networks, services, facilities, functions, and roles needed to prevent disease and disability,<br />
treat patients, foster public health, and respond to public health emergencies span all levels of government<br />
and the private sector, and touch every citizen of the United States.<br />
Ensuring a resilient healthcare and public health system capable of withstanding disruption and poised to<br />
protect lives and health during emergencies is vital <strong>for</strong> people’s safety and security.<br />
The Healthcare and Public Health Sector provides a full array of goods and services, including acute hospital<br />
and ambulatory healthcare, public health, laboratories, blood banks, mass fatality management,<br />
insurers/payors, and medical supply manufacturing and distribution.<br />
Private-sector as well as Federal, State, territorial, tribal, and local agencies provide healthcare and public<br />
health services, and participate in ongoing surveillance and detection of potential threats from bioterrorism<br />
and other manmade and natural threats.<br />
The Healthcare and Public Health Sector shares dependencies and interdependencies with other CIKR<br />
sectors, including: Agriculture and Food, Chemical, Communications, Emergency Services, Energy,<br />
In<strong>for</strong>mation Technology, Postal and Shipping, Transportation Systems, and Water.<br />
The following in<strong>for</strong>mation was obtained from the Via Christi Health September 1, 2009 Assessment Report<br />
on the Wichita MSA Market.<br />
Commercial Insurance Coverage<br />
The top three commercial insurance companies <strong>for</strong> the Wichita MSA market include Blue Cross Blue Shield<br />
of <strong>Kansas</strong> (BCBS) with 55 percent of the enrollees, Preferred Health System (PHS) with 30-35 percent and<br />
Coventry Health Care of <strong>Kansas</strong> with 5-10 percent.<br />
Insurance programs assisting with the medical fragile or low-income adults include the <strong>Kansas</strong> Health<br />
Insurance Association’s high risk pool program, Medicaid, <strong>Kansas</strong> HealthWave 21, and MediKan. Statewide,<br />
the uninsured population represents nearly 15 percent of the under 65 year old population according to the<br />
U.S. Census. The MSA uninsured breakouts are Butler <strong>County</strong> at 11.7 percent, Harvey <strong>County</strong> at 12.4<br />
percent, <strong>Sedgwick</strong> <strong>County</strong> at 10.9 percent and Sumner <strong>County</strong> at 12.0 percent.<br />
Infrastructure – In<strong>for</strong>mation System<br />
There are nine safety net clinics which offer low income residents medical homes. These include: Center <strong>for</strong><br />
Health and Wellness, E.C. Tyree Medical and Dental Clinic, Guadalupe Clinic, Good Samaritan Clinic and<br />
Health Ministry, GraceMed, healthy Options <strong>for</strong> <strong>Kansas</strong> Communities in Plainview, Hunter Health Clinic, Via<br />
Christi Family Medicine Residency Program, and Wichita Family Practice Residency Program.<br />
Infrastructure - Providers<br />
According to the Dartmouth Atlas, the Wichita market has fewer physicians in all areas with the exception of<br />
Family Practice when compared to national averages. The national average <strong>for</strong> physicians per 100,000<br />
residents is nearly 202, Wichita has 159.<br />
Infrastructure – Hospitals & Others<br />
There are ten hospitals within the Wichita/Newton area alone.<br />
123
<strong>2010</strong>-<strong>2040</strong> <strong>HAZARDS</strong> <strong>ANALYSIS</strong> <strong>PLAN</strong><br />
There are three inpatient or residential addiction programs in the service area; however, outpatient addiction<br />
services <strong>for</strong> the uninsured are critically low.<br />
COMCARE is the primary community health care provider <strong>for</strong> the <strong>Sedgwick</strong> <strong>County</strong> area <strong>for</strong> the uninsured.<br />
They have multiple locations serving an average of 4,500 people a month and approximately 1,000 of them<br />
are uninsured. COMCARE will see most everyone except those who are uncooperative and dangerous.<br />
Inpatient mental health services <strong>for</strong> children under the age of ten are non-existent in Wichita and the<br />
surrounding counties. There are four inpatient mental health facilities serving teens and adults.<br />
Dental Care<br />
There are approximately 220 dentists in the Wichita area. <strong>Kansas</strong> has only one dentist <strong>for</strong> every 2,557<br />
residents; the national average is 1:1,650. Dental care <strong>for</strong> the uninsured population is highly limited <strong>for</strong><br />
adults.<br />
CHILD/DAY CARE, MEDICAL, AND HEALTH CARE LOCATIONS<br />
The map shown above shows the locations of child/day care facilities, medical facilities, and health care<br />
facilities classified as vulnerable sites. Health care facilities include assisted living, hospices, nursing<br />
facilities, adult day care, boarding care homes, and home plus providers. Breakouts of facilities are shown<br />
below:<br />
Child/Day Care Facilities: A total of 80 child/day care facilities have been identified with an average of 45<br />
children per day care facility <strong>for</strong> an estimated total of 3,600 children. This number does not include<br />
in<strong>for</strong>mation on all non-licensed or in-home day care facilities not readily available.<br />
124
<strong>2010</strong>-<strong>2040</strong> <strong>HAZARDS</strong> <strong>ANALYSIS</strong> <strong>PLAN</strong><br />
Hospitals<br />
Licensed hospital in<strong>for</strong>mation provided by the KDHE <strong>for</strong> <strong>Sedgwick</strong> <strong>County</strong> includes the following:<br />
5 General Hospitals<br />
1,433 Licensed Acute Beds<br />
576 Non-State of <strong>Kansas</strong> Licensed Beds<br />
81 Authorized Beds<br />
51 Licensed Bassinets<br />
Licensed Medical/Health Care Facilities:<br />
‣ 2 Adult Day Care Facilities: 88 Beds<br />
‣ 15 Assisted Living Facilities: 836 Beds<br />
‣ 3 Boarding Care Homes: 17 Beds<br />
‣ General Acute/Special Hospitals: 2,393 Beds (176 Long Term Care Unit Beds)<br />
‣ 17 Home Plus Providers: 76 Beds<br />
‣ 5 Hospices<br />
‣ 1 Intermediate Care <strong>for</strong> Mentally Retarded Facility: 93 Rooms<br />
‣ 24 Nursing Facilities: 2,258 Beds<br />
‣ 5 Residential Health Care Facilities: 197 Beds<br />
A total of 80 <strong>Kansas</strong> Department of Health and Environment (KDHE) licensed child and day care facilities<br />
have been identified in <strong>Sedgwick</strong> <strong>County</strong> with an average of 45 children per day care facility <strong>for</strong> a estimated<br />
total of 3,600 children. Of these, 30 facilities have been identified within ½-mile of a pipeline or railroad track<br />
right-of-way. This number does not include in<strong>for</strong>mation on all non-licensed or in-home day care facilities not<br />
readily available.<br />
Health Care Providers<br />
A detailed listing of licensed health care provider in<strong>for</strong>mation provided by the KDHE and Environment <strong>for</strong><br />
<strong>Sedgwick</strong> <strong>County</strong> is summarized below:<br />
10 Nursing Facilities<br />
787 Licensed Nursing Facility Beds<br />
25 Licensed Residential Health Care Facility Beds<br />
5 Home Plus Facilities<br />
27 Licensed Home Plus Beds<br />
4 <strong>Kansas</strong> Hospices<br />
2 <strong>Kansas</strong> Assisted Living Facilities<br />
95 Licensed Assisted Living Facility Beds<br />
1 Rehabilitation Agency<br />
3 Ambulatory Surgical Centers<br />
1 Residential Health Care Facility<br />
HEALTH CARE FACILITIES/PROVIDERS IN SEDGWICK COUNTY<br />
Name Address City Tot Num Beds<br />
ABAL HOME INC 2506 ANGEL ST WICHITA 3<br />
ALTERRA CLARE BRIDGE OF WICHITA 9191 EAST 21ST STREET N WICHITA 40<br />
ALTERRA STERLING HOUSE OF DERBY 1709 E WALNUT GROVE DERBY 34<br />
ARBOR HOME - FARMSTEAD 1940 FARMSTEAD WICHITA 6<br />
ARBOR HOME - MARJORIE 6311 E MARJORIE WICHITA 8<br />
ARBOR HOME - ROCKWOOD 6807 E ROCKWOOD WICHITA 8<br />
ARBOR HOME - SIEFKIN 1909 SIEFKIN WICHITA 7<br />
BETHEL HOUSE 1316 CHARLOTTE WICHITA 8<br />
125
<strong>2010</strong>-<strong>2040</strong> <strong>HAZARDS</strong> <strong>ANALYSIS</strong> <strong>PLAN</strong><br />
Name Address City Tot Num Beds<br />
BETHEL HOUSE 2 6522 E BEACHY WICHITA 6<br />
CARING HEARTS FOR SENIOR LIVING 1229 S BYRON WICHITA 6<br />
CARRINGTON HOUSE CENTRAL 1432 N WACO STREET WICHITA 60<br />
CATHOLIC CARE CENTER 6700 E 45TH ST N BELAIRE 298<br />
CATHOLIC CHARITIES ADULT DAY SERVIC 5920 W CENTRAL WICHITA 90<br />
CHAUCER ESTATES LLC 10550 E 21ST ST NORTH WICHITA 90<br />
CHENEY GOLDEN AGE HOME 724 N JEFFERSON PO BOX 370 CHENEY 60<br />
CHERRY CREEK VILLAGE RETIREMENT CTR 8200 E PAWNEE WICHITA 110<br />
CLEARWATER RETIREMENT COMMUNITY INC 620 E WOOD ST CLEARWATER 64<br />
COLLEGE HILL NURSING & REHAB CENTER 5005 E 21ST ST N WICHITA 96<br />
COMFORT CARE HOMES #219 219 SOUTH MORNINGSIDE WICHITA 11<br />
COMFORT CARE HOMES INC #1434 1434 N ARMOUR WICHITA 8<br />
COMFORT CARE HOMES INC #147 147 SOUTH RIDGEWOOD WICHITA 6<br />
COMFORT CARE HOMES INC #441 441 S MORNINGSIDE ST WICHITA 6<br />
COMFORT CARE HOMES INC #509 509 N TALLYRAND WICHITA 6<br />
COMFORT CARE HOMES INC #641 641 N BROADMOOR WICHITA 6<br />
COMFORT CARE HOMES INC #6504 6504 ONEIDA WICHITA 6<br />
COMFORT CARE HOMES INC #6505 6505 E 10TH WICHITA 6<br />
CORNERSTONE ASSISTED LIVING INC 1240 N BROADMOOR AVE WICHITA 40<br />
3636 NORTH RIDGE RD BLDG<br />
CORNERSTONE RIDGE PLAZA<br />
#400 WICHITA 72<br />
CRC - THE VILLAGE 440 N FOURTH CLEARWATER 40<br />
DESERET NURSING & REHABILITATION AT<br />
WICHITA 1600 S WOODLAWN WICHITA 93<br />
GEORGETOWN VILLAGE INC 1655 GEORGETOWN ST WICHITA 80<br />
GOLDEN LIVINGCENTER - WICHITA 4007 E LINCOLN ST WICHITA 59<br />
HARBOR HOME A 434 N FOURTH ST CLEARWATER 8<br />
HARBOR HOME B 434 N FOURTH ST CLEARWATER 8<br />
HAYSVILLE HEALTHCARE CENTER 215 N LAMAR AVE HAYSVILLE 119<br />
HOMESTEAD HEALTH CENTER 2133 S ELIZABETH ST WICHITA 80<br />
KANSAS MASONIC HOME 401 S SENECA ST WICHITA 120<br />
KENNETH L CALDWELL ASSISTED LIVING MANOR 400 S MARTINSON WICHITA 60<br />
LAKEPOINT ASSISTED LIVING AT CRESTVIEW 600 NORTH 127TH ST EAST WICHITA 48<br />
LAKEPOINT RETIREMENT & REHAB CTR OF<br />
WICHITA 1315 N WEST ST WICHITA 196<br />
LAKEWOOD SENIOR LIVING OF SEVILLE 1319 SEVILLE ST WICHITA 100<br />
LARKSFIELD PLACE 2828 N GOVERNEOUR ST WICHITA 90<br />
LIFE CARE CENTER OF WICHITA 622 N EDGEMOOR ST WICHITA 120<br />
MANORCARE HEALTH SERVICES 7101 E 21ST ST N WICHITA 119<br />
MARY MARTIN'S RETIREMENT 1418 PLEASANTVIEW DR WICHITA 5<br />
MEADOWLARK ADULT CARE HOME 1 438 S SOCORA WICHITA 6<br />
MEADOWLARK ADULT CARE HOME 2 254 S ROBIN RD WICHITA 8<br />
MEADOWLARK ADULT CARE HOME 3 11216 W MAPLE WICHITA 6<br />
MEADOWLARK ADULT CARE HOME 4 1425 LEECREST WICHITA 8<br />
MEADOWLARK ADULT CARE HOME 5 8101 WEST MAPLE WICHITA 5<br />
MEDICALODGE OF GODDARD 501 EASY ST GODDARD 85<br />
MEDICALODGE OF WICHITA 2280 S MINNEAPOLIS WICHITA 73<br />
MERIDIAN NURSING & REHABILITATION CENTER 1555 N MERIDIAN ST WICHITA 106<br />
MOTHERS & OTHERS INC 234 S ANNA WICHITA 8<br />
MOUNT HOPE NURSING CENTER 704 E MAIN ST MOUNT HOPE 50<br />
PARK WEST PLAZA 515 N MAIZE RD WICHITA 118<br />
REFLECTION LIVING OF HIDDEN LAKES LLC 550 CIRCLE LAKE WICHITA 8<br />
126
<strong>2010</strong>-<strong>2040</strong> <strong>HAZARDS</strong> <strong>ANALYSIS</strong> <strong>PLAN</strong><br />
Name Address City Tot Num Beds<br />
REFLECTION LIVING, LLC 1377 N IROQUOIS RD WICHITA 8<br />
REFLECTIONS AT PARK WEST PLAZA 515 N MAIZE RD WICHITA 8<br />
REFLECTIONS RESIDENTIAL CARE 1201 N PINECREST WICHITA 5<br />
RIVERSIDE VILLAGE INC 777 N MCLEAN BLVD WICHITA 95<br />
SANDPIPER BAY HEALTH CARE CENTER LLC 5808 W 8TH ST N WICHITA 152<br />
SEDGWICK PLAZA 2455 N WOODLAWN ST WICHITA 35<br />
SUNFLOWER MEADOWS #1 649 N STRATFORD WICHITA 5<br />
SUNFLOWER MEADOWS #2 5502 POLO WICHITA 8<br />
THE HOMESTEAD OF WICHITA 12221 W MAPLE WICHITA 48<br />
THE STERLING HOUSE OF TALLGRASS 8600 E 21ST NORTH WICHITA 34<br />
VIA CHRISTI HEALTHCARE OUTREACH PROGRAM 2622 W CENTRAL WICHITA 0<br />
VIA CHRISTI HOPE HEALTH CENTER 2622 W CENTRAL WICHITA 24<br />
VINTAGE PLACE OF DERBY 1701 E WALNUT GROVE RD DERBY 36<br />
WATERFRONT INN ASSISTED LIVING LLC 900 N BAYSHORE DR WICHITA 40<br />
WELLINGTON ACADEMY INC HOME PLUS 1411 N ERIE WICHITA 4<br />
WESTVIEW OF DERBY 445 N WESTVIEW ST DERBY 120<br />
WICHITA NURSING CENTER 2840 S HILLSIDE ST WICHITA 66<br />
WICHITA PRESBYTERIAN MANOR 4700 W 13TH ST N WICHITA 91<br />
WICHITA SPECIALTY HOSPITAL LTCU 8080 E PAWNEE WICHITA 86<br />
KDHE AND KANSAS DEPARTMENT ON AGENCY (KDOA) FACILITY LOCATIONS<br />
127
<strong>2010</strong>-<strong>2040</strong> <strong>HAZARDS</strong> <strong>ANALYSIS</strong> <strong>PLAN</strong><br />
Public Transportation Services<br />
ABC Taxi<br />
Medicaid Provider<br />
Service Area: <strong>Sedgwick</strong> <strong>County</strong><br />
Always There Senior Care<br />
Service Area: <strong>Sedgwick</strong> <strong>County</strong><br />
American Cab<br />
Medicaid Provider<br />
Service Area: <strong>Sedgwick</strong> <strong>County</strong><br />
American Red Cross<br />
(Medical) - Medical <strong>for</strong> ages 50 and over only<br />
FTA or KDOT Funded<br />
Service Area: Wichita, Haysville, Derby, Valley Center,<br />
Newton, Park City<br />
American Red Cross<br />
(Nutrition Sites - For ages 60 and over only)<br />
Wheelchair Accessible<br />
Service Area: Wichita, Haysville, Derby, Valley Center,<br />
Newton, Park City<br />
Best Cab<br />
Service Area: <strong>Sedgwick</strong> <strong>County</strong><br />
Service Hours: 24 hours a day, 7 days a week<br />
Butler <strong>County</strong> Department on Aging<br />
Wheelchair Accessible, FTA or KDOT Funded<br />
Service Area: Butler <strong>County</strong><br />
Coach Transportation<br />
Medicaid only<br />
Medicaid Provider<br />
Service Area: Wichita<br />
Com<strong>for</strong>t Care Transportation<br />
Wheelchair Accessible, Medicaid Provider<br />
Service Area: United States<br />
Derby Dash<br />
Wheelchair Accessible, FTA or KDOT Funded<br />
Service Area: Derby<br />
First Class Transportation<br />
Medicaid Only<br />
Medicaid Funded<br />
Service Area: <strong>Kansas</strong><br />
GED Specialized Transportation<br />
Wheelchair Accessible<br />
Service Area: <strong>Kansas</strong><br />
Gordon Transportation<br />
Medicaid Provider<br />
Service Area: Wichita<br />
Heaven Sent Transportation<br />
Wheelchair Accessible<br />
Service Area: Wichita<br />
Home Instead<br />
In staff's personal vehicle<br />
Service Area: Wichita & surrounding area<br />
Service Hours: 24 hours, 7 days a week<br />
Homewatch Caregivers<br />
In staff's personal vehicle<br />
Service Area: Wichita & surrounding area<br />
Service Hours: 24 hours, 7 days a week<br />
LOVE Inc.<br />
Church-based - Volunteer's personal vehicles<br />
Anytime Anywhere Transportation<br />
Wheelchair Accessible, Medicaid Provider<br />
Service Area: <strong>Kansas</strong><br />
Midwest Express Transportation<br />
Medicaid Provider<br />
Service Area: <strong>Kansas</strong><br />
On Time Transportation<br />
Medicaid Only<br />
Wheelchair Accessible, Medicaid Provider<br />
Service Area: 50 mile radius of Wichita<br />
Schowalter Villa<br />
Wheelchair Accessible, FTA or KDOT Funded<br />
Service Area: From Hesston to: Hesston, Newton,<br />
Halstead, Hutchinson, Wichita<br />
<strong>Sedgwick</strong> <strong>County</strong> Transportation Brokerage<br />
Wheelchair Accessible, Medicaid Provider, FTA or KDOT<br />
Funded<br />
Service Area: <strong>Sedgwick</strong> <strong>County</strong><br />
SLR Transportation<br />
Medicaid Only<br />
Medicaid Provider<br />
Service Area: Wichita<br />
Southeast <strong>Kansas</strong> Shuttle Service<br />
Service Area: <strong>Kansas</strong><br />
Sunny Dayz Transportation<br />
Medicaid Only<br />
Medicaid Provider<br />
Service Area: <strong>Sedgwick</strong> <strong>County</strong><br />
Sweet Cherry Transportation<br />
Medicaid Provider<br />
Service Area: <strong>Sedgwick</strong> <strong>County</strong> and surrounding counties<br />
Harvey <strong>County</strong> Department on Aging<br />
Wheelchair Accessible, FTA or KDOT Funded<br />
Service Area: Harvey <strong>County</strong><br />
128
<strong>2010</strong>-<strong>2040</strong> <strong>HAZARDS</strong> <strong>ANALYSIS</strong> <strong>PLAN</strong><br />
Public Transportation Services – Cont’d<br />
Thunder Enterprises<br />
Formerly Friendly Shepherd<br />
Wheelchair Accessible, Medicaid Provider<br />
Service Area: 50 mile radius of Wichita<br />
Timber Lines Transportation<br />
Cerebral Palsy Research Foundation<br />
Wheelchair Accessible, Medicaid Provider, FTA or KDOT<br />
Funded<br />
Service Area: <strong>Sedgwick</strong> <strong>County</strong><br />
Community Clinics<br />
Wichita Transit Van Service<br />
Wheelchair Accessible, FTA or KDOT Funded<br />
Service Area: Wichita<br />
Wichita Transit Fixed Route Bus<br />
Wheelchair Accessible, FTA or KDOT Funded<br />
Service Area: Wichita<br />
Wisdom Travels<br />
Wheelchair Accessible<br />
Service Area: Wichita<br />
The following primary care and medical home providers are available <strong>for</strong> uninsured, low-income, Medicaid,<br />
and Medicare clients.<br />
Center <strong>for</strong> Health and Wellness, Inc.<br />
2707 E 21st (67214)<br />
E.C. Tyree Health Clinic<br />
1525 N. Lorraine (67214)<br />
GraceMed Health Main Clinic<br />
1122 N. Topeka (67214)<br />
GraceMed Good Samaritan Clinic<br />
3701 E 13 th St, Bldg 400 (67208)<br />
GraceMed Evergreen Children’s Clinic<br />
2700 N Woodland (67204)<br />
GraceMed Healthy Children Clinic<br />
1233 S Emporia (67211)<br />
Guadalupe Clinic<br />
940 S St. Francis<br />
Guadalupe Holy Savior Satellite<br />
1406 N Erie (67214)<br />
Hunter Health Main Clinic<br />
2318 E Central (67214)<br />
Hunter Health-Brookside Satellite<br />
2760 S Roosevelt (67210)<br />
Hunter Health – Diabetes Care Center<br />
238 N Waco (67202)<br />
Hunter health – Interfaith Ministries<br />
841 N Broadway (67214)<br />
GraceMed Downing Children’s Clinic<br />
2201 E. 25th N., at Gordon Park’s Academy (67219)<br />
Limited Medical Service Clinics<br />
The providers listed below serve specific populations, provide specialized services, or offer service during<br />
nontraditional hours. These services are provided <strong>for</strong> uninsured, low-income, Medicaid, and Medicare clients.<br />
Mother Mary Anne Clinic<br />
1152 S Clifton (67218)<br />
<strong>Sedgwick</strong> <strong>County</strong> Health Department<br />
2716 W Central Avenue (67203)<br />
Hunter Health – Wichita Child Guidance<br />
415 N Poplar (67214)<br />
COMCARE – Intake and Assessment<br />
1919 N Amidon, Ste 100 (67203)<br />
COMCARE – Community Support Services<br />
1929 W 21 st St N (67203)<br />
COMCARE – Crisis Intervention<br />
934 N Water (67203)<br />
COMCARE – Adult Outpatient Services<br />
1919 N Amidon, Ste 130 (67203)<br />
COMCARE – Children’s Services<br />
7701 E Kellogg, Ste 300 (67207)<br />
COMCARE – Addiction Treatment Services<br />
940 n Waco (67203)<br />
<strong>Sedgwick</strong> <strong>County</strong> Offender Assessment Program<br />
1720 E Morris, Ste 101 (67211)<br />
129
<strong>2010</strong>-<strong>2040</strong> <strong>HAZARDS</strong> <strong>ANALYSIS</strong> <strong>PLAN</strong><br />
Dental Clinics<br />
The following providers are available <strong>for</strong> low income, Medicaid, Medicare, under- and un-insured clients.<br />
Center <strong>for</strong> Health and Wellness, Inc.<br />
2707 E 21st (67214)<br />
E.C. Tyree Dental Clinic<br />
1525 N. Lorraine (67214)<br />
GraceMed Dental Clinic<br />
1122 N. Topeka (67214)<br />
GraceMed Evergreen Children’s Clinic<br />
2700 N Woodland (67204)<br />
GraceMed Healthy Children Clinic<br />
1233 S Emporia (67211)<br />
GraceMed Downing Children’s Clinic<br />
2201 E. 25th N., at Gordon Park’s Academy (67219)<br />
Hunter Health Clinic<br />
2318 E Central (67214)<br />
Wichita State University Dental Hygiene Clinic<br />
WSU Campus, 1845 Fairmount, 1st Floor of Ahlberg Hall<br />
(67260)<br />
<strong>Sedgwick</strong> <strong>County</strong> Health Department<br />
1900 E 9th (67214)<br />
Pets and Animals<br />
In accordance with Section 5-1, Article I of the <strong>Sedgwick</strong> <strong>County</strong> Code, the following words, terms and<br />
phrases, when used in this chapter, shall have the meanings ascribed to them in this section, except where<br />
the context clearly indicates a different meaning:<br />
Animal means any vertebrate or invertebrate organism of the kingdom Animalia, such as, but not limited to,<br />
dogs, cats, cattle, horses and other equines, buffalos, hogs, goats, rabbits, sheep, chickens, ducks, geese,<br />
turkeys, pigeons and other fowl or wild animals, reptiles, fish, bees or birds that have been tamed,<br />
domesticated or captivated, except man.<br />
Inherently dangerous animal means an inherently dangerous mammal and/or an inherently dangerous<br />
reptile.<br />
Inherently dangerous mammal is any live member of the canidae, felidae, or ursidae families, including<br />
hybrids thereof, which, due to their inherent nature, may be considered dangerous to humans, and which<br />
include:<br />
(1) Canidae, including any member of the dog ( canid ) family not customarily domesticated by<br />
man, or any hybrids thereof, including wolf hybrids which are a cross between a wolf and a domestic<br />
dog, but not including domestic dogs (Canis familiaris).<br />
(2) Felidae, including any member of the cat family weighing over fifteen (15) pounds not<br />
customarily domesticated by man, or any hybrids thereof, but not including domestic cats ( Felis<br />
catus) .<br />
(3) Ursidae, including any member of the bear family, or any hybrids thereof.<br />
Inherently dangerous reptile is any live member of the class reptilia which is:<br />
(1) Venomous, including, but not necessarily limited to, all members of the following families:<br />
Helodermidae; Viperidae; Crotalidae; Atractaspidae; Hydrophilidae; and Elapidae.<br />
(2) A "rear fanged" snake of the family Colubridae that are known to be dangerous to humans,<br />
including, but not necessarily limited to, all members of the following families: Dispholidus typus;<br />
Thebtornis kirtlandii; and Rhabdophis spp.<br />
(3) Of the family Boidae (boas and pythons); specifically the following species: Python reticulatus;<br />
Eunectes sp.; Python sebae; and Python molurus.<br />
(4) A member of the order Crocodilia (crocodiles, alligators and caiman).<br />
Livestock means cattle, hogs, sheep, all creatures of the ratite family that are not indigenous to this<br />
state, including but not limited to ostriches, emus and rheas or domesticated deer. (KAR 47-1801)<br />
130
<strong>2010</strong>-<strong>2040</strong> <strong>HAZARDS</strong> <strong>ANALYSIS</strong> <strong>PLAN</strong><br />
Studies by the American Veterinary Medical Association in 1992 show the following number of pets:<br />
Pet Type Percentage of Households Owning a Pet Number of Pets Per Household<br />
Dogs 36.5 1.52<br />
Cats 30.9 1.95<br />
Birds 5.7 2.16<br />
Horses 2.0 2.54<br />
Below are calculations 34 <strong>for</strong> determining the number of companion animals in <strong>Sedgwick</strong> <strong>County</strong> with an<br />
estimated 187,211 households and a population of 470,895 (2006 census):<br />
Dogs: 187,211 x 36.5% = 68,332 x 1.52= 103,865<br />
Cats: 187,211 x 30.9% = 57,848 x 1.95= 112,804<br />
Birds: 187,211 x 5.7% = 10,671 x 2.16= 23,049<br />
Horses: 187,211 x 2.0% = 3,744 x 2.54= 9,510<br />
Estimated Pets in <strong>Sedgwick</strong> <strong>County</strong>: 249,228<br />
Veterinary Clinics Address City Remarks<br />
Aquarium in Old Town Inc 1001 E Douglas Ave Wichita Pet Store<br />
Pet Mountain 10035 E Funston Ct Eastborough Pet Store<br />
34 HSUS Disaster Planning – Community Planning, pg 6<br />
131
<strong>2010</strong>-<strong>2040</strong> <strong>HAZARDS</strong> <strong>ANALYSIS</strong> <strong>PLAN</strong><br />
McDonald Small Animal Clinic 1004 N Waco Wichita Hospital / Clinic<br />
One Stop Pet Shop 1018 W 31st St S Wichita Pet Store<br />
Mulvane Animal Clinic 10231 S Rock Rd Mulvane Hospital / Clinic<br />
Companion Animal Hospital 10555 W Maple Wichita Hospital / Clinic<br />
Blair Doon Veterinary Hospital 10804 E 31st S Wichita Hospital / Clinic<br />
Wall Seed Company 1085 S Washington St Wichita Pet Store<br />
<strong>Sedgwick</strong>-Halstead Veterinary Clinic Inc 110 E 5th St <strong>Sedgwick</strong> Hospital / Clinic<br />
Zoom Groom 1141 Maple St Wichita Pet Store<br />
Gilpins Feed & Supply 11808 E Kellogg Dr Eastborough Pet Food & Animal Feed Supplier<br />
Oakcrest Pet Hospital 11832 W Central Wichita Hospital / Clinic<br />
Valley Center Veterinary Clinic<br />
122 W Main<br />
Valley<br />
Center<br />
Hospital / Clinic<br />
Holmes Carriage Company<br />
12735 SW Meadowlark<br />
Valley<br />
Center<br />
Pet & Livestock Transportation<br />
Supplies<br />
Romms Grain Express 13000 E 47th St Derby Pet Store<br />
Loesch Mobile Veterinary Clinic 13110 W. Central Wichita Hospital / Clinic<br />
Dogwatch of Wichita 135 S Illinois St Wichita Pet Store<br />
Indian Hills Animal Clinics 1448 N Maize Rd Wichita Hospital / Clinic<br />
Pine Shadows Vet Service 15130 E 29th St N Wichita Hospital / Clinic<br />
Animal Clinic at Webb Village 1520 S Webb Rd, Suite 180 Wichita Hospital / Clinic<br />
Exotic Pets 1551 S 151st St W Goddard Pet Store<br />
Kutter Pet Care Center 1607 W Central Wichita Hospital / Clinic<br />
Rainbow Valley Veterinary Clinic 1630 James St Derby Hospital / Clinic<br />
Cove 1631 S Hillside St Wichita Pet Store<br />
Tanglewood Veterinary Clinic 1634 E Madison Ave Derby Hospital / Clinic<br />
General Pet Supply Midwest LLC 1635 S Sabin St Wichita Pet Store<br />
Tails & Scales 1718 N Nelson Dr Derby Pet Store<br />
Chisholm Trail Animal Hospital PA 1726 E 61st Street N Wichita Hospital / Clinic<br />
Prairie Avian Exotic Animal Clinic 1741 S Glendale St Wichita Hospital / Clinic<br />
Hillside Feed & Seed Store 1805 S Hillside Wichita Pet Food & Animal Feed Supplier<br />
Wichita Mobile Vet Clinic 1838 N Kessler Wichita Hospital / Clinic<br />
P&P Seed & Bait Company 1901 E 21st St Wichita Pet Store<br />
Valley Feed & Seed Inc 1903 S Meridian Wichita Pet Food & Animal Feed Supplier<br />
Cheney Animal Clinic 1961 S 391st St W Cheney Hospital / Clinic<br />
Goddard Veterinary Clinic 19912 W Kellogg Goddard Hospital / Clinic<br />
Precious Paws Dog & Cat Grooming 2021 W 21st St N Wichita Pet Store<br />
Weldens Pet Supplies 207 S Buckner St Derby Pet Store<br />
Sweetbriar Veterinary Clinic 2070 W 21st Wichita Hospital / Clinic<br />
Mitchell Veterinary Supply Inc 2136 N Mosley Wichita Equipment & Supplies<br />
Weiden Pet Supplies 225 S Circle Dr Wichita Pet Supplies<br />
Pet Traditions Memorial Center 2260 N Ridge Rd, Suite 120 Wichita Crematory / Funeral<br />
Mona's Dog Grooming 230 N Wood Ave Wichita Pet Store<br />
Natural Classic 2300 N Broadway Park City Pet Food & Animal Feed Supplier<br />
TreatCo Inc 2300 N Broadway Park City Pet Store<br />
El Paso Animal Clinic 233 S Georgia Ave Derby Hospital / Clinic<br />
Andale Animal Clinic ADL 24101 W. 53rd N Andale Hospital / Clinic<br />
Kritter's Korner 2417 S Hillside St Wichita Pet Store<br />
College Hill Animal Hospital Inc 244 N Hillside Wichita Hospital / Clinic<br />
Pet Haven Veterinary Clinic 2518 W 13th St N Wichita Hospital / Clinic<br />
Veterinary Clinics Address City Remarks<br />
Arapahoe Veterinary Clinic 2776 S Seneca Wichita Hospital / Clinic<br />
2815 George Washington<br />
Gupton's Pets & Supplies Inc<br />
Blvd Wichita Pet Store<br />
132
<strong>2010</strong>-<strong>2040</strong> <strong>HAZARDS</strong> <strong>ANALYSIS</strong> <strong>PLAN</strong><br />
Unique Clip 300 S Greenwich Rd Wichita Pet Food & Animal Feed Supplier<br />
DVM Resources 3031 W Pawnee, Suite 400 Wichita Equipment & Supplies<br />
Broadway Animal Clinic 3036 S Broadway Wichita Hospital / Clinic<br />
Luv My Pet 3050 N Rock Rd Wichita Hospital / Clinic<br />
Petco Animal Supplies 3050 N Rock Rd Wichita Pet Store<br />
Hutton Veterinary Clinic 3116 E 31st St S Wichita Hospital / Clinic<br />
Royal Pet Supplies 3123 N Forest Lakes Ct Wichita Pet Supplies<br />
West Side Pet Center 3135 Maple St Wichita Pet Store<br />
Bobby's Mobile Garden 3200 Southeast Blvd Oaklawn Pet Store<br />
Indian Hills Animal Clinics 3223 W 13th St Wichita Hospital / Clinic<br />
Wichita Animal Shelter 3303 N Hillside Wichita Shelter<br />
Equine Surgery & Medicine 3500 E 45th N Bel Aire Hospital / Clinic<br />
Banfield The Pet Hospital 3615 N Rock Rd Wichita Hospital / Clinic<br />
PetSmart 3615 N Rock Rd Wichita Pet Food & Animal Feed Supplier<br />
Caring Hearts Veterinary Clinic 3701 W Maple Wichita Hospital / Clinic<br />
Chirp N Squak Bird Supplies 3805 W 13th St Wichita Pet Store<br />
Heartland Veterinary Services Inc 3920 S 215th W Goddard Hospital / Clinic<br />
Skaer Veterinary Clinic 404 S Edgemoor, Bldg 100 Wichita Hospital / Clinic<br />
Heartland Animal Hospital 4100 N Woodlawn Wichita Hospital / Clinic<br />
Adkins Mobile Veterinary Service 419 N Rutland St Wichita Hospital / Clinic<br />
Air Capital Veterinary Clinic 419 S Hydraulic, Suite 1 Wichita Hospital / Clinic<br />
Clearwater Veterinary Clinic 420 N 4th Clearwater Hospital / Clinic<br />
Cottonwood Vet Clinic 421 N Webb Rd Wichita Hospital / Clinic<br />
<strong>Kansas</strong> Humane Society 4218 Southeast Blvd Wichita Shelter: 524-9196 / Crematory<br />
Bogue Animal Hospital West PA 429 N Maize Rd Wichita Hospital / Clinic<br />
Seneca Veterinary Clinic 435 N Seneca Wichita Hospital / Clinic<br />
Wingert Animal Hospital 4419 S Seneca Wichita Hospital / Clinic<br />
Pet Circus Grooming 517 Kopplin St Wichita Pet Store<br />
Wingert Animal Hospital 521 E Grand Haysville Hospital / Clinic<br />
Wichita Dog & Cat Hospital 5214 W Central Wichita Hospital / Clinic<br />
East Central Veterinary Hospital 5301 E Central Wichita Hospital / Clinic<br />
Banfield The Pet Hospital 533 S Tracy St Wichita Hospital / Clinic<br />
PetSmart 533 S Tracy St Wichita Pet Food & Animal Feed Supplier<br />
Bed & Bisquit Pet Center Ltd 5400 E Central Wichita Pet Food & Animal Feed Supplier<br />
Fins & Feathers Pet Shop 601 N West St, #232 Wichita Pet Store<br />
Cimarron Animal Hospital 6011 E 21st Street Wichita Hospital / Clinic<br />
Village Animal Hospital 6121 E 13th St Wichita Hospital / Clinic<br />
Harry Pet Clinic 6145 E Harry Wichita Hospital / Clinic<br />
Pro Zoological 623 Baltimore Derby Pet Store<br />
Cat Hospital of Wichita 6534 E Central Wichita Hospital / Clinic<br />
Helten Veterinary Clinic 6630 W Central Wichita Hospital / Clinic<br />
Luv My Pet 6840 W Kellogg Wichita Hospital / Clinic<br />
Busy Birds 7130 Maple St, #170 Wichita Pet Store<br />
Veterinary Hospital of Wichita 727 S Washington Wichita Hospital / Clinic<br />
Carol's Pet Grooming 7534 S Broadway St Haysville Pet Store<br />
Solomon Veterinary Clinic 7810 E Funston Wichita Hospital / Clinic<br />
East Douglas Veterinary Clinic 8118 E Douglas, Suite 109 Wichita Hospital / Clinic<br />
Uptown Paws 8338 E 21st St Wichita Pet Food & Animal Feed Supplier<br />
Veterinary Clinics Address City Remarks<br />
Northrock Hospital <strong>for</strong> Animals 8338 E 29th N Wichita Hospital / Clinic<br />
All Creatures Veterinary Hospital 8414 W 13th, Suite 170 Wichita Hospital / Clinic<br />
133
<strong>2010</strong>-<strong>2040</strong> <strong>HAZARDS</strong> <strong>ANALYSIS</strong> <strong>PLAN</strong><br />
Charles' K-9 Boutique 846 S Edgemoor St Wichita Pet Store<br />
West Wichita Pet Clinic 8615 W 21st Wichita Hospital / Clinic<br />
Herndon Veterinary Clinic 8820 W Maple Wichita Hospital / Clinic<br />
Pet & Livestock Transportation<br />
Midwest Sales 8830 S Hydraulic Haysville<br />
Supplies<br />
Petco Animal Supplies 8840 W Kellogg Wichita Pet Store<br />
Pet Set Grooming 905 S Seneca St Wichita Pet Store<br />
Noah's Ark Exotic Pets 920 E Grand Ave Haysville Pet Store<br />
Best Friends Pet Clinic 9424 W Central Wichita Hospital / Clinic<br />
Petcare 9840 W Kellogg Wichita Pet Store<br />
Pursuant to KAR 47-1803, Disposition of injured or diseased animals:<br />
Any public health officer, officer or agent of a duly incorporated humane society, animal shelter or other<br />
appropriate facility, licensed veterinarian or police officer may take charge of any livestock or other<br />
domestic animal found injured or diseased upon public property. Such animal may be transported to a<br />
licensed veterinarian or a duly incorporated humane society, animal shelter or other appropriate facility <strong>for</strong><br />
treatment, or, if such animal is injured or diseased beyond recovery or appears likely to injure any person<br />
or property, such animal may be killed in a humane manner by any such officer or agent.<br />
Any public health officer, officer or agent of a duly incorporated humane society, animal shelter or other<br />
appropriate facility, licensed veterinarian or police officer may take charge of any livestock or other<br />
domestic animal found injured or diseased upon private property if such animal appears likely to injure any<br />
person or property. The disposition of such animal shall be as provided in subsection (a) of this section.<br />
Unless any such animal's death appears to be imminent by reason of its disease or disability, or such<br />
animal is likely to injure any person or property, no such animal may be killed under the provisions of this<br />
section unless its owner cannot be located within twenty-four (24) hours.<br />
134
<strong>2010</strong>-<strong>2040</strong> <strong>HAZARDS</strong> <strong>ANALYSIS</strong> <strong>PLAN</strong><br />
9.13 INFORMATION TECHNOLOGY (IT) SECTOR<br />
This sector provides communications and processes to meet the needs of businesses and government.<br />
Threats to this sector include physical vulnerabilities and also natural vulnerabilities <strong>for</strong> telecommunications.<br />
The following agencies are responsible <strong>for</strong> this sector:<br />
Local: Public and Private Utilities, Petrochemical Companies<br />
State: <strong>Kansas</strong> Division of Emergency Management/<strong>Kansas</strong> Highway Patrol, <strong>Kansas</strong> Fire Marshall<br />
Federal: Department of Homeland Security<br />
The In<strong>for</strong>mation Technology (IT) Sector is central to community security, economy, public health, and safety.<br />
Businesses, governments, academia, and private citizens are increasingly dependent upon IT Sector<br />
functions. These virtual and distributed functions produce and provide hardware, software, and IT systems<br />
and services, and—in collaboration with the Communications Sector—the Internet.<br />
Many other critical infrastructure and key resources (CIKR) sectors rely on the IT Sector <strong>for</strong> products and<br />
services, including the reliable operation of networks and systems, and the movement and storage of critical<br />
data. The sector’s complex and dynamic environment makes identifying threats and assessing<br />
vulnerabilities more difficult and requires that these tasks be dealt with in a collaborative and creative<br />
fashion.<br />
Although the IT infrastructure has a certain level of inherent resilience, its interdependent and interconnected<br />
structure presents challenges as well as opportunities <strong>for</strong> coordinating public- and private-sector<br />
preparedness and protection activities.<br />
The IT Sector provides an infrastructure upon which all other CIKR sectors rely, coordinates with other CIKR<br />
sectors, and works to ensure that any disruptions or manipulations of critical functions are brief, infrequent,<br />
manageable, geographically isolated, and minimally detrimental to the welfare of the United States. The<br />
In<strong>for</strong>mation Technology Sector shares dependencies and interdependencies with other CIKR sectors,<br />
including: Banking and Finance, Chemical, Communications, Emergency Services, Government Facilities,<br />
Healthcare and Public Health, Postal and Shipping, and Water.<br />
135
<strong>2010</strong>-<strong>2040</strong> <strong>HAZARDS</strong> <strong>ANALYSIS</strong> <strong>PLAN</strong><br />
9.14 MONUMENTS AND ICONS SECTOR<br />
The assets of the Monuments and Icons Sector are managed and safeguarded by the local and state<br />
historical societies. These facilities memorialize or represent significant aspects of a jurisdiction’s heritage,<br />
tradition, or values, and serve as points of interest <strong>for</strong> visitors and educational activities. Many of these sites<br />
represent the foundation of the jurisdiction and as such must be protected from harm either by attack or<br />
natural disaster. The primary goal, however, is to preserve public accessibility to national critical assets to<br />
the maximum extent possible.<br />
The sector faces the challenges of maintaining security at these sites and developing protective measures to<br />
deal with emerging threats without restricting access.<br />
Unlike other assets that have numerous interdependencies, Monuments and Icons assets are basically<br />
stand-alone assets. The loss of or damage to an Monuments and Icons asset generally will not have a<br />
cascading effect on other assets within the Monuments and Icons Sector, or other sectors, such as Energy,<br />
Transportation, Food, and so on. Cross-sector coordination related to sector assets <strong>for</strong> which the primary<br />
protective responsibility resides in another sector is, however, essential.<br />
MAP OF WICHITA HISTORIC SITES<br />
The following pages reflect those historic sites that have been identified by the <strong>Kansas</strong> State Historical<br />
Society and the National Register of Historical Places.<br />
136
<strong>2010</strong>-<strong>2040</strong> <strong>HAZARDS</strong> <strong>ANALYSIS</strong> <strong>PLAN</strong><br />
STATE & NATIONAL REGISTER OF HISTORICAL PLACES<br />
SEDGWICK COUNTY, KANSAS<br />
Site/Register Number Address Location Significance Period of<br />
Significance<br />
Owner<br />
Historic<br />
Function<br />
Current<br />
Function<br />
Adeline Apartment Building 1403 N Emporia Wichita Architecture/<br />
Engineering<br />
1900-1924 Private Domestic Domestic<br />
Administration Building<br />
Aka Building One<br />
#90000908<br />
Allen, Henry J., House<br />
Aka Kincade,Arthur W., House<br />
#73000775<br />
Allen's Market<br />
Aka 173-5880-100000<br />
Arkansas Valley Lodge No. 21,<br />
Prince Hall Masons<br />
Aka Black Masonic Lodge<br />
#77000596<br />
Belmont Arches<br />
Aka 173-5880-8157<br />
Bitting Historic District<br />
#04000776<br />
Bond-Sullivan House<br />
Aka 173-5880-5246<br />
Bowers House<br />
Aka 173-5880-5388<br />
#04000973<br />
Brown Building<br />
(aka Broadway Plaza)<br />
Building Nine<br />
#88001901<br />
Buildings at 800 West Douglas Block<br />
Aka 12573; 12574; 12575<br />
#04001160<br />
3350 S George<br />
Washington Blvd<br />
McConnell<br />
Air Force<br />
Base<br />
Event,<br />
Architecture/<br />
Engineering<br />
255 N. Roosevelt St Wichita Architecture/<br />
Engineering<br />
2938 E Douglas Ave Wichita Architecture/<br />
Engineering<br />
615 N. Main St Wichita Event/<br />
Social History<br />
Located on Belmont<br />
at the Central and<br />
Douglas intersections<br />
1100 and 1200 Blocks<br />
of Bitting<br />
Wichita<br />
Wichita<br />
Architecture/<br />
Engineering,<br />
Invention,<br />
Community<br />
Development and<br />
Planning<br />
Event,<br />
Architecture/<br />
Engineering<br />
936 Back Bay Blvd Wichita Architecture/<br />
Engineering<br />
1004 North Market Wichita Person,<br />
Architecture/<br />
Engineering<br />
105 S Broadway St Wichita Architecture/<br />
Engineering<br />
801 E. 37th St. North Wichita Event/<br />
Industry<br />
809,811, and 815 W.<br />
Douglas<br />
Wichita<br />
Event/<br />
Commerce<br />
1925-1949 Federal Transportation Vacant/<br />
Not In Use<br />
1900-1924 Private Domestic Domestic<br />
1925-1949 Private Commerce Commerce<br />
1900-1924 Local<br />
Government<br />
1925-1949,<br />
1950-1974<br />
1875-1899,<br />
1900-1924,<br />
1925-1949<br />
Local<br />
Government<br />
Private, Local<br />
Government<br />
Social<br />
Recreation and<br />
Culture<br />
Domestic,<br />
Transportation<br />
Vacant/<br />
Not in Use<br />
Recreation and<br />
Culture<br />
Domestic,<br />
Transportation<br />
1925-1949 Private Domestic Domestic<br />
1900-1924,<br />
1925-1949<br />
Private Domestic Work In<br />
Progress<br />
1925-1949 Private Commerce Commerce<br />
1875-1899,<br />
1900-1924,<br />
1925-1949<br />
1875-1899,<br />
1900-1924,<br />
1925-1949,<br />
1950-1974<br />
Private<br />
Private<br />
Industry/<br />
Processing/<br />
Extraction<br />
Commerce/<br />
Trade, Domestic<br />
Industry/<br />
Processing/<br />
Extraction<br />
Commerce/<br />
Trade<br />
123
<strong>2010</strong>-<strong>2040</strong> <strong>HAZARDS</strong> <strong>ANALYSIS</strong> <strong>PLAN</strong><br />
STATE & NATIONAL REGISTER OF HISTORICAL PLACES<br />
SEDGWICK COUNTY, KANSAS<br />
Site/Register Number Address Location Significance Period of<br />
Significance<br />
Calvary Baptist Church<br />
#88001905<br />
601 N. Water Wichita Event,<br />
Architecture/<br />
Engineering<br />
1155 N. River Blvd Wichita Architecture/<br />
Engineering<br />
525 E. Douglas Ave Wichita Architecture/<br />
Engineering<br />
Campbell, B. H., House<br />
#73000776<br />
Carey House<br />
Aka Eaton Hotel<br />
#72000526<br />
Chapman-Noble House<br />
1230 N Waco Wichita Architecture/<br />
Aka 173-5880-0069<br />
Engineering<br />
Clapp, R.D.W. Residence<br />
320 N Belmont Wichita Architecture/<br />
Aka 173-5880-0846<br />
Engineering<br />
Clapp, L. W., House<br />
1847 Wellington Place Wichita Person,<br />
Aka Wellington Place<br />
Architecture/<br />
#82002668<br />
Engineering<br />
College Hill Park Bathhouse 304 S Circle Drive Wichita Social History,<br />
Architecture/<br />
Engineering<br />
Comley House<br />
Aka 173-5880-0075<br />
Dunbar Theater<br />
Aka 173-5880-2470<br />
1137 N Broadway Wichita Architecture/<br />
Engineering<br />
1007 N. Cleveland Wichita Social History,<br />
Architecture/<br />
Engineering,<br />
Commerce,<br />
Per<strong>for</strong>ming Arts,<br />
Recreation<br />
Eagle's Lodge #132 200-202 S. Emporia Wichita Social History,<br />
Architecture/<br />
Engineering,<br />
Commerce,<br />
East Douglas Avenue<br />
Historic District<br />
#04000777<br />
Roughly bounded by<br />
Topeka, Rock Island,<br />
1st, and English Sts<br />
Wichita<br />
Architecture/<br />
Engineering, Event<br />
124<br />
Owner<br />
Historic<br />
Function<br />
Current<br />
Function<br />
1900-1924, Local<br />
Religion/ Recreation And<br />
1925-1949 Government Religious Culture/<br />
Structure Museum<br />
1875-1899 Private Domestic Domestic<br />
1875-1899 Private Domestic/<br />
Hotel<br />
Domestic/<br />
Hotel<br />
1875-1899 Private Domestic Domestic<br />
1900-1924,<br />
1925-1949<br />
Private Domestic Domestic<br />
1875-1899 Private Domestic Vacant/<br />
Not In Use<br />
1925-1949 Local<br />
Government<br />
1875-1899,<br />
1900-1924,<br />
1925-1949,<br />
1950-1974<br />
1925-1949,<br />
1950-1974<br />
1900-1924,<br />
1925-1949,<br />
1950-1974<br />
1875-1899,<br />
1900-1924,<br />
1925-1949<br />
Local<br />
Government<br />
Private<br />
Private<br />
Private, Local<br />
Government<br />
Recreation and<br />
Culture<br />
Domestic<br />
Recreation and<br />
Culture<br />
Social,<br />
Funerary<br />
Commerce/<br />
Trade,<br />
Domestic,<br />
Recreation And<br />
Culture,<br />
Transport<br />
Recreation and<br />
Culture<br />
Domestic<br />
Vacant/<br />
Not In Use<br />
Vacant/<br />
Not In Use<br />
Commerce/<br />
Trade,<br />
Recreation And<br />
Culture,<br />
Transport,<br />
Museum
<strong>2010</strong>-<strong>2040</strong> <strong>HAZARDS</strong> <strong>ANALYSIS</strong> <strong>PLAN</strong><br />
STATE & NATIONAL REGISTER OF HISTORICAL PLACES<br />
SEDGWICK COUNTY, KANSAS<br />
Site/Register Number Address Location Significance Period of<br />
Significance<br />
Ellis-Singleton Building<br />
Aka Petroleum Building<br />
173-5880-10004<br />
Engine House No. 6<br />
Aka 173-5880-2166<br />
#94001623<br />
Fairmount Congregational Church<br />
Aka 173-5880-3389<br />
Fairmount Cottage<br />
#85001979<br />
Farmer's and Banker's Historic District<br />
Aka Elks Lodge and Commercial Club<br />
First Presbyterian Church<br />
#72001615<br />
Fresh Air Baby Camp<br />
Aka Girl Scout Little House<br />
173-5880-9040<br />
Gelbach House<br />
Aka 173-5880-7352<br />
#02000545<br />
Grace Methodist Episcopal Church<br />
Aka Grace United Methodist Church<br />
173-5880-8405<br />
Hay<strong>for</strong>d Buildings<br />
#82000420<br />
173-5880-139<br />
Hillside Cottage<br />
#76000839 / 173-5880-087<br />
Holyoke Cottage<br />
Aka Parker House<br />
173-5880-7485<br />
Hypatia House<br />
Aka 173-5880-0064<br />
#91001105<br />
221 S Broadway Wichita Architecture/<br />
Engineering<br />
1300 S. Broadway Wichita Architecture/<br />
Engineering, Event<br />
1650 N Fairmont Wichita Architecture/<br />
Engineering,<br />
Communications<br />
1717 Fairmount Ave Wichita Architecture/<br />
Engineering<br />
NE Corner, 1st &<br />
Market Sts<br />
Wichita<br />
Architecture/<br />
Engineering<br />
125<br />
1925-1949,<br />
1950-1974<br />
1900-1924,<br />
1925-1949<br />
Owner<br />
Historic<br />
Current<br />
Function Function<br />
Private Commerce Commerce<br />
Local<br />
Government<br />
Government/<br />
Fire Station<br />
Vacant/<br />
Not In Use<br />
1900-1924,<br />
1925-1949,<br />
1950-1974<br />
Private Religion Religion<br />
1875-1899 Private Domestic Domestic<br />
1900-1924,<br />
1925-1949,<br />
1950-1974<br />
Private<br />
1717 Sim Park Dr Wichita Private<br />
1229 W 11th St Wichita Health/Medicine,<br />
Social History,<br />
Architecture/<br />
Engineering<br />
1900-1924,<br />
1925-1949,<br />
1950-1974<br />
Local<br />
Government<br />
Social,<br />
Commerce/<br />
Trade<br />
Health Care,<br />
Social<br />
Commerce/<br />
Trade<br />
Vacant/<br />
Not in Use<br />
1721 Park Place Wichita Event, Person 1900-1924 Private Domestic Domestic<br />
944 S Topeka Wichita Architecture/<br />
Engineering<br />
255 N Market and<br />
115-127 E. 2nd Sts<br />
Wichita<br />
Architecture/<br />
Engineering<br />
303 Circle Dr Wichita Architecture/<br />
Engineering<br />
1704 N Holyoke Wichita Architecture/<br />
Engineering<br />
1215 N Broadway Wichita Architecture/<br />
Engineering<br />
1900-1924 Private Religion Religion<br />
1900-1924,<br />
1925-1949,<br />
1950-1974,<br />
1975-2000<br />
Private<br />
Commerce/<br />
Trade,<br />
Domestic<br />
Commerce/<br />
Trade<br />
1875-1899 Private Domestic Domestic<br />
1875-1899 Private Domestic,<br />
Education<br />
1900-1924 Private Domestic,<br />
Social<br />
Other, Work in<br />
Progress<br />
Social,<br />
Clubhouse
<strong>2010</strong>-<strong>2040</strong> <strong>HAZARDS</strong> <strong>ANALYSIS</strong> <strong>PLAN</strong><br />
STATE & NATIONAL REGISTER OF HISTORICAL PLACES<br />
SEDGWICK COUNTY, KANSAS<br />
Site/Register Number Address Location Significance Period of<br />
Significance<br />
International Harvester Building<br />
#02001702<br />
Jackman, C.M., House<br />
Aka 173-5880-0548<br />
Johnson Drug Store Building<br />
Aka 173-5880-9994<br />
Keep Klean Building<br />
Aka Wichita Towel Supply<br />
173-5880-05209<br />
Kelly, Edward M., House<br />
#02000763<br />
Kress, S. H., Company Building<br />
Aka Kress Building<br />
#85001385<br />
Lassen Hotel<br />
Aka Market Centre<br />
173-5880-0016/<br />
#84000108<br />
Lewelling, Governor L.D., House<br />
173-5880-1184/#05000547<br />
Linwood Park Greenhouse and<br />
Maintenance Building<br />
Long, Chester I., House<br />
173-5880-096/#78001289<br />
Mack, John, Bridge<br />
Aka South Lawrence Street Bridge<br />
173-5880-1383/#91002018<br />
Market Street Cottage<br />
173-5880-5243<br />
McCormick School<br />
#78001288<br />
355 N. Rock Island<br />
Ave/803-811 E. Third<br />
St<br />
Wichita<br />
Architecture/<br />
Engineering, Event<br />
158 N Roosevelt Wichita Architecture/<br />
Engineering<br />
2329 E Central Wichita Architecture/<br />
Engineering<br />
810 E Third Wichita Architecture/<br />
Engineering,<br />
Industry<br />
1711 N. Market Street Wichita Architecture/<br />
Engineering,<br />
Person<br />
224 E. Douglas Wichita Architecture/<br />
Engineering, Event<br />
Market Ave. and 1st<br />
Street<br />
Wichita<br />
Architecture/<br />
Engineering, Event<br />
1900-1924,<br />
1925-1949<br />
Owner<br />
Private<br />
Historic<br />
Function<br />
Commerce/<br />
Trade<br />
Current<br />
Function<br />
Domestic, Work<br />
In Progress<br />
1900-1924 Private Domestic Domestic<br />
1925-1949 Private Commerce Commerce<br />
1925-1949,<br />
1950-1974<br />
1900-1924,<br />
1925-1949<br />
Private Industry/<br />
Processing/<br />
Extraction<br />
Work in Progress<br />
Private Domestic Domestic<br />
1925-1949 Private Commerce/<br />
Trade<br />
1900-1924 Private Domestic,<br />
Hotel<br />
Commerce/<br />
Trade<br />
Work In Progress<br />
1245 N. Broadway Wichita Person,<br />
Architecture/<br />
Engineering<br />
1875-1899 Private Domestic Domestic<br />
1700 S. Hydraulic Wichita Social History 1925-1949 Local Agriculture/ Agriculture/<br />
Street<br />
Government Subsistence Subsistence<br />
3401 E 2nd St Wichita Person 1875-1899 Private Domestic Domestic<br />
S. Broadway across<br />
the Big Arkansas River<br />
Wichita<br />
Event,<br />
Architecture/<br />
Engineering<br />
1144 N Market Wichita Architecture/<br />
Engineering<br />
855 S. Martinson Wichita Event,<br />
Architecture/<br />
Engineering<br />
1925-1949 Local<br />
Government<br />
Transportation<br />
Transportation<br />
1875-1899 Private Domestic Domestic<br />
1875-1899 Local<br />
Government<br />
Education<br />
Education<br />
126
<strong>2010</strong>-<strong>2040</strong> <strong>HAZARDS</strong> <strong>ANALYSIS</strong> <strong>PLAN</strong><br />
STATE & NATIONAL REGISTER OF HISTORICAL PLACES<br />
SEDGWICK COUNTY, KANSAS<br />
Site/Register Number Address Location Significance Period of<br />
Significance<br />
Mentholatum Company Building<br />
173-5880-8299<br />
Mohr Barn<br />
173-0000-0131<br />
Monroe--Mahan House<br />
173-5880-0099/#96000583<br />
Mullen Court Apartments<br />
Munger, Darius Sales, House<br />
#82002669<br />
Nokomis and Navarre Apartment<br />
Buildings<br />
#01000234<br />
1300 E Douglas Wichita Industry and<br />
Commerce,<br />
Architecture/<br />
Engineering<br />
14920 W 21st Street<br />
North<br />
127<br />
1900-1924,<br />
1925-1949<br />
Wichita Agriculture 1900-1924,<br />
1925-1949,<br />
1950-1974<br />
1357 S. Broadway Wichita Architecture/<br />
Engineering<br />
1140-1150 N. Topeka Wichita Architecture/<br />
Avenue<br />
Engineering<br />
Museum, Sim Park Wichita Event,<br />
Architecture/<br />
Engineering<br />
420-426 N. Topeka Wichita Architecture/<br />
Ave<br />
Engineering<br />
North Riverside Park Com<strong>for</strong>t Station 900 N Bitting Ave Wichita Architecture/<br />
Engineering,<br />
Social History<br />
North Topeka Avenue-10th Street<br />
Historic District<br />
#83000438/173-5880-0134 thru 173-<br />
5880-0137<br />
Occidental Hotel<br />
Aka Baltimore Hotel<br />
#82002670/173-5880-052<br />
Old <strong>Sedgwick</strong> <strong>County</strong> Courthouse<br />
#71000327/173-5880-002<br />
Old Wheeler-Kelly-Hagny Building<br />
#82002671/173-5880-0015<br />
Orpheum Theater and Office Building<br />
#80001473/173-5880-039<br />
1165, 1103, 1109,<br />
1113, and 1108 N.<br />
Topeka Ave<br />
Wichita<br />
Architecture/<br />
Engineering<br />
300 N. Main St Wichita Event,<br />
Architecture/<br />
Engineering<br />
504 N. Main St Wichita Event,<br />
Architecture/<br />
Engineering<br />
120 S. Market St Wichita Event,<br />
Architecture/<br />
Engineering<br />
200 N. Broadway St Wichita Event,<br />
Architecture/<br />
Engineering<br />
Owner<br />
Historic<br />
Function<br />
Current<br />
Function<br />
Private Commerce/ Commerce/<br />
Trade,<br />
Trade<br />
Industry/<br />
Processing/<br />
Extraction<br />
Private Agriculture Agriculture<br />
1875-1899 Private Single Dwelling Single Dwelling<br />
1925-1949 Private Multiple<br />
Dwelling<br />
1850-1874 Local<br />
Domestic<br />
Government<br />
1900-1924,<br />
1925-1949<br />
1925-1949 Local<br />
Government<br />
Multiple<br />
Dwelling<br />
Recreation And<br />
Culture<br />
Private Domestic Domestic<br />
Recreation And<br />
Culture<br />
Recreation And<br />
Culture<br />
1875-1899 Private Domestic Domestic<br />
1850-1874 Private Domestic Commercial/<br />
Trade<br />
1875-1899 Local<br />
Government<br />
Government<br />
1900-1924 Private Commerce/<br />
Trade<br />
1900-1924 Private Commerce/<br />
Trade,<br />
Recreation And<br />
Culture<br />
Government<br />
Commerce/<br />
Trade<br />
Commerce/<br />
Trade,<br />
Recreation And<br />
Culture
<strong>2010</strong>-<strong>2040</strong> <strong>HAZARDS</strong> <strong>ANALYSIS</strong> <strong>PLAN</strong><br />
STATE & NATIONAL REGISTER OF HISTORICAL PLACES<br />
SEDGWICK COUNTY, KANSAS<br />
Site/Register Number Address Location Significance Period of<br />
Significance<br />
Park Place--Fairview Historic District<br />
#04000778<br />
Riverside Cottage<br />
Aka Fitch,Thomas,House<br />
#88002824/173-5880-0114<br />
Riverview Apartments<br />
#02000765<br />
Roberts House<br />
173-5880-0346<br />
Rock Island Depot<br />
#73000777/173-5880-0162<br />
Scottish Rite Temple<br />
Aka Y.M.C.A. Building<br />
#72000527<br />
<strong>Sedgwick</strong> <strong>County</strong> Memorial Hall and<br />
Soldiers and Sailors Monument<br />
Aka Soldiers and Sailors Civil War<br />
Monument<br />
#98001359<br />
Roughly Park Place<br />
and Fairview Aves.<br />
bet. 13th and 17th Sts.<br />
and Wellington Place<br />
Wichita<br />
Event,<br />
Architecture/<br />
Engineering<br />
901 Spaulding Ave Wichita Person, Event,<br />
Architecture/<br />
Engineering<br />
404-408 Back Bay Blvd Wichita Event,<br />
Architecture/<br />
Engineering<br />
235 N Roosevelt Wichita Architecture/<br />
Engineering<br />
729 E. Douglas St Wichita Event,<br />
Architecture/<br />
Engineering<br />
NW corner of 1st St. at<br />
Topeka<br />
Wichita<br />
Architecture/<br />
Engineering<br />
510 N. Main Wichita Architecture/<br />
Engineering<br />
128<br />
1875-1899,<br />
1900-1924,<br />
1925-1949<br />
Owner<br />
Local<br />
Government,<br />
Private<br />
Historic<br />
Function<br />
Domestic<br />
Current<br />
Function<br />
Domestic<br />
1875-1899 Private Domestic Domestic<br />
1925-1949 Private Domestic Domestic<br />
1900-1924 Private Domestic Domestic<br />
1875-1899 Private Transportation Commerce/<br />
Trade<br />
1875-1899,<br />
1900-1924<br />
1900-1924 Local<br />
Government<br />
Private Social Social<br />
Recreation And<br />
Culture<br />
Recreation And<br />
Culture<br />
Sim Park Golf Course Tee Shelters 2020 W Murdock St Wichita Social History 1925-1949 Local<br />
Landscape Landscape<br />
Government<br />
St. Mark Church<br />
#91000463/173-0000-0001<br />
19230 W. 29th St., N Colwich Architecture/<br />
Engineering,<br />
Event<br />
1900-1924,<br />
1925-1949<br />
Private Religion Religion<br />
Stackman Court Apartments<br />
Aka Franklin Apartments;<br />
#91001741/173-5880-0491<br />
Stearman Aircraft Company Hangar<br />
#82005257<br />
Sternberg, William, House<br />
#89000387<br />
1207 Franklin Ave Wichita Architecture/<br />
Engineering,<br />
Person, Event<br />
McConnell Air Force Wichita<br />
Base<br />
1065 N. Waco Wichita Event,<br />
Architecture/<br />
Engineering<br />
Stoner Apartment Building 938-940 N Market Wichita Architecture/<br />
Engineering<br />
1925-1949 Private Domestic Domestic<br />
Federal<br />
1875-1899 Private Domestic Domestic<br />
1900-1924 Private Domestic Domestic
<strong>2010</strong>-<strong>2040</strong> <strong>HAZARDS</strong> <strong>ANALYSIS</strong> <strong>PLAN</strong><br />
STATE & NATIONAL REGISTER OF HISTORICAL PLACES<br />
SEDGWICK COUNTY, KANSAS<br />
Site/Register Number Address Location Significance Period of<br />
Significance<br />
Topeka--Emporia Historic District<br />
#04000779<br />
US Post Office and Federal Building—<br />
Wichita<br />
Aka Wichita United States Post Office<br />
and Federal Building<br />
#89000792/173-5880-0035<br />
University Hall, Friends University<br />
Aka Garfield University<br />
#71000328/173-5880-001<br />
Virginia Apartment Building<br />
#01000233<br />
Wall, Judge T. B., House<br />
#83000439/173-5880-0098<br />
Wichita City Carnegie Library Building<br />
Aka Wichita Omnisphere and Science<br />
Center<br />
#87000971/173-5880-0004<br />
Wichita City Hall<br />
#71000329<br />
Wichita Historic Warehouse and<br />
Jobbers District<br />
Aka Old Town<br />
#03001172<br />
Wichita Wholesale Grocery Company<br />
#83000440/173-5880-0180<br />
Roughly N. Topeka<br />
and Emporia Aves.<br />
bet. 10th and 13th Sts<br />
Wichita<br />
Event,<br />
Architecture/<br />
Engineering<br />
401 N. Market Wichita Event,<br />
Architecture/<br />
Engineering<br />
2100 University Ave. Wichita Event,<br />
Architecture/<br />
Engineering<br />
401-405 E. Third St Wichita Architecture/<br />
Engineering<br />
622 N. St. Francis Ave Wichita Person,<br />
Architecture/<br />
Engineering<br />
220 S. Main Wichita Event,<br />
Architecture/<br />
Engineering<br />
204 S. Main St Wichita Event,<br />
Architecture/<br />
Engineering<br />
Bounded by the<br />
elevated RR tracks,<br />
Douglas and<br />
Washington Aves. and<br />
2nd St<br />
1875-1899,<br />
1900-1924,<br />
1925-1949<br />
Owner<br />
Historic<br />
Current<br />
Function Function<br />
Private Domestic Domestic<br />
1925-1949 Federal Government Government<br />
1875-1899 Private College College<br />
1900-1924 Private Domestic Domestic<br />
1875-1899,<br />
1900-1924<br />
Wichita Event 1875-1899,<br />
1900-1924,<br />
1925-1949,<br />
1950-1974<br />
619 E. William St Wichita Event,<br />
Architecture/<br />
Engineering<br />
1900-1924 Local<br />
Government<br />
1875-1899 Local<br />
Government<br />
Private Domestic Vacant/<br />
Not In Use<br />
Private<br />
Education<br />
Courthouse<br />
Commerce/<br />
Trade, Industry/<br />
Processing/<br />
Extraction<br />
1875-1899 Private Commerce/<br />
Trade<br />
Recreation And<br />
Culture<br />
Courthouse<br />
Commerce/<br />
Trade, Industry/<br />
Processing/<br />
Extraction<br />
Commerce/<br />
Trade<br />
129
<strong>2010</strong>-<strong>2040</strong> <strong>HAZARDS</strong> <strong>ANALYSIS</strong> <strong>PLAN</strong><br />
9.15 Nuclear Reactors, Materials, and Waste Sector (or Nuclear Sector)<br />
The Nuclear Reactors, Materials, and Waste Sector (or Nuclear Sector) owns, oversees, and operates<br />
commercial nuclear power reactors that provide power to millions of homes and businesses across the<br />
country. The sector also includes:<br />
Non-power nuclear reactors used <strong>for</strong> research, training, and radioisotope production.<br />
Nuclear and radiological materials used in medical, industrial, and academic settings.<br />
Nuclear fuel-cycle facilities.<br />
The transportation, storage, and disposal of nuclear and radioactive materials and waste.<br />
The Nuclear Sector is composed of the following primary subsectors: Nuclear Facilities, Nuclear Materials,<br />
and Nuclear Waste. Let’s look at each of these subsectors.<br />
Nuclear Facilities Subsector: includes power plants that use nuclear fission to produce electricity.<br />
This subsector also includes non-power reactors that are used <strong>for</strong> research and in education or<br />
medical applications. And finally, the subsector includes the deactivated facilities that have not been<br />
fully decontaminated and decommissioned <strong>for</strong> release back to public use. The only nuclear power<br />
plant in <strong>Kansas</strong> is Wolf Creek in Coffey <strong>County</strong> and serves the majority of the eastern portion of<br />
<strong>Kansas</strong> to include part of Kingman <strong>County</strong>.<br />
Nuclear Materials Subsector: ranges from nuclear fuel cycle facilities that produce fuel <strong>for</strong> use in<br />
nuclear power plants to companies that transport nuclear materials <strong>for</strong> use and <strong>for</strong> waste disposal.<br />
The subsector also includes radioactive material users such as medical, research, irradiation, and<br />
industrial facilities, and private-sector facilities that import, fabricate, or remanufacture radioactive<br />
materials.<br />
Nuclear Waste Subsector: encompasses a wide range of radioactive waste handling and storage<br />
facilities. These facilities handle low-level radioactive wastes such as contaminated clothing and<br />
medical equipment, as well as large quantities of naturally occurring radioactive materials. The<br />
Nuclear Waste Subsector also includes facilities that store spent reactor fuel assemblies in both wet<br />
and dry environments.<br />
While the loss of the electricity generated by a single nuclear power plant may have only a minor impact on<br />
the State’s overall electrical capacity, a terrorist attack on the Wolf Creek nuclear power plant or University of<br />
<strong>Kansas</strong> (Manhattan) research reactor would be a significant security event. For this reason, Nuclear Sector<br />
facilities are among the best defended and most physically hardened of all critical infrastructures. These<br />
facilities are designed to withstand such extreme events as hurricanes, tornadoes, and earthquakes.<br />
The sector shares dependencies and interdependencies with other CIKR sectors, including: Chemical,<br />
Communications, Emergency Services, Energy, Government Facilities, Healthcare and Public Health,<br />
In<strong>for</strong>mation Technology, and Transportation Systems.<br />
WOLF CREEK GENERATING STATION<br />
Wolf Creek Nuclear Operating Corporation operates the Wolf Creek Generating<br />
Station, <strong>Kansas</strong>' first nuclear power generating station, <strong>for</strong> three utility owners in<br />
<strong>Kansas</strong> and Missouri. Commissioned on September 3, 1985, the plant generates<br />
about 1,200 megawatt electrical, which is enough energy <strong>for</strong> approximately 800,000<br />
homes. Wolf Creek Generating Station is located in Coffey <strong>County</strong>, <strong>Kansas</strong>, just<br />
northeast of Burlington. We are about 55 miles south of Topeka, 90 miles southwest<br />
of <strong>Kansas</strong> City and 120 miles northeast of Wichita. Wolf Creek, dammed to create<br />
Coffey <strong>County</strong> Lake, provides cooling water <strong>for</strong> the reactor.<br />
130
<strong>2010</strong>-<strong>2040</strong> <strong>HAZARDS</strong> <strong>ANALYSIS</strong> <strong>PLAN</strong><br />
Wolf Creek Nuclear Operating Corporation is a subsidiary of three owners:<br />
<strong>Kansas</strong> City Power & Light, a Great Plains Energy Company (47 percent)<br />
Westar Energy Company (47 percent)<br />
<strong>Kansas</strong> Electric Power Cooperative (6 percent).<br />
NUCLEAR RELEASE CONSIDERATION<br />
On March 11, 2011, a 9.0 earthquake shook the island of Japan causing severe damage to the Fukushima<br />
Daiichi nuclear reactor commissioned in 1971. According to the <strong>Kansas</strong> Division of Emergency<br />
Management, the hydrogen gas released from the Fukushima nuclear reactor in Japan contained Cesium,<br />
Iodine, Strontium, and some noble gases. If a similar situation occurred at Wolf Creek generating station<br />
from the Humboldt Fault, the impact would be minimal. Planning <strong>for</strong> Wolf Creek, which is tested every two<br />
years <strong>for</strong> such an event, has three evacuation/shelter-in-place zones of one, five, and ten miles. The types<br />
of responses would be based on the level of radiation released and half-lives of those isotopes. Unlike the<br />
Chernobyl and Fukushima reactors, today’s reactors are stronger and better able to contain reactions<br />
through special venting systems.<br />
131
<strong>2010</strong>-<strong>2040</strong> <strong>HAZARDS</strong> <strong>ANALYSIS</strong> <strong>PLAN</strong><br />
9.16 POSTAL AND SHIPPING SECTOR<br />
This sector delivers private and commercial letters, packages, and bulk assets. The U.S. Postal Service<br />
and other carriers provide the services of this sector. Threats to this sector include physical vulnerabilities.<br />
The following agencies are responsible <strong>for</strong> this sector:<br />
Local: Public and Private Utilities, Petrochemical Companies<br />
State: <strong>Kansas</strong> Division of Emergency Management/<strong>Kansas</strong> Highway Patrol, <strong>Kansas</strong> Fire Marshall<br />
Federal: Department of Homeland Security<br />
The Postal and Shipping Sector’s collection, transportation, and distribution assets include complex<br />
intermodal networks linking millions of potential delivery points across the country and the globe. Given the<br />
sector’s vast networks of facilities, transportation assets, and cyber systems, achieving 100 percent security<br />
is not economically or technologically feasible. However, the sector envisions a resilient infrastructure in<br />
which threats can be quickly detected, consequences localized, and operational disruptions minimized. A key<br />
component of this vision is the United States Postal Inspection Service, one of the country's oldest Federal<br />
law en<strong>for</strong>cement agencies, which fights criminals who attack our Nation’s postal system and misuse it to<br />
threaten the American public.<br />
The Postal and Shipping Sector’s collection, transportation, and distribution assets include complex<br />
intermodal networks linking millions of potential delivery points across the country and the globe.<br />
The sector processes and distributes more than 170 billion pieces of mail domestically each year. However,<br />
the size and diversity of the Postal and Shipping Sector challenges ef<strong>for</strong>ts to protect its many different<br />
systems and assets.<br />
The Postal and Shipping Sector shares dependencies and interdependencies with other CIKR sectors,<br />
including: Banking and Finance, Commercial Facilities, Communications, Critical Manufacturing, Energy,<br />
Healthcare and Public Health, In<strong>for</strong>mation Technology, and Transportation Systems.<br />
U.S. Postal Service<br />
Wichita Stations and Outlets<br />
General Maintenance Facility – 7117 W Harry Street<br />
Downtown Station – 330 W 2 nd Street N<br />
North Wichita Station – 2325 N Arkansas Avenue<br />
Chisholm Station – 2510 S Elizabeth Avenue<br />
Wichita State University Station – 1845 Fairmount Street<br />
Dillons Georgetown Station – 1607 S Georgetown<br />
Dillons Wichita West 13 th Street Station – 3932 W 13 th Street N<br />
Dillons Wichita West 13 th Street Station – 8828 W 13 th Street N<br />
Munger Station – 1314 N Oliver Avenue<br />
Dillons Wichita South Seneca Station – 3211 S Seneca Street<br />
River City Station – 3241 S Hydraulic Street<br />
Dillons Wichita East 13 th Street Station – 6297 E 13 th Street N<br />
Dillons Wichita Central Avenue Station – 7707 E Central Avenue<br />
Dillons Wichita Broadway Street Station – 4747 S Broadway Street<br />
Dillons Wichita North Rock Road Station – 2244 N Rock Road<br />
Corporate Hills Station – 9350 E Corporate Hills Drive<br />
Dillons Wichita Woodlawn Station – 3707 N Woodlawn Boulevard<br />
Delano Station – 626 S Tyler Road<br />
Dillons Wichita Harry Street Station – 9450 E Harry Street<br />
Dillons Wichita West Central Avenue Station – 10515 W Central Avenue<br />
Dillons Wichita West 21 st Street Station – 10222 W 21 st Street N<br />
132
<strong>2010</strong>-<strong>2040</strong> <strong>HAZARDS</strong> <strong>ANALYSIS</strong> <strong>PLAN</strong><br />
Wichita Stations and Outlets- Cont’d<br />
Dillons Wichita Maple Street Station – 13415 W Maple Street<br />
Other Communities<br />
Park City Leekers #166 Station – 6223 N Broadway Street<br />
Kechi Station – 307 E Kechi Road<br />
Haysville Station – 224 W Grand Avenue<br />
Maize Station – 115 E Albert Street<br />
Dillons Derby Greenway Station – 200 W Greenway Street<br />
Derby Station – 201 W Greenway Street<br />
Valley Center Station – 205 E Main Street<br />
Dillons Derby North Rock Station – 1624 N Rock Road<br />
Colwich Station – 417 W Wichita Avenue<br />
Goddard Station – 328 N Main Street<br />
Clearwater Station – 640 N 4 th Street<br />
Mulvane Station – 410 E Main Street<br />
Peck Station – 328 W 7 th Street<br />
<strong>Sedgwick</strong> Station – 415 N Commercial Avenue<br />
Bentley Station – 140 S Wichita Street<br />
Andale Station – 318 N Main Street<br />
Garden Plain Station – 412 N Main Street<br />
Mount Hope Station – 125 W Main Street<br />
Viola Station – 205 S Main Street<br />
Cheney Station – 215 N Main Street<br />
Federal Express (FedEx)<br />
Wichita Stations and Outlets<br />
FedEx Office Print & Ship center – 240 S West Street, Suite 10a<br />
FedEx Express Ship Center – 1530 S Hoover Road<br />
OfficeMax – 6930 W Kellogg Drive<br />
The Packaging Store – 2110 N Maize Road, Suite 500<br />
OfficeMax – 2414 N Maize Road<br />
FedEx Office Print & Ship Center – 2441 N Maize Road, Suite 2507<br />
The Packaging Store – 6249 E 21 st Street N, Suite 120<br />
Custom Pack & Ship – 513 S Woodlawn Boulevard<br />
Postnet – 13303 W Maple Street, Suite 139<br />
FedEx Office Print & Ship Center – 7701 E Kellogg Drive<br />
OfficeMax – 8147 E Kellogg Drive<br />
OfficeMax – 3535 N Rock Road<br />
FedEx Office Print & Ship Center – 3605 N Rock Road<br />
Postnet – 2350 N Greenwich Road, Suite 100<br />
United Parcel Service<br />
Wichita Stations and Outlets<br />
Box Central Inc – 2920 W Central Avenue<br />
The UPS Store – 8918 W 21 st Street, N, Suite 200<br />
UPS Customer Center – 3003 S West Street<br />
Office Depot/Copy Center – 613 S Dugan Road<br />
The Mail Room – 2020 W 21 st Street N<br />
133
<strong>2010</strong>-<strong>2040</strong> <strong>HAZARDS</strong> <strong>ANALYSIS</strong> <strong>PLAN</strong><br />
Wichita Stations and Outlets – Cont’d<br />
The UPS Store – 2250 N Rock Road, Suite 118<br />
The UPS Store – 6505 E Central Avenue<br />
Office Deport/Copy Center – 3035 N Rock Road<br />
Box Central Inc – 5405 E Central Avenue<br />
The Packaging Store – 6249 E 21 st Street N, Suite 120<br />
One Stop Mail Stop – 513 S Woodlawn Avenue<br />
Postnet – 13303 W Maple Street, Suite139<br />
Postnet – 2350 N Greenwich Road, Suite 100<br />
Other Communities<br />
The UPS Store (Derby) – 620 N Rock Road<br />
134
<strong>2010</strong>-<strong>2040</strong> <strong>HAZARDS</strong> <strong>ANALYSIS</strong> <strong>PLAN</strong><br />
9.17 TRANSPORTATION SYSTEMS SECTOR<br />
This sector enables movement of people and assets that are vital to our economy, mobility, and security with<br />
the use of aviation, ships, rail, pipelines, highways, trucks, buses, and mass transit. Threats to this sector<br />
include physical vulnerabilities. The following agencies are responsible <strong>for</strong> this sector:<br />
Local: Public and Private Utilities, Petrochemical Companies<br />
State: <strong>Kansas</strong> Division of Emergency Management/<strong>Kansas</strong> Highway Patrol, <strong>Kansas</strong> Fire Marshall<br />
Federal: Department of Homeland Security<br />
The Transportation Systems Sector is a vast, open network of interdependent systems that delivers food,<br />
water, medicines, fuel, and other commodities, making it a highly attractive target <strong>for</strong> terrorists.<br />
What is unique about the Transportation Systems Sector is its part in the global transportation network. The<br />
Transportation Systems Sector relies on global partners to share critical in<strong>for</strong>mation that can lead to more<br />
in<strong>for</strong>med decisions by identifying and understanding threats, vulnerabilities, and consequences using global<br />
threat in<strong>for</strong>mation and assessments.<br />
The sector’s goals are to prevent and deter acts of terrorism using transportation means or against elements<br />
of the transportation system, to enhance resilience of the transportation system, and to improve the costeffective<br />
use of resources <strong>for</strong> transportation security.<br />
The sector is organized into the following six subsectors or ―modes‖:<br />
Aviation Mode: includes aircraft, air traffic control systems, and air cargo, as well as commercial,<br />
civil, and joint-use military airports, airfields, heliports, and seaplane bases.<br />
Maritime Mode: includes various maritime operations within the Maritime Transportation System<br />
(MTS) networks and have components that include vessels as well as approximately 95,000 miles of<br />
coastline, port facilities, waterways, and related infrastructure.<br />
Mass Transit and Passenger Rail Mode: comprised of multiple-occupancy vehicles designed to<br />
transport customers on local and regional routes, while the Highway Infrastructure and Motor<br />
Carriers mode encompasses more than 4 million miles of roadways and supporting infrastructure.<br />
Freight Rail Mode: includes hundreds of railroads, thousands of miles of track, and more than 1<br />
million cars and locomotives.<br />
Pipeline Security Mode: focuses on the infrastructure that carries natural gas, hazardous liquids, and<br />
various chemicals.<br />
The Transportation Systems Sector shares dependencies and interdependencies with all the other CIKR<br />
sectors, including: Agriculture and Food, Banking and Finance, Chemical, Commercial Facilities,<br />
Communications, Critical Manufacturing, Defense Industrial Base, Emergency Services, Energy,<br />
Government Facilities, In<strong>for</strong>mation Technology, and Postal and Shipping. In addition to cross-sector<br />
interdependencies, the Transportation Systems Sector must pay particular attention to interdependencies<br />
among the transportation modes.<br />
9.17.1 SAFETY<br />
KDOT maintains the <strong>Kansas</strong> Accident Records System (KARS) of crash data <strong>for</strong> the state. KARS contains<br />
in<strong>for</strong>mation on the number of crashes, contributing causes (road conditions, weather, animals, etc.), location,<br />
and severity (fatality, injury, or property damage only). In the region, there were 53,573 crashes resulting in<br />
23,820 injuries and 237 fatalities from 2004‐ 2008. Over two thirds of the crashes in the region were<br />
property damage only crashes; whereas, injury crashes accounted <strong>for</strong> over 31% of the crashes in the region.<br />
Fatal crashes accounted <strong>for</strong> less than 1% of the crashes in the region.<br />
Based on 2004‐ 2008 KARS data, the region experienced 217 fatal crashes that resulted in a total of 237<br />
deaths. The number of fatal crashes peaked in 2006 with 58 crashes involving a fatality. Fatal crashes have<br />
declined in the two years following 2006. The 28 fatal crashes in 2008 represent a 50% decrease since<br />
2006. While rural crashes account <strong>for</strong> 14% of the region’s total crashes, one out of every three (33%) fatal<br />
135
<strong>2010</strong>-<strong>2040</strong> <strong>HAZARDS</strong> <strong>ANALYSIS</strong> <strong>PLAN</strong><br />
crashes occurs in the rural areas. Nine of the top ten circumstances leading to regional crashes are related<br />
to driver behavior and driver related issues contributing to 90% of the crashes.<br />
9.17.2 SECURITY<br />
Some of the most critical transportation infrastructure in the region includes:<br />
Major highways<br />
Major bridges<br />
Railroad lines<br />
Pipelines<br />
Transit facilities<br />
Aviation facilities, including McConnell Air Force Base<br />
The Wichita Traffic Management Center (TMC) is vital to the implementation of the Intelligent Transportation<br />
System (ITS) architecture. The TMC monitors roads with cameras, coordinates operations with other<br />
agencies and emergency services, and provides in<strong>for</strong>mation to the public and local media. During an<br />
emergency, the TMC assists with alerting the public, media, and coordinating response ef<strong>for</strong>ts. Wichita<br />
Transit is in the process of deploying an Automatic Vehicle Locator (AVL) system. AVL systems calculate the<br />
real-time location of any vehicle equipped with a Global Positioning System (GPS) receiver. When combined<br />
with other ITS technologies, AVL can deliver many benefits such as real-time bus location and accurate<br />
prediction of arrival times.<br />
9.17.3 OPERATIONS AND MAINTENANCE<br />
Operations and maintenance covers a wide range of activities that are intended to keep transportation<br />
infrastructure, such as roads, paths, and buses, in good repair and functioning properly. Some of these<br />
activities include:<br />
Street sweeping<br />
Snow and ice removal<br />
Pavement and lane markings<br />
Traffic sign and signal repair<br />
Pothole and pavement patching<br />
Bridge inspections and repair<br />
Rail crossing inspections and repair<br />
Pavement resurfacing<br />
Vehicle maintenance<br />
System Management<br />
System management goes beyond operations and maintenance and seeks to optimize the per<strong>for</strong>mance of<br />
existing infrastructure. System management involves a wide range of techniques to maximize the ability of<br />
the existing transportation facilities to meet user demands. Some of these techniques include:<br />
Traffic incident management<br />
Travel in<strong>for</strong>mation services<br />
Roadway weather in<strong>for</strong>mation<br />
Automatic vehicle location<br />
Traffic signal coordination<br />
Work zone management<br />
Electronic payment/toll collection<br />
Emergency response and homeland security<br />
Freight management<br />
Transportation demand management<br />
136
<strong>2010</strong>-<strong>2040</strong> <strong>HAZARDS</strong> <strong>ANALYSIS</strong> <strong>PLAN</strong><br />
Transit fleet management and dispatch<br />
Congestion management<br />
Historical Overview<br />
9.17.4 HIGHWAYS<br />
On August 11, 1871, the county voted $200,000 in bonds to aid in the construction of a railroad. The railroad<br />
ran from Newton to Wichita and was completed on May 16, 1872. On June 8, 1872, the first shipment on the<br />
railroad was made and consisted of 18 cars of cattle. The <strong>Kansas</strong> Midland Railroad was built in 1887 and<br />
later sold to the St. Louis and San Francisco Railroad Company. 35<br />
In the spring of 1885, as Wichita experienced a growth boom and in an ef<strong>for</strong>t to have workers in Wichita<br />
commute back and <strong>for</strong>th to Valley Center, a means of transportation was needed. A transit company was<br />
organized to build and manage an interurban between Wichita and Valley Center. The Wichita terminal of<br />
the road was on Douglas Avenue, followed the street car track to Thirteenth Street, then came up Arkansas<br />
Avenue, the west one-half mile to the Santa Fe track, then following it to one mile south of Valley Center<br />
where it angled over to Meridian, then over to the station which was the <strong>for</strong>mer Carrothers’ Grocery Store in<br />
Valley Center. The motor cars, as they were called, contained a section <strong>for</strong> the engine and the coal bin.<br />
Coal or wood was used to furnish the steam. The remainder was filled with seats <strong>for</strong> the passengers. On<br />
busy days, a trailer would be fastened to the car to take care of surplus passengers. 36<br />
Types of transportation people use to get to work, and how many people use each type:<br />
WAMPO Region’s Eight Elements:<br />
Roadway provides an overview of the existing roadway network, regional roadway needs, existing<br />
plans, and recommendations to improve the network.<br />
Bicycle and Pedestrian provides an overview of the existing bicycle and pedestrian facilities, existing<br />
plans, trends and needs of the region, and recommendations to improve the walkability and<br />
bikeability of the region.<br />
Public Transportation provides an overview of the existing public transportation system, plans <strong>for</strong> the<br />
system, highlights regional needs, and recommends improvements to promote use of the system.<br />
Freight provides an overview of transportation modes used to move freight in the region, freight<br />
trends and needs, freight related plans, and recommendations to improve the freight transportation<br />
network.<br />
Aviation provides a brief summary of the existing regional facilities, historical and projected airport<br />
activity, plans and planned facilities, regional needs, and recommendations.<br />
Safety provides an overview of the regional safety issues and recommendations <strong>for</strong> improving safety.<br />
Security highlights transportation related security activities in the region, potential roles <strong>for</strong> WAMPO,<br />
and strategies to enhance WAMPO’s focus on interrelated security and transportation issues.<br />
Operations, Maintenance, and System Management discusses agencies’ roles, system<br />
management, and operations and maintenance.<br />
35 Valley Center: Its Founding & Major Events, Frank Hutchings, Valley Center, 1976<br />
36 The Founding of Valley Center, Genevieve May Rapp, Pgs 67-74, Wichita, 1931<br />
137
<strong>2010</strong>-<strong>2040</strong> <strong>HAZARDS</strong> <strong>ANALYSIS</strong> <strong>PLAN</strong><br />
Roadways<br />
There are approximately 5,000 miles of roadway in the region. Currently, vehicles travel almost 13 million<br />
miles and spend nearly 370,000 hours per day on the roadway network. By 2035, it is anticipated that<br />
vehicles will travel approximately 17 million miles and 480,000 hours per day.<br />
Functional classification is divided into three systems; arterial, collector, and local.<br />
Arterial<br />
The primary purpose of the arterial system is to move people and goods. Within the arterial system there are<br />
two sub‐classifications, the principal arterial system and the minor arterial system. The principal arterial<br />
system is a road network designated <strong>for</strong> the most traffic, the longest trips, and the highest speeds. The<br />
minor arterial system connects with the principal arterial system and provides service <strong>for</strong> shorter trips with<br />
less mobility but more access.<br />
Collector System<br />
Moves traffic between different areas, such as residential neighborhoods, commercial developments, and<br />
industrial areas. The collector system is intended to provide both mobility and access. The collector system<br />
includes three types of roadways; urban collectors, rural major collectors, and rural minor collectors.<br />
Local System<br />
The local system includes all roadways not on the arterial system or the collector system. The purpose of the<br />
local system is to provide access to adjoining land uses and funnel traffic to the arterial and collector<br />
systems.<br />
9.17.4.1 TRAFFIC DATA<br />
According to in<strong>for</strong>mation developed in the KDOT Traffic Flow Map that reported traffic counts <strong>for</strong> year ending<br />
June 30, 2009, the following maps (Wichita metropolitan area and <strong>Sedgwick</strong> <strong>County</strong>) show the traffic density<br />
of commercial versus regular traffic.<br />
138
<strong>2010</strong>-<strong>2040</strong> <strong>HAZARDS</strong> <strong>ANALYSIS</strong> <strong>PLAN</strong><br />
9.17.4.2 CONGESTION<br />
Traffic congestion occurs when the demand to use a road exceeds the roadway’s capacity. Congestion<br />
typically results in reduced travel speeds and increased travel time. The majority of congestion occurs in the<br />
AM (6‐10 AM) and PM (4‐8 PM) peak hours when people are commuting to and from work. Many of the<br />
areas that are currently seeing recurring congestion are crossings over the Wichita‐Valley Center Flood<br />
Control Project (Big Ditch) and portions of US‐54/400 (Kellogg) west of I‐135.<br />
Traffic densities in Wichita and <strong>Sedgwick</strong> <strong>County</strong> shows interstates are typically less than 10% commercial<br />
traffic, while most state highways carry 15% or greater commercial traffic. In<strong>for</strong>mation developed from<br />
industries and motor carriers shows hazardous materials routes are primarily state and federal highways.<br />
Hazardous materials transportation in communities is typically restricted from industrial facility to major<br />
highway.<br />
9.17.4.3 COMMUTER TRAVEL PATTERNS<br />
The following map illustrates major work trips between Wichita and the surrounding communities. Observing<br />
the volume of travel by privately owned vehicles and by shared-ride services will indicate possible corridors<br />
that could support express service. High-volume radial travel corridors leading from the surrounding area<br />
(service area 2) into the urbanized area (service area 1) will indicate which corridors are most appropriate <strong>for</strong><br />
commuter express service.<br />
139
<strong>2010</strong>-<strong>2040</strong> <strong>HAZARDS</strong> <strong>ANALYSIS</strong> <strong>PLAN</strong><br />
9.17.4.4 EVACUATION <strong>PLAN</strong>NING<br />
There is a probable or more likely scenario only a portion of an area would be evacuated and an unlikely<br />
catastrophic event where a large section would be evacuated. The following map shows the general<br />
population distribution by section based on <strong>2010</strong> census data (approximately 499,000) and does not<br />
necessarily reflect the concentration of people in that area depending on the time of day since population<br />
movement is dynamic and can change often due to working conditions, events, etc.<br />
The primary thoroughfares are the interstates, turnpike and state highways, with some heavier concentrated<br />
movement of vehicles in southeastern Wichita based on KDOT’s annual average daily traffic count<br />
in<strong>for</strong>mation. Principal movement will be based on the easiest accessibility to these major thoroughfares<br />
which typically would follow the pre-designated snow routes which are section roads in the county and city.<br />
140
<strong>2010</strong>-<strong>2040</strong> <strong>HAZARDS</strong> <strong>ANALYSIS</strong> <strong>PLAN</strong><br />
EVACUATION SECTOR MAP<br />
In the case of evacuation, the following in<strong>for</strong>mation is derived from "Lessons From Katrina", Sep 20, 2005,<br />
Victoria Transport Policy:<br />
Maximum single lane capacity under normal conditions: 2,000 vehicles per hour<br />
Maximum single lane capacity caused by congestion, weather, towing vehicles, accidents, and<br />
mechanical problems: 1,000 vehicles per hour<br />
Estimated number of occupants per vehicle: 2.5<br />
Estimated number of evacuees per hour per lane: 2,500<br />
Bussing estimation of 600 busses per hour per lane with average capacity of 25 or approximately<br />
15,000 passengers per hour<br />
It is estimated that the time to evacuate a given area can range from 1 to 5 hours <strong>for</strong> normal traffic<br />
conditions. If the Governor of <strong>Kansas</strong> authorizes the use of contraflow (one-direction) travel, this time can be<br />
reduced by approximately 40 percent. It should be noted that an orderly evacuation of an area will be<br />
dependent on the time needed by individuals preparing to leave their locations in addition to the travel time<br />
which could add 15 to 30 minutes. The use of contraflow is strongly cautioned since this allows <strong>for</strong> only onedirection<br />
of travel and emergency vehicles may be hindered in responding to injury accidents that would<br />
occur. Usages of the interstate shoulders are likely to be used by individuals evacuating thus increasing the<br />
safety concerns of an orderly evacuation. It should be noted that cities outside of <strong>Sedgwick</strong> <strong>County</strong> will have<br />
increased traffic proceeding through their area, and restricting the use of the contraflow concept would help<br />
alleviate safety concerns and congestions <strong>for</strong> those cities.<br />
141
<strong>2010</strong>-<strong>2040</strong> <strong>HAZARDS</strong> <strong>ANALYSIS</strong> <strong>PLAN</strong><br />
9.17.4.5 STRATEGIC HIGHWAY CORRIDOR NETWORK (STRAHNET)<br />
The U.S. Strategic Highway Corridor Network<br />
(STRAHNET) system consists of 61,000 miles of<br />
public highways, designated by the Federal Highway<br />
Administration in partnership with the Department of<br />
Defense’s MTMC, which link more than 200 military<br />
installations and ports.<br />
The STRAHNET is important to the United States'<br />
strategic defense policy and which provide defense<br />
access, continuity and emergency capabilities <strong>for</strong><br />
defense purposes to include movement of personnel,<br />
materials, and equipment in both peace time and war<br />
time. The network is comprised of major strategic<br />
network connectors and intermodal connectors.<br />
Major Strategic Highway Network Connectors are highways providing access between major military<br />
installations and highways that are part of the Strategic Highway Network. Intermodal Connectors are<br />
highways providing access between major intermodal facilities and the other four subsystems making up the<br />
National Highway System. Although there are no non-interstate STRAHNET roads in <strong>Kansas</strong>, I-35, I-135<br />
and I-235 are designated interstate STRAHNET roads in the south-central <strong>Kansas</strong> area. Mid-Continent<br />
Airport is a designated intermodal connector <strong>for</strong> the south-central <strong>Kansas</strong> area. The Department of Energy<br />
utilizes the STRAHNET on a routine basis with traceable shipments by the State of <strong>Kansas</strong> Division of<br />
Emergency Management via the U.S. Transportation Command (USTRANSCOM) global position satellitetracking<br />
program.<br />
142
<strong>2010</strong>-<strong>2040</strong> <strong>HAZARDS</strong> <strong>ANALYSIS</strong> <strong>PLAN</strong><br />
9.17.4.6 DERBY-MULVANE JOINT AREA <strong>PLAN</strong><br />
The Derby-Mulvane Joint Area Plan is a plan <strong>for</strong> the area located between the City of Derby and City of<br />
Mulvane, bounded by the Derby City limits and 87th Street to the north; 127th Street to the east; a half mile<br />
south of 103rd Street and the Mulvane City limits; and the Arkansas River to the west.<br />
Existing Conditions Analysis Summary<br />
Multiple streams and their tributaries travel through the plan area, generally flowing in a southerly direction.<br />
The topography in the area is varied, with relatively well defined stream corridors. However, flooding is a<br />
concern. Approximately 15 percent of the plan area lands are within the F.E.M.A. identified 100 year<br />
floodplain. The plan area, including the Arkansas River, may provide habitat <strong>for</strong> four different threatened<br />
animal species. A majority of lands in the plan area are also well suited <strong>for</strong> agricultural activity. Most are in<br />
agricultural use, with clusters of unincorporated large-lot residential properties scattered throughout the plan<br />
area. The residential users are primarily located near edges of Derby and Mulvane, in the north and south<br />
portions of the plan area. The eastern half of the area is not well suited <strong>for</strong> septic systems. The plan area is<br />
served by paramedic, medical transport, fire, and law en<strong>for</strong>cement services. Less than half of the plan area<br />
is within a storm siren coverage area. Water, electric, and gas services are also available. Two school<br />
districts serve the area. No public libraries or public parks are located within the area, but are available within<br />
Derby or Mulvane. Recent regional transportation studies have identified the need <strong>for</strong> an additional roadway<br />
bridge over the Arkansas River, a segment of a four-lane access controlled divided roadway loop, and a bike<br />
path within the plan area. By 2030, four roadway bridges will require upgrades or replacement. The plan area<br />
has one of the highest train traffic volumes in <strong>Sedgwick</strong> <strong>County</strong>. Three separate railroad corridors travel<br />
through the plan area, with a combined average daily traffic total of more than 90 trains per day. The cities of<br />
Derby and Mulvane are greatly able to influence the future development of the area through the use of the<br />
143
<strong>2010</strong>-<strong>2040</strong> <strong>HAZARDS</strong> <strong>ANALYSIS</strong> <strong>PLAN</strong><br />
Extraterritorial Subdivision Regulation Areas and Zoning Areas of Influence. These regulatory areas allow<br />
the municipalities to regulate subdivision/platting activities and to influence <strong>County</strong> zoning decisions. The<br />
boundaries <strong>for</strong> both regulatory areas are the same, extending from the Arkansas River to Woodlawn<br />
Boulevard, then along 95th Street South to 127th Street.<br />
Future Urban Growth Estimates Analysis Summary<br />
Population and job growth in the plan area by the year 2030 will be limited. The areas of growth will primarily<br />
be concentrated near the existing Derby city limits, Mulvane city limits, and K-15. The majority of the plan<br />
area will remain in agricultural use by 2035. The Wichita-<strong>Sedgwick</strong> <strong>County</strong> Metropolitan Area Planning<br />
Department estimates that approximately 650 new homes and approximately 65 new jobs will be created<br />
within the plan area by the year 2030.<br />
The amount of land in the plan area identified in either the Derby or Mulvane comprehensive plans <strong>for</strong> future<br />
development is approximately four times the amount necessary to accommodate the <strong>for</strong>ecasted residential<br />
demand. The excess capacity allows <strong>for</strong> development flexibility, but also makes the sequencing and location<br />
of infrastructure important considerations <strong>for</strong> local governments.<br />
144
<strong>2010</strong>-<strong>2040</strong> <strong>HAZARDS</strong> <strong>ANALYSIS</strong> <strong>PLAN</strong><br />
9.17.4.7 SOUTH AREA TRANSPORTATION STUDY (SATS)<br />
Communities in the southern portion of the Wichita Area Metropolitan Planning Organization (WAMPO)<br />
planning region are interested in the potential to improve mobility and access to and within this region.<br />
According to the WAMPO 2030 Long Range Transportation Plan (LRTP), key issues <strong>for</strong>mulated by citizens<br />
of the Wichita area included providing good roadway connections between cities, from cities to the highway<br />
system, and reducing congestion on the existing roadway system.<br />
The South Area Transportation Study (SATS) sought to ad-dress these concerns by assessing the future<br />
mobility needs of the southern portion of the WAMPO planning region. This was accomplished by evaluating<br />
various transportation improvements from a broad perspective to determine which strategy best addresses<br />
the specific transportation needs of the southern Wichita Metropolitan Area. The SATS focuses on linkages<br />
between north and south parts of the Wichita Metropolitan Area and linkages between the cities in the South<br />
Area and in and out of <strong>Sedgwick</strong> <strong>County</strong>.<br />
The Study Area <strong>for</strong> the SATS consists of a significant portion of the southern half of the WAMPO planning<br />
region. The approximate study boundaries are:<br />
On the north, US 54/400 from Andover in the east to Goddard in the west;<br />
On the west, a line running south from the west of Goddard, approximately South 263rd Street West,<br />
to the Ninnescah River and following the river to the <strong>Sedgwick</strong> <strong>County</strong>/Sumner <strong>County</strong> line;<br />
On the south, along the <strong>Sedgwick</strong> <strong>County</strong>/Sumner <strong>County</strong> line, including all of Mulvane; and,<br />
On the east, along SW Meadowlark Road in Butler <strong>County</strong>.<br />
145
<strong>2010</strong>-<strong>2040</strong> <strong>HAZARDS</strong> <strong>ANALYSIS</strong> <strong>PLAN</strong><br />
The SATS is a cooperative ef<strong>for</strong>t involving WAMPO and the local units of government in the southeast and<br />
southwest quadrants of the WAMPO planning area including the cities of Andover, Clearwater, Derby,<br />
Goddard, Haysville, Mulvane, and Wichita along with <strong>Sedgwick</strong> <strong>County</strong>, Butler <strong>County</strong>, the <strong>Kansas</strong><br />
Department of Transportation, the Federal Highway Administration, and the <strong>Kansas</strong> Turnpike Authority.<br />
Study Area Cities<br />
Andover: The City of Andover, <strong>Kansas</strong> has a population of 6,698 persons according to the 2000 census. The<br />
major transportation routes through Andover are I-35, US-54/400, Central Avenue, Andover Road, Harry<br />
Street, and 21st Street North. Key commercial areas are located near the intersection of Andover Road and<br />
Central Avenue and along US-54/400. The Comprehensive Development Plan <strong>for</strong> the Andover Area calls <strong>for</strong><br />
major commercial development to remain in these areas. As well as, new commercial development at the<br />
Decker/Kiser plat at 21st Street North and Andover Road. This development is north of the SATS Area.<br />
Clearwater: The City of Clearwater, <strong>Kansas</strong> has a population of 2,178 persons according to the 2000 census.<br />
The 2030 population projection <strong>for</strong> Clearwater is 3,514 persons. The major transportation route through the<br />
city is 103rd Street South, with a small retail commercial district located along it.<br />
Derby: The City of Derby, <strong>Kansas</strong> has a population of 17,807 persons according to the 2000 census. It is<br />
projected that in 2030 the population of Derby will be 32,045 persons. The major transportation routes<br />
through the city are K-15, Rock Road, 63rd Street South, and 71st Street South. A key industrial area is<br />
located along K-15 while key commercial areas are located along both K-15 and Rock Road. The City of<br />
Derby Comprehensive Plan calls <strong>for</strong> more than 7,000 new acres of zoned land by 2030 with much of the<br />
focus on the K-15 business corridor.<br />
Goddard: The City of Goddard, <strong>Kansas</strong> has a population of 2,037 persons according to the 2000 census. It is<br />
projected that in 2030 the population of the city will be 5,274 persons. The major transportation route<br />
through Goddard is US-54/400. US-54/400 has small pockets of industry and a commercial strip. Goddard’s<br />
long term economic development goals include enhancement of the central business district through<br />
streetscapes and encouraging redevelopment through incentives. Their comprehensive plan indicates that<br />
about 1,200 new acres of zoned land will be needed by 2022, including about 740 acres of residential and<br />
about 260 acres of industrial lands.<br />
Haysville: The City of Haysville, <strong>Kansas</strong> has a population of 8,502 persons according the 2000 census. The<br />
2030 population projection <strong>for</strong> the city is 16,412 persons. The major transportation routes through Haysville<br />
are I-35, I-135, Broadway Avenue, Seneca Street, 71st Street South, and 79th Street South. Many<br />
commercial areas in Haysville are in an on-going redevelopment process as a result of the May 1999<br />
tornado. Broadway Avenue and Seneca/Main Street are major locations of redevelopment. The future land<br />
use plan <strong>for</strong> the city identifies the area between Broadway and I-135 as a major regional commercial area.<br />
Mulvane: The City of Mulvane, <strong>Kansas</strong> has a population of 4,154 persons according to the 2000 census. The<br />
2030 population projection <strong>for</strong> the city is 6,533 persons. The major transportation routes through Mulvane<br />
are K-15, K-53, and Rock Road. Key commercial areas include those near the intersection of K-15 and Rock<br />
Road and the downtown central business district along K-53. According to the Comprehensive Development<br />
Plan <strong>for</strong> the Mulvane Area, by 2012, 181 acres of new residential property will be needed. It also identifies<br />
the Central Business District (CBD) and 2nd Street as areas of continued commercial development. In<br />
addition, the intersection of Rock Road and 111th Street South has been approved <strong>for</strong> future commercial<br />
development.<br />
Wichita: The City of Wichita has a population of 344,284 persons according to the 2000 census. It is<br />
projected that in 2030 the population of the city will be 412,460 persons. In the near future, the City of<br />
Wichita’s predominately east-west growth pattern is expected to continue. Western Wichita is projected to<br />
experience a population increase of approximately 31,000 people between 2005 and 2030. In eastern<br />
Wichita, the population is expected to increase by 20,000 persons.7 Major transportation routes through<br />
Wichita include I-35, I-135/US-81, US-54/400, and K-96. Key employment nodes include downtown Wichita;<br />
industrial areas north of downtown along I-135 and K-96; and industrial and commercial areas in eastern<br />
146
<strong>2010</strong>-<strong>2040</strong> <strong>HAZARDS</strong> <strong>ANALYSIS</strong> <strong>PLAN</strong><br />
Wichita along Greenwich Road. US-54/400, although limited access along much of its length through<br />
Wichita, has significant commercial activity along it.<br />
Note: 2030 population projects used <strong>for</strong> the SATS comes from the Wichita-<strong>Sedgwick</strong> <strong>County</strong> Metropolitan Area<br />
Planning Department’s ―2007 Development Trends Report,‖ 2007<br />
2030 Traffic Projections<br />
The higher volume local roadways in 2030 are <strong>for</strong>ecast to include:<br />
Rock Road between Kellogg Avenue and 63rd Street South (23,400 to 24,400 vpd)<br />
Hillside Street near Kellogg Avenue (14,500 vpd)<br />
Seneca Street between I-235 and 63rd Street South (19,700 vpd)<br />
Meridian Avenue near Kellogg Avenue (13,400 vpd)<br />
West Street near Kellogg Avenue (24,200 vpd)<br />
47th Street South between I-35 and K-15 (31,000 vpd)<br />
63rd Street South between I-35 and K-15 (20,900 vpd)<br />
71st Street South between K-15 and Rock Road (21,400 vpd)<br />
83rd Street South Crossing of Arkansas River (21,400 vpd)<br />
Interstate and state highways carry much higher volumes of traffic through the SATS Area than the local<br />
roads. The following are the <strong>for</strong>ecast 2030 volumes of the key highways in the SATS Area.<br />
I-35 – 22,600 to 36,200 vpd depending on location<br />
I-135 – 45,100 to 77,900 vpd depending on location<br />
I-235 – 53,800 to 57,100 vpd depending on location<br />
K-15 – 25,800 to 55,000 vpd depending on location<br />
K-42 – 8,900 to 41,000 vpd depending on location<br />
9.17.4.8 NATIONAL HIGHWAY SYSTEM (NHS)<br />
Roadways included on the NHS are important to the nation’s economy, defense, and mobility. The NHS is a<br />
161,000 mile network of roads throughout the U.S., including the Interstate Highway System and other<br />
roadways that are deemed important to the nation as a whole by Congress. The following roadways within<br />
the WAMPO region are on the NHS:<br />
I-135<br />
I-35<br />
I-235<br />
US-54/400 (Kellogg)<br />
K-254<br />
K-96<br />
K-15<br />
Mid-Continent Drive<br />
Air Cargo Road<br />
South Area Transportation Study (SATS): Completed in 2008, addressed mobility and access concerns in<br />
the southern portion of the region.<br />
Highways<br />
9.17.4.9 CONDITION OF TRANSPORTATION<br />
In<strong>for</strong>mation obtained from the <strong>Kansas</strong> Department of Transportation (KDOT) 2002 Pavement Management<br />
In<strong>for</strong>mation System (PMIS) shows District 5 has a total of 2,029 miles of surveyed <strong>Kansas</strong>’s highways.<br />
147
<strong>2010</strong>-<strong>2040</strong> <strong>HAZARDS</strong> <strong>ANALYSIS</strong> <strong>PLAN</strong><br />
Per<strong>for</strong>mance level assessments of the highways were broken down to those roads not requiring corrective<br />
action, those requiring at least routine maintenance, and those requiring rehabilitation action beyond routine<br />
maintenance.<br />
Bridges<br />
A bridge condition report generated by the KDOT Office of Chief Counsel was reviewed to determine the<br />
condition of each of the 3,744 bridges in each of the six counties in south-central <strong>Kansas</strong>. In<strong>for</strong>mation<br />
contained in the report shows the sufficiency ratings and locations of the bridges. The sufficiency ratings are<br />
a method of evaluating factors that are indicative of bridge sufficiency to remain in service. The result of this<br />
method is a percentage in which 100% would represent an entirely sufficient bridge and zero percent would<br />
represent an entirely insufficient or deficient bridge.<br />
In order to better define bridge conditions <strong>for</strong> each of the counties, the sufficiency ratings were divided into<br />
quarters. The following ratings are defined in this study as follows:<br />
Sufficient 75.1% to 100%<br />
Semi-Sufficient 50.1 to 75%<br />
Semi-Deficient 25.1% to 50%<br />
Deficient 0% to 25%<br />
A total of 1,267 bridges are rated in <strong>Sedgwick</strong> <strong>County</strong> by the KDOT of which nine are classified deficient, 64<br />
are classified as semi-deficient, 187 are classified as semi-sufficient, and 936 are classified as sufficient.<br />
Those bridges considered as deficient are identified at the locations and rated conditions on the next page.<br />
DEFICIENT BRIDGES IN SEDGWICK COUNTY<br />
Structure Number<br />
Sufficiency<br />
Rating<br />
Features<br />
Intersected<br />
Facility Carried<br />
999908100871571 5.3 Cowskin Creek US-81 Hwy<br />
530400870RIOP10 18.7<br />
Rock Island<br />
Railroad<br />
South Broadway<br />
000870819005884 18.8 Gooseberry Creek Local Road<br />
000870825606320 19.9<br />
000870781006341 21.9<br />
000870789006403 22.4<br />
430400876500050 23.8<br />
Tributary Big<br />
Arkansas River<br />
Tributary to<br />
Ninnescah River<br />
Tributary to<br />
Ninnescah River<br />
East Fork Chisholm<br />
Creek<br />
Local Road<br />
Local Road<br />
Local Road<br />
21 st Street North<br />
000870805005987 24.3 Big Arkansas River Local Road<br />
000870805005988 24.3 Big Arkansas River Local Road<br />
Location<br />
3.08 mi N Sumner<br />
Co Line<br />
Broadway at<br />
34 th Street South<br />
4.0E 0.4S<br />
<strong>Sedgwick</strong><br />
1.4W 2.0N of<br />
Derby<br />
1.0W 6.1S of<br />
Garden Plain<br />
1.0E 2.7N of Viola<br />
21 st St N WB at<br />
New York<br />
1.0W 3.3N of<br />
Maize<br />
1.0W 3.2N of<br />
Maize<br />
148
<strong>2010</strong>-<strong>2040</strong> <strong>HAZARDS</strong> <strong>ANALYSIS</strong> <strong>PLAN</strong><br />
Existing Facilities<br />
9.17.5 BICYCLE AND PEDESTRIAN<br />
Sidewalks – Provides a separate, relatively safe route on which to walk or bike. Safe Routes to<br />
School (SRTS) program has encouraged greater interest in developing sidewalks to connect<br />
neighborhoods and schools.<br />
Multi-use Paths – There are approximately 107 miles of multi-use paths in the region. Existing<br />
multiuse paths, such as the Arkansas River, <strong>Sedgwick</strong> <strong>County</strong> Zoo Park, and Derby paths are each<br />
more than 10 miles long and provide recreation and transportation connections.<br />
Rails-to-Trails – These are abandoned rail lines that are converted <strong>for</strong> pathway use. A regional<br />
example is the Prairie Sunset Trail, which connects Goddard to Garden Plain.<br />
Public transportation provides passenger transportation services <strong>for</strong> the general public and is provided by<br />
many different agencies. These include:<br />
Wichita Transit<br />
Taxicab companies<br />
Non-profit organizations<br />
Private institutions<br />
Government agencies<br />
9.17.6 MOTOR CARRIERS<br />
As reported by the Department of Transportation, statistics <strong>for</strong> the State of <strong>Kansas</strong> shows accidents involving<br />
motor carriers mostly occur on weekdays in rural areas on non-divided highways and during the day (6:00<br />
AM to 6:00 PM) by licensed drivers in non-placarded box semi-tractor/trailers on dry pavement.<br />
Approximately 40% of motor carrier accidents are <strong>Kansas</strong> based companies and primarily involve gases and<br />
flammable liquid commodity loads.<br />
Safety and Fitness Electronic Records (SAFER) System<br />
The SAFER system is a component of the Intelligent Transportation System (ITS) that is being designed to<br />
increase roadway safety, reduce motorist delays and air pollution, and improve the overall productivity of<br />
commercial vehicle operations (CVO) through the use of advanced technology. The current focus is on<br />
creating transparent borders <strong>for</strong> interstate commercial vehicles and improving the safety of commercial<br />
vehicle operations. Access is provided to Carrier Snapshots, a concise electronic record of a carrier’s<br />
identification, size, commodity in<strong>for</strong>mation, and safety record, including the safety rating (if any), a roadside<br />
out-of-service inspection summary, and crash in<strong>for</strong>mation.<br />
Developed by the Johns Hopkins University Applied Physics Laboratory and maintained by the Volpe<br />
National Transportation Systems Center, under contract to the Federal Motor Carrier Safety Administration<br />
(FMCSA), SAFER uses carrier in<strong>for</strong>mation from existing government motor carrier safety databases.<br />
Presently, it consists of interstate carrier data and several states' intrastate data. Operational data such as<br />
inspections and crashes are generally only presented <strong>for</strong> interstate carriers, but plans are to include them <strong>for</strong><br />
the intrastate carriers at a later time.<br />
The SAFER system is now being expanded to include the capability to provide carrier, vehicle, and driver<br />
safety and credential in<strong>for</strong>mation to fixed and mobile roadside inspection stations. This in<strong>for</strong>mation will allow<br />
the roadside inspector to select vehicles and/or drivers <strong>for</strong> inspection based on the number of prior carrier<br />
inspections, as well as carrier, vehicle, and driver safety and credential historical in<strong>for</strong>mation. The following<br />
table contains in<strong>for</strong>mation regarding 44 motor carriers know to transport chemicals or other hazardous<br />
materials within south-central <strong>Kansas</strong>. As noted on the table, all of the carriers were reported to have<br />
satisfactory safety ratings with 15 carriers reported to be out of service more than the national average.<br />
149
<strong>2010</strong>-<strong>2040</strong> <strong>HAZARDS</strong> <strong>ANALYSIS</strong> <strong>PLAN</strong><br />
150
<strong>2010</strong>-<strong>2040</strong> <strong>HAZARDS</strong> <strong>ANALYSIS</strong> <strong>PLAN</strong><br />
9.17.7 AVIATION<br />
9.17.7.1 INTERMODAL FACILITIES<br />
Mid‐Continent Airport serves as a major intermodal facility in the region. An intermodal facility provides <strong>for</strong><br />
the transfer of freight from one mode to another (e.g., air to truck and vice versa). Mid‐Continent Airport is<br />
connected to the regional roadway network, allowing freight to flow into and out of the airport via truck. This<br />
connection, provided on Mid‐Continent Drive and Air Cargo Road, is the only intermodal connector in the<br />
region. Mid Continent airport serves as an intermodal facility to transfer freight from air to truck and truck to<br />
air. The United States Postal Service (USPS) operates an intermodal facility to transfer mail and freight from<br />
trucks coming from other regions to trucks that deliver to postal distribution centers in the WAMPO region.<br />
As stated earlier, the WAMPO region is an active location <strong>for</strong> the transfer of agricultural goods from rural<br />
<strong>Kansas</strong> to the national rail system. There are six truck-to-rail and rail-to-truck intermodal facilities operating in<br />
the WAMPO region. Institutional issues <strong>for</strong> the operation of the Wichita Terminal, as well as being<br />
land‐locked, cause periodic delays in transferring goods from the short line railroads to the BNSF and<br />
UPRR railroads.<br />
All intermodal facilities are located inside or within one mile of the corporate limits of the City of Wichita. As<br />
such they can have an influence on traffic within and around the facility. Rail relocations, as identified<br />
previously, allow <strong>for</strong> moving rail to areas outside of the City core and can provide room <strong>for</strong> intermodal<br />
facilities to expand. Maintaining the existing street and highway system may help in mitigating the effects<br />
of traffic in and around existing intermodal facilities.<br />
151
<strong>2010</strong>-<strong>2040</strong> <strong>HAZARDS</strong> <strong>ANALYSIS</strong> <strong>PLAN</strong><br />
The region is also home to eight private intermodal facilities that transfer freight from one mode of<br />
transportation to another.<br />
Emery Forwarding – Air & Truck<br />
USPS Remote, Inc. – Truck & Truck<br />
Mulvane Cooperative – Rail & Truck<br />
Cereal Food Processors, Inc. – Rail & Truck<br />
Garvey Elevators, Inc. – Rail & Truck<br />
Heiman Elevator, Inc. – Rail & Truck<br />
Garvey Public Warehouse – Rail &Truck<br />
CTS Bulk Terminal – Rail & Truck<br />
The WAMPO region is served by one commercial and one regional airport. Wichita Mid‐ Continent Airport,<br />
the largest airport in <strong>Kansas</strong>, serves as the primary airport <strong>for</strong> passenger service and goods movement.<br />
Colonel James Jabara Airport serves as a general aviation reliever, providing an option <strong>for</strong> smaller aircraft<br />
such as private jets. There are also privately owned airports in the region which include the Hawker<br />
Beechcraft Factory, Cessna Aircraft Field, Maize Airport, Riverside Airport, Westport Airport, and Westport<br />
Auxiliary Airport. In addition, there are other privately owned airfields within the region.<br />
9.17.7.2 KASP AIRPORT ROLE DESIGNATION<br />
The <strong>Kansas</strong> Airport System Plan (KASP) puts airports into five categories based on the role they serve:<br />
commercial service, regional, business, community, and basic.<br />
Commercial service airports accommodate scheduled major/national or regional/commercial air<br />
carrier service.<br />
Regional airports accommodate regional economic activities, connect the state and national<br />
economies, and serve all types of general aviation aircraft.<br />
Business airports accommodate local business activities and general aviation users.<br />
Community airports serve a supplemental role in local economies, primarily serving business,<br />
recreational, and personal flying.<br />
Basic airports serve a limited role in the local economy, primarily serving recreational and personal<br />
flying.<br />
The 2008 KASP identifies eight airports in the WAMPO region:<br />
Hawker Beechcraft Factory – Regional<br />
Cessna Aircraft Field – Business<br />
Colonel James Jabara Airport – Regional<br />
Maize Airport – Basic<br />
Riverside Airport – Business<br />
Wichita Mid-Continent Airport – Commercial Service<br />
Westport Airport – Community<br />
Westport Auxiliary – Basic<br />
9.17.7.3 AVIATION FACILITIES<br />
9.17.7.3.1 WICHITA MID-CONTINENT AIRPORT<br />
The Wichita Mid‐Continent (ICT) Airport is a commercial service airport that serves as the primary hub <strong>for</strong> air<br />
travel in the WAMPO region. The airport is located approximately five miles southwest of the central<br />
business district in Wichita and is bordered on the north by US‐54/400 (Kellogg) and on the south by K‐42.<br />
ICT is owned by the Wichita Airport Authority and operated by the City of Wichita Department of Airports.<br />
The Wichita City Council, which also serves as the Wichita Airport Authority Board, makes final decisions<br />
regarding the airport.<br />
152
<strong>2010</strong>-<strong>2040</strong> <strong>HAZARDS</strong> <strong>ANALYSIS</strong> <strong>PLAN</strong><br />
Wichita Mid‐Continent (ICT) Airport is the only airport in the WAMPO region that is equipped to handle<br />
large‐scale commercial freight movements, and operates and maintains runways that can handle<br />
wide‐body aircraft. As such, the ICT accounts <strong>for</strong> the majority of air cargo tonnage shipped into and out of<br />
<strong>Kansas</strong>. It is anticipated that Mid‐Continent Airport will enplane and deplane approximately 78,000 tons of<br />
freight in 2023, up 200% from the 25,000 tons of freight enplaned and deplaned in <strong>2010</strong>.<br />
MID-CONTINENT AIRPORT STATISTICS<br />
AIRCRAFT SPECIFICATIONS<br />
Normal Air Traffic Aircraft Types: A320 (Passenger)/MD-80 (Passenger), B757/A300<br />
(Cargo)<br />
Smallest Aircraft Type Serviced: Cessna 208 Caravan and Fairchild Metro<br />
Helicopter Services: (1) <strong>Kansas</strong> Highway Patrol, (2) Wichita Police, (2) EagleMed<br />
Airport Operations<br />
Air Carrier Daily Departures per Day: 39<br />
Air Cargo (Tons) Flown In per Day: 40<br />
Air Cargo (Tons) Flown Out per Day: 31<br />
Mail (Tons) Flown Out per Day: 2<br />
Civilian<br />
AIRCRAFT TYPES/FUEL CAPACITIES<br />
Boeing 757: 11,489 Gallons/78,585 Lb (Cargo)<br />
Airbus A300: 18,000 Gallons/123,120 Lb (Cargo)<br />
Airbus A320: 6,400 Gallons/43,775 Lb (Passenger)<br />
MD-80: 5,840 Gallons/39,500 Lb (Passenger)<br />
Cessna 208: 332 Gallons/1,990 Lb<br />
Fairchild metro: 643 Gallons/39,500 Lb (Cargo)<br />
Military<br />
KC-135R: 35,803 Gallons/241,200 Lb<br />
T-38: 598 Gallons/4,029 Lb<br />
T-2: Not Available<br />
T6: 165 Gallons/1,112 Lb<br />
Largest Aircraft Capability:<br />
Boeing 747-300: 53,864 Gallons/364,300 Lb<br />
Boeing 747-400: 93,864 Gallons/634,850 Lb<br />
Antonov An-1234: 92,128 Gallons/621,864 Lb<br />
ICT currently operates an air cargo terminal that is used by the cargo carriers to sort air freight. All cargo<br />
carriers operate from an air cargo apron located east of Runway 1L/19R. It encompasses approximately<br />
65,000 square yards <strong>for</strong> aircraft movement and parking. Due to its central U.S. location, ICT accommodates<br />
a considerable number of passenger and cargo medical and mechanical emergency ―diverts‖ <strong>for</strong> aircraft not<br />
regularly scheduled to arrive/depart ICT).<br />
The apron is also used to store ground servicing equipment along the eastern portion of the apron. Two<br />
additional cargo buildings are exclusively (private) operated on the Airport, also located on the east portion of<br />
the air cargo apron. Mid Continent Airport also owns and maintains a fleet of 13 snow removal vehicles and<br />
equipment to maintain the aprons, taxiways and runways in winter weather conditions.<br />
153
<strong>2010</strong>-<strong>2040</strong> <strong>HAZARDS</strong> <strong>ANALYSIS</strong> <strong>PLAN</strong><br />
Mid‐Continent Airport has Aircraft Rescue and Firefighting Facility (ARFF) that houses equipment to respond<br />
to incidents at the airport. Equipment currently includes:<br />
A rapid response vehicle (Safety 1);<br />
Two primary vehicles (Safety 4 and Safety 5); and<br />
A backup vehicle (Safety 2).<br />
Truck access is through Airport Cargo Drive, connected to the WAMPO Truck Network through a system<br />
interchange with US‐54/400. However, the airport does not have access to the railroad network<br />
SERVICES<br />
ICT provides two types of service; general aviation (non-scheduled flights) and scheduled air transport<br />
(regularly scheduled passenger and freight flights).<br />
General aviation is served by specialized companies providing aircraft-related accessories, service, rental,<br />
storage, and flight training. Two general aviation manufacturers are located on the airport with access to the<br />
public aeronautical facilities.<br />
As <strong>for</strong> scheduled air transport, ICT currently services seven major airlines with 10 scheduled passenger<br />
service airlines with 10 non-stop destinations, and 3 cargo service airlines. The passenger airline companies<br />
operate on a hub and spoke network and provide service on a variety of mainline and regional jet aircraft to<br />
their respective hubs.<br />
Over the past 11 years (1999 to 2009), the number of passengers that boarded commercial aircraft, or<br />
enplanements, at ICT increased by more than 180,000. Despite the general increase in enplanements, the<br />
number of takeoffs and landings, or operations, over the same 11 year timeframe has decreased.<br />
PASSENGER ACCESS<br />
The airport bus stop is located by the luggage sign in front of the terminal; two stops on the route are by<br />
request only through a telephone system. To access the Central Business District, passengers must transfer<br />
by connecting to the West Maple Route (annual average of 14,000 riders), which has one-hour headway<br />
154
<strong>2010</strong>-<strong>2040</strong> <strong>HAZARDS</strong> <strong>ANALYSIS</strong> <strong>PLAN</strong><br />
during off-peak hours and half hour headway during peak hours. The Park & Ride lot has 753 stalls<br />
available, with 24 ADA accessible stalls. Courtesy shuttles are ADA accessible and run between the lot and<br />
the terminal approximately every 10 minutes, 24 hours per day.<br />
Post September 11, 2001, ICT saw an increase in air cargo movement. This increase peaked in 2006<br />
(approximately 40,000 tons), but has since declined. By the end of <strong>2010</strong>, the air cargo tonnage nearly<br />
equaled the 2001 level (approximately 25,000 tons).<br />
FORECAST AIRPORT ACTIVITY<br />
Forecasts of passenger enplanements drive the planning <strong>for</strong> capacity increases <strong>for</strong> commercial airports.<br />
Aircraft operation projections typically identify the capacity‐ related needs, such as runways and terminals.<br />
Through the MTP 2035 development process, WAMPO developed <strong>for</strong>ecasts <strong>for</strong> airport activity at ICT.<br />
All of the airport activities are expected to increase through 2035, but at different rates. The compound<br />
annual growth rates used to derive the <strong>2010</strong> to 2035 airport activity <strong>for</strong>ecasts are as follows:<br />
1.06 % <strong>for</strong> commercial enplanements (2008 KASP)<br />
2.98 % <strong>for</strong> commercial operations (2008 KASP)<br />
2.80 % <strong>for</strong> commercial air cargo (FAA Aerospace)<br />
0.84% <strong>for</strong> general airport based aircraft and operations (2008 KASP)<br />
By 2035, close to 230,000 more enplanements are expected at ICT. Airport operations are expected to<br />
nearly double over the next 25 years. Air cargo is also expected to nearly double over the next 25 years.<br />
The Wichita Airport Authority is replacing the existing terminal with a new terminal and concourse building<br />
west of the existing terminal. The terminal concourse will include 12 gates, all equipped to accommodate<br />
both commercial transport sized aircraft and regional jets. It will provide a facility that is designed <strong>for</strong> modern<br />
airline operational and security practices. The new terminal is designed to handle two million passengers<br />
155
<strong>2010</strong>-<strong>2040</strong> <strong>HAZARDS</strong> <strong>ANALYSIS</strong> <strong>PLAN</strong><br />
annually. The design permits future expansions to support growth up to 2.4 million annual passengers. The<br />
new terminal is anticipated to be open in the spring of 2013.<br />
9.17.7.3.2 COLONEL JAMES JABARA AIRPORT<br />
Colonel James Jabara (AAO) Airport, owned by the Wichita Airport Authority and operated by the City of<br />
Wichita Department of Airports, is a general aviation reliever airport <strong>for</strong> the WAMPO region. It is located nine<br />
miles northeast of the central business district in Wichita with easy access to K-96.<br />
SERVICES<br />
AAO provides general aviation services (non‐scheduled flights). AAO does not serve any scheduled<br />
commercial passenger or cargo airlines. AAO serves as a general aviation ―reliever‖ airport to ICT <strong>for</strong> the<br />
use of corporate, air ambulance, and training operations. Midwest Corporate Aviation is the single<br />
full‐service fixed-base operator. As of <strong>2010</strong>, Jabara Airport became the new location <strong>for</strong> the National Center<br />
<strong>for</strong> Aviation Training (NCAT). NCAT is a world class training facility that provides students the opportunity to<br />
receive hands-on, real world training in the areas of general aviation manufacturing, aircraft, and power plant<br />
mechanics.<br />
FORECAST AIRPORT ACTIVITY<br />
WAMPO <strong>for</strong>ecasts airport activity at Jabara Airport is anticipated to increase over the next 25 years. Annual<br />
based aircraft is anticipated to grow by 23%, adding 25 aircraft. Annual operations are anticipated to also<br />
grow by 23%, adding 9,500 operations.<br />
9.17.8 RAILROAD<br />
Background<br />
In 1873, the first train entered <strong>Sedgwick</strong> <strong>County</strong> and Wichita on rails after two years of contract approval on<br />
September 9, 1871 by the Wichita and Southwestern Railway Company (organized in 1871) from Newton<br />
be<strong>for</strong>e becoming the Santa Fe Company.<br />
The St. Louis, Wichita & Western became the St. Louis & San Francisco (Frisco) in early 1880. Later on, the<br />
<strong>Kansas</strong> Midland was acquired by the Frisco. In 1883, the Missouri Pacific entered the county from the east<br />
as the St. Louis, Fort Scott & Wichita railway (later known as the Fort Scott, Wichita & Western). Additional<br />
railroads consolidated into the Missouri Pacific included the Wichita, Anthony & Salt Plains Railway, and the<br />
line to the northwest part of the county known as the Wichita & Colorado. The Wichita & Western Railway,<br />
owned jointly by the Santa Fe and Frisco, ran directly west to Kingman from Wichita. Additionally, the Rock<br />
Island and the Chicago, <strong>Kansas</strong> & Nebraska served Wichita. The Santa Fe south of Wichita was built in<br />
October 1878 under the name Cowley, Sumner and Ft. Smith railway. In 1904, the Orient Railway started<br />
hauling freight into Wichita.<br />
Passenger rail service in 1910 constituted two thousand passengers are handled in and out of Wichita every<br />
day by the eighteen passenger trains operated into and through Wichita. That means that this road brings in<br />
and takes out something like 750,000 people per year.<br />
For instance the in and out tonnage handled by the Santa Fe <strong>for</strong> the first seven months of 1910 totaled<br />
408,000,000 pounds of freight. The total <strong>for</strong> the twelve months of 1909 was 536,000,000 pounds. The<br />
increase of tonnage <strong>for</strong> the first seven months of 1910 over the same period of last year was 62,000,000<br />
pounds.<br />
The <strong>Kansas</strong> rail system consists of 21 railroads of which five are identified in the South-Central <strong>Kansas</strong><br />
region. <strong>Sedgwick</strong> <strong>County</strong> is serviced by three railroads; BNSF Railway (BNSF), Union Pacific (UP), and the<br />
<strong>Kansas</strong> and Oklahoma (K&O) which operate on approximately 175 miles of rail in the region. The Wichita<br />
Terminal Association (WTA) operates a switching yard in north central Wichita. The WTA is owned jointly by<br />
the BNSF and UP railroads and serves over a dozen industries in the region. The facility is also used to<br />
156
<strong>2010</strong>-<strong>2040</strong> <strong>HAZARDS</strong> <strong>ANALYSIS</strong> <strong>PLAN</strong><br />
switch rail cars between the main tracks of the K&O, BNSF, and UP rail lines. The WTA switched over<br />
37,000 rail cars n 2008.<br />
CLASS I & III RAILROADS IN SEDGWICK COUNTY<br />
The K&O and WTA railroads lease track from the two primary Class I rail carriers: Burlington Northern Santa<br />
Fe, <strong>Kansas</strong> and Union Pacific. The following shipping in<strong>for</strong>mation is <strong>for</strong> the two Class I carriers in <strong>Kansas</strong>:<br />
157
<strong>2010</strong>-<strong>2040</strong> <strong>HAZARDS</strong> <strong>ANALYSIS</strong> <strong>PLAN</strong><br />
9.17.8.1 CLASS I RAILROAD CARRIER OVERVIEW<br />
BNSF<br />
Burlington Northern Santa Fe Corporation, (the Company) including its majority-owned subsidiaries, is<br />
engaged primarily in transportation services through its principal subsidiary. The BNSF Railway Company<br />
(BNSF), which operates one of the largest railroad networks in North America with approximately 32,000<br />
route miles covering 28 states and two Canadian provinces. This network covers the western two-thirds of<br />
the United States, stretching from all major Pacific Northwest and Cali<strong>for</strong>nia ports to destinations in the<br />
Midwest, Southeast and Southwest, and from the Gulf of Mexico to Canada. In <strong>Kansas</strong>, BNSF operates on<br />
1,237 route miles of track and 443 miles of trackage rights <strong>for</strong> a total of 1,680 miles. BNSF is headquartered<br />
in Fort Worth, Texas. Its <strong>Kansas</strong> Division is headquartered in <strong>Kansas</strong> City, <strong>Kansas</strong>. BNSF transports a<br />
range of products and commodities including coal, agricultural products, perishable products, automobiles,<br />
intermodal containers and trailers containing consumer goods and other products, petroleum, plastics and<br />
chemical products, building and construction products.<br />
Union Pacific<br />
Union Pacific Railroad is an operating subsidiary of Union Pacific Corporation (UP) headquartered in Omaha,<br />
Nebraska. Operating in the western two-thirds of the United States, it is the largest railroad in North America<br />
with 32,400 miles of track. The UP system serves 23 states, linking every major West Coast and Gulf Coast<br />
port. It also serves four major gateways to the east: Chicago, St. Louis, Memphis, and New Orleans. UP is<br />
the primary rail connection between the U.S. and Mexico. It also interchanges traffic with the Canadian rail<br />
system. In <strong>Kansas</strong>, the Union Pacific owns 2,248 miles of track. UP has one of the most diversified<br />
commodity shipping mixes in the industry. Commodities hauled include chemicals, coal, food and food<br />
products, <strong>for</strong>est products, grain and grain products, intermodal, metals and minerals, and automobiles and<br />
automotive parts.<br />
<strong>Kansas</strong> & Oklahoma<br />
9.17.8.2 CLASS III RAILROAD CARRIER OVERVIEW<br />
The <strong>Kansas</strong> and Oklahoma Railroad (KO) is a subsidiary of Watco Companies, Inc. (Watco), a Pittsburg, KS<br />
based company. As of November, 2006, Watco owns and operates 16 railroads nationwide, including the<br />
KO, South <strong>Kansas</strong> and Oklahoma Railroad (SKOL) and Kaw River Railroad (KAW) in <strong>Kansas</strong>. More than<br />
1,200 people are employed by Watco and its subsidiaries nationwide. Watco purchased the KO June 29,<br />
2001, making it one of the largest short-lines in the industry. The KO operates 877 track miles in three<br />
directions, originating from Wichita and extending to the Colorado state line. More than 55,000 carloads of<br />
agricultural and industrial products such as corn, wheat, fertilizers, lumber, cement, sand, and rock are<br />
transported annually on the KO. The KO serves customers such as OxyChem, Wichita; DeBruce Grain,<br />
Wichita; Cargill Corporation, Salina; and Collingwood Grain, Leoti.<br />
Wichita Terminal Association<br />
The Wichita Terminal Association Railroad Inc. (WTA) was <strong>for</strong>med in 1889, this two miles is to service the<br />
stockyards in Wichita, <strong>Kansas</strong>. The railroad is owned by a partnership between the BNSF Railway (BNSF)<br />
and Union Pacific (UP). The BNSF Railway handles the maintenance and dispatching on the line. The<br />
railroad is primarily a switching concern, which handles grain and grain-related products including wheat <strong>for</strong><br />
flourmills. Often shipments of grain involve subsequent moves as related to the processing of flour products.<br />
Some scrap steel is also moved. The Wichita Union Terminal comprises only about two miles of track<br />
owned jointly by the BNSF and UP railroads. Wichita Union Terminal has no employees or rolling stock of its<br />
own. It is merely a bridge line shared by the carriers. The Wichita Union Terminal should not be confused<br />
with the Wichita Terminal Association (a partnership consisting of the BNSF and UP). The latter provides<br />
maintenance <strong>for</strong> the Wichita Union Terminal and also switching service on about 27 miles of track. It serves<br />
about two dozen shippers in the area <strong>for</strong>merly occupied by the stockyards. The tracks over which the Wichita<br />
Terminal Association crews operate have no physical connection with the Wichita Union Terminal’s tracks.<br />
158
<strong>2010</strong>-<strong>2040</strong> <strong>HAZARDS</strong> <strong>ANALYSIS</strong> <strong>PLAN</strong><br />
9.17.8.3 TONS TRANSPORTED<br />
Freight tonnage transported by Class I Railroads in <strong>Kansas</strong> totaled approximately 377.41 million tons in<br />
2005, an increase of just over four and a quarter percent from the 2004 tonnage. Freight tons include<br />
originating, terminating and through traffic. The total 2005 rail tonnage would require almost 23 million trucks<br />
to move the equivalent car loadings of bulk commodities over <strong>Kansas</strong> highways. The Union Pacific continues<br />
to be the dominant rail service provider in the state hauling more than 211 million tons, or approximately 56<br />
percent, of the total rail tonnage <strong>for</strong> 2005.<br />
9.17.8.4 COMMODITIES MOVED<br />
Coal remains the principal commodity hauled by Class I railroads with approximately 194.7 million tons or 52<br />
percent of the total rail tonnage of 2005. Other principal commodity groups moved include farm products at<br />
more than 39 million tons (10 percent), food and kindred products at more than 32.4 million tons (9 percent),<br />
chemicals and allied products at more than 25.2 million tons (7 percent), and all other commodities at over<br />
86.1 million tons (23 percent). Tonnage totals in 2005 had an increase of 15,383,425 tons hauled from 2004.<br />
There was an increase of five percent in the coal category. Food and kindred products had an increase of 8<br />
percent. The miscellaneous category, which includes automobiles, aircraft engines, machinery, paper, textile<br />
materials, sand, and gravel, showed an increase of 3 percent.<br />
9.17.8.5 COMPOSITION OF TRAFFIC<br />
The BNSF Railway’s primary commodities originated in <strong>Kansas</strong> during 2005 were farm products 20.7<br />
percent); miscellaneous mixed shipments (62.5 percent); food and kindred products (10.1 percent); coal<br />
(less than one percent); and chemical and allied products (6.7 percent). In 2005, the Union Pacific's primary<br />
originated commodities were farm products (3.9 percent); miscellaneous mixed shipments (43.3 percent);<br />
food and kindred products (6.4 percent); coal (45.1 percent); and chemical and allied products (1.3 percent).<br />
The following map shows the annual number of gross tons transported through the WAMPO region (2006<br />
data):<br />
159
<strong>2010</strong>-<strong>2040</strong> <strong>HAZARDS</strong> <strong>ANALYSIS</strong> <strong>PLAN</strong><br />
The following map shows the average number of trains passing through the WAMPO region:<br />
160
<strong>2010</strong>-<strong>2040</strong> <strong>HAZARDS</strong> <strong>ANALYSIS</strong> <strong>PLAN</strong><br />
The following chart shows the hazard ranking, location, railroad, and crossing conditions.<br />
Top 50 WAMPO Identified Hazard Index Locations<br />
161
<strong>2010</strong>-<strong>2040</strong> <strong>HAZARDS</strong> <strong>ANALYSIS</strong> <strong>PLAN</strong><br />
9.17.8.6 RAILROAD CROSSINGS<br />
Of the 376 rail crossings in the WAMPO region (shown below), approximately 360 are at grade and<br />
approximately 16 are grade‐separated.<br />
162
<strong>2010</strong>-<strong>2040</strong> <strong>HAZARDS</strong> <strong>ANALYSIS</strong> <strong>PLAN</strong><br />
9.17.8.7 HAZARDOUS MATERIALS TRANSPORTATION<br />
Hazardous materials reports <strong>for</strong> <strong>Sedgwick</strong> <strong>County</strong> covering a one-year period (2005) were provided by the<br />
railroads with breakdown of class types and average carloads (includes loaded, residue, and inter-modal)<br />
and are presented below. Carloads per day are based on a 360-day year.<br />
2005 Railroad Commodity Data<br />
CLASS<br />
CLASS DESCRIPTION<br />
UNION CUMULATIVE CARLOADS<br />
BNSF<br />
(U.S. Dept of Transportation)<br />
PACIFIC TOTAL PER DAY<br />
2.1 Flammable Gas 1,850 249 2,099 5.8<br />
2.2 Non-Flammable Gas 488 99 587 1.6<br />
2.3 Poison Gas 1,008 2,097 3,105 8.5<br />
3 Flammable 2,315 843 3,158 8.6<br />
4.1 Flammable Solid 159 0 159 0.4<br />
4.2 Spontaneously Combustible 0 10 10 0.03<br />
4.3 Dangerous When Wet 8 111 119 0.3<br />
5.1 Oxidizer 60 59 119 0.3<br />
6.1 Poison 1,375 428 1,803 4.9<br />
8 Corrosive 9,554 2,136 11,690 32.0<br />
9 Miscellaneous 2,282 2,716 4,998 13.7<br />
ML Hazardous Waste Material See Class 9* 5 5* 0.01<br />
CL Non-Hazardous Waste 197 59 256 0.7<br />
2009 Railroad Commodity Data<br />
CLASS<br />
CLASS DESCRIPTION<br />
UNION CUMULATIVE CARLOADS<br />
BNSF<br />
(U.S. Dept of Transportation)<br />
PACIFIC TOTAL PER DAY<br />
2.1 Flammable Gas 3,915 165 4,080 11.3<br />
2.2 Non-Flammable Gas 5,768 3,328 9,096 25.3<br />
2.3 Poison Gas 803 392 1,195 3.3<br />
3 Flammable 16,988 32,381 49,369 137.1<br />
4.1 Flammable Solid 3 0 3 0.01<br />
4.2 Spontaneously Combustible 2 0 2 0.01<br />
4.3 Dangerous When Wet 12 156 168 0.5<br />
5.1 Oxidizer 177 15 192 0.5<br />
6.1 Poison 1,626 470 2,096 5.8<br />
8 Corrosive 11,807 2,034 13,841 38.5<br />
9 Miscellaneous 3,735 664 4,399 12.2<br />
ML Hazardous Waste Material 16,278 3 16,281 45.2<br />
CL Non-Hazardous Waste 870 33 903 2.5<br />
As noted in the comparison in the tables above, there have been dramatic increases in railroad movement of<br />
hazardous materials from almost 77 cars per day in 2005 to over 282 cars per day in 2009.<br />
Hazardous material shipments are broken into three categories:<br />
1/3 are loaded and placarded per DOT requirements<br />
1/3 have residue from previous chemicals in railcars (may contain 3% to 7% product)<br />
1/3 are intermodal railcars (trailers, equipment, tanks loaded on flat cars)<br />
There are seven general types of tank cars in use by railroads: general service, pressure, chlorine,<br />
hydrochloric acid, cryogenics, and intermodal. Safety features include: Liquid lines on railcars are designed<br />
in line with the long axis of the train, safety relief valves designed to function at 75% of the tank car’s<br />
maximum operating pressure, and safety relief vents (acid cars only) designed to function at 100% of tank<br />
car’s maximum operating pressure.<br />
163
<strong>2010</strong>-<strong>2040</strong> <strong>HAZARDS</strong> <strong>ANALYSIS</strong> <strong>PLAN</strong><br />
9.17.8.8 FREIGHT RAIL LEVEL OF SERVICE<br />
164
<strong>2010</strong>-<strong>2040</strong> <strong>HAZARDS</strong> <strong>ANALYSIS</strong> <strong>PLAN</strong><br />
9.17.8.9 RAILROAD SAFETY INITIATIVE – TIME SENSITIVE CAR TRACKING<br />
A UP team in the St. Louis' National Customer Service Center (NCSC) tracks hazardous material<br />
commodities, which are deemed "time-sensitive" shipments, due to their chemical nature. These products<br />
must reach their destination within a given time period or they may start a chemical reaction and possibly<br />
cause a release.<br />
To safeguard against a release occurring, UP was the first railroad to monitor every time-sensitive shipment<br />
on a daily basis. If a car appears to be delayed enroute, a series of calls are initiated by management to<br />
ensure arrival of the product within the designated time period. Since beginning this process, there have<br />
been no car releases of time sensitive products. They also provide a list of time-sensitive cars going to each<br />
carrier <strong>for</strong> their advanced planning.<br />
9.17.8.10 TRAFFIC DENSITIES AND CONCERNS<br />
According to the Association of American Railroads, North American railroads operate over 173,000 miles of<br />
track and earn $42 billion in annual revenues. 1 Historically, cities emerged and flourished with the inception<br />
of the railroad industry in which goods could be shipped greater distances <strong>for</strong> less cost than by steamboat or<br />
conventional roadways. Railroads remain the backbone of <strong>Kansas</strong> as one of the principal rail centers in the<br />
Midwest; <strong>Kansas</strong> is served by 4,936 miles of railroad trackage, much of it operated by the BNSF Railway<br />
(BNSF) and by the Union Pacific Railroad (UPRR). 2 As a result of the increasing number of trains operating<br />
throughout <strong>Kansas</strong>, improving safety and reducing congestion at highway‐railroad grade crossings are<br />
priorities <strong>for</strong> many communities. Nationwide, a collision occurs between a train and vehicle or a train and a<br />
pedestrian approximately every 2 hours. 3 Likewise, the number of vehicle miles traveled is increasing at a<br />
faster rate than train miles traveled.<br />
9.17.8.11 STRATEGIC RAIL CORRIDOR NETWORK (STRACNET)<br />
The U.S. Strategic Rail Corridor Network (STRACNET) consists of 38,800 miles of rail lines, identified as<br />
railroad corridors that are vital to national defense and provides service to 193 defense installations whose<br />
mission requires rail service. The STRACNET was identified and designated through a partnership between<br />
the Military Traffic Management Command of the Department of Defense and the Federal Railroad<br />
Administration. In the event of a large-scale military mobilization, it is very important that the network be<br />
fully responsive to national defense needs and priorities. According to in<strong>for</strong>mation provided by the<br />
Department of Defense’s Military Traffic Management Command (MTMC), several Union Pacific and BNSF<br />
rail lines are designated as part of the STRACNET. The designated STRACNET route in south-central<br />
<strong>Kansas</strong> includes the cities of El Dorado, Augusta, Winfield, Wellington, and Attica.<br />
165
<strong>2010</strong>-<strong>2040</strong> <strong>HAZARDS</strong> <strong>ANALYSIS</strong> <strong>PLAN</strong><br />
KANSAS STRACNET MAP<br />
Source: U.S. Military Surface Deployment and Distribution Command<br />
166
<strong>2010</strong>-<strong>2040</strong> <strong>HAZARDS</strong> <strong>ANALYSIS</strong> <strong>PLAN</strong><br />
Regional<br />
Centered on the railroad industry in the 1850’s as a transportation center, Wichita became the largest city in<br />
<strong>Kansas</strong> and has the 2nd largest metropolitan area population (344,300). WAMPO serves a planning area of<br />
1,036 square miles with a total population of 460,000. 5 The region has approximately 4,560 miles of<br />
roadway, 175 miles of Class I and shortline railroad trackage and 297 highway‐railroad grade crossings.<br />
According to the WAMPO Travel Demand Model, the total number of Vehicle Miles Traveled (VMT) in the<br />
region in 2002 was 12,709,826.<br />
The WAMPO region is home to two Class I railroads, the BNSF and the UPRR; and one shortline railroad,<br />
the <strong>Kansas</strong> & Oklahoma Railroad (K&O) operated by WATCO Companies. The BNSF operates over 100<br />
trains per day through the WAMPO region; the UPRR operates 10 trains per day. The K&O operates 2 trains<br />
per week through Garden Plain and Cheney, and one to two trains per day through the Hutchinson and<br />
Conway Springs Subdivisions. The BNSF and the UPRR are part owners of the Wichita Terminal<br />
Association/Wichita Union Terminal (WTA/WUT) in north Wichita and by agreement train movements are<br />
controlled by the BNSF through the Central Corridor. This joint agreement allows <strong>for</strong> coordinated railroad<br />
operations through Wichita’s core.<br />
Railroad Crossing Overview<br />
Railroad crossings are classified as being either at‐grade or grade separated. An at‐grade crossing is one<br />
in which the roadway and railroad tracks are at the same elevation; a grade separated crossing is one in<br />
which the highway and railroad tracks are at different elevations, such as a bridge structure carrying the<br />
railroad over a highway or vice versa. Crossings can also be classified as either public or private. Public<br />
highway‐railroad grade crossings are on streets and highways under the jurisdiction of and maintained by a<br />
public authority. Private highway-railroad grade crossings are located on a privately‐owned road and are<br />
intended <strong>for</strong> use by the owner. These private roads are not intended <strong>for</strong> public use and are there<strong>for</strong>e not<br />
maintained by a public or state highway authority.<br />
Railroad Crossing Inventory<br />
According to KDOT’s 1995 Long Range Transportation Plan (KLRTP), the state of <strong>Kansas</strong> has 6,376 public<br />
highway‐railroad grade crossings, of which 1,684 have flashing light systems and 1,126 have automatic<br />
gates. 6 The remaining 4,692 crossings have passive signage which may include crossbucks, advance<br />
warning signs, and pavement markings. There are also several crossings that are signed with stop signs. In<br />
the WAMPO region, almost 40% of existing crossings are considered passive, marked only by crossbucks.<br />
The remaining 60% are active crossings; 18% are marked with flashing lights and 42% are equipped with<br />
flashing lights and gates.<br />
167
<strong>2010</strong>-<strong>2040</strong> <strong>HAZARDS</strong> <strong>ANALYSIS</strong> <strong>PLAN</strong><br />
According to the Federal Railroad Administration (FRA), 57 collisions resulting in 15 fatalities occurred at<br />
grade crossings in the state of <strong>Kansas</strong> during 2006; a total of 21 fatalities occurred in 2006 as a result of<br />
trespassing on railroad property. The number of fatalities in 2006 increased from 2005, when there were 63<br />
collisions resulting in seven fatalities; nine additional fatalities were a result of trespassing on railroad<br />
property. 7 In <strong>Sedgwick</strong> <strong>County</strong>, there were eight collisions resulting in one fatality in 2006; there were ten<br />
collisions resulting in one fatality in 2005. 8<br />
Average Traffic Counts<br />
Average Daily Traffic (ADT) is a measure used to determine how many vehicles travel on a given road in one<br />
day. Over one‐half (54%) of the highway‐railroad grade crossings in the WAMPO region have an ADT of<br />
less than 1,000 vehicles.<br />
168
<strong>2010</strong>-<strong>2040</strong> <strong>HAZARDS</strong> <strong>ANALYSIS</strong> <strong>PLAN</strong><br />
Crossings experiencing the most vehicles per day include:<br />
K‐15 Highway in Wichita, on the BNSF<br />
Pawnee Avenue in Wichita, on the BNSF and UPRR<br />
47th Street in Wichita, on the BNSF and UPRR<br />
Meridian Ave. in Wichita, on the BNSF and K&O<br />
West Street in Wichita, on the K&O<br />
Seneca Street in Wichita, on the K&O<br />
13th Street in Wichita, on the Central Corridor<br />
According to the WAMPO Travel Demand Model, total Vehicle Miles Traveled (VMT) in 2002 was<br />
12,709,826; VMT is projected to increase to 18,404,132 in 2030. Additionally, the average vehicular travel<br />
time in 2002 was calculated at 16.89 minutes; this is projected to increase to approximately 19.67 minutes by<br />
2030. Travel time on routes which intersect grade crossings is expected to be higher as train lengths and<br />
train traffic increase over the same time period.<br />
The majority of crossings (77%) experience 0‐10 trains per day. These crossings are located on the UPRR<br />
and K&O. 4% of all crossings in the WAMPO region experience the highest volumes of daily train traffic<br />
(41‐52 trains per day). These crossings are located on the BNSF Emporia Subdivision.<br />
The BNSF operates the highest number of trains per day; the BNSF Emporia subdivision operates up to 52<br />
trains each day. The K&O operates less than one to two trains per day through the region, while the UPRR<br />
operates up to ten trains per day.<br />
169
<strong>2010</strong>-<strong>2040</strong> <strong>HAZARDS</strong> <strong>ANALYSIS</strong> <strong>PLAN</strong><br />
170
<strong>2010</strong>-<strong>2040</strong> <strong>HAZARDS</strong> <strong>ANALYSIS</strong> <strong>PLAN</strong><br />
TRANSIT<br />
Wichita Transit<br />
The Wichita Transit route network serves primary persons with mobility limitations, the impoverished and the<br />
elderly with transportation to lead productive lives and meet everyday needs. Wichita Transit operates both<br />
fixed route and paratransit services which are dispatched from the Transit Operations Center (777 E<br />
Watermen). The transit system currently operates 53 buses (all ADA compliant) on 18 fixed routes and<br />
25 wheelchair lift vans on 25 demand-response<br />
paratransit routes, including rides purchased under<br />
contract from 6 social services agencies. Additionally,<br />
four rubber tired trolleys are used <strong>for</strong> the trolley system.<br />
Annually, Wichita Transit currently carries 2.4 million<br />
passengers on fixed route bus service, and over 350,000<br />
disabled passengers on paratransit vans. Ridership<br />
increased 15 percent over last year due to increased gas<br />
prices. Wichita Transit operates a radial bus network<br />
where most routes are designed to provide service to and<br />
from the Downtown Transit Center (214 S Topeka).<br />
It is estimated that 69% of riders had an annual income of less than $20,000 and 98% of riders brought<br />
home less than $50,000 per year. Additionally, 67% of those surveyed said that they rode the bus five days a<br />
week. Most riders used the bus to go to work (31%) or conduct personal business (29%).<br />
171
<strong>2010</strong>-<strong>2040</strong> <strong>HAZARDS</strong> <strong>ANALYSIS</strong> <strong>PLAN</strong><br />
The Transit Center has 24 parking bays <strong>for</strong> buses and/or vans. Vehicles are parked inside the Transit<br />
Operations Center <strong>for</strong> vehicle maintenance, which is designed <strong>for</strong> diesel buses. Vans are currently<br />
maintained at the City's Central Maintenance Facility; however, a Regional Van Maintenance Facility is<br />
currently under construction. Of the buses on the radial routes, all are scheduled to arrive simultaneously at<br />
the transit center so that transfers between routes may be accommodated. There are also subarea circulator<br />
routes which do not directly connect to the transit center. These routes circulate in designated areas and<br />
connect with other routes that provide service to and from the Downtown Transit Center. There are plans to<br />
replace the radial route system to a grid network allowing <strong>for</strong> movement or people in a shorter time. The Q-<br />
Line is a wheelchair accessible trolley service connecting restaurants, hotels, and entertainment venues in<br />
downtown Wichita.<br />
Paratransit services differ from transit services in that the routes and schedules vary based on demand.<br />
Typical paratransit services offered include deviated fixed route (e.g., off of a regular route), curb-to-curb,<br />
door-to-door, and ambulance services. Paratransit services are provided by Wichita Transit and 17 private,<br />
non-profit, and social service agencies in the region. Wichita Transit currently operates 26 wheelchair liftequipped<br />
vans providing service to the general public on 17 demand response paratransit routes. Wichita<br />
Transit has also contracted with six other CTD #12 agencies to provide paratransit services. These other<br />
agencies have their own vehicles and routes in addition to those previously mentioned. Over 320,000<br />
passengers annually are carried by the combined Wichita Transit paratransit services. Approximately 75% of<br />
these paratransit customers are carried by the contracted carriers.<br />
Future transportation includes changing to a grid network of north/south and east/west transit routes. Routes<br />
extend from 119th Street to Greenwich road and from 37th Street north to 55th Street south. They are<br />
spaced every half mile (or within an 8 minute walk) in the denser older portions of the city. In lower density<br />
area or where there are natural barriers, the routes are spaced approximately every one mile. Corridor<br />
routes would operate on major and local streets, whereas communities may link into the City of Wichita<br />
system in the following ways: By providing their own service or contracting with Wichita Transit to link into the<br />
grid, or Connect with Commuter express services that link to Downtown Wichita. Commuter Expresses<br />
Services are designed <strong>for</strong> workers. They would operate Monday through Friday during the peak periods,<br />
every 30 minutes. Connections could be made at Park and Ride lots.<br />
Derby Dash<br />
The City of Derby operates a demand response service called the Derby Dash. The Derby Dash was<br />
initiated in April 2007 and curb-to-curb paratransit service is available to all residents of Derby. The service<br />
area includes the City of Derby and serves more than 22,000 residents.<br />
Coordinated Transit District #12 (CTD) Organizations<br />
<strong>Kansas</strong> is divided into 15 Coordinated Transit Districts (CTDs), each of which is responsible <strong>for</strong> coordinating<br />
transit service within their area. The CTDs are composed of organizations that have a vested interest in<br />
paratransit services. Most of these organizations receive transit funds from the <strong>Kansas</strong> Department of<br />
Transportation (KDOT) and the Federal Transit Administration (FTA) to provide paratransit services.<br />
172
<strong>2010</strong>-<strong>2040</strong> <strong>HAZARDS</strong> <strong>ANALYSIS</strong> <strong>PLAN</strong><br />
The Paratransit Council, Inc., <strong>for</strong>med in 1984, is a network of transportation providers comprised of human<br />
service agencies in <strong>Sedgwick</strong>, Harvey and Butler Counties. This organization shares in<strong>for</strong>mation regarding<br />
service needs and trends, coordinates services and training, and advocates <strong>for</strong> local, state and federal<br />
support of public transportation. The Paratransit Council Inc. is an advisory body to CTD #12, authorized<br />
under K.S.A. 75-5051 to manage state and federal passenger transportation funds. The administrative<br />
agency <strong>for</strong> CTD #12 is <strong>Sedgwick</strong> <strong>County</strong> Department on Aging (SCDOA).<br />
The CTD #12 is composed of 18 service providers in Butler, Harvey, and <strong>Sedgwick</strong> Counties. This includes<br />
Wichita Transit, social service agencies, non-profits, and private institutions that provide a variety of<br />
paratransit services. The following CTD #12 members provide specialized transportation services <strong>for</strong> their<br />
clients.<br />
American Red Cross<br />
Buhler Sunshine Home, Inc.<br />
Butler <strong>County</strong> Department on Aging<br />
Catholic Charities Adult Day Services<br />
Cerebral Palsy Research Foundation of<br />
<strong>Kansas</strong>, Inc.<br />
Futures Unlimited, Inc.<br />
Harper <strong>County</strong> Department of Aging<br />
Heartspring<br />
<strong>Kansas</strong> Elks Training Center <strong>for</strong> the<br />
Handicapped, I<br />
Leisure Time Center<br />
Mennonite Bethesda Society, Inc dba<br />
Bethesda Home<br />
Mosaic (Martin Luther Homes of KS)<br />
Rainbows United, Inc.<br />
<strong>Sedgwick</strong> <strong>County</strong> Department on Aging<br />
Starkey, Inc.<br />
The ARC of <strong>Sedgwick</strong> <strong>County</strong><br />
Training and Evaluation Center of<br />
Hutchinson<br />
Wichita Transit (Specialized Services)<br />
The services are all designed to meet the individual needs of each organization. Generally, CTD #12<br />
providers serve the elderly, the physically or mentally challenged, and the economically disadvantaged.<br />
Most CTD #12 member organizations operate fewer than ten vehicles. However, four member organizations<br />
operate between ten and 25 vehicles and one member organization operates over 70 vehicles. The <strong>2010</strong><br />
Coordinated Public Transit – Human Services Plan focuses on transportation services <strong>for</strong> elderly<br />
populations, people with disabilities, and low‐income individuals.<br />
Intercity Bus Transportation<br />
Greyhound bus service connects Wichita to <strong>Kansas</strong> City and Oklahoma City. There are four departures daily<br />
from the Wichita Greyhound bus station located in downtown Wichita. Intercity bus service has recently been<br />
instituted on two new routes; Wichita/Salina and Wichita/Pueblo, Colorado.<br />
Taxicab Transportation<br />
Taxicab service in Wichita is provided by ABC Taxi, American Cab, and Best Cab. These companies provide<br />
a variety of services including regular taxi trips, parcel delivery, and long distance shuttle service to cities<br />
such as <strong>Kansas</strong> City and Lawrence. Services are available 24 hours a day from some companies.<br />
Medicaid Transportation<br />
Medical Transportation Management (MTM) can transport qualified Medicaid beneficiaries <strong>for</strong> no cost<br />
medical transportation with at least 48 hour advance notification.<br />
Volunteer Transportation<br />
<strong>Sedgwick</strong> <strong>County</strong> Transportation’s RSVP Volunteer Transportation Program sponsors volunteer<br />
transportation that is coordinated through four senior centers and is available to residents of the towns listed<br />
below only. Services are provided by RSVP volunteers in their own vehicles.<br />
Mount Hope Senior Center<br />
Garden Plain Senior Center<br />
Bentley Senior Center<br />
Clearwater Senior Center<br />
173
<strong>2010</strong>-<strong>2040</strong> <strong>HAZARDS</strong> <strong>ANALYSIS</strong> <strong>PLAN</strong><br />
Charters and Tour Bus Transportation<br />
Village Tours (25 motor coaches ranging in size from 29 to 56 passengers)<br />
Prestige Bus Charters (17 motor coaches ranging in size from 43 to 56 passengers)<br />
Kincaid Coach (62 motor coaches located at 6 Midwest terminals including Wichita)<br />
Overland Charters (56 passenger motor coaches)<br />
Party Express Bus (6 vehicles ranging from 15-passenger van to 45-passenger bus)<br />
River City Trolley and Charters<br />
Passenger Rail Studies<br />
Several reports have been published regarding restoration of the intercity passenger rail service that once<br />
connected Wichita to <strong>Kansas</strong> City, Oklahoma City, Fort Worth, and other cities. Amtrak conducted a study <strong>for</strong><br />
KDOT which examined the costs and logistics associated with the potential expansion of passenger rail<br />
service in <strong>Kansas</strong>. The study, Feasibility Report of Proposed Amtrak Service, was completed in March <strong>2010</strong>.<br />
It identified and investigated four possible intercity passenger rail scenarios.<br />
Night time extension of the Heartland Flyer between Oklahoma City and Newton<br />
Night time extension of Heartland Flyer between Oklahoma City and <strong>Kansas</strong> City<br />
Day service between Fort Worth and <strong>Kansas</strong> City<br />
Day service between Oklahoma City and <strong>Kansas</strong> City<br />
KDOT and the Oklahoma Department of Transportation will build on these results by providing matching<br />
funds <strong>for</strong> a Service Development Plan. This plan will choose one of the scenarios identified in the feasibility<br />
study and develop a business and operations plan <strong>for</strong> expanded passenger rail service in <strong>Kansas</strong>.<br />
Publication of a <strong>Kansas</strong> state rail plan, a long‐range plan covering freight, short line, and passenger rail<br />
activities, is anticipated in <strong>2010</strong>. The University of <strong>Kansas</strong>, School of Business and the Northern Flyer<br />
Alliance, Inc. have also produced reports that analyze the economic benefit potential of new passenger rail<br />
service connections to Wichita: Economic Benefit Study of Renewed Passenger Rail Service between<br />
<strong>Kansas</strong> City and Oklahoma City, December, 2009, and Final Return on Investment Review, December 2009.<br />
Freight<br />
Freight movement is an important component of the national, regional, and local economies. The term<br />
―freight‖ is used generically throughout this plan to mean the commercial transport of goods. Goods need to<br />
be shipped from their point of origin to their final destination. The term ―goods‖ used in the plan refers to all<br />
items, except services, that can be moved commercially. Freight movement can be by truck, rail, air, water,<br />
or pipeline; but usually freight movement is accomplished by a combination of modes. Freight arriving from<br />
other countries in container ships at major U.S. maritime ports, or goods manufactured in the U.S., are<br />
transferred to rail, trucks, or pipelines and shipped to other distribution centers <strong>for</strong> additional modal transfers.<br />
These goods eventually arrive at shopping malls, grocery stores, car dealers, department stores, other<br />
manufacturing centers, or directly to homes.<br />
According to 2006 TRANSEARCH® Insight data used in the WAMPO Freight Plan, approximately 38 million<br />
tons of freight was shipped into, out of, and within the WAMPO region in 2006. That amount is projected to<br />
increase by 57% by the year 2030 to 59.3 million tons (figure 5). The value of these shipments totaled $68.8<br />
billion in 2006 and is expected to increase 89.6% to $130.4 billion by 2030 which is nearly a 90% increase.<br />
174
<strong>2010</strong>-<strong>2040</strong> <strong>HAZARDS</strong> <strong>ANALYSIS</strong> <strong>PLAN</strong><br />
Commodities vary in type, ranging from basic building materials <strong>for</strong> major appliances and homes to fresh fish<br />
and other foods. The top ten commodities shipped out of and into the WAMPO region in 2006 are identified<br />
below.<br />
Nonmetallic minerals (33%) and food (12%) are the most common freight items shipped into the WAMPO<br />
region, while petroleum/coal (27%) and chemical/allied products (29%) are the most common items shipped<br />
out. Petroleum/coal products remain the largest commodity shipped within the WAMPO region, increasing<br />
1.25% from 2006 to 2030.<br />
Inbound Commodities<br />
In 2006, over 20 million tons of various goods were shipped into the WAMPO region by truck. In comparison,<br />
1.6 million tons of freight was shipped by rail and only 17 thousand tons by air (figure 7). Freight movement<br />
by truck is anticipated to increase approximately 35% from 20.5 million tons to 31.5 million tons between<br />
2006 and 2030. Rail and air freight tonnage is also projected to increase by 41% and 36%, respectively.<br />
Although overall tonnage shipped into the WAMPO region is anticipated to increase between 2006 and<br />
2030, the relative percentage of goods by truck, rail, and air flowing into the WAMPO region remains the<br />
same.<br />
175
<strong>2010</strong>-<strong>2040</strong> <strong>HAZARDS</strong> <strong>ANALYSIS</strong> <strong>PLAN</strong><br />
Outbound Commodities<br />
Over 11 million tons of freight was shipped from the WAMPO region to points outside the region by truck in<br />
2006. Rail and air freight collectively represent approximately 1.9 million tons. Freight shipped from the<br />
region by truck is estimated to increase slightly over 74% between 2006 and 2030 to 19.6 million tons. Air<br />
freight from the region is projected to only increase slightly by 75.6%. Freight moved by rail remains<br />
somewhat steady at 1.8 million tons. Figure 8 represents the tons of commodities that originated in and were<br />
shipped to points outside of the WAMPO region.<br />
The trucking industry, by far, was the largest carrier of freight in the region. It accounted <strong>for</strong> almost 91% (34<br />
million tons) of the freight moved in the region in 2006. Freight movement by rail accounted <strong>for</strong> slightly more<br />
than 9% (3.5 million tons) of the total. Freight movement by air represents less than 1% (40,000 tons) of the<br />
freight moved in the region. Even with this volume of freight into, out of, and within the region, most of the<br />
freight being transported is just passing through. It is estimated that over 60 million tons of freight per year is<br />
currently shipped through the region, primarily on I‐35 and the Class I railroads.<br />
176
<strong>2010</strong>-<strong>2040</strong> <strong>HAZARDS</strong> <strong>ANALYSIS</strong> <strong>PLAN</strong><br />
By 2030 (in<strong>for</strong>mation was only available through 2030), approximately 59 million tons of freight is projected<br />
to be shipped into, out of, and within the WAMPO region. This is over a 50% increase in freight movement<br />
from 2006 to 2030. Of that total, 53.5 million tons of freight will be carried by truck, five million tons by rail,<br />
and 104,000 tons by air. The amount of freight moved through the region by 2030 is also expected to<br />
increase greatly.<br />
Freight by Truck, Rail, and Air<br />
Overall, freight movement into, out of, and within the WAMPO region is dominated by trucks. In 2006, trucks<br />
represented 91% of all freight movement in the WAMPO region. Rail came in a very distant second at 9%,<br />
while air freight movement represented less than 1% of all freight movement in the WAMPO region. This<br />
trend is predicted to change little in 2030. Rail is anticipated to lose 1% of the freight it moves to trucks,<br />
resulting in 92% of all freight being moved by truck and 8% by rail in 2030. Air freight movement is projected<br />
to remain less than 1% of all freight movement in the WAMPO region in 2030.<br />
Through Freight Movement<br />
Most evidence suggests that the through movement of freight accounts <strong>for</strong> the majority of freight affecting<br />
transportation systems in the region. The 2006 Transearch data used to demonstrate commodity flow covers<br />
only county‐to‐county freight movement and freight movement through the WAMPO region is not<br />
identified in the data. The WAMPO region is served by two National Highway System (NHS) High Priority<br />
Corridors: US‐50/400 and I‐35. US50/400 is designated as the High Plains Corridor which is a major east<br />
west freight corridor. I‐35/<strong>Kansas</strong> Turnpike is part of the I‐35 Corridor and is a major North American Free<br />
Trade Agreement (NAFTA) trade route <strong>for</strong> freight movement between Canada, Mexico, and the United<br />
States.<br />
177
<strong>2010</strong>-<strong>2040</strong> <strong>HAZARDS</strong> <strong>ANALYSIS</strong> <strong>PLAN</strong><br />
9.18 Water Sector<br />
This sector provides drinking water and wastewater treatment through approximately 170,000 public water<br />
systems. These systems depend on reservoirs, dams, wells, treatment facilities, pumping stations, and<br />
transmission lines. Threats to this sector include physical vulnerabilities. The following agencies are<br />
responsible <strong>for</strong> this sector:<br />
Local: Public and Private Utilities, Petrochemical Companies<br />
State: <strong>Kansas</strong> Division of Emergency Management/<strong>Kansas</strong> Highway Patrol, <strong>Kansas</strong> Fire Marshall<br />
Federal: U.S. Environmental Protection Agency<br />
Safe drinking water and properly treated wastewater are critical to modern life. The <strong>for</strong>mer is a prerequisite<br />
<strong>for</strong> all human activity—physical, economic, and cultural. Wastewater treatment is important <strong>for</strong> preventing<br />
disease and protecting the environment. There<strong>for</strong>e, from the standpoints of public health and economic<br />
impact, it is critical that we protect the Nation’s drinking water and wastewater infrastructures, collectively<br />
known as the Water Sector.<br />
The Water Sector is a partnership of public and private drinking water and wastewater utilities; national and<br />
State associations; State, local, and tribal governments; research foundations; and Federal agencies that<br />
together have been ensuring the protection and resilience of water services <strong>for</strong> decades. Water Sector<br />
partners collaborate to be better prepared to prevent, detect, respond to, and recover from terrorist attacks<br />
and other intentional acts, natural disasters, and other hazards (i.e., the ―all-hazards‖ approach).<br />
The Water Sector has interdependencies with all critical infrastructures. Further analysis of dependencies<br />
and interdependencies across all 18 CIKR sectors is needed to identify the true scope of cascading effects<br />
resulting from a manmade attack or a naturally occurring event.<br />
178
<strong>2010</strong>-<strong>2040</strong> <strong>HAZARDS</strong> <strong>ANALYSIS</strong> <strong>PLAN</strong><br />
9.18.1 WATER DISTRIBUTION SYSTEM (URBAN)<br />
The following map shows the locations of water service to the City of Wichita from distribution lines<br />
originating from the Cheney reservoir pump station and the Wichita (Equus Beds) Well Field.<br />
WATER AND SEWER DISTRIBUTION SYSTEMS IN SEDGWICK COUNTY<br />
The well field is comprised of 55 wells of which half or 26 wells are located in Harvey <strong>County</strong>. A smaller local<br />
well field of 20 wells is located near the Wichita Water Treatment Plant and Sims Park. Cheney Reservoir<br />
provides approximately 80% of the water <strong>for</strong> Wichita while the Wichita well field provides between 10 to 15%.<br />
The Cheney pump station produces about 30 million gallons of water per day (MGD) to Wichita with a firm<br />
capacity of 80 MGD. In the advent of power failure at the Cheney pump station, the Wichita well field pumps<br />
can deliver 72 MGD and the local well field can provide 30 MGD. Average daily flow produced <strong>for</strong> the City<br />
of Wichita and wholesale customers (other cities) was 60.8 MGD in 2000.<br />
179
<strong>2010</strong>-<strong>2040</strong> <strong>HAZARDS</strong> <strong>ANALYSIS</strong> <strong>PLAN</strong><br />
9.18.2 EQUUS BEDS AQUIFER STORAGE AND RECOVERY (ASR) PROJECT 37<br />
The ASR project involves pumping water out of the Little Arkansas River following periods of heavy rainfall,<br />
treating it to drinking-water quality and injecting it into the Equus Beds aquifer, a major source of Wichita’s<br />
water. The water is stored in the aquifer – an underground layer of sand and gravel that can hold water –<br />
until it is needed. Ultimately, the project will be capable of producing up to 100 million gallons of water a day<br />
from the Little Arkansas River, using 60 recharge wells and three recharge basins to put the water back into<br />
the aquifer. The Equus Beds aquifer covers portions of <strong>Sedgwick</strong>, Harvey, McPherson and Reno counties<br />
with an area of approximately 900,000 acres. The ASR project encompasses approximately 165 square<br />
miles and extends northwest of the City of Wichita across parts of Harvey and <strong>Sedgwick</strong> counties, mostly<br />
between Bentley and Halstead.<br />
The ASR project is broken down into four phases. Phase I was completed in September 2006, and it has the<br />
capacity to divert and recharge up to 10 million gallons a day of river water into the aquifer. It includes an<br />
extensive monitoring program to help assure that the project is safe and complies with all of the operating<br />
conditions placed on the project. Phase II, which consists of 30 million gallons a day of production, is now in<br />
the design phase and should be completed by 2012. Phases III and IV will include further expansion of<br />
treatment and water storage capacity.<br />
The ASR project, coupled with greater use of Cheney Reservoir – the city’s existing surface water supply –<br />
will help Wichita provide water <strong>for</strong> more than 600,000 users by the year 2050. The project will add up to 65<br />
billion gallons of water to the aquifer as well as create a hydraulic barrier to slow down or stop the intrusion of<br />
saltwater into the groundwater supply.<br />
Since the City of Wichita will only be able to capture river water during times when the Little Arkansas River<br />
is flowing at a high level, it is estimated that it will take up to 10 years to recharge the aquifer to the levels<br />
required to meet the city’s 2050 needs.<br />
37 Equus Beds Aquifer Storage and recovery Project Fact Sheet, City of Wichita<br />
180
<strong>2010</strong>-<strong>2040</strong> <strong>HAZARDS</strong> <strong>ANALYSIS</strong> <strong>PLAN</strong><br />
All water users in the region will benefit from a fully charged aquifer, and higher groundwater levels will also<br />
reduce energy costs <strong>for</strong> irrigators to pump water to the surface. Current consumers of the Equus Beds<br />
aquifer are irrigators, municipalities (Wichita, Halstead, Hutchinson, Maize, McPherson, Newton, Park City,<br />
Valley Center and others) and industries that include Westar Energy, <strong>Kansas</strong> Gas Service, National<br />
Cooperative Refinery Association (NCRA), Morton Salt, Cargill Salt, Sonoco paperboard mill and Koch<br />
Hydrocarbon natural gas processing operation.<br />
Many sand and gravel pits have been excavated <strong>for</strong> construction materials in and around Wichita in southcentral<br />
<strong>Kansas</strong>. The water table in the alluvial aquifer in the area is so shallow that the sand pits<br />
permanently fill with water. A concern is that the water-filled sand pits provide an opening to the aquifer, such<br />
that stormwater runoff and any contaminants it contains could directly enter the ground water. After sand and<br />
gravel operations end, residential developments often are built around the pits that contribute to the runoff. 38<br />
Distribution of sand and gravel pits in the Wichita area are shown on the following page.. Most of the pits<br />
were mined <strong>for</strong> construction aggregate, although a few are borrow pits <strong>for</strong> highway fill. Red arrows indicate<br />
the locations of the six sand pits studied.<br />
38 Stormwater Runoff into Sand Pits--Effects on Ground-water Quality, <strong>Kansas</strong> Geologic Survey<br />
181
<strong>2010</strong>-<strong>2040</strong> <strong>HAZARDS</strong> <strong>ANALYSIS</strong> <strong>PLAN</strong><br />
9.18.3 WATER DISTRIBUTION SYSTEM (RURAL)<br />
According to a Regional Economic Area Partnership (REAP) 2009 Municipal Utility Growth Issues Special<br />
Committee Report, rural water districts (RWD) were created to provide domestic water service to residents of<br />
sparsely populated, rural areas. Rural water districts meet a critical need: ensuring that rural residents have<br />
access to clean water <strong>for</strong> domestic purposes. Urban growth coupled with expansions initiated by rural water<br />
districts that include service to urban density developments has caused service area conflicts between<br />
districts and municipalities. These types of conflicts are on the rise in South-Central <strong>Kansas</strong> as city<br />
boundaries expand and come in contact with a greater number of RWDs.<br />
Currently there are fifty-two RWDs in the REAP region, which includes nine counties: Butler, Cowley, Harper,<br />
Harvey, Kingman, McPherson, Reno, <strong>Sedgwick</strong>, and Sumner. Forty-eight of the region’s 97 cities have city<br />
boundaries within three miles of a RWD. Some of the communities adjacent to RWDs are among the fastest<br />
growing in the region, including Andover, Derby, Goddard and Wichita. These four communities are within<br />
Butler and <strong>Sedgwick</strong> counties, which experienced a 6% and 5.1% population growth respectively between<br />
2000 and 2007.<br />
182
<strong>2010</strong>-<strong>2040</strong> <strong>HAZARDS</strong> <strong>ANALYSIS</strong> <strong>PLAN</strong><br />
According to the <strong>Kansas</strong> Water Office, water supply demand <strong>for</strong> <strong>Sedgwick</strong> <strong>County</strong> is anticipated to exceed<br />
92 million gallons per day by <strong>2040</strong>.<br />
The following maps show rural areas of <strong>Sedgwick</strong> <strong>County</strong> are serviced by seven rural water districts:<br />
<strong>Sedgwick</strong> <strong>County</strong> Rural Water District 1 through 4, Sumner Rural Water District 5, Butler <strong>County</strong> Rural Water<br />
District 5 and 8, Harvey <strong>County</strong> Rural Water District 1, and Public Wholesale Water Supply (PWWS) District<br />
#17. Each of these districts is an independent system serving rural customers via water wells.<br />
RURAL WATER DISTRICTS IN SEDGWICK COUNTY<br />
183
<strong>2010</strong>-<strong>2040</strong> <strong>HAZARDS</strong> <strong>ANALYSIS</strong> <strong>PLAN</strong><br />
SEDGWICK COUNTY RURAL WATER DISTRICTS #1 & #2<br />
SEDGWICK COUNTY RURAL WATER DISTRICT #3<br />
184
<strong>2010</strong>-<strong>2040</strong> <strong>HAZARDS</strong> <strong>ANALYSIS</strong> <strong>PLAN</strong><br />
SEDGWICK COUNTY RURAL WATER DISTRICT #4<br />
HARVEY COUNTY RURAL WATER DISTRICT #1<br />
185
<strong>2010</strong>-<strong>2040</strong> <strong>HAZARDS</strong> <strong>ANALYSIS</strong> <strong>PLAN</strong><br />
BUTLER COUNTY RURAL WATER DISTRICT #5<br />
BUTLER COUNTY RURAL WATER DISTRICT #8<br />
SUMNER COUNTY RURAL WATER DISTRICT #5<br />
186
<strong>2010</strong>-<strong>2040</strong> <strong>HAZARDS</strong> <strong>ANALYSIS</strong> <strong>PLAN</strong><br />
PUBLIC WHOLESALE WATER SUPPLY DISTRICT #17<br />
187
<strong>2010</strong>-<strong>2040</strong> <strong>HAZARDS</strong> <strong>ANALYSIS</strong> <strong>PLAN</strong><br />
9.18.4 WATERSHEDS AND DISTRICTS<br />
The Floodplain Management Task Force was <strong>for</strong>med in January 2005 with a charge to evaluate current<br />
policy and practice of regulating development within floodplains and to make recommendations of any<br />
needed change in policy and practice to the <strong>Sedgwick</strong> <strong>County</strong> Board of Commissioners and Wichita City<br />
Council. In developing recommendations, the Task Force incorporated concerns regarding development<br />
within floodplains and the reduction of present and future flood hazards. Business, environmental, and<br />
neighborhood interests were taken into account.<br />
Watershed Districts within <strong>Sedgwick</strong> <strong>County</strong><br />
Drainage Districts within <strong>Sedgwick</strong> <strong>County</strong><br />
Andale Watershed #9<br />
*Spring Creek Watershed #16<br />
*Whitewater River Watershed - Butler <strong>County</strong><br />
Clear Creek Watershed #30<br />
Mount Hope Watershed #54<br />
*Middle Walnut River Watershed - Butler <strong>County</strong> -<br />
levy every other year<br />
Proposed Cowskin Creek Watershed District<br />
(*Indicates an active district)<br />
Big Arkansas Drainage District<br />
*Eagle Drainage District<br />
*Greeley Township Drainage District<br />
*Riverside Drainage District<br />
<strong>Sedgwick</strong>-Sumner Drainage District<br />
*<strong>Sedgwick</strong> Valley Drainage District<br />
188
<strong>2010</strong>-<strong>2040</strong> <strong>HAZARDS</strong> <strong>ANALYSIS</strong> <strong>PLAN</strong><br />
<strong>Sedgwick</strong> <strong>County</strong> has eight watersheds that are areas of land that catches rain and snow and drains or<br />
seeps into a marsh, stream, river, lake or groundwater. The watersheds include: Gar-Peace, Little Arkansas,<br />
Middle Arkansas, North Fork Ninnescah, South Fork Ninnescah, Ninnescah, and the Upper Walnut River.<br />
Most flooding concerns in the county come from run-off into the Middle Arkansas/Slate River Drainage Basin<br />
area. The following in<strong>for</strong>mation <strong>for</strong> each watersheds is derived from the <strong>Kansas</strong> Department of health and<br />
Environment (KDHE) and reflects only those watersheds that have been evaluated so far.<br />
9.18.4.1 GAR PEACE<br />
The HUC8 11030010 watershed is ranked 19th in priority <strong>for</strong> watershed restoration throughout the state.<br />
According to the Unified Watershed Assessment, approximately 56% of the stream miles within this<br />
watershed are impaired. The Arkansas River, Gar Creek, Peace Creek and Salt Creek are among the larger<br />
streams and creeks within this watershed.<br />
Designated Uses<br />
There are 75 public water supplies within the watershed, many of which draw water from the Arkansas River<br />
and local streams. According to the <strong>Kansas</strong> Surface Water Register, the most common designated uses <strong>for</strong><br />
streams and rivers in this watershed include: aquatic life use, food procurement, contact recreation, domestic<br />
water supply, industrial water supply, irrigation use, livestock, and groundwater recharge.<br />
189
<strong>2010</strong>-<strong>2040</strong> <strong>HAZARDS</strong> <strong>ANALYSIS</strong> <strong>PLAN</strong><br />
Feedlots: In <strong>Kansas</strong>, confined animal feeding operations (CAFOs) with greater than 300 animal units must<br />
register with KDHE. There are approximately 85 registered CAFOs located within the watershed.<br />
Wastewater Treatment Facilities: There are approximately six municipal and industrial wastewater<br />
treatment facilities within the watershed.<br />
Urban/Suburban Runoff: Many urban landscapes are covered by paved surfaces including roads,<br />
driveways, parking lots, and sidewalks. These surfaces are impermeable and tend to divert water into storm<br />
drains at high velocities. This increased flow velocity from urban areas can cause severe stream bank<br />
erosion in receiving water bodies. Additionally, urban and suburban runoff may carry other pollutants like<br />
petroleum hydrocarbons and heavy metals. Currently, the watershed is only about 2% urban.<br />
Groundwater: Major groundwater aquifers underlying this watershed include the High Plains aquifer,<br />
portions of the Dakota aquifer, and alluvial aquifers of the Arkansas River and its tributaries.<br />
Wells: There are approximately 2,353 groundwater wells located within the watershed. Water from these<br />
wells is used <strong>for</strong> domestic use, lawn and garden, oil field supply, irrigation, monitoring wells, industrial supply,<br />
air conditioning, dewatering, public water supply, injection, and feedlots.<br />
9.18.4.2 LITTLE ARKANSAS<br />
The HUC8 11030012 watershed is ranked 14th in priority <strong>for</strong> watershed restoration throughout the state.<br />
According to the Unified Watershed Assessment, approximately 67% of the total miles of water in this<br />
watershed do not meet their designated uses. The Little Arkansas River, Emma Creek, and Sand Creek are<br />
a few of the larger streams and rivers in this watershed.<br />
Designated Uses<br />
This watershed is mostly a drainage basin <strong>for</strong> the Little Arkansas River; however, smaller streams and<br />
creeks are also abundant throughout the area. There are approximately 205 public water supplies within the<br />
watershed, many of which draw water from the Little Arkansas River and its alluvium. According to the<br />
<strong>Kansas</strong> Surface Water Register, the most common designated uses <strong>for</strong> streams and rivers in this watershed<br />
include: aquatic life uses, food procurement, industrial water supply, irrigation use, and contact recreational<br />
use.<br />
Feedlots: In <strong>Kansas</strong>, confined animal feeding operations (CAFOs) with greater than 300 animal units must<br />
register with KDHE. There are approximately 237 registered CAFOs located within HUC8 11030012.<br />
Wastewater Treatment Facilities: There are approximately 23 municipal and industrial wastewater<br />
treatment facilities within the watershed.<br />
Urban/Suburban Runoff: Many urban landscapes are covered by paved surfaces including roads,<br />
driveways, parking lots, and sidewalks. These surfaces are impermeable and tend to divert water into storm<br />
drains at high velocities. This increased flow velocity from urban areas can cause severe stream bank<br />
190
<strong>2010</strong>-<strong>2040</strong> <strong>HAZARDS</strong> <strong>ANALYSIS</strong> <strong>PLAN</strong><br />
erosion in receiving water bodies. Additionally, urban and suburban runoff may carry other pollutants like<br />
petroleum hydrocarbons and heavy metals. Currently, the watershed is only about 3% urban.<br />
HUC8 11030012 is the home to many city and county lakes along with one wetland area. Some of these<br />
include Newton City Park Lake, Inman Lake, and Harvey <strong>County</strong> West Park Lake. These lakes offer fishing,<br />
camping, and trails <strong>for</strong> hiking, boating, and swimming. The wetland area, called the McPherson Wetland<br />
Area, is located in the northern portion of the watershed.<br />
Groundwater: Major groundwater aquifers underlying this watershed include the High Plains and Dakota<br />
Aquifers along with alluvial aquifers of the Little Arkansas River and its tributaries.<br />
Wells: There are approximately 7,406 groundwater wells located within the watershed. Water from these<br />
wells is used <strong>for</strong> domestic use, lawn and garden, groundwater monitoring, and irrigation purposes.<br />
9.18.4.3 MIDDLE ARKANSAS SLATE<br />
The HUC8 11030013 watershed is ranked 6th in priority <strong>for</strong> watershed restoration throughout the state.<br />
According to the Unified Watershed Assessment, 43.4% of the total miles of water in this watershed do not<br />
meet their designated uses. The Arkansas River, Chisholm Creek, Spring Creek, and Cowskin Creek are<br />
among the larger streams and rivers.<br />
Designated Uses<br />
This watershed is mostly a drainage basin <strong>for</strong> the Arkansas River, however, several smaller streams, creeks,<br />
and rivers are also present throughout the area. There are 83 public water supplies within the watershed,<br />
many of which draw water from the Arkansas River and its alluvium. According to the <strong>Kansas</strong> Surface Water<br />
Register, the most common designated use <strong>for</strong> streams and rivers in this watershed include: aquatic life<br />
uses, food procurement; recreation, and groundwater recharge.<br />
Feedlots: In <strong>Kansas</strong>, confined animal feeding operations (CAFOs) with greater than 300 animal units must<br />
register with KDHE. There are approximately 92 registered CAFOs located within HUC8 11030013<br />
Wastewater Treatment Facilities: There are approximately 20 municipal and industrial wastewater<br />
treatment facilities within the watershed.<br />
Urban/Suburban Runoff: Many urban landscapes are covered by paved surfaces including roads,<br />
driveways, parking lots, and sidewalks. These surfaces are impermeable and tend to divert water into storm<br />
drains at high velocities. This increased flow velocity from urban areas can cause severe stream bank<br />
erosion in receiving water bodies. Additionally, urban and suburban runoff may carry other pollutants like<br />
petroleum hydrocarbons and heavy metals. Currently, the watershed is about 11.5% urban.<br />
Lakes & Wetlands<br />
HUC8 11030013 is the home to several smaller city and county lakes, as well as two wetland areas. Many of<br />
the lakes are used <strong>for</strong> recreational purposes such as camping and fishing but <strong>for</strong> the most part they are used<br />
<strong>for</strong> food procurement. The wetland areas, otherwise known as the Pracht Wetland and the Slate Creek<br />
191
<strong>2010</strong>-<strong>2040</strong> <strong>HAZARDS</strong> <strong>ANALYSIS</strong> <strong>PLAN</strong><br />
Wetland, occupy many aquatic species and filter runoff. Some of the smaller lakes in the watershed include<br />
Moss Lake, Watson Park Lake, Emery Park Lake, and Horseshoe Lake.<br />
Groundwater: Major groundwater aquifers underlying this watershed include portions of the High Plains<br />
and alluvial aquifers of the Arkansas River and its tributaries.<br />
Wells: There are approximately 8,191 groundwater wells located within the watershed. Water from these<br />
wells is used <strong>for</strong> domestic use, monitoring, and lawn and garden.<br />
9.18.4.4 NORTH FORK NINNESCAH<br />
The HUC8 11030014 watershed is ranked 7th in priority <strong>for</strong> watershed restoration throughout the state.<br />
According to the Unified Watershed Assessment, all of the streams and rivers miles sampled in this<br />
watershed meet their designated uses. The Ninnescah River, Red Rock Creek, and Dooleyville Creek are<br />
among the larger streams and rivers and most drain into the Cheney Reservoir.<br />
Designated Uses<br />
There are 55 public water supplies within the watershed, few of which draw water from the local rivers.<br />
According to the <strong>Kansas</strong> Surface Water Register, the most common designated uses <strong>for</strong> streams and rivers<br />
in this watershed include: special aquatic life use, expected aquatic life use, and food procurement.<br />
Lakes & Wetlands: Huc 8 11030014 is the home to Cheney Reservoir and several smaller city and county<br />
lakes. Cheney Reservoir is used <strong>for</strong> public water supply, recreational purposes, and flood control<br />
downstream. According to the Surface Water Register, Cheney Reservoir is designated <strong>for</strong> expected aquatic<br />
life use, food procurement, domestic and industrial water supply, and contact recreational purposes.<br />
Feedlots: In <strong>Kansas</strong>, confined animal feeding operations (CAFOs) with greater than 300 animal units must<br />
register with KDHE. There are approximately 70 registered CAFOs located within HUC 8 11030014<br />
Wastewater Treatment Facilities: There are approximately 14 municipal and industrial wastewater<br />
treatment facilities within the watershed.<br />
Groundwater: Major groundwater aquifers underlying this watershed include portions of the High Plains<br />
and Dakota aquifers, and alluvial aquifers of the Ninnescah River and its tributaries.<br />
Wells: There are approximately 2,312 groundwater wells located within the watershed. Water from these<br />
wells is used <strong>for</strong> domestic use, irrigation, feedlots, and industrial uses.<br />
9.18.4.5 SOUTH FORK NINNESCAH<br />
The HUC8 11030015 watershed is ranked 15th in priority <strong>for</strong> watershed restoration throughout the state.<br />
According to the Unified Watershed Assessment, approximately 21% of the total miles of water in this<br />
watershed do not meet their designated uses. The South Fork Ninnescah River, Coon Creek, and Painter<br />
Creek are a few of the larger streams and rivers in this watershed.<br />
192
<strong>2010</strong>-<strong>2040</strong> <strong>HAZARDS</strong> <strong>ANALYSIS</strong> <strong>PLAN</strong><br />
Designated Uses<br />
This watershed is mostly a drainage basin <strong>for</strong> the South Fork Ninnescah River; however, smaller streams<br />
and creeks are also abundant throughout the area. There are approximately 67 public water supplies within<br />
the watershed, many of which draw water from the South Fork Ninnescah and its alluvium.<br />
According to the <strong>Kansas</strong> Surface Water Register, the most common designated uses <strong>for</strong> streams and rivers<br />
in this watershed include: aquatic life uses, food procurement, domestic water use, groundwater recharge<br />
and industrial water supply.<br />
Feedlots: In <strong>Kansas</strong>, confined animal feeding operations (CAFOs) with greater than 300 animal units must<br />
register with KDHE. There are approximately 41 registered CAFOs located within HUC8 11030015<br />
Wastewater Treatment Facilities: There are approximately 10 municipal and industrial wastewater<br />
treatment facilities within the watershed.<br />
Urban/Suburban Runoff: Many urban landscapes are covered by paved surfaces including roads,<br />
driveways, parking lots, and sidewalks. These surfaces are impermeable and tend to divert water into storm<br />
drains at high velocities. This increased flow velocity from urban areas can cause severe stream bank<br />
erosion in receiving water bodies. Additionally, urban and suburban runoff may carry other pollutants like<br />
petroleum hydrocarbons and heavy metals. Currently, the watershed is only about 1% urban.<br />
Lakes & Wetlands: HUC8 11030015 is the home to many city and county lakes along with three wetland<br />
areas. Some of these include the Pratt <strong>County</strong> Lake, the Kingman <strong>County</strong> State Fishing Lake, and the<br />
Lemon Park Lake. These lakes offer fishing, camping, and trails <strong>for</strong> hiking, boating, and swimming. The<br />
wetland areas are called the Kingman State Fishing Lake Wetland, the Texas Lake Wetland Area, and the<br />
Kingman Wetland Area and are all located in the northern portion of the watershed. According to the<br />
Surface Water Register, the majority of the lakes/wetland areas in this watershed is designated <strong>for</strong> expected<br />
aquatic life use, food procurement, and contact recreational use.<br />
Groundwater: Major groundwater aquifers underlying this watershed include the High Plains and Dakota<br />
Aquifers along with alluvial aquifers of the South Fork Ninnescah River and its tributaries. See attachment 4<br />
<strong>for</strong> a map of groundwater aquifers.<br />
Wells: There are approximately 2,556 groundwater wells located within the watershed. Water from these<br />
wells is used <strong>for</strong> oil field supply, domestic use, irrigation, groundwater monitoring, lawn and garden, industrial<br />
supply, public water supply, air conditioning, and feedlots.<br />
193
<strong>2010</strong>-<strong>2040</strong> <strong>HAZARDS</strong> <strong>ANALYSIS</strong> <strong>PLAN</strong><br />
SEDGWICK COUNTY STATISTICAL DATA CHART<br />
207
<strong>2010</strong>-<strong>2040</strong> <strong>HAZARDS</strong> <strong>ANALYSIS</strong> <strong>PLAN</strong><br />
SECTION 5<br />
RISK ASSESSMENT
<strong>2010</strong>-<strong>2040</strong> <strong>HAZARDS</strong> <strong>ANALYSIS</strong> <strong>PLAN</strong><br />
10 HAZARD EVENT DETERMINATIONS<br />
The following categories presented in this section are weighted <strong>for</strong> determining the potential impact of<br />
hazards in <strong>Sedgwick</strong> <strong>County</strong>:<br />
Potential – Based on historical hazard events and weighting the worst of these events with resulting<br />
cascading effects<br />
Catastrophic – An event that has not historically occurred but has the probability of occurring based on<br />
the worst case conditions with resulting cascading effects<br />
10.1 HAZARD SEVERITY RATING<br />
The following section describes and rates each hazard that poses a threat to <strong>Sedgwick</strong> <strong>County</strong>. Ratings are<br />
categorized based on history, vulnerability, maximum threat, and probability. The following chart shows the<br />
score and final ratings <strong>for</strong> all hazards in <strong>Sedgwick</strong> <strong>County</strong>. Those receiving a rating of one hundred points<br />
and greater should receive priority in a descending order. The historical in<strong>for</strong>mation presented is a detailed<br />
comparison <strong>for</strong> hazard severity ratings.<br />
Risk<br />
Factor<br />
0<br />
1<br />
2<br />
3<br />
4<br />
Area<br />
Impacted<br />
No developed<br />
area<br />
Less than<br />
25%<br />
Less than<br />
50%<br />
Less than<br />
75%<br />
Over 75%<br />
Hazard Identification and Event Analysis<br />
Probability of<br />
Occurrence<br />
Consequence of Occurrence<br />
Health and<br />
Safety<br />
Property Environment Economic<br />
Unknown or rare No impact No damage No damage<br />
Every 500 years<br />
or less<br />
Every 100 years<br />
or less<br />
Every 25 years<br />
or less<br />
Once a year or<br />
more<br />
Minor injuries<br />
and/or illness<br />
Major<br />
illnesses<br />
and/or<br />
injuries<br />
Few fatalities<br />
Numerous<br />
fatalities<br />
NOTES:<br />
Few fatalities = Less than 5 deaths per event<br />
Numerous Fatalities = 5 deaths or greater per event<br />
Few<br />
damaged<br />
Few<br />
destroyed<br />
and/or<br />
damaged<br />
Many<br />
damaged<br />
and/or<br />
destroyed<br />
Mostly<br />
destroyed<br />
Minor damage<br />
Resources<br />
damaged with<br />
short term<br />
recovery<br />
practical<br />
Resources<br />
damaged with<br />
long term<br />
recovery<br />
feasible<br />
Resources<br />
destroyed<br />
beyond<br />
recovery<br />
No<br />
economic<br />
impact<br />
Low direct<br />
and/or low<br />
indirect<br />
costs<br />
High direct<br />
and low<br />
indirect<br />
costs<br />
Low direct<br />
and high<br />
indirect<br />
costs<br />
High direct<br />
and indirect<br />
costs<br />
208
<strong>2010</strong>-<strong>2040</strong> <strong>HAZARDS</strong> <strong>ANALYSIS</strong> <strong>PLAN</strong><br />
Direct Costs*<br />
The cost of repair and replacement of<br />
damaged and destroyed buildings<br />
The costs of damage to building contents<br />
The value of lost or damaged inventory<br />
Relocation expenses<br />
Lost productivity, service or sales<br />
Lost wages (employees), lost rental income<br />
(to building owners)<br />
Lost tax revenues and reduced tax base (<strong>for</strong><br />
local governments)<br />
Direct vs. Indirect Costs<br />
Indirect Costs*<br />
Disrupted or delayed sustainable economic<br />
growth (i.e., funds intended <strong>for</strong> economic<br />
development are redirected <strong>for</strong> disaster<br />
recovery)<br />
Reduced tourism, leisure, and business travel<br />
Environmental degradation<br />
Cultural and socioeconomic effects (i.e.,<br />
movement of population)<br />
Reduced real estate sales and depressed<br />
property values<br />
Long-term health issues<br />
*FEMA Course E464: Disaster-Resistant Jobs: Strategies <strong>for</strong> Community, Emergency, and Economic Risk<br />
Management<br />
10.2 MITIGATION <strong>PLAN</strong> METHODOLOGY<br />
Based on the experience of the representatives of the participating agencies, the hazards identified in the<br />
2009 <strong>Sedgwick</strong> <strong>County</strong> Multi-Jurisdiction Mitigation Plan have been revisited, reevaluated, reorganized, and<br />
reprioritized to reflect the hazards environment in <strong>Sedgwick</strong> <strong>County</strong> at the time of the <strong>2010</strong> Risk Assessment<br />
and Hazard Vulnerability Analysis Plan update. Twenty-two hazards have been identified as threatening and<br />
pose a sufficient level of human, economic, and/or environmental risk to the communities of the state that<br />
they warrant incorporation into this plan.<br />
Listed alphabetically, 2009 mitigation hazards include:<br />
Dam and Levee Failure Hailstorm Soil Erosion and Dust<br />
Drought Hazardous Materials Terrorism/Agri-Terrorism/Civil Disorder<br />
Earthquake Land Subsidence Tornado<br />
Expansive Soils Landslide Utility/Infrastructure Failure<br />
Extreme Temperatures Lightning Wildfire<br />
Flood Major Disease Outbreak Windstorm<br />
Fog Radiological Winter Storm<br />
The following natural hazards identified by FEMA are not included in this analysis because they do not<br />
threaten <strong>Kansas</strong>: avalanche, coastal erosion, coastal storm, hurricane, tsunami, and volcano. Thunderstorms<br />
are not identified because the damaging results of them are addressed in the following hazard profiles:<br />
lightning, windstorm, hailstorm, and flood.<br />
In 2009, <strong>Sedgwick</strong> <strong>County</strong> used the methodology from the MitigationPlan.com planning tool to prioritize the<br />
22 hazards. This prioritization was based on a calculated priority risk index (CPRI) that considered four<br />
elements of risk: probability, magnitude/severity, warning time, and duration. The table on the next page<br />
defines the levels <strong>for</strong> each element of risk.<br />
Using the levels described in the table above, the <strong>for</strong>mula used to determine each hazard’s CPRI, which<br />
includes weighting factors defined by MitigationPlan.com, was:<br />
(Probability x .45) + (Magnitude/Severity x .30) + (Warning Time x .15) + (Duration x .10) = CPRI<br />
Based on their CPRI, the hazards were separated into three categories of planning significance:<br />
High (3.0-4.0)<br />
Moderate (2.0-2.95)<br />
Low (1.1-1.95)<br />
209
<strong>2010</strong>-<strong>2040</strong> <strong>HAZARDS</strong> <strong>ANALYSIS</strong> <strong>PLAN</strong><br />
These terms relate to the level of planning analysis to be given to the particular hazard in the risk<br />
assessment process and are not meant to suggest that a hazard would have only limited impact. In order to<br />
focus on the most critical hazards, those assigned a level of significant or moderate were given more<br />
extensive attention in the remainder of this analysis (e.g., quantitative analysis or loss estimation), while<br />
those with a low planning significance were addressed in more general or qualitative ways.<br />
210
<strong>2010</strong>-<strong>2040</strong> <strong>HAZARDS</strong> <strong>ANALYSIS</strong> <strong>PLAN</strong><br />
11 HAZARD VULNERABILITY VS RISK ASSESSMENT<br />
11.1 FLOODS<br />
Definition: Any high flow, overflow, or inundation by water that causes or threatens damage (National<br />
Weather Service).<br />
BACKGROUND<br />
History of recorded flooding in <strong>Sedgwick</strong> <strong>County</strong> (Appendix A) begins in 1877 with the first significant flood.<br />
Since then, there have been 16 notable flood events, two of which were presidential declared disasters.<br />
Typically, surface water historically prone to flooding are the Arkansas River, Little Arkansas River,<br />
Ninnescah River, Jester Creek, Big Slough Creek, Little Slough Creek, Chisholm Creek, East Branch<br />
Chisholm Creek, Cowskin Creek, Calfskin Creek, Dry Creek, Gypsum Creek, Wildcat Creek, Clearwater<br />
Creek, Spring Creek, Indianola Creek, Jocelyn Creek, Mud Creek, Sand Creek, and Gooseberry Creek.<br />
In 1938, the most severe of the three floods, both the Little Arkansas and Jester Creek flooded, <strong>for</strong>cing many<br />
families on the west side of town to evacuate their homes. Poorly insulated houses leaked water into the<br />
basements and lower floors, causing people to move the upper stories of their houses. The flood was<br />
particularly harmful to the farmers because it washed out their crops and killed their livestock. The following<br />
years, in ’44 and ’51, the occurrences were basically the same. Houses flooded, farms were washed out and<br />
businesses were set back. 39<br />
INSURANCE AND REPETITIVE LOSS<br />
In <strong>Kansas</strong> as of August 2011, the 12,721 flood insurance policies have a combined premium price of<br />
$8,837,098 and provide $1,949,542,700 in coverage. Since 1978, there have been 6,455 total flood claims<br />
with $82,037,763 paid. Over the last 33 years, it appears <strong>for</strong> every two flood insurance policies in <strong>Kansas</strong><br />
there has been at least one flood insurance claim.<br />
A few factors can skew these numbers. One is that properties can have multiple flood insurance claims. For<br />
example, 436 properties in <strong>Kansas</strong> have filed more than one flood insurance claim over a certain amount.<br />
These properties are known as ―repetitive loss properties.‖ By definition, a repetitive loss property has had at<br />
least two claims of more than $1,000 during a rolling 10-year period. Taking this one step farther, a Severe<br />
Repetitive Loss Property has had at least four claims of more than $5,000 (including building and contents)<br />
or two separate claims payments made with the cumulative amount of the building portion of such claims<br />
exceeding the building’s market value.<br />
NATIONAL FLOOD INSURANCE PROGRAM (NFIP) CLAIMS FROM JAN 1, 1978 TO SEP 30, 2011<br />
Source: http://bsa.nfipstat.com/reports/1040.htm<br />
39 Valley Center: Its Founding & Major Events, Frank Hutchings, Valley Center, 1976<br />
211
<strong>2010</strong>-<strong>2040</strong> <strong>HAZARDS</strong> <strong>ANALYSIS</strong> <strong>PLAN</strong><br />
Nationally only 10% of people have flood insurance that need it. The table above is not portraying all<br />
properties that flood; it is only showing claim in<strong>for</strong>mation from property owners that actually have flood<br />
insurance. For instance, the City of Wichita has a variety of reports and basin studies that identify numerous<br />
structures that flood, which are not reflected in the claims in<strong>for</strong>mation displayed in the table above.<br />
The following events reflect the extent and magnitude of flooding in <strong>Sedgwick</strong> <strong>County</strong>. Areas of <strong>Sedgwick</strong><br />
<strong>County</strong> prone to flooding are shown on the 1986 Federal Emergency Management Agency’s (FEMA) 1986<br />
Flood Insurance Rate Map (FIRM) panels. A composite of the panels are shown below, with cities shown in<br />
yellow and blue, and flood prone areas shown in gray:<br />
The floods of 1944 and 1945 resulted from<br />
unusually heavy amounts of rainfall over<br />
the Little Arkansas River and Chisholm<br />
Creek watersheds. These floods are the<br />
maximum on record along the Little<br />
Arkansas River below Valley Center and<br />
along the lower reaches of the Chisholm<br />
Creek.<br />
Geologic evidence indicates that floods of<br />
greater intensity have occurred on these<br />
streams. The flood of 1942 is the largest<br />
known along the reach of Cowskin Creek below the Big Slough-Cowskin Floodway, as well as the Dry Creek.<br />
The maximum known flood on Cowskin Creek above the floodway occurred on October 2, 1955.The flood of<br />
July 1951, which was augmented by overflow from the Arkansas River, is the maximum known on Big<br />
Slough and Little Slough. The flood of October 2, 1955, on Big Slough and Little Slough is the maximum<br />
flood that occurred after training levees were constructed along the Arkansas River in 1953. That flood<br />
inundated nearly the same area as the 1951 flood. The flood of October 2, 1955, is the maximum known<br />
flood in the upper reaches of West Branch Chisholm Creek and West Fork West Branch Chisholm Creek.<br />
Floods of July 29, 1960, and August 24, 1960, were the maximum known floods in the Chisholm Creek and<br />
Spring Creek basins.<br />
212
<strong>2010</strong>-<strong>2040</strong> <strong>HAZARDS</strong> <strong>ANALYSIS</strong> <strong>PLAN</strong><br />
The October 1, 1973 flood peak was the largest on record and closely approximates the 100-year flood<br />
frequency. Floods on the Little Arkansas River exceed channel capacity on the average of once a year. The<br />
largest mitigation project that was constructed to provide protection to the City of Wichita is the U.S. Army<br />
Corps of Engineer (USACE) Wichita and Valley Center Local Protection Project (completed 1959). The<br />
project consists of non-regulatory control structures and levees and is designed to intercept the excess flow<br />
of Chisholm Creek, the Little Arkansas River, and the Arkansas River. A maximum flow of 25,000 cubic feet<br />
per second of storm water flows through Wichita in the natural river channels; the excess is directed around<br />
the city through the floodway. There have been no major floods in Wichita from the Arkansas or Little<br />
Arkansas Rivers since its completion.<br />
The following photos show the terrain be<strong>for</strong>e and after the Wichita and Valley Center Local Protection<br />
Project. The Ackerman Island west channel was filled in around 1934 where Lawrence Dumont stadium is<br />
now located to <strong>for</strong>m the new west bank of the Arkansas River.<br />
1938 Wichita Aerial View 2007 Wichita Aerial View<br />
The following map shows the Wichita and Valley Center Local Protection Project levee system in blue.<br />
Areas in red are designated as 500-year flood potential based on the overtopping and/or failure of the levee<br />
system.<br />
213
<strong>2010</strong>-<strong>2040</strong> <strong>HAZARDS</strong> <strong>ANALYSIS</strong> <strong>PLAN</strong><br />
Regulatory<br />
Effective October 13, 2004, <strong>Sedgwick</strong> <strong>County</strong> adopted a resolution (#183-2004) amending Chapter 13 of the<br />
<strong>Sedgwick</strong> <strong>County</strong> Code related to Floodplain Management <strong>for</strong> <strong>Sedgwick</strong> <strong>County</strong>, <strong>Kansas</strong>. The purpose of<br />
the chapter is to promote public health, safety, and general welfare and to minimize public and private losses<br />
due to flood conditions in specific areas by provisions designed to: protect human life and health; minimize<br />
expenditure of public money <strong>for</strong> costly flood control projects; minimize the need <strong>for</strong> rescue and relief ef<strong>for</strong>ts<br />
associated with flooding and generally undertaken at the expense of the general public; minimize prolonged<br />
business interruptions; minimize damage to public facilities and utilities such as water and gas mains,<br />
electric, telephone and sewer lines, streets and bridges located in floodplains; help maintain a stable tax<br />
base by providing <strong>for</strong> the sound use and development of flood prone areas in such a manner as to minimize<br />
future flood blight areas; ensure that potential home buyers are notified that property is in a flood area; and,<br />
ensure that those who occupy the areas of special flood hazard assume responsibility <strong>for</strong> their actions.<br />
As of November 17, <strong>2010</strong>, the following communities are participants in FEMA’s National Flood Program as<br />
reported in the Community Status Book Report:<br />
City of Andale City of Derby City of Mount Hope<br />
City of Bel Aire City of Garden Plain City of Park City<br />
City of Bentley City of Goddard City of <strong>Sedgwick</strong><br />
City of Cheney City of Haysville City of Valley Center<br />
City of Clearwater City of Kechi City of Wichita<br />
City of Colwich City of Maize <strong>Sedgwick</strong> <strong>County</strong><br />
Hazard Severity Ratings<br />
The following rating table indicates the probability of a major flood event occurring at least once every 25<br />
years, impacting less than 25% of the land, resulting in minor injuries and/or illnesses with few homes<br />
destroyed and/or damaged, having short term recovery of resources, and low direct and/or indirect costs.<br />
Catastrophic Event<br />
FLOOD HAZARD AND EVENT RATING TABLE<br />
Consequence Probable Rating Catastrophic Rating<br />
Area Impacted 1 3<br />
Probability 3 2<br />
Health & Safety 1 4<br />
Property 2 4<br />
Environment 2 3<br />
Economic 1 4<br />
Total Ratings 10 20<br />
A probable and catastrophic worst-case event resulting in the failure of the Wichita and Valley Center<br />
Floodway located on the west of the city. Events leading up to this type of event are conditions equal or<br />
exceeding the 1979 and 1998 flood events with near maximum capacities of the Little Arkansas River and<br />
Wichita Drainage Canals. Over half of the City of Wichita would be inundated by a sizeable breach of the<br />
levee system.<br />
214
<strong>2010</strong>-<strong>2040</strong> <strong>HAZARDS</strong> <strong>ANALYSIS</strong> <strong>PLAN</strong><br />
11.2 TORNADOES<br />
Definition: According to the Glossary of Meteorology (AMS 2000), a tornado is "a violently rotating column of<br />
air, pendant from a cumuli<strong>for</strong>m cloud or underneath a cumuli<strong>for</strong>m cloud, and often (but not always) visible as<br />
a funnel cloud." Literally, in order <strong>for</strong> a vortex to be classified as a tornado, it must be in contact with the<br />
ground and the cloud base. Tornadoes can travel over the ground at 20 to 40 mph, been known to reach 2.5<br />
miles in width, and have ground level wind speeds up to 318 mph.<br />
Although tornadoes have been documented on every continent, they occur most frequently in the United<br />
States east of the Rocky Mountains. <strong>Kansas</strong> is situated in an area that is generally known as ―Tornado<br />
Alley.‖ Climatological conditions are such that warm and cold air masses meet in the center of the country to<br />
create conditions of great instability and fast moving air at high pressure that can ultimately result in the<br />
<strong>for</strong>mation of tornado funnels.<br />
In <strong>Kansas</strong>, most tornadoes and tornado-related deaths and injuries occur during the months of April, May,<br />
and June. However, tornadoes have struck in every month. Similarly, while most tornadoes occur between<br />
3:00 and 9:00 p.m., a tornado can strike at any time.<br />
Prior to February 1, 2007, tornado intensity was measured by the Fujita (F) scale. This scale was revised<br />
and is now the Enhanced Fujita scale. Both scales are sets of wind estimates (not measurements) based on<br />
damage. The new scale provides more damage indicators (28) and associated degrees of damage, allowing<br />
<strong>for</strong> more detailed analysis and better correlation between damage and wind speed. It is also more precise<br />
because it takes into account the materials affected and the construction of structures damaged by a<br />
tornado. The table below shows the wind speeds associated with the original and enhanced Fujita scale<br />
ratings and the damage that could result at different levels of intensity. The Enhanced Fujita Scale’s damage<br />
indicators and degrees of damage can be found online at www.spc.noaa.gov/efscale/ef-scale.html.<br />
215
<strong>2010</strong>-<strong>2040</strong> <strong>HAZARDS</strong> <strong>ANALYSIS</strong> <strong>PLAN</strong><br />
216
<strong>2010</strong>-<strong>2040</strong> <strong>HAZARDS</strong> <strong>ANALYSIS</strong> <strong>PLAN</strong><br />
217
<strong>2010</strong>-<strong>2040</strong> <strong>HAZARDS</strong> <strong>ANALYSIS</strong> <strong>PLAN</strong><br />
TORNADO DAMAGE 1950–2006<br />
218
<strong>2010</strong>-<strong>2040</strong> <strong>HAZARDS</strong> <strong>ANALYSIS</strong> <strong>PLAN</strong><br />
TORNADO TRACK EVENTS REPORTED IN SEDGWICK COUNTY (1881-<strong>2010</strong>)<br />
About 59% of tornadoes occur during the months of May and June. Historical in<strong>for</strong>mation was obtained from<br />
the NOAA’s National Climatic Data Center (NCDC), the National Weather Service, and the book entitled<br />
―Significant Tornadoes 1680-1991‖ by Thomas P. Grazulis.<br />
Warning Time: Less than 10 minutes (sighting)<br />
Duration: Minutes to less than one hour<br />
Geographic Location<br />
While tornadoes can occur in all areas of the State of <strong>Kansas</strong>, historically, some areas of the state have<br />
been more susceptible to this type of damaging storm. The tornado figure shown on the next page illustrates<br />
the number of F3, F4, and F5 tornadoes recorded in the United States per 3,700 square miles between 1950<br />
and 1998. <strong>Sedgwick</strong> <strong>County</strong> is shown to have 16-25 tornadoes of this magnitude during this 48-year period.<br />
Additionally, according to the following wind zone figure, <strong>Sedgwick</strong> <strong>County</strong> is in Wind Zone IV, the zone in<br />
the US that has experienced the most and the strongest tornado activity.<br />
219
<strong>2010</strong>-<strong>2040</strong> <strong>HAZARDS</strong> <strong>ANALYSIS</strong> <strong>PLAN</strong><br />
Source: Taking Shelter from the Storm, FEMA, 2004<br />
220
<strong>2010</strong>-<strong>2040</strong> <strong>HAZARDS</strong> <strong>ANALYSIS</strong> <strong>PLAN</strong><br />
According to the National Weather Service, there have been a total of 3,051 tornadoes reported throughout<br />
the state of <strong>Kansas</strong> between 1950 and 2005, or annual average of 54.5 tornadoes. There have been 75<br />
tornado events recorded <strong>for</strong> <strong>Sedgwick</strong> <strong>County</strong> during that same period (Appendix B), or approximately 2.5%<br />
of the state total. In <strong>Sedgwick</strong> <strong>County</strong>, there were a reported 13 deaths and 321 injuries from the tornadoes,<br />
and resulting in over $427 million in damages/losses. About 59% of tornadoes occur during the months of<br />
May and June. Historical in<strong>for</strong>mation was obtained from the NOAA’s National Climatic Data Center (NCDC),<br />
the National Weather Service, and the book entitled ―Significant Tornadoes 1680-1991‖ by Thomas P.<br />
Grazulis.<br />
Regulatory<br />
Andale 1917 Wichita-Andover 1991<br />
Although there are no regulatory requirements <strong>for</strong> building protection, the Federal Emergency Management<br />
Agency (FEMA) does provide guidance under FEMA 361 ―Design and Construction Guidance <strong>for</strong> Community<br />
Shelters‖ <strong>for</strong> new construction. This guidance manual is <strong>for</strong> engineers, architects, building officials, and<br />
prospective shelter owners. It presents important in<strong>for</strong>mation about the design and construction of<br />
community shelters that will provide protection during tornado and hurricane events. For the purpose of this<br />
manual, a community shelter is defined as a shelter that is designed and constructed to protect a large<br />
number of people from a natural hazard event. This differs slightly from FEMA 320 ―Taking Shelter from the<br />
Storm: Building a Safe Room Inside Your House‖ which is a guidance manual <strong>for</strong> homeowners.<br />
Using Project Impact funding in 2001, the Wichita School District (USD 259) started undergoing an initiative<br />
<strong>for</strong> the construction of school shelters using criteria outlined in FEMA 361. Park Elementary contains the first<br />
multipurpose room shelter and was ready <strong>for</strong> use on March 25, 2002. About three months after completion it<br />
had already been used three times during high-wind events. As in many other schools, the hallways in Park<br />
Elementary were the originally designated refuge areas.<br />
Hazard Severity Ratings<br />
The following rating table indicates the probability of a major tornado event occurring at least once every 25<br />
years, impacting less than 25% of the land, resulting in few fatalities with many homes destroyed and/or<br />
damaged, having short term recovery of resources, and low direct and/or indirect costs.<br />
TORNADO HAZARD AND EVENT RATING TABLE<br />
Consequence Probable Rating Catastrophic Rating<br />
Area Impacted 1 1<br />
Probability 3 3<br />
Health & Safety 3 4<br />
Property 3 3<br />
Environment 2 3<br />
Economic 1 3<br />
Total Ratings 13 17<br />
221
<strong>2010</strong>-<strong>2040</strong> <strong>HAZARDS</strong> <strong>ANALYSIS</strong> <strong>PLAN</strong><br />
Catastrophic Event<br />
A catastrophic worst case event would be several tornadoes of category F3 and higher intensity from a multisupercell<br />
storm system striking the City of Wichita on work days between 0800 and 0900 hours, 1630 and<br />
1730 hours, and after 2100 hours. Transportation would be greatly impacted with high traffic volume during<br />
these workday periods, and nighttime hours can affect individual’s asleep and reduced visual acuity.<br />
Additional economic impact may result from the loss of the business center and historical sites (i.e. Old<br />
Town).<br />
222
<strong>2010</strong>-<strong>2040</strong> <strong>HAZARDS</strong> <strong>ANALYSIS</strong> <strong>PLAN</strong><br />
11.3 STORMS (WINTER-SUMMER)<br />
Definition: An atmospheric disturbance manifested in strong winds accompanied by rain, snow, or other<br />
precipitation and often by thunder and lightning.<br />
11.3.1 STORM CLASSIFICATIONS<br />
Single cell (pulse) storms are rare and typically last 20-30 minutes and can produce severe<br />
weather elements such as downbursts, hail, some heavy rainfall and occasionally weak tornadoes.<br />
Multicell cluster storms are a group of cells moving as a single unit, with each cell in a different<br />
stage of the thunderstorm life cycle and can produce moderate size hail, flash floods and weak<br />
tornadoes.<br />
Multicell line storms (squall lines) consist of a line of storms with a continuous, well developed<br />
gust front at the leading edge of the line and can produce small to moderate size hail, occasional<br />
flash floods and weak tornadoes.<br />
Supercells are thunderstorms with a rotating updraft, and can produce strong downbursts, large<br />
hail, occasional flash floods and weak to violent tornadoes.<br />
Severe Thunderstorms are defined any thunderstorm which produces tornadoes, hail 0.75 inches<br />
or more in diameter, or winds of 50 knots (58 mph) or more.<br />
Winter storm or heavy snow event consists of a snowfall of at least four inches in 12 hours or six<br />
inches in 24 hours.<br />
Blizzard consists of winds exceeding 56 km (35 mi) per hour and the temperature at -7° C (20° F) or<br />
lower combining with either falling snow or snow on the ground reducing visibilities to 1/4 mile or less<br />
<strong>for</strong> at least three hours.<br />
11.3.2 STORM DAMAGE EVENTS<br />
Downdrafts associated with thunderstorms can be very strong and<br />
localized, with damaging winds that can reach over 100 mph. A<br />
downburst is a strong downdraft that includes an outburst of<br />
potentially damaging winds on or near the ground (straight-line<br />
winds). Downbursts with a diameter of less than 2.5 miles are<br />
called microbursts whereas macrobursts are greater than 2.5 miles<br />
in diameter.<br />
A derecho is a widespread and long-lived windstorm that is<br />
associated with a band of rapidly moving thunderstorms that are<br />
often "curved" in shape and can appear on radar with a single bow<br />
echo or multiple bow echoes. They have sustained winds greater<br />
than 57 mph and can exceed over 100 mph in intensity.<br />
Gustnado (or Gustinado) is slang <strong>for</strong> a gust front tornado. It is a<br />
small tornado (F0 or F1), usually weak and short-lived, that occurs<br />
along the gust front of a thunderstorm. Often it is visible only as a<br />
debris cloud or dust whirl near the ground. Gustnadoes are not<br />
associated with storm-scale rotation (i.e. mesocyclones); they are<br />
more likely to be associated visually with a shelf cloud than with a<br />
wall cloud.<br />
223
<strong>2010</strong>-<strong>2040</strong> <strong>HAZARDS</strong> <strong>ANALYSIS</strong> <strong>PLAN</strong><br />
Hail is produced by intense thunderstorms as water droplets are<br />
picked up by strong updrafts and can be carried well above the<br />
freezing level. As the frozen droplets fall, the updraft can carry<br />
them back up to the top of the storm adding more ice layers.<br />
Typically the stronger the updraft, the more times a hailstone<br />
repeats this cycle and consequently, the larger it grows. Once the<br />
hail stone becomes too heavy to be supported by the updraft, it<br />
falls out of the cloud toward the surface. The hailstone reaches the<br />
ground as ice.<br />
11.3.3 THUNDERSTORMS<br />
Thunderstorms typically consist of winds, lightning, and precipitation which are reported individually by the<br />
NCDC. Wind events shown are <strong>for</strong> the period April 30, 1950 to August 31, 2011:<br />
Thunderstorm winds and high winds are synonymous in reporting but are listed separately in the<br />
NCDC database. The NCDC recorded 647 thunderstorm wind events resulting in 31 injuries, over<br />
$57 million in property damage, and $50,000 in crop damage. The NCDC recorded 20 high wind<br />
events resulting in one death, two injuries, and $1 million in property damage.<br />
Precipitation is heavy rainfall that does not become snow, fog, hail, or ice. The NCDC recorded nine<br />
(9) between September 2008 and September 2009 with no reportable damage.<br />
The following storm events are considered the most notable to affect <strong>Sedgwick</strong> <strong>County</strong>:<br />
June 14, 1931, the heaviest 15-minute rainfall ever recorded in Wichita occurred, when 1.52 inches<br />
fell.<br />
June 24, 1951, a massive hailstorm moved from South Central <strong>Kansas</strong> into southern Missouri. The<br />
storm produced a 200-mile long hail swath, and ranks as one of the most severe hailstorms in<br />
<strong>Kansas</strong>’s history.<br />
June 21, 1954, a severe hailstorm struck Wichita, <strong>Kansas</strong> and vicinity causing nine<br />
million dollars in damage.<br />
May 25, 1963, a 90-minute hailstorm battered much of Wichita, with hail as large as softballs. The<br />
storm damaged 81 schools.<br />
December 13, 1975, unusually strong December thunderstorms produced winds of 50 to 100 mph<br />
across South Central <strong>Kansas</strong>. Extensive damage occurred in both Wichita and Hutchinson.<br />
July 4, 1987, thunderstorms produced a wind gust to 82 mph in Clearwater <strong>Kansas</strong>.<br />
July 5, 1987, tornadoes and straight-line winds gusting to 100 mph, caused severe damage in the<br />
Wichita area. Three tornadoes struck eastern <strong>Sedgwick</strong>, and southern Butler counties. Straight-line<br />
winds of 80 to 100 mph hit El Dorado Lake.<br />
June 19, 1990, the "inland hurricane", unleashing winds from 80 to 120 mph, cut a 30-mile wide path<br />
from Pratt to Emporia. This storm knocked almost all of the TV and radio stations off the air. Total<br />
storm damage was in excess of 80 million dollars.<br />
June 19, 1992, a huge mass of thunderstorms <strong>for</strong>med over Hutchinson and took a wide swath<br />
southeast through Wichita and across the Oklahoma border south of Arkansas City affecting several<br />
<strong>Kansas</strong> counties. Hail up to the size of softballs accompanied the storms resulting in damage to<br />
more than 10,000 homes. Wichita, Derby, and points in northwestern Sumner and Cowley Counties<br />
were especially hard hit. Roof and window damage was widespread. Cars lost windshields and<br />
224
<strong>2010</strong>-<strong>2040</strong> <strong>HAZARDS</strong> <strong>ANALYSIS</strong> <strong>PLAN</strong><br />
were severely dented. That part of Wichita between Ridge Road and the Arkansas River was hit<br />
especially hard; as was Derby. Ten people were treated <strong>for</strong> minor injuries at the Hutchinson<br />
hospital, and 60 were treated in Wichita hospitals primarily <strong>for</strong> minor cuts from broken glass due to<br />
the widespread midday severe thunderstorms. The driver of a tractor-semi trailer was injured when<br />
a wind gust overturned the truck at interstate 235 and K-42 Highways. The hail left most wheat fields<br />
in its path a near total loss of 167,000 acres of cropland damaged in <strong>Sedgwick</strong> <strong>County</strong>, 100,000<br />
acres in Sumner <strong>County</strong>, 50,000 acres in Cowley <strong>County</strong>, 30,000 acres in Reno <strong>County</strong>, and 15,000<br />
acres each in Harvey and Butler Counties. The storms also spawned three tornadoes, but each<br />
touched ground only briefly and left no damage. High winds caused considerable damage in<br />
Medora, Buhler, Mount Hope, and Wichita. This ranked as one of the most damaging storms on<br />
record in <strong>Kansas</strong>. In all, property damage estimates totaled nearly $500 million, with crop damage at<br />
another $100 million. The majority of the property damage was done in and near Wichita during the<br />
midday severe storm ranked several south-central <strong>Kansas</strong> counties.<br />
July 1, 1994, a massive windstorm, known as a derecho, rolled southeast across <strong>Kansas</strong>. It caused<br />
tremendous damage over the central and eastern parts of the state. Hurricane-<strong>for</strong>ce winds blew<br />
across the county as thunderstorms rumbled through. Eighty-two mph winds were recorded in Valley<br />
Center where a metal shed was blown over and fences were damaged. The winds were not as<br />
strong when they went across Wichita and were about 65 mph. Damage in Wichita was mainly<br />
broken tree limbs and downed fences. Winds were clocked at 101 mph in Goddard where three<br />
trailers blew over and 70 feet of sheet metal was peeled off the side of the Rubbermaid plant.<br />
Clearwater was the hardest hit where the fire department lost its roof and ceiling and half of the<br />
lumber company building was blown away. Damage just to power lines and poles were $10 million.<br />
One hundred fifty thousand <strong>Kansas</strong> Gas and Electric customers were without power--some <strong>for</strong> four<br />
days. One Andale farmer lost ten percent of his corn crop, otherwise there was no major crop loss.<br />
Total loss in this storm event was approximately $50 million in property damage, and about $50,000<br />
in crop damage.<br />
July 10, 1998, severe thunderstorm winds, ranging from 52-80KT, ripped across the Wichita<br />
Metropolitan area, inflicting widespread damage to trees, roofs, power lines and power poles.<br />
Approximately 60,000 people lost power, about 15,000 of which remained without power <strong>for</strong> 3 days.<br />
Total loss in this storm event was approximately $3 million.<br />
June 17, 2004, a severe thunderstorm affected Cheney with winds up to 80 knots, causing major<br />
tree damage and some minor damage to buildings. One garage and two metal buildings were<br />
destroyed. Total loss in this storm event was approximately $600,000.<br />
11.3.4 HAIL<br />
The NCDC also recorded 909 events of hail between April 30, 1950 and August 31, 2011 resulting in over<br />
$302 million in property damage/loss, $20 million in crops damage/loss, and 80 injuries during the same<br />
period. The following table shows a breakdown of hail sizes and number of reported occurrences:<br />
Size (Inch) Occurrences Size (Inch) Occurrences<br />
0.75 (Penny) 222 2.50 (Tennis Ball) 13<br />
0.88 (Nickel) 97 2.75 (Baseball) 17<br />
1.00 (Quarter) 263 3.00 (Tea Cup) 5<br />
1.25 (Half Dollar) 39 4.00 (Grapefruit) 3<br />
1.50 Walnut/Ping Pong 49 4.50 (Softball) 9<br />
1.75 Golf Ball 163 5.0 1<br />
2.00 Hen Egg 23 7.75 1<br />
2.25 1 Unclassified 2<br />
The following recent hail events are notable due to the amount of property and crop<br />
damage/loss including injuries:<br />
225
<strong>2010</strong>-<strong>2040</strong> <strong>HAZARDS</strong> <strong>ANALYSIS</strong> <strong>PLAN</strong><br />
April 24, 2006 – An early morning severe thunderstorm pounded western and central portions of<br />
<strong>Sedgwick</strong> <strong>County</strong> with destructive hail as large as 3 inches in diameter between roughly 6:10 and<br />
6:30 AM CST. Several instances of 1.75 to 3 inch hail occurred from Goddard into western and<br />
central portions of Wichita, generally between 13th and Kellogg, and into the downtown area.<br />
Another area of large hail around 1.75 inches in diameter affected northern and northeast portions of<br />
Wichita, generally east of I-135 along K96. Surrounding the very large hail area were numerous<br />
reports of 0.75 to 1.25 inch hail, affecting portions of South, North, and East Wichita. The large hail<br />
inflicted widespread property damage across the Wichita area, some of which was rather severe, to<br />
automobiles, homes, and businesses. A handful of golf courses had to close <strong>for</strong> the day due to large<br />
divots on the putting greens, and Botanica Gardens just west of downtown sustained damage.<br />
Additionally, 17 police cars at the Patrol West Bureau near Central and I-235 had windows and/or<br />
flashing emergency lights shattered. Property damage estimates were $70 million.<br />
July 8, <strong>2010</strong> – Large Hail ranging in size from golf ball to baseball sized moved across Downtown<br />
Wichita, causing devastating damage to cars and roofs. During the half hour hail storm, thousands of<br />
cars either had roof, windshield or hood damage. Insurance agencies reported 10 to 15 thousand<br />
cars may have damaged by the hail storm. The hail was so large and numerous that it killed<br />
numerous birds in the Delano district, and injured 20 fans at Lawrence Dumont Stadium as the hail<br />
turned the minor league baseball field white. Stain glassed windows were destroyed at Friends<br />
University and hundreds of homes and businesses received roof and window damage. Property<br />
damage estimates were $10 million.<br />
September 15, <strong>2010</strong> – A combination of a low pressure area along the <strong>Kansas</strong> Oklahoma border,<br />
and an outflow boundary across South Central <strong>Kansas</strong>, led to the development of supercell<br />
thunderstorms across South Central <strong>Kansas</strong>. The swath of hail was approximately 5 miles wide and<br />
15 miles long, stretching from northwest of Goddard, <strong>Kansas</strong> through the western and southern half<br />
of Wichita, <strong>Kansas</strong> to near Rose Hill, <strong>Kansas</strong>. Hail as large as softball and grapefruit size pounded<br />
roofs and cars along its path with over 35,000 claims turned into insurance agencies with property<br />
losses at $150 million. Some of the hail came through roofs, including the terminal at the Mid<br />
Continent Airport in Wichita. Three commercial airliners were damaged and had to be towed to<br />
hangers <strong>for</strong> repairs. The National Weather Service in Wichita suffered damage to its vehicles,<br />
including one hail dent that was almost 10 inches across. One such hail stone in West Wichita,<br />
<strong>Kansas</strong>, breaking the state record with a diameter of 7.75 inches. A few weak tornadoes were also<br />
produced, with all the tornadoes moving across open country.<br />
June 9, 2011 – Hail up to golfball size fell in a wide band from near Garden Plain to Goddard,<br />
producing drifts of hail at times. The hail often occurred with wind gusts up to 60 mph winds. The<br />
large hail likely inflicted damage to various roofs and vehicles. According to newspaper reports, up<br />
to 100,000 acres of wheat may have been damaged across the area. Crop damage was estimated at<br />
$20 million while property damage was estimated at $1 million. Hail up to baseball and softball size<br />
also pummeled the Mount Hope area in <strong>Sedgwick</strong> <strong>County</strong>, associated with an impressive supercell<br />
thunderstorm. That same storm produced a brief tornado near Colwich, producing no known<br />
damage. Other storms produced many other reports of large hail and damaging winds across the<br />
area, producing additional property and crop damage ($3 million), particularly across <strong>Sedgwick</strong><br />
<strong>County</strong>. Additionally, very heavy rainfall on the order of 2 to 3 inches produced widespread street<br />
flooding across the Wichita Area.<br />
11.3.5 SNOW AND ICE STORMS<br />
The NCDC recorded 42 snow & ice storm events between April 30, 1950 and August 31, 2011 resulting in<br />
approximately $49 million in damages, 5 deaths and 18 injuries. A 1998 storm spread 6-10 inch snowfalls<br />
across South-Central <strong>Kansas</strong> with locally heavier amounts around 1 foot in parts of <strong>Sedgwick</strong>, Sumner,<br />
Cowley and Butler counties. This was the worst snowstorm to hit South-Central <strong>Kansas</strong> in 27 years.<br />
Freezing rain and sleet became so intense in 2001 that widespread ice accumulations of 1/4-3/4 inch teamed<br />
with north winds of 20-30 mph to result in spotty power outages and numerous accidents. Sleet reached<br />
depths around 1 inch. An estimated 100 accidents occurred just in the Wichita area alone.<br />
226
<strong>2010</strong>-<strong>2040</strong> <strong>HAZARDS</strong> <strong>ANALYSIS</strong> <strong>PLAN</strong><br />
Other notable stow and ice storm events to affect <strong>Sedgwick</strong> <strong>County</strong> are as follows:<br />
January 13, 1886, a massive blizzard struck nearly all of <strong>Kansas</strong> with little warning. The storm<br />
claimed between 50 and 100 lives, and nearly 80 percent of the cattle in the state were killed.<br />
September 26, 1942, a trace of snow was observed in Wichita. This is the earliest snowfall on record<br />
<strong>for</strong> the city.<br />
March 15, 1970, the greatest 24-hour snowstorm in Wichita's history began. By the 17th, 13.5 inches<br />
had accumulated at Wichita's Mid Continent Airport.<br />
February 21, 1971, a blizzard struck the southern half of <strong>Kansas</strong>, dumping 10 to 13 inches of snow.<br />
Northeast winds up to 40 mph produced near zero visibility. Wichita's Mid Continent Airport received<br />
12.8 inches of snow, making it one of the 5 worst snowstorms to hit the area since weather records<br />
began in 1888.<br />
March 20, 1984, a major winter storm ravaged an area from Western <strong>Sedgwick</strong> <strong>County</strong> north and<br />
northeast to <strong>Kansas</strong> City. Snowfall ranged from 6 inches to one foot. The top 76 feet of the KFDI<br />
radio tower buckled under the weight of the ice, and a 1,400-foot TV tower near Topeka collapsed.<br />
January 29, 2002, precipitation began late Tuesday afternoon (Jan 29th) in South Central <strong>Kansas</strong> in<br />
the <strong>for</strong>m of freezing rain and drizzle. The areas that<br />
experienced the most precipitation also had numerous<br />
power outages due to ice accumulation on the trees that<br />
fell on power lines. Sleet and ice accumulation depths<br />
were on the order of 1 to 2 inches. A presidential<br />
declaration (FEMA-1402-DR) was issued on February 6,<br />
2002 covering an incident period between January 29 and<br />
February 15 of which <strong>Sedgwick</strong> <strong>County</strong> was covered<br />
under individual assistance.<br />
January 3, 2005, a strong cold front surged south across <strong>Kansas</strong> & Oklahoma be<strong>for</strong>e stalling<br />
along/near the Red River during the afternoon of the 4th. A shallow layer of moist, sub-freezing air<br />
spread south over all but Southeast <strong>Kansas</strong>, as an 850-mb cold front, oriented in a southwest to<br />
northeast manner from the Oklahoma Panhandle to near <strong>Kansas</strong> City, teamed with an inverted 850-<br />
mb troph positioned over Western <strong>Kansas</strong> to enable much warmer, moisture-laden air to overrun the<br />
layer of sub-freezing air beneath. The result was what many consider to be the worst ice storm since<br />
1982 to ravage all of Central & most of South-Central <strong>Kansas</strong> from the afternoon of the 4th thru the<br />
morning of the 5th, coating almost the entire warning area with 1/2 to 1 inch of ice. Although freezing<br />
rain was the primary culprit, the winter storm was magnified considerably by periods of sleet that<br />
accumulated to depths of 1 to 2 inches.<br />
In Central <strong>Kansas</strong>, the situation was further worsened by periods of light snow that accumulated to 3 to 5<br />
inch depths in Russell, Lincoln, and Saline counties. Damage to trees and power lines were major! In the<br />
latter case, the damage resulted both from heavy ice accumulations as well as from trees and limbs that fell<br />
onto the power lines in question. Trees as tall as 22 feet were split and either fell or eventually felled, and<br />
limbs of 6-12 inches were downed at many locations. In some cases, the downed trees and limbs blocked<br />
roads and highways. No doubt, power outages were widespread, with many areas experiencing multiple<br />
outages. A few areas were without power <strong>for</strong> 1 1/2 weeks. Countless residents were <strong>for</strong>ced to evacuate their<br />
homes, seeking refuge in designated shelters. Fires posed major problems, and were ignited primarily by<br />
power lines falling onto trees and houses. Particularly hard hit were Butler & <strong>Sedgwick</strong> counties.<br />
In <strong>Sedgwick</strong> <strong>County</strong>, an estimated $15 million damage was inflicted; $7.5 million upon Wichita alone.<br />
WESTAR Energy, assisted by power companies from 15 states, provided an estimated 360,000 electrical<br />
service restorations to 211,000 customers; 121,000 in Wichita. On January 4th, <strong>Sedgwick</strong> <strong>County</strong><br />
Communications was deluged by 561 calls between 12 noon and 12 midnight, an average of 1 call every 77<br />
seconds <strong>for</strong> 12 consecutive hours. On January 4th, WESTAR Energy received around 104,000 calls. Typical<br />
227
<strong>2010</strong>-<strong>2040</strong> <strong>HAZARDS</strong> <strong>ANALYSIS</strong> <strong>PLAN</strong><br />
call volume is around 8,000. On January 6th, more power outages resulted as melting ice fell from power<br />
lines, causing them sag further then whip or snap, as well as from damaged limbs that thawed and fell onto<br />
power lines.<br />
As of Saturday evening, January 8th, approximately 30,300 WESTAR customers in Wichita were still without<br />
power. Other counties experiencing $1 million or more in damage: Harvey: $3,300,000; Harper: $1,730,420;<br />
Kingman: $1,199,000. Obviously, countless accidents occurred, and were not only traffic-related, but also<br />
occurred during the extensive cleanup of tree damage.<br />
It was in Wichita that all three fatalities occurred. In South Wichita, a 63-year old woman succumbed to<br />
carbon monoxide after using a portable generator inside her home. Also in South Wichita, an unidentified<br />
elderly man using a portable generator was found dead in his home. (Pending further details, his age listed<br />
at the end of this report is an approximation.) In West Wichita, an 80-year old man died outside his home<br />
while trying to remove downed tree limbs. Two people were seriously injured. A 39-year old man was listed<br />
in serious condition at Via Christi Regional Medical Center with head and neck injuries after a 15-foot tree<br />
limb fell as he was sawing it, and a power line crewman was listed in serious condition at Via Christi<br />
Regional Medical Center's burn unit when he came into contact with a 12,700 volt power line.<br />
Approximately 370 utility crews<br />
from 15 states assisted WESTAR<br />
Energy with power restoration.<br />
Working 12-16 hour days, the<br />
crews responded from as far as<br />
Illinois, Indiana, Kentucky,<br />
Minnesota, New Mexico, South<br />
Texas, Tennessee, and West<br />
Virginia. A presidential declaration<br />
(FEMA-1579-DR)<br />
was declared on February 8, 2005 during the incident period January 4-6, 2005 <strong>for</strong> public<br />
assistance <strong>for</strong> the counties highlighted on the map shown.<br />
Estimated storm loss data consist of windstorm, tornado and hail damage or other weather-related claim<br />
losses <strong>for</strong> insured real and personal property in <strong>Kansas</strong> reported <strong>for</strong> each calendar year and monthly during<br />
the calendar year. No other insured perils are included in the data. The data shown on the next page<br />
includes only estimated storm losses reported at the request of the Insurance Commissioner by the private<br />
insurance companies selling and servicing property insurance coverage in <strong>Kansas</strong>. (<strong>Kansas</strong> Insurance<br />
Department)<br />
<strong>Kansas</strong> Estimated Storm Losses<br />
Year No. Storm Claims Est. Storm Losses<br />
1996 46,150 $100,000,000<br />
1997 53,600 $87,950,300<br />
1998 30,250 $103,700,000<br />
1999 80,925 $350,000,000<br />
2000 35,344 $118,000,000<br />
2001 103,149 $256,700,000<br />
2002 82,872 $248,800,000<br />
2003 63,778 $275,000,000<br />
2004 50,250 $199,550,000<br />
2005 63,875 $184,000,000<br />
2006 133,285 $394,287,000<br />
2007 32,290 $325,100,000<br />
2008 131,485 $595,800,000<br />
228
<strong>2010</strong>-<strong>2040</strong> <strong>HAZARDS</strong> <strong>ANALYSIS</strong> <strong>PLAN</strong><br />
<strong>Kansas</strong> Estimated Storm Losses – Cont’d<br />
2009 137,400 $602,000,000<br />
<strong>2010</strong> 94,400 $370,000,000<br />
2011 197,255 $1,095,030,000<br />
Estimated storm loss data consist of windstorm, tornado, and hail damage or other weather-related claim<br />
losses <strong>for</strong> insured real and personal property in <strong>Kansas</strong> reported <strong>for</strong> each calendar year and monthly during<br />
the calendar year. Estimated flood losses and other insured perils are not included in the data. The data<br />
include only estimated storm losses reported at the request of the Insurance Commissioner by the private<br />
insurance companies selling and servicing property insurance coverage in <strong>Kansas</strong>.<br />
There is no <strong>Kansas</strong> state law requiring the collection of the storm loss data. This reporting of estimated<br />
insured storm losses is a service provided by the Insurance Commissioner to the insuring public and news<br />
media.<br />
Estimated storm loss data are collected from insurance companies by the Commissioner, usually on a<br />
monthly basis and through special calls to report particularly significant tornado damage in cities, counties, or<br />
other affected areas. Data are reported to the public through news releases and on the website.<br />
Regulatory<br />
There is no regulatory guidance <strong>for</strong> thunderstorm, hail, snow or ice storm events. However, since each of<br />
these events can also cause flooding and tornadic events, FEMA 320 and 361 can greatly reduce or<br />
eliminate the effects of summer and winter storm events. Also, mitigative ef<strong>for</strong>ts such as alternate power<br />
sources (backup generators) and burying electrical power lines can also greatly improve continuity of utility<br />
service.<br />
Hazard Severity Ratings<br />
The following rating table indicates the probability of a major storm event occurring annually, impacting less<br />
than 50% of the land, resulting in minor injuries and/or illnesses, with few homes damaged, having short term<br />
recovery of resources, and low direct and/or indirect costs.<br />
Catastrophic Event<br />
Consequence<br />
STORM HAZARD AND EVENT RATING TABLE<br />
Probable<br />
Rating<br />
Catastrophic<br />
Rating<br />
Area Impacted 2 4<br />
Probability 4 3<br />
Health & Safety 1 3<br />
Property 1 2<br />
Environment 2 2<br />
Economic 1 2<br />
Total Ratings 11 16<br />
Summer storms comparable to the June 19, 1992 storm event would be classified as catastrophic due to<br />
causing power outages, impeding transportation, property and crop damages, and causing numerous injuries<br />
and/or deaths. Winter storms comparable to the March 20, 1984 snow event and the January 3, 2005 winter<br />
ice storm event could be classified as a catastrophic event since electrical power outages were impeded <strong>for</strong><br />
several days as well as transportation.<br />
229
<strong>2010</strong>-<strong>2040</strong> <strong>HAZARDS</strong> <strong>ANALYSIS</strong> <strong>PLAN</strong><br />
11.4 DROUGHT<br />
Definition: A deficiency of precipitation over an extended period of time, resulting in a water shortage <strong>for</strong><br />
some activity, group, or environmental sector. (National Drought Mitigation Center)<br />
According to the United States Geological Survey (USGS), five<br />
droughts were identified <strong>for</strong> the State of <strong>Kansas</strong> that has directly<br />
or indirectly impacted <strong>Sedgwick</strong> <strong>County</strong>. The following<br />
in<strong>for</strong>mation is provided by the USGS on each of these drought<br />
periods:<br />
1929-42: Regional in scale and affected many of the Midwestern<br />
and Western States. The recurrence interval was greater than 25<br />
years throughout <strong>Kansas</strong>. Although the number of streamflow<br />
records long enough to include the entire drought was insufficient,<br />
data from adjoining States confirmed the severity. Agricultural<br />
losses during the 1929-41 droughts were extreme, and many<br />
farms were abandoned.<br />
1952-57: This drought also was regional with a recurrence interval greater than 25 years statewide except in<br />
the Big Blue River Basin, where the recurrence interval was 10-25 years. Because of its severity and areal<br />
extent, the drought of 1952-57 is used as the base period <strong>for</strong> studies of reservoir yields in <strong>Kansas</strong>.<br />
1962-72: Regional drought duration varied considerably across the State. Many of the streamflow records<br />
indicated alternating less-than-average and greater-than-average flows, whereas others indicated a steady<br />
deficit throughout the entire period. Similarly, the drought of 1974-82 appeared to be a series of relatively<br />
short-duration droughts at several gauging stations but sustained or long-term droughts at others.<br />
1962-72: This drought recurrence interval generally was greater than 25 years. However, in parts of the<br />
northwestern, northeastern, southern, and southeastern areas of the State, recurrence intervals were 10-25<br />
years. The recurrence interval of the 1974-82 droughts was greater than 25 years in the north-central and<br />
southeastern parts but was between 10 and 25 years across the remaining eastern two-thirds of the State.<br />
Because of inadequate streamflow in<strong>for</strong>mation <strong>for</strong> comparison, the severity of the 1974-82 drought could not<br />
be determined in the western one-third of the State.<br />
1988: The severity of this drought varied across the State. The drought was most severe in the<br />
southwestern, central, and northeastern parts of the State but minimal in the northwestern and southeastern<br />
parts. At the beginning of the drought, reservoir storage was near or above average; hence, surface-water<br />
supplies were sufficient to meet demands through the end of water year 1988. Rainfall during the period<br />
generally was less than 50 percent of the long-term average, and quantities were insufficient to maintain soil<br />
moisture or contribute to ground-water supplies. The decreased soil moisture resulted in considerable<br />
damage to maturing grain crops, decreased the growth of <strong>for</strong>age grasses, and threatened the germination of<br />
the winter wheat crop. Estimated losses to 1988 crops resulting from the effects of the drought were $1<br />
billion (Wichita Eagle and Beacon, June 7, 1989). Water levels in the shallow aquifers declined rapidly, which<br />
resulted in the abandonment of many domestic water wells. At the end of 1988, the effects of the drought<br />
were continuing to worsen. As a result, State and local officials were considering measures to decrease<br />
water use and were requesting financial relief <strong>for</strong> the agricultural industry.<br />
The drought of 1988 continued into the 1990's, but at a reduced level. In the fall of 1989 precipitation<br />
returned to near normal, and the spring of 1990 was somewhat wet. However, by the fall of 1990 it had dried<br />
out again and continued until July of 1992. It has continued to be on the wet side since the fall of 1992,<br />
except <strong>for</strong> a dry winter of 1995-96 and the current water year (2000).<br />
230
<strong>2010</strong>-<strong>2040</strong> <strong>HAZARDS</strong> <strong>ANALYSIS</strong> <strong>PLAN</strong><br />
Scientists at NASA’s Goddard Space Flight Center generate groundwater and soil moisture drought<br />
indicators each week. They are based on terrestrial water storage observations derived from GRACE<br />
satellite data and integrated with other observations, using a sophisticated numerical model of land surface<br />
water and energy processes. The drought indicators describe current wet or dry conditions, expressed as a<br />
percentile showing the probability of occurrence within the period of record from 1948 to the present.<br />
<strong>Sedgwick</strong> <strong>County</strong> is shown to be approximately 20%:<br />
United States: Percent of Time in Drought, 1895–1995<br />
231
<strong>2010</strong>-<strong>2040</strong> <strong>HAZARDS</strong> <strong>ANALYSIS</strong> <strong>PLAN</strong><br />
The following Palmer Drought Severity Indices show the levels of precipitation <strong>for</strong> south central <strong>Kansas</strong><br />
between January 1900 to February 2009 with a tabulated summary at the end.<br />
232
<strong>2010</strong>-<strong>2040</strong> <strong>HAZARDS</strong> <strong>ANALYSIS</strong> <strong>PLAN</strong><br />
233
<strong>2010</strong>-<strong>2040</strong> <strong>HAZARDS</strong> <strong>ANALYSIS</strong> <strong>PLAN</strong><br />
234
<strong>2010</strong>-<strong>2040</strong> <strong>HAZARDS</strong> <strong>ANALYSIS</strong> <strong>PLAN</strong><br />
235
<strong>2010</strong>-<strong>2040</strong> <strong>HAZARDS</strong> <strong>ANALYSIS</strong> <strong>PLAN</strong><br />
PUBLIC WATER SUPPLIER VULNERABILITIES<br />
Drought can severely challenge a public water supplier through depletion of the raw water supply and greatly<br />
increased customer water demand. Even if the raw water supply remains adequate, problems due to limited<br />
treatment capacity or limited distribution system capacity may be encountered. A 2007 assessment of 800<br />
city or rural water district drinking water systems by the <strong>Kansas</strong> Water Office found 133 in the State of<br />
<strong>Kansas</strong> of which three (3) are shown to be in <strong>Sedgwick</strong> <strong>County</strong> as drought vulnerable:<br />
Derby (El Paso WC) – Distribution System<br />
Goddard – Distribution System<br />
<strong>Sedgwick</strong> RWD #02 - Contractual<br />
Drought Limitation Categories<br />
Contractual Limitation—The supplier’s sole water source is purchased from another system that is drought<br />
vulnerable and there is a drought-cut-off clause in their water purchase contract. In such situations where<br />
there is not a drought cut-off clause, the purchaser is considered drought vulnerable under the same<br />
limitation category as the seller.<br />
Distribution System Limitation—The supplier has difficulty or is unable to meet drought-induced customer<br />
demand <strong>for</strong> water because of inadequate finished water storage capacity, inadequate finished water<br />
pumping capacity, inadequate transmission line sizes, etc.<br />
Regulatory<br />
The <strong>Kansas</strong> Emergency Management Act (K.S.A. 48-924) states that the Governor shall be responsible <strong>for</strong><br />
meeting the dangers to the state and people presented by disasters, and that the Governor may declare a<br />
state of drought <strong>for</strong> specific areas or communities, <strong>for</strong> specific water sources, or statewide. The <strong>Kansas</strong><br />
Water Office is charged by statute (K.S.A. 74-2608), with advising the Governor when drought conditions<br />
exist within the state, and recommending assembly of the Governor's Drought Response Team.<br />
The descriptions in the following table are from the U.S. Drought Monitor while the possible impacts are<br />
derived from both sources. Impacts are shown <strong>for</strong> illustrative purposes only and may vary throughout the<br />
state or from time-to-time.<br />
236
<strong>2010</strong>-<strong>2040</strong> <strong>HAZARDS</strong> <strong>ANALYSIS</strong> <strong>PLAN</strong><br />
KANSAS PHASED DROUGHT RESPONSE SUMMARY<br />
(Ref: <strong>Kansas</strong> Water Office Operations Plan)<br />
Hazard Severity Ratings<br />
The following rating table indicates the probability of a major drought event occurring every 25 years or less,<br />
impacting over 75% of the land, resulting in minor injuries and/or illnesses, with few homes (property)<br />
damaged, having short term recovery of resources, and low direct and/or indirect costs.<br />
DROUGHT HAZARD AND EVENT RATING TABLE<br />
Consequence<br />
Probable<br />
Rating<br />
Catastrophic<br />
Rating<br />
Area Impacted 4 4<br />
Probability 3 3<br />
Health & Safety 1 1<br />
Property 1 2<br />
Environment 2 2<br />
Economic 1 2<br />
Total Ratings 11 14<br />
237
<strong>2010</strong>-<strong>2040</strong> <strong>HAZARDS</strong> <strong>ANALYSIS</strong> <strong>PLAN</strong><br />
Catastrophic Event<br />
Any drought period resulting in a drought emergency where most or all of <strong>Sedgwick</strong> <strong>County</strong>’s 69% of<br />
cropland, and 16% of grassland, is mostly or totally destroyed. Results from this type of severity would<br />
impact almost 375,000 acres and 1,400 farms within <strong>Sedgwick</strong> <strong>County</strong>. Total losses would be estimated at<br />
up to $56 million <strong>for</strong> crops, almost $18 million in livestock and poultry, and almost $18 million in cattle. *<br />
*<strong>Kansas</strong> <strong>County</strong> Profile Report <strong>for</strong> <strong>Sedgwick</strong> <strong>County</strong>, <strong>Kansas</strong> Center <strong>for</strong> Community Economic Development<br />
238
<strong>2010</strong>-<strong>2040</strong> <strong>HAZARDS</strong> <strong>ANALYSIS</strong> <strong>PLAN</strong><br />
11.5 EARTHQUAKES<br />
Definition: An earthquake is the shaking of the Earth’s surface caused when energy stored within the Earth’s<br />
crust, usually in the <strong>for</strong>m of strain in rocks, suddenly releases. This energy is transmitted to the surface of the<br />
Earth by seismic waves. The destruction an earthquake causes depends on its magnitude and duration, or<br />
the amount of shaking that occurs. Earthquakes vary from small, imperceptible shaking to large shocks felt<br />
over thousands of kilometers. Earthquakes can de<strong>for</strong>m the ground; make buildings and other structures<br />
collapse, and cause soil liquefaction.<br />
<strong>Kansas</strong> experiences small earthquakes on a routine basis, but few are of a magnitude that could cause<br />
damage to buildings or the infrastructure. According to a FEMA report, <strong>Kansas</strong> ranks 45th among the states<br />
in the amount of damage caused by earthquakes in an average year.<br />
If such an event were to occur, impacts could include injuries and fatalities from collapsing structures or<br />
falling objects. Most homes in <strong>Kansas</strong> are subject to damage because foundation systems consist of<br />
unrein<strong>for</strong>ced block. Brick and block facades are also popular in <strong>Kansas</strong> and are frequently separated from<br />
building surfaces during an earthquake, causing life safety hazards to nearby individuals Reservoirs and<br />
historic buildings built near fault lines or on unstable soil could be at risk of damage or destruction. Other<br />
earthquake-related impacts to people, property, and the environment could result from failures of utilities,<br />
dams and hazardous materials conveyance or storage vessels (e.g., gas pipelines); landslides; subsidence;<br />
and fires. An earthquake could also disrupt businesses and industries, causing loss of revenue and<br />
employment.<br />
Some <strong>Kansas</strong> earthquakes are associated with the Nemaha Ridge, a buried granite ―mountain range‖ that<br />
extends from roughly Omaha, Nebraska, to Oklahoma City. This subsurface range was <strong>for</strong>med about 300<br />
million years ago with peak to valley elevations ranging from 2,300 to 3,300 feet near Manhattan. The<br />
Nemaha is broken by cross faults, apparent shears of northwest trend, and evidence of reverse faulting.<br />
Faults that bound it are still slightly active today, especially the Humboldt fault zone that <strong>for</strong>ms the eastern<br />
boundary of the Nemaha Ridge, passing near Wamego, east of Manhattan, and near El Dorado, east of<br />
Wichita. Further in<strong>for</strong>mation can be found in the KGS Report ―Petroleum: A Primer For <strong>Kansas</strong>.‖<br />
Major regional subsurface features related to earthquake activity<br />
According to a FEMA report, the estimated annual loss from earthquakes in <strong>Kansas</strong> is $425,100, which<br />
includes capital and income-related costs. At last count, there were more than 214 recorded or felt<br />
239
<strong>2010</strong>-<strong>2040</strong> <strong>HAZARDS</strong> <strong>ANALYSIS</strong> <strong>PLAN</strong><br />
earthquakes since 1867. Most of these were small and did not cause significant damage and may not even<br />
have been felt. The earliest reported in <strong>Kansas</strong>, and also the strongest, occurred on April 24, 1867, in the<br />
Humboldt Fault zone near the town of Wamego. It had a magnitude of 5.5 and a 1931 Modified Mercalli<br />
Intensity (MMI) scale of VII causing structural damage in Manhattan and minor damage in other nearby<br />
communities. There were several injuries and some damage as well as a two-foot wave on the <strong>Kansas</strong> River<br />
at Manhattan. The affected area reportedly covered 500,000 square kilometers east of the epicenter.<br />
Moderate earthquakes near Topeka, <strong>Kansas</strong>, in 1867 and 1906, caused MMI scales of VIII and VII,<br />
respectively, in the epicenter area and Intensities VI and IV, respectively, in both <strong>Kansas</strong> City and St.<br />
Joseph, Missouri. As shown below, <strong>Sedgwick</strong> <strong>County</strong> has the potential <strong>for</strong> minor to moderate damage to<br />
buildings, dams, and power plants resulting from an earthquake.<br />
Earthquake Risk Map<br />
Geographically, the central portion of <strong>Sedgwick</strong> <strong>County</strong> consists of unconsolidated subsurface deposits of<br />
sand, silt, and clay flanked on the east and west with Wellington and Ninnescah shale, respectively.<br />
According to in<strong>for</strong>mation in the <strong>Kansas</strong> Geological Survey’s (KGS) Environmental Geology Series 2 report<br />
and the National Oceanographic Atmospheric Administration’s National Geophysical Data Center, there were<br />
six reported ―earthquakes‖ in 1882, 1906, 1919, 1925, 1948, and 1952 in <strong>Sedgwick</strong> <strong>County</strong>. The January 7,<br />
1906 earthquake was noted to have impacted Wichita around 6:25PM lasting several seconds and was felt<br />
only in the large downtown buildings and residential districts located on the west side of the Arkansas<br />
River. 40 Generally, Intensities of these earthquakes were between 3 and 4 on the MMI scale, and<br />
approximately 2 on the Richter scale.<br />
40 <strong>Kansas</strong> Historical Collections Vol XII (1911-1912), Pg 131, <strong>Kansas</strong> State Historical Society, 1912<br />
240
<strong>2010</strong>-<strong>2040</strong> <strong>HAZARDS</strong> <strong>ANALYSIS</strong> <strong>PLAN</strong><br />
Between August 1977 and August 1989 the KGS recorded more than 100 earthquakes in <strong>Kansas</strong>.<br />
Fortunately most of these were micro earthquakes (magnitude of about Richter 2.0 or less) that are<br />
earthquakes that are too small to feel. The largest recorded event during this period had a magnitude of 4.0<br />
and the smallest had a magnitude of 0.8 on the Richter scale.<br />
Distribution and size of micro earthquakes<br />
On July 24, 2001, a 3.0 magnitude earthquake in Butler <strong>County</strong> rattled computer screens at City Hall and<br />
shook several houses in Augusta. It occurred 24 miles above an area where four stems of the main<br />
Humboldt Fault line lie. It caused minor damage and injuries and was felt as far away as Dubuque, Iowa.<br />
Besides the Humboldt Fault, the New Madrid fault is located approximately 430 miles ESE near New Madrid,<br />
Missouri. The strongest on record resulted from several earthquakes ranging from 7.8 to 8.1 on the Richter<br />
scale between 1811 and 1812. The intensities on the MMI from these earthquakes ranged from XII at the<br />
epicenter to VII at Saint Louis. In<strong>for</strong>mation on intensities from these earthquakes <strong>for</strong> south-central <strong>Kansas</strong><br />
was not available due to sparse population; however, isoseismal projections indicate there was a potential<br />
impact of MMI VI to VII.<br />
241
<strong>2010</strong>-<strong>2040</strong> <strong>HAZARDS</strong> <strong>ANALYSIS</strong> <strong>PLAN</strong><br />
USGS ISOSEISMAL PROJECTIONS<br />
Based on USGS disaggregated seismic hazard projections <strong>for</strong> 0.2 second and 1.0 second spectral<br />
accelerations at 0.0592g to 0.169g, there is the potential <strong>for</strong> up to a Richter 5.6 earthquake in south-central<br />
<strong>Kansas</strong> if comparable 1811-1812 New Madrid earthquake magnitudes occurred.<br />
Regulatory<br />
Pursuant to <strong>Sedgwick</strong> <strong>County</strong> Resolution 12-03, Chapter 6, Article II of the <strong>Sedgwick</strong> <strong>County</strong> Code, had the<br />
following section amendment and based on the adoption of the 2000 International Building Code:<br />
SECTION 1615, EARTHQUAKE LOADS – SITE GROUND MOTION<br />
Section 1615.1 General procedures <strong>for</strong> determining maximum considered earthquake<br />
and design spectral response accelerations. Ground motion accelerations, represented<br />
by response spectra and coefficients derived from the spectra, shall be determined in<br />
accordance with the general procedure of section 1615.1 or the site-specific procedure of<br />
Section 1615.2. The site-specific procedure of Section 1615.2 shall be used <strong>for</strong> structures on<br />
sites classified as Site Class F, in accordance with Section 1615.1.1.<br />
242
<strong>2010</strong>-<strong>2040</strong> <strong>HAZARDS</strong> <strong>ANALYSIS</strong> <strong>PLAN</strong><br />
The earthquake spectral response acceleration at short periods Ss, and at 1-second period,<br />
S1, <strong>for</strong> <strong>Sedgwick</strong> <strong>County</strong> has been determined by the Building Official to be 0.14 and 0.056<br />
respectively.<br />
The Site Class shall be determined in accordance with Section 1615.1.1. The maximum<br />
considered earthquake spectral response accelerations at short period and 1-second period<br />
adjusted <strong>for</strong> site class effects, SMS and SM1, shall be determined in accordance with<br />
Section 1615.1.2. The design spectral response accelerations at short periods, SDS, and at<br />
1-second period, SD1, shall be determined in accordance with Section 1615.1.3. The<br />
general response spectrum shall be determined in accordance with Section 1615.1.4.<br />
Exception: For structures located on sites with mapped spectral response acceleration at<br />
short period, Ss, less than or equal to 0.15g and mapped spectral response acceleration at<br />
1-second period, S1, less than or equal to 0.04g, the Site Class, maximum considered<br />
earthquake spectral response accelerations at short period and at 1-second period adjusted<br />
<strong>for</strong> site class effects (SMS and SM1), and the design spectral response acceleration at short<br />
period and at 1-second period (SDS and SD1) need not be determined. Such structures<br />
shall be categorized as Seismic Design Category A and need only comply with the<br />
requirements of Section 1616.4.<br />
Hazard Severity Ratings<br />
The following rating table indicates the probability of an earthquake event occurring every 25 years of less,<br />
impacting less than 25% of the land, resulting in minor injuries and/or illnesses, with few homes damaged,<br />
having short term recovery of resources, and low direct and/or indirect costs.<br />
Catastrophic Event<br />
EARTHQUAKE HAZARD AND EVENT RATING TABLE<br />
Consequence Probable Rating Catastrophic Rating<br />
Area Impacted 1 4<br />
Probability 3 0<br />
Health & Safety 1 3<br />
Property 1 3<br />
Environment 1 2<br />
Economic 1 3<br />
Total Ratings 8 15<br />
A 4.0 or greater earthquake resulting from the Humboldt Fault or triggered by one of the east-west traverse<br />
faults in Missouri caused by an 1811 New Madrid event. Sustained after shocks may also result in minor<br />
liquefaction of soils, particularly in downtown Wichita, causing foundation shifting. Transportation and utility<br />
disruptions would also be anticipated.<br />
243
<strong>2010</strong>-<strong>2040</strong> <strong>HAZARDS</strong> <strong>ANALYSIS</strong> <strong>PLAN</strong><br />
11.6 FOG<br />
Definition: Vapor condensed to fine particles of water suspended in the lower atmosphere that differs from<br />
cloud only in being near the ground.<br />
In<strong>for</strong>mation developed from the Wichita National Weather Service over a<br />
10-year period indicates that there is an average of almost 16 days of<br />
ground fog occurring annually. The months of December through<br />
February are highest with an average of 2.5 days of fog. The months of<br />
July and August are the lowest at less than 0.1 days of fog <strong>for</strong> those<br />
months.<br />
Although the Wichita Mid-Continent Airport has not reported flight accidents attributed to fog, but there have<br />
been occasional delays. The potential of fog related incidents in general aviation with the smaller planes is<br />
considered greater than with commercial aviation since the airlines almost universally follow policies which<br />
are more restrictive than FAA requirements. The following tables are from the National Oceanic and<br />
Atmospheric Administration’s (NOAA) International Station Metrological Climate Summary program. They<br />
reflect the percentage of days per month when fog occurrences may happen during Instrument Flight Rules<br />
(IFR) and Very Low Instrument Flight Rule (VLIFR) situations:<br />
Near-VLIFR Climatology <strong>for</strong> Wichita<br />
(% with ceiling below 200 feet and/or visibilities below ¾ mile)<br />
Hour Jan Feb Mar Apr May Jun Jul Aug Sep Oct Nov Dec Yr<br />
2400 3 4 1 * * 0 0 0 * 1 2 4 1<br />
0300 5 5 1 1 1 * * * 1 2 2 5 2<br />
0600 5 6 3 2 2 1 * 1 2 2 4 5 3<br />
0900 5 6 2 1 0 0 * * 1 2 2 6 2<br />
1200 2 2 1 * 0 0 0 0 0 0 0 3 1<br />
1500 2 2 * * * 0 0 0 0 0 0 1 *<br />
1800 2 2 1 * * 0 0 * * * * 2 1<br />
2100 3 2 1 * * 0 0 0 * 1 1 3 1<br />
All 3 4 1 1 * * * * 1 1 2 4 1<br />
* Between 0 and 0.5%<br />
IFR Climatology <strong>for</strong> Wichita<br />
(% with ceiling less than 1,000 feet and/or visibilities less than 3 miles)<br />
Hour Jan Feb Mar Apr May Jun Jul Aug Sep Oct Nov Dec Yr<br />
2400 13 13 10 7 6 2 1 2 5 8 11 15 8<br />
0300 15 17 13 9 8 4 2 4 8 9 13 16 10<br />
0600 16 19 16 11 13 8 5 7 12 11 14 18 13<br />
0900 20 21 16 12 9 6 3 6 12 13 17 20 13<br />
1200 16 16 11 7 4 2 1 2 5 7 11 16 8<br />
1500 12 12 9 5 2 1 * 1 4 5 9 13 6<br />
1800 11 11 8 6 2 1 * 1 3 5 8 11 6<br />
2100 11 12 8 6 3 1 1 1 4 6 10 13 9<br />
All 14 15 12 8 6 3 2 3 7 8 12 15 9<br />
* Between 0 and 0.5%<br />
244
<strong>2010</strong>-<strong>2040</strong> <strong>HAZARDS</strong> <strong>ANALYSIS</strong> <strong>PLAN</strong><br />
Regulatory<br />
General transportation safety guidelines and requirements would apply as identified by the <strong>Kansas</strong> Division<br />
of Motor Vehicles, Federal Aviation Administration, and respective railroads.<br />
Hazard Severity Ratings<br />
The following rating table indicates the probability of a fog event occurring once a year or more, impacting<br />
less than 25% of the land. It is not anticipated to impact health and safety, property, the environment, or<br />
economic value.<br />
Catastrophic Event<br />
FOG HAZARD AND EVENT RATING TABLE<br />
Consequence Probable Rating Catastrophic Rating<br />
Area Impacted 1 4<br />
Probability 4 0<br />
Health & Safety 0 0<br />
Property 0 0<br />
Environment 0 0<br />
Economic 0 0<br />
Total Ratings 5 4<br />
Based on Wichita’s geographical location, there are no anticipated catastrophic fog events.<br />
245
<strong>2010</strong>-<strong>2040</strong> <strong>HAZARDS</strong> <strong>ANALYSIS</strong> <strong>PLAN</strong><br />
11.7 HAZARDOUS MATERIAL<br />
Definition: A hazardous material is generally defined as any substance or material could adversely affect the<br />
safety of the public, handlers or carriers during transportation. According to Subpart A, Part 105, Subchapter<br />
A, Chapter I, Subtitle B of Title 49 of the Code of Federal Regulations (CFR), The U.S. Department of<br />
Transportation defines a hazardous material as a substance or material that the Secretary of Transportation<br />
has determined is capable of posing an unreasonable risk to health, safety, and property when transported in<br />
commerce, and has designated as hazardous under section 5103 of Federal hazardous materials<br />
transportation law (49 U.S.C. 5103). The term includes hazardous substances, hazardous wastes, marine<br />
pollutants, elevated temperature materials, materials designated as hazardous in the Hazardous Materials<br />
Table (see 49 CFR 172.101 ), and materials that meet the defining criteria <strong>for</strong> hazard classes and divisions in<br />
part 173 of subchapter C of this chapter.<br />
Types of Hazardous Materials Classes:<br />
Explosive, compressed gases, flammable liquids and solids (flammable and combustible), oxidizers<br />
and organic peroxides, toxic materials (poisonous and infectious), radioactive material, corrosive<br />
material, and miscellaneous materials.<br />
Sources of Hazardous Materials:<br />
Manufacturer and processing facilities, storage and warehouse facilities, and transportation (aircraft,<br />
vehicular, rail, and pipelines)<br />
Effects of Release:<br />
Environmental pollution (soil, air, and water), and public safety<br />
The following guidance is used <strong>for</strong> determining if transported commodities are hazardous material: the<br />
Secretary of Transportation shall designate material (including an explosive, radioactive material, etiologic<br />
agent, flammable or combustible liquid or solid, poison, oxidizing or corrosive material, and compressed gas)<br />
or a group or class of material as hazardous when the Secretary decides that transporting the material in<br />
commerce in a particular amount and <strong>for</strong>m may pose an unreasonable risk to health and safety or property.<br />
(ref. Title 49, Subtitle III, Chapter 51, Section 5103).<br />
A material is hazardous if it exhibits one or more of the following characteristics:<br />
Ignitability: Can create fires under certain conditions. Examples include liquids that catch fire, such<br />
as solvents and fuels, and friction-sensitive substances.<br />
Corrosivity: Is acidic (pH less than 7) and capable of corroding metal such as tanks, containers,<br />
drums, and barrels.<br />
Reactivity: Can create explosions or toxic fumes, gases, and vapors when exposed or mixed with<br />
water.<br />
Toxicity: Harmful or fatal when ingested, inhaled, or absorbed by the skin.<br />
Hazardous materials may be in a solid, liquid or gaseous <strong>for</strong>m and exhibit the following hazardous<br />
conditions: flammable, radioactive, corrosive, ignitable, chemically reactive, or unstable after prolonged<br />
storage in quantity posing a threat to life, property, or the environment.<br />
Environmental concerns include discharge to soil and water.<br />
via soil contamination.<br />
Discharges can also affect the groundwater<br />
246
<strong>2010</strong>-<strong>2040</strong> <strong>HAZARDS</strong> <strong>ANALYSIS</strong> <strong>PLAN</strong><br />
11.7.1 U.S. CENSUS BUREAU GENERAL DEFINITIONS<br />
Commodity<br />
The U.S. Census Bureau defines a commodity as products that an establishment produces, sells, or<br />
distributes. This does not include items that are considered as excess or by products of the establishment’s<br />
operation. Respondents to the U.S. Census Bureau’s 1997 CFS addressed in the survey reported the<br />
description and the five-digit Standard Classification of Transported Goods (SCTG) code <strong>for</strong> the major<br />
commodity contained in the shipment, defined as the commodity with the greatest weight in the total<br />
shipment.<br />
Shipment<br />
A shipment is considered an individual movement of commodities from an establishment to a customer or to<br />
another location of the originating company (including a warehouse, distribution center, retail or wholesale<br />
outlet). A shipment uses one or more modes of transportation including parcel delivery, U.S. Postal Service,<br />
courier, private truck, <strong>for</strong>-hire truck, rail, water, pipeline, air, and other modes.<br />
MODE DEFINITIONS (U.S. CENSUS BUREAU)<br />
Parcel Delivery/Courier/USPS<br />
Delivery services, parcels, packages, and other small shipments that typically weigh less than 100 pounds.<br />
Includes bus parcel delivery services.<br />
Private Truck<br />
Trucks operated by a temporary or permanent employee of an establishment other than buyer/receiver of the<br />
shipment.<br />
For-Hire Truck<br />
Trucks that carry freight <strong>for</strong> a fee collected from the shipper, recipient of the shipment, or an arranger of the<br />
transportation.<br />
Railroad<br />
Any common carrier or private railroad.<br />
Pipeline<br />
Movements of oil, petroleum, gas, slurry, etc. through pipelines that extend to other establishments or<br />
locations beyond the shipper’s establishment. Aqueducts <strong>for</strong> the movement of water are not included.<br />
Air<br />
Commercial or private aircraft and all air service <strong>for</strong> shipments that typically weigh more than 100 pounds.<br />
Includes airfreight and air express.<br />
11.7.2 HAZARDOUS MATERIAL DEFINITIONS<br />
U.S. Department of Transportation – ―Any substance or material in any <strong>for</strong>m or quantity which poses an<br />
unreasonable risk to safety and health and to property when transported in commerce‖<br />
U.S. Environmental Protection Agency – ―Any material, which when discharged into the environment, may be<br />
harmful to the public health or welfare of the United States‖<br />
247
<strong>2010</strong>-<strong>2040</strong> <strong>HAZARDS</strong> <strong>ANALYSIS</strong> <strong>PLAN</strong><br />
11.7.3 HAZARDOUS SUBSTANCE DEFINITIONS<br />
OSHA (29 CFR 1910.120(3)): Any biologic agent and other disease-causing agent which after release, into<br />
the environment and upon exposure, ingestion, inhalation, or assimilation into any person, either directly<br />
from the environment or indirectly by ingestion through food chains, will or may reasonably be anticipated to<br />
cause death, disease, behavioral abnormalities, cancer, genetic mutation, physiological malfunctions<br />
(including malfunctions in reproduction) or physical de<strong>for</strong>mations in such persons or their offspring.<br />
CERCLA (42 U.S.C. 103.9601(14)): Any substance designated pursuant to section 311(b)(2)(A) of the<br />
Clean Water Act (CWA); any element, compound, mixture, solution, or substance designated pursuant to<br />
section 102 of Comprehensive Environmental Response, Compensation, and Liability Act (CERCLA); any<br />
hazardous waste having the characteristics identified under or listed pursuant to section 3001 of the Solid<br />
Waste Disposal Act (but not including any waste the regulation of which under the Solid Waste Disposal Act<br />
(42 U.S.C. 6901 et seq.) has been suspended by Act of Congress); any toxic pollutant listed under section<br />
307(a) of the CWA; any hazardous air pollutant listed under section 112 of the Clean Air Act (42 U.S.C. 7521<br />
et seq.); and any imminently hazardous chemical substance or mixture with respect to which the EPA<br />
Administrator has taken action pursuant to section 7 of the Toxic Substances Control Act (15 U.S.C. 2601 et<br />
seq.). The term does not include petroleum, including crude oil or any fraction thereof which is not otherwise<br />
specifically listed or designated as a hazardous substance in the first sentence of this paragraph, and the<br />
term does not include natural gas, natural gas liquids, liquefied natural gas, or synthetic gas usable <strong>for</strong> fuel<br />
(or mixtures of natural gas and such synthetic gas).<br />
11.7.4 HAZARDOUS MATERIAL CLASSIFICATIONS (USDOT)<br />
Class 1<br />
Class 2<br />
Class 3<br />
Class 4<br />
Class 5<br />
Class 6<br />
Class 7<br />
Class 8<br />
Class 9<br />
Explosives or blasting agents<br />
Gases<br />
Flammable Liquids<br />
Flammable solids; spontaneously combustible materials; and materials that<br />
are dangerous when wet<br />
Oxidizers and organic peroxides<br />
Poisonous and etiologic agents (infectious materials)<br />
Radioactive materials<br />
Corrosives<br />
Other regulated or miscellaneous hazardous materials<br />
Further in<strong>for</strong>mation, including the type of placard used, regarding each of these hazard classifications are<br />
contained in Appendix A of this report.<br />
11.7.5 HAZARDOUS MATERIAL CATEGORIES<br />
Explosive substances: Releases pressure, gas and heat when subjected to sudden shock, heat, or high<br />
pressure. Examples include explosives, fuel oil mixtures, ammonium nitrate, and ammunition.<br />
Flammable and Combustible Substances: Both liquid and solids that can be easily ignited. Flammable<br />
liquids have a flashpoint (spontaneous combustion) below 100 o F. Combustible liquids have a flashpoint at or<br />
above 100 o F. Examples include petroleum substances and ethylene glycol.<br />
Toxic Materials (also called Poisons): Substances that can cause injury or death when they enter the bodies<br />
of living things. Toxic materials can be classified both by their chemical nature or toxic action. Examples<br />
include: heavy metals, cyanides, corrosives, and irritants.<br />
248
<strong>2010</strong>-<strong>2040</strong> <strong>HAZARDS</strong> <strong>ANALYSIS</strong> <strong>PLAN</strong><br />
Oxidizers: Supplies oxygen to support normally non-flammable materials, whereas Organic Peroxides are<br />
explosive and sensitive to heat, shock, and friction (potentially toxic). Examples include: fertilizers<br />
(oxidizers) and peroxides.<br />
Radioactive Materials: Emits harmful rays and particles when they decay, as they change from one element<br />
to another. Examples include: plutonium, cobalt, and uranium.<br />
Etiological Materials: Those materials that cause disease or infection. Examples include: germs that cause<br />
rabies, botulism, or tetanus.<br />
11.7.6 COMMODITY CODE CLASSIFICATIONS<br />
SCTG - The Standard Classification of Transported Goods (SCTG) has been created jointly by agencies of<br />
the United States (U.S.) and Canadian governments to address statistical needs that the U.S. and Canada<br />
share in common, and to meet the individual needs of each country in regard to products transported. The<br />
original purpose of the Standard Transportation Commodity Classification (STCC) was <strong>for</strong> identification of<br />
commodities <strong>for</strong> purposes of assigning rates <strong>for</strong> ICC-regulated rail carriers. The STCC continues to be used<br />
by the Association of American Railroads (AAR) as a tariff mechanism. The SCTG employs a five-digit<br />
numbering system, the structure of which is hierarchical. The hierarchy has four levels, each of which<br />
follows two important principles: 1) each level covers the universe of transported goods, and 2) the<br />
commodities in a given classification of a given level are mutually exclusive of those in any other<br />
classification of that level. Product classifications in the SCTG reflect the movement of goods by all modes<br />
rather than a single mode; the STCC emphasizes goods that move by regulated rail only. The goods most<br />
important to each mode of freight transportation have been included, with importance measured by the<br />
characteristics of weight, value, and shipment distance. Product classifications at the SCTG’s two-digit level<br />
have been designed to link to industry classifications at the two-digit level of the Standard Industrial<br />
Classification (SIC) and the North American Industrial Classification System (NAICS). However, The SCTG<br />
does not include any designations <strong>for</strong> hazardous materials.<br />
HS – The Harmonized Commodity Description and Code System (HS) or Harmonized Tariff System (HTS) is<br />
the predominant product coding system currently in use worldwide. The HS is an international commodity<br />
classification (six digit) developed under the auspices of the Canadian Customs Cooperation Council. It was<br />
extended to ten digits <strong>for</strong> imports to serve as the basis <strong>for</strong> customs tariffs and international trade statistics.<br />
For export purposes, the international six-digit "root" was extended to eight digits. U.S. domestic imports<br />
data are collected using a ten-digit product classification that is an extension of the HS. In the HS, goods are<br />
classified by what they are and not according to their stage of fabrication, their use, or origin. The HS<br />
nomenclature is logically structured by economic activity or component material.<br />
HTSA - The USITC (Office of Tariff Affairs and Trade Agreements) is responsible <strong>for</strong> publishing the<br />
Harmonized Tariff Schedule of the United States Annotated (HTSA). The HTSA provides the applicable tariff<br />
rates and statistical categories <strong>for</strong> all merchandise imported into the United States; it is based on the<br />
international Harmonized System, the global classification system that is used to describe most world trade<br />
in goods.<br />
NAICS – The North American Industry Classification System (NAICS) replaced the SIC system. The U.S.,<br />
Canada, and Mexico provide new comparability in statistics about business activity across North America<br />
developed NAICS jointly.<br />
SIC - The code was developed by the Department of Labor to classify industries. The codes only describe<br />
industries and do not describe occupations that people hold within those industries. As of 2002, the SIC<br />
codes are no longer used and have been replaced by the NAICS.<br />
249
<strong>2010</strong>-<strong>2040</strong> <strong>HAZARDS</strong> <strong>ANALYSIS</strong> <strong>PLAN</strong><br />
11.7.7 2007 U.S. COMMODITY FLOW SURVEY<br />
Overview<br />
The following tables were derived from the U.S. Census Bureau’s American Fact Finder 2007 Commodity<br />
Flow Survey <strong>for</strong> the State of <strong>Kansas</strong>. Estimates are based on data from the 2007 Commodity Flow Surveys.<br />
Due to rounding, estimates may not add-up to totals. Data rows which are not available or could not be<br />
published are not shown and are identified with an ―S.‖.<br />
Geographic Area Series: Shipment Characteristics by Origin Geography by Mode: 2007<br />
Value($mil) Tons (1,000) Ton-miles (mil) Avg miles<br />
All modes 149,210 178,327 41,690 570<br />
Single modes 126,851 173,009 37,471 233<br />
Truck 105,121 148,320 22,681 218<br />
For-hire truck 67,710 95,135 18,175 398<br />
Private truck 37,411 53,186 4,506 103<br />
Rail 7,362 20,229 14,628 678<br />
Air (incl truck & air) 11,722 S 85 984<br />
Pipeline 2,646 4,381 S S<br />
Multiple modes 18,114 4,320 4,028 819<br />
Parcel, U.S.P.S. or<br />
courier<br />
15,158 466 314 818<br />
Truck and rail 2,779 3,840 3,670 1,272<br />
Truck and water S S 26 3,261<br />
Rail and water S S S S<br />
Other multiple modes S S S S<br />
Other and unknown<br />
modes<br />
S 998 191 S<br />
Geographic Area Series: Shipment Characteristics by Origin Geography by NAICS: 2007<br />
NAICS<br />
code<br />
Meaning of NAICS code<br />
Value($mil)<br />
Tons<br />
(1,000)<br />
Tonmiles<br />
(mil)<br />
Avg<br />
miles<br />
Value<br />
CV<br />
Tons<br />
CV<br />
Tonmiles<br />
CV<br />
Avg<br />
miles<br />
CV<br />
212 Mining (except oil and gas) 319 38,676 3,271 69 16.2 22.8 21.9 16.9<br />
31-33 Manufacturing 75,885 57,555 19,972 878 11 5.5 9.9 9.5<br />
311 Food manufacturing 17,302 11,981 7,599 715 7.3 9.7 6.8 12.2<br />
312<br />
Beverage and tobacco<br />
product manufacturing<br />
348 702 91 S 30 21.7 25.1 S<br />
313 Textile mills S S S S S S S S<br />
314 Textile product mills 146 28 25 849 21.4 28.4 28.3 6.4<br />
315 Apparel manufacturing S S S S S S S S<br />
321<br />
Wood product<br />
manufacturing<br />
391 523 126 515 11.4 19 23.8 23.4<br />
322 Paper manufacturing 696 691 202 201 28 31.7 26.9 24.9<br />
323<br />
324<br />
Printing and related support<br />
activities<br />
Petroleum and coal<br />
products manufacturing<br />
1,633 294 172 895 17.8 21.3 23.4 6.5<br />
8,940 18,112 1,752 S 29.1 23.7 29.7 S<br />
250
<strong>2010</strong>-<strong>2040</strong> <strong>HAZARDS</strong> <strong>ANALYSIS</strong> <strong>PLAN</strong><br />
NAICS<br />
code<br />
Meaning of NAICS code<br />
Value($mil)<br />
Tons<br />
(1,000)<br />
Tonmiles<br />
(mil)<br />
Avg<br />
miles<br />
Value<br />
CV<br />
Tons<br />
CV<br />
Tonmiles<br />
CV<br />
Avg<br />
miles<br />
CV<br />
325 Chemical manufacturing 6,015 8,533 4,130 720 21.9 23.2 29.8 11.9<br />
326<br />
327<br />
331<br />
332<br />
Plastics and rubber<br />
products manufacturing<br />
Nonmetallic mineral product<br />
manufacturing<br />
Primary metal<br />
manufacturing<br />
Fabricated metal product<br />
manufacturing<br />
3,493 1,188 779 865 21.5 22.7 19.9 9.6<br />
1,496 10,875 1,608 190 15.4 13.8 17 16.7<br />
527 S 85 311 49.5 S 27.9 39.1<br />
3,590 786 606 882 14.1 13.5 14.7 6.8<br />
333 Machinery manufacturing 5,016 S 586 834 13.2 S 21.7 7.5<br />
334<br />
335<br />
336<br />
Computer and electronic<br />
product manufacturing<br />
Electrical equipment,<br />
appliance, and component<br />
manufacturing<br />
Transportation equipment<br />
manufacturing<br />
4,175 48 48 1,099 24 32.8 37.8 11.9<br />
1,080 341 321 755 19.2 20.2 23 15.1<br />
19,669 721 603 640 34 30.5 36.1 9.8<br />
337<br />
339<br />
Furniture and related<br />
product manufacturing<br />
Miscellaneous<br />
manufacturing<br />
710 120 74 561 17.6 15 24.4 17.6<br />
S S S 772 S S S 10.5<br />
42 Wholesale trade 47,728 78,783 17,410 315 12.7 20.8 23.6 17.6<br />
423<br />
4231<br />
4232<br />
4233<br />
4234<br />
4235<br />
4236<br />
4237<br />
4238<br />
4239<br />
Merchant wholesalers,<br />
durable goods<br />
Motor vehicle and parts<br />
merchant wholesalers<br />
Furniture and home<br />
furnishing merchant<br />
wholesalers<br />
Lumber and other<br />
construction materials<br />
merchant wholesalers<br />
Commercial equip.<br />
merchant wholesalers<br />
Metal and mineral (except<br />
petroleum) merchant<br />
wholesalers<br />
Electrical and electronic<br />
goods merchant<br />
wholesalers<br />
Hardware and plumbing<br />
merchant wholesalers<br />
Machinery, equipment, and<br />
supplies merchant<br />
wholesalers<br />
Miscellaneous durable<br />
goods merchant<br />
wholesalers<br />
14,815 7,534 1,412 299 12.4 31 16.3 16.6<br />
1,320 268 142 262 16.2 23.1 30 18.4<br />
324 99 21 S 29.9 40.8 30.8 S<br />
1,044 S 175 87 12.7 S 37.5 12.3<br />
1,684 S S 288 34.7 S S 33.3<br />
969 268 50 531 47.3 38.8 25.7 20.8<br />
2,107 S S S 29.5 S S S<br />
1,027 105 12 S 23.1 40.7 35.5 S<br />
5,558 787 S 393 22.3 24.2 S 20.3<br />
783 1,416 651 633 19.4 36.1 27.4 12.7<br />
251
<strong>2010</strong>-<strong>2040</strong> <strong>HAZARDS</strong> <strong>ANALYSIS</strong> <strong>PLAN</strong><br />
NAICS<br />
code<br />
Meaning of NAICS code<br />
Value($mil)<br />
Tons<br />
(1,000)<br />
Tonmiles<br />
(mil)<br />
Avg<br />
miles<br />
Value<br />
CV<br />
Tons<br />
CV<br />
Tonmiles<br />
CV<br />
Avg<br />
miles<br />
CV<br />
424<br />
4241<br />
4242<br />
4243<br />
4244<br />
4245<br />
4246<br />
4247<br />
4248<br />
4249<br />
4541<br />
Merchant wholesalers,<br />
nondurable goods<br />
Paper and paper product<br />
merchant wholesalers<br />
Drugs and druggists'<br />
sundries merchant<br />
wholesalers<br />
Apparel, piece goods, and<br />
notions merchant<br />
wholesalers<br />
Grocery and related product<br />
merchant wholesalers<br />
Farm product raw material<br />
merchant wholesalers<br />
Chemical and allied<br />
products merchant<br />
wholesalers<br />
Petroleum and petroleum<br />
products merchant<br />
wholesalers<br />
Beer, wine, and distilled<br />
alcoholic beverage<br />
merchant wholesalers<br />
Miscellaneous nondurable<br />
goods merchant<br />
wholesalers<br />
Electronic shopping and<br />
mail-order houses<br />
32,913 71,248 15,997 324 14.8 22.4 25.9 20.6<br />
607 221 16 294 24.1 48.7 32.5 40.1<br />
1,113 S S 255 50 S S 49<br />
990 58 21 818 40.1 34.9 38.1 11.9<br />
6,203 3,635 298 247 23.2 30.6 22.5 22.5<br />
9,337 48,589 13,699 S 23.9 28.5 29.2 S<br />
989 S S S 22.9 S S S<br />
9,738 10,947 601 224 33.1 29 24.7 25<br />
676 375 11 39 18.1 29.4 23.5 11.4<br />
3,259 5,686 404 462 21.4 40.4 40.1 23.9<br />
S 34 25 752 S 46.3 32.8 13.7<br />
45431 Fuel dealers 298 450 9 25 22.6 28.7 3.6 18.8<br />
4931 Warehousing and storage S 1,498 359 862 S 34.3 33.1 18.2<br />
5111<br />
551114<br />
Newspaper, periodical,<br />
book, and directory<br />
publishers<br />
Corporate, subsidiary, and<br />
regional managing offices<br />
2,367 163 62 354 23 20.8 25.5 29.3<br />
6,301 1,169 S 807 42 44.6 S 21.4<br />
Value($mil)<br />
Hazardous Materials Series: HazMat Shipment Characteristics by Origin State: 2007<br />
Tons<br />
(1,000)<br />
Ton-miles<br />
(mil)<br />
Avg miles Value CV Tons CV<br />
Ton-miles<br />
CV<br />
Avg miles<br />
CV<br />
19,784 29,512 3,424 59 19.0 17.8 6.3 22.3<br />
252
<strong>2010</strong>-<strong>2040</strong> <strong>HAZARDS</strong> <strong>ANALYSIS</strong> <strong>PLAN</strong><br />
11.7.8 HAZARDOUS MATERIALS SHIPMENTS<br />
The following tables are contained in the Bureau of Transportation Statistics (BTA) 2009 State<br />
Transportation Statistics report and show the hazardous materials shipments or origination and<br />
destination of the top 20 states in the United States which includes <strong>Kansas</strong>.<br />
253
<strong>2010</strong>-<strong>2040</strong> <strong>HAZARDS</strong> <strong>ANALYSIS</strong> <strong>PLAN</strong><br />
11.7.9 COMMODITY TYPES<br />
MOTOR CARRIER<br />
The Federal Motor Carrier Safety Administration’s Intermodal Transportation Database containing the Motor<br />
Carrier Management In<strong>for</strong>mation System (MCMIS) Census File lists approximately 1,001 hazardous material<br />
motor carriers located and operating in the State of <strong>Kansas</strong>.<br />
2002 COUNTY FLOW SURVEY<br />
In 2002, <strong>Sedgwick</strong> <strong>County</strong> Emergency Management submitted commodity flow survey <strong>for</strong>ms to 356<br />
regionally local motor carriers. The local carriers were chosen from the statewide listing of 1,001 reported<br />
hazardous materials motor carriers. The <strong>for</strong>ms requested in<strong>for</strong>mation pertaining to type commodities,<br />
quantities transported, times, and shipment locations. Of those motor carriers, 312 were not deliverable at<br />
the given address or no response was given. The remaining 44 carriers either showed no hazardous<br />
materials transporting (24) or out of business (11). Only nine motor carriers reported hazardous materials<br />
transport to include the following commodities:<br />
Adhesives Cleaning Compounds Fertilizers Gasoline Fly Ash<br />
Herbicides Insecticides Paints Sodium Hydroxide Acids<br />
Acrylonitrile Waste Paints Waste Oils Hazardous Waste<br />
CFS <strong>for</strong>ms were also sent out to a total of 209 industrial facilities that had previously submitted Tier II<br />
chemical inventory <strong>for</strong>ms under the requirements of the Emergency Planning and Community Right-to-Know<br />
Act of 1986 also known as Superfund Amendments and Reauthorization Act (SARA) Title III. Of the 121<br />
responses received (57.9% of submissions), 112 facilities completed their <strong>for</strong>ms that also contained carrier<br />
in<strong>for</strong>mation. Those facilities reported the following chemicals are routinely transported to and from their<br />
facilities using various carriers.<br />
Anhydrous Ammonia Jet Fuel Calcium Chloride Chlorine<br />
Aluminum Phosphide Gasoline Industrial Gases Crude Oil<br />
Antifreeze Diesel Caustic Soda Cyclohexanone<br />
Acetone Xylene Fertilizers Pesticides<br />
Insecticides Sodium Hydroxide Solvents Acids<br />
Acrylonitrile Paints & Waste Waste Oils Hazardous Waste<br />
The following tables are contained in BTA’s 2009 State Transportation Statistics report and reflect hazardous<br />
materials incident comparisons between 2008 and 2009 including deaths and injuries, mode of<br />
transportation, and pipeline incidents.<br />
254
<strong>2010</strong>-<strong>2040</strong> <strong>HAZARDS</strong> <strong>ANALYSIS</strong> <strong>PLAN</strong><br />
11.7.10 U.S. EPA TOXIC RELEASE INVENTORY (TRI)<br />
The TRI is a publicly available EPA database that contains in<strong>for</strong>mation on specific toxic chemical releases<br />
and other waste management activities reported annually by certain covered industry groups as well as<br />
federal facilities. This inventory was established under the Emergency Planning and Community Right-to-<br />
Know Act of 1986 (EPCRA), which requires facilities to use their best readily available data to calculate their<br />
releases and waste management estimates.<br />
Since 1999, there appears to have been almost a 50% reduction of on-site releases and off-site transfers of<br />
waste (total and metals). The following release report summary is provided <strong>for</strong> <strong>Sedgwick</strong> <strong>County</strong> during<br />
reporting year 2009 which is the most recent TRI data available:<br />
Number of reporting facilities:<br />
<strong>Sedgwick</strong> <strong>County</strong>: 44<br />
State of <strong>Kansas</strong>: 285<br />
Total On-Site Releases: 1,332,568 pounds<br />
Total Off-Site Releases: 1,680,816 pounds<br />
Total Transfers (Transported) Off-Site: 8,553,228 pounds<br />
Waste toxic chemicals transported in large quantities or roughly equivalent to a railroad tank car (over<br />
100,000 pounds) include: trichloroethylene, tetrachloroethylene, and ethylene glycol.<br />
Historical Note: On August 9, 1928, an oil well located 1.5 miles south of Valley Center on the<br />
Wright farm created one of the first gushers in <strong>Sedgwick</strong> <strong>County</strong> and pumping at the rate of 1,800<br />
barrels per day. The nearby Goodrich well produced up to 7,000 barrels of oil per day on<br />
December 6, 1928, and considered the largest oil field in <strong>Kansas</strong> history. 41<br />
Type of Incident<br />
Cause of Incident<br />
41 Valley Center: Its Founding & Major Events, Frank Hutchings, Valley Center, 1976<br />
255
<strong>2010</strong>-<strong>2040</strong> <strong>HAZARDS</strong> <strong>ANALYSIS</strong> <strong>PLAN</strong><br />
11.7.11 NATIONAL RESPONSE CENTER<br />
The primary function of the National Response Center is to serve as the sole national point of contact <strong>for</strong><br />
reporting all oil, chemical, radiological, biological, and etiological discharges into the environment anywhere<br />
in the United States and its territories. A listing of incidents reported to the National Response Center<br />
between 1990 and <strong>2010</strong> are summarized in the following table.<br />
<strong>Sedgwick</strong> <strong>County</strong> Incident Report In<strong>for</strong>mation<br />
From the National Response Center<br />
Between February 1990 and November <strong>2010</strong><br />
Railroad Non-Release Reports: 21 (Number 2 diesel)<br />
Continuous Release Reports: 7 (Anhydrous ammonia, nitrogen dioxide, and nitrogen oxide)<br />
Fixed Facility Reports: 760 (toluene, ferric chloride, potassium chlorate, sulfuric acid, 1,1,1-<br />
trichloroethane, trichloroethylene, perchloroethylene, gasoline, mixed acids, chlorine, methyl<br />
chloride, chloro<strong>for</strong>m, mineral spirits, carbon tetrachloride, sodium hydroxide, dimethyl sulfoxide,<br />
dimethylamine, barium chlorate, p-xylene, n-butyl alcohol, phosphoric acid, tipperdine, JP-4<br />
aviation fuel, muriatic acid, hexachlorobutadiene, hexachlorobenzene, polychlorinated biphenyls,<br />
benzyl cyanide, hydrogen fluoride, hydrochloric acid, waste oil, waste water, fuel oil no. 2,<br />
pentachlorophenol, Dow Den 438/439, and Curithane 103)<br />
Railroad Reports: 32 (asbestos, carbon dioxide, methylene dianiline, chlorine, lubricating oil,<br />
sodium hydroxide, diesel fuel, motor oil, soybean oil, carbon tetrachloride, hydrogen fluoride,<br />
toluene, dimethyl amino propylamine, ammonia fertilizer, hydrochloric acid, and cyclohexylamine)<br />
Mobile Source Reports: 94 (diesel fuel, hydraulic oil, fuel oil no. 2, JP-8 jet fuel, nitrogen, methyl<br />
alcohol, potassium sodium hydroxide, automotive gasoline, , 1,1,1-trichloroethane, motor oil,<br />
hydrochloric acid, waste flammable liquid, AFFF, sodium hydroxide, carbon tetrachloride, JP-4 jet<br />
fuel, asphalt emulsion, nitric acid, natural gas, waste perchloroethylene, phosphoric acid, ferrous<br />
chloride, 4,4-methylene dianiline, perchloroethylene, industrial sludge, waste treatment sludge,<br />
dicamba, MCPA, pendimethaline, potassium, and liquefied nitrogen)<br />
Unknown Sheen Reports: 15 (various oils, hydrochloric acid, chloro<strong>for</strong>m, chlorine, hydrogen<br />
fluoride, and carbon tetrachloride)<br />
Storage Tank Reports: 52 (chloro<strong>for</strong>m, perchloroethylene, sodium hydroxide, kerosene, diesel oil,<br />
heptachlor, chlorine, chrome, ferric sulfate, trichloroethylene, fuel oil no. 2, carbon tetrachloride,<br />
ethylene glycol, refrigerant gases, caustic soda, n,n-dimethylcyclohexylamine, deoxidizer 16,<br />
trimethylamine, motor oil, hydraulic oil, automotive gasoline, nitric acid, ferrous chloride,<br />
anhydrous ammonia, 10-34-0 liquid fertilizer, and JP-8 aviation fuel)<br />
Pipeline Reports: 59 (crude oil, JP-8 jet fuel, natural gas, propane, chloro<strong>for</strong>m, methylene<br />
chloride, methyl chloride, carbon tetrachloride, AFFF, hydrochloric acid, automotive gasoline, Jet<br />
A oil, and naphtha coal tar)<br />
256
<strong>2010</strong>-<strong>2040</strong> <strong>HAZARDS</strong> <strong>ANALYSIS</strong> <strong>PLAN</strong><br />
11.7.12 HAZMAT INCIDENT SUMMARY<br />
U.S. Department of Transportation Office of Hazardous Materials Safety’s Hazardous Materials In<strong>for</strong>mation<br />
System reports the following in<strong>for</strong>mation between the years 2001 and <strong>2010</strong> <strong>for</strong> the State of <strong>Kansas</strong>:<br />
U.S. Department of Transportation<br />
Pipeline and Hazardous Materials Safety Administration<br />
Office of Hazardous Material Safety<br />
Hazmat Summary by Incident State<br />
Injuries<br />
Year Incidents Hospitalized<br />
Non-<br />
Hospitalized Fatalities Damages<br />
<strong>2010</strong> 261 0 0 0 $323,892<br />
2009 322 0 3 0 $371,648<br />
2008 337 0 6 0 $555,409<br />
2007 402 0 16 0 $1,403,483<br />
2006 481 0 4 0 $660,098<br />
2005 336 1 10 0 $504,761<br />
2004 304 0 2 0 $367,472<br />
2003 392 0 1 0 $914,550<br />
2002 384 0 1 0 $305,608<br />
2001 341 0 5 0 $895,441<br />
Source: https://hip.phmsa.dot.gov/analytics/saw.dll?Dashboard&_scid=K579VFV65A8<br />
11.7.13 RADIOLOGICAL CONCERNS/INCIDENTS<br />
The last radiological incident reported in <strong>Sedgwick</strong> <strong>County</strong> occurred March 22, 1979 at the I-235 underpass<br />
near the Meridian Street exit. The incident involved a semi-trailer overturned containing refined uranium 235<br />
―Yellow Cake‖ (uranium oxide) LSA drums. Several drums were breached and radioactivity was detected on<br />
the ground. Over excavation of the soils was per<strong>for</strong>med. No injuries were reported and resulted primarily in<br />
over packing the uranium containing drums and excavated soils.<br />
According to Wolf Creek nuclear power plant located in Coffey <strong>County</strong>, uranium fuel pellets and rods are not<br />
transported through the south-central <strong>Kansas</strong> area and is not considered to be a concern.<br />
11.7.14 NUCLEAR WEAPONS TRANSPORTATION<br />
The Department of Energy’s National Nuclear Security Administration (NNSA) Office of Secure<br />
Transportation (OST) is responsible <strong>for</strong> the safe and secure transport in the contiguous United States of<br />
government-owned special nuclear materials. These classified shipments can contain nuclear weapons or<br />
components, enriched uranium, or plutonium. The cargo is transported in highly modified secure tractortrailers<br />
and escorted by armed Federal Agents in other vehicles who provide security and national incident<br />
command system response in the event of emergencies. The Amarillo, Texas command serves the Midwest<br />
states, and the Transportation and Emergency Control Center (TECC) center monitors the status and<br />
location and maintains real-time communications 24 hours a day, 365 days a year, with every convoy.<br />
Historically, deliberate threat attempts have been made on convoys to damage shipments by perpetrators;<br />
however, no shipments have been lost since 1947 when the program began.<br />
The covert usage of radiological materials by terrorist groups as a weapon of mass destruction (WMD) is a<br />
concern. The weapon could be detonated using conventional means and spread radioactivity over a large<br />
area. It is anticipated that one pound of radioactive material could affect an area greater than one mile<br />
depending on atmospheric conditions. Inhalation hazards and general contamination of persons, buildings<br />
and equipment are the primary concern.<br />
257
<strong>2010</strong>-<strong>2040</strong> <strong>HAZARDS</strong> <strong>ANALYSIS</strong> <strong>PLAN</strong><br />
11.7.15 METHAMPHETAMINE/CLANDESTINE LAB INCIDENTS<br />
Methamphetamine is a synthetic amphetamine or stimulant that is produced and sold illegally in pill <strong>for</strong>m,<br />
capsules, powder, or chunks and produced in illegal clandestine drug laboratories that are commonly found<br />
in motels; rural areas away from the general public; and residential areas, including houses, apartments, and<br />
garages. Mobile labs have also been found in vehicles and discarded along roadsides or parking lots.<br />
Methamphetamine is produced from 19 chemicals regulated under the Chemical Control Act with specific<br />
reported requirements from chemical industry manufacturers and retailers. Anhydrous ammonia is one of<br />
the primary chemicals of concern because of its commonality and can affect persons living near ammonia<br />
storage facilities. Explosions from chemical mixes and chemical vapors from the mixing are also of concern<br />
<strong>for</strong> persons in close proximity to the illegal laboratories. Lab Types consisting of anhydrous ammonia;<br />
hydriodic acid; hydrogenation; ice conversion; methamphetamine; p2p methylamine; tablet extraction; and,<br />
urine extraction.<br />
The following seizures, reported by the <strong>Kansas</strong> Bureau of Investigation (KBI) <strong>for</strong> the past ten years, show a<br />
consistent drop statewide:<br />
Year<br />
Methamphetamine/Clandestine Lab Seizures <strong>for</strong> <strong>Sedgwick</strong> <strong>County</strong><br />
Chemical Only or<br />
Dumpsite Laboratory Total Statewide<br />
Equipment Only<br />
<strong>2010</strong> 0 0 1 1 109<br />
2009 0 0 0 0 121<br />
2008 1 0 0 0 153<br />
2007 0 0 1 1 97<br />
2006 0 2 0 2 168<br />
2005 8 3 19 30 390<br />
2004 1 6 13 20 583<br />
2003 9 7 6 22 649<br />
2002 3 19 10 32 728<br />
2001 12 14 17 43 847<br />
11.7.16 WASTE TRANSFERS<br />
According to the U.S. Environmental Protection Agency’s Toxic Release Inventory (TRI) facility report, there<br />
are 33 <strong>Sedgwick</strong> <strong>County</strong> facilities that have reported waste transfers off-site <strong>for</strong> the year 2000. The following<br />
table shows the transfer type and estimated quantity that can be transported annually by highway and rail:<br />
Facility and<br />
Chemical<br />
Transfers<br />
to<br />
Recycling<br />
Transfers<br />
to Energy<br />
Recovery<br />
WASTE TRANSFER REPORT<br />
Transfers<br />
to<br />
Treatment<br />
Transfers<br />
to<br />
POTWs<br />
Other<br />
Off-site<br />
Transfers<br />
Total Transfers Off-site<br />
<strong>for</strong> Further Waste<br />
Management<br />
Total 7,610,987 373,066 12,475 208,452 1,053 8,553,228<br />
258
<strong>2010</strong>-<strong>2040</strong> <strong>HAZARDS</strong> <strong>ANALYSIS</strong> <strong>PLAN</strong><br />
11.7.17 SUSCEPTIBLE POPULATION PROXIMITY<br />
As shown in the 2002 <strong>Sedgwick</strong> <strong>County</strong> Commodity Flow Survey, the following areas were identified to be at<br />
risk of an accidental release of hazardous materials within ½-mile of the right-of-ways.<br />
Schools<br />
Day/Child<br />
Care<br />
Centers<br />
Highway Proximity<br />
(within ½ mile of a major highway)<br />
Health<br />
Care<br />
Facilities<br />
Medical<br />
Facilities<br />
Senior<br />
Centers<br />
Fire<br />
Stations<br />
EMS<br />
Stations<br />
Police<br />
Stations<br />
54 29 10 3 0 5 0 4<br />
Schools<br />
Day/Child<br />
Care<br />
Centers<br />
Railroad Proximity<br />
(within ½ mile of a major rail line)<br />
Health<br />
Care<br />
Facilities<br />
Medical<br />
Facilities<br />
Senior<br />
Centers<br />
Fire<br />
Stations<br />
EMS<br />
Stations<br />
Police<br />
Stations<br />
27 5 6 0 0 6 2 1<br />
Regulatory<br />
General transportation and industry safety guidelines and requirements would apply as identified by the<br />
<strong>Kansas</strong> Division of Motor Vehicles, <strong>Kansas</strong> Department of Revenue, <strong>Kansas</strong> Department of Transportation,<br />
<strong>Kansas</strong> Division of Health and Environment, Federal Aviation Administration, U.S. Nuclear Regulatory<br />
Commission, U.S. Department of Transportation, and the U.S. Environmental Protection Agency.<br />
Hazard Severity Ratings<br />
The following rating table indicates the probability of a hazardous materials event occurring once a year or<br />
more, impacting less than 25% of the land. It is not anticipated to impact health and safety, property, the<br />
environment, or economic value.<br />
Catastrophic Event<br />
HAZARDOUS MATERIALS HAZARD AND EVENT RATING TABLE<br />
Consequence Probable Rating Catastrophic Rating<br />
Area Impacted 1 3<br />
Probability 4 0<br />
Health & Safety 0 4<br />
Property 0 1<br />
Environment 0 2<br />
Economic 0 3<br />
Total Ratings 5 13<br />
A catastrophic event would result in the release by a facility’s Risk Management Plan chemical release worst<br />
case scenario affecting at least one quarter or more of the population, or a transportation accident resulting<br />
in the total release a chemical having a reportable quantity.<br />
259
<strong>2010</strong>-<strong>2040</strong> <strong>HAZARDS</strong> <strong>ANALYSIS</strong> <strong>PLAN</strong><br />
11.8 RADIOLOGICAL<br />
Definition: Radiation is a process of emission of energy or particles. Various <strong>for</strong>ms of radiation may be<br />
distinguished, depending on the type of the emitted energy/matter, the type of the emission source,<br />
properties and purposes of the emission, etc. Hazards that may face <strong>Sedgwick</strong> <strong>County</strong> may be through<br />
explosive technological release or solar impact.<br />
11.8.1 NUCLEAR WEAPON (IONIZING RADIATION)<br />
Nuclear weapons can range in size and yield, with the smallest (Davy Crockett) weighing 51 pounds with a<br />
yield of 10 tons of trinitrotoluene (TNT) up to the 27 ton Tsar Bomba bomb with a yield of 50 megatons (50<br />
million tons of TNT). By comparison, the Oklahoma City bombing non-radioactive yield was 2 tons of TNT.<br />
Nuclear fission is used to produce energy <strong>for</strong> nuclear<br />
power and to drive the explosion of nuclear weapons.<br />
Nuclear fusion of light elements releases the energy<br />
that causes nuclear weapons to explode.<br />
For a low altitude atmospheric detonation of a<br />
moderate sized weapon in the kiloton range, the<br />
energy is distributed roughly as follows: 50% as blast;<br />
35% as thermal radiation; and, 15% as nuclear<br />
radiation of which 5% is initial ionizing radiation within<br />
the first minute after detonation, and 10% as residual<br />
nuclear radiation (fallout).<br />
Surface Burst: An explosion in which a weapon is<br />
detonated on or slightly above the surface of the earth<br />
so that the fireball actually touches the land or water<br />
surface.<br />
Subsurface Burst: An explosion in which the point of<br />
the detonation is beneath the surface of land or water.<br />
High Altitude Burst: The weapon is exploded at such an altitude (above 30 km) that the fireball is much larger<br />
and expands much more rapidly. The ionizing radiation from the high altitude burst can travel <strong>for</strong> hundreds of<br />
miles be<strong>for</strong>e being absorbed. Significant ionization of the upper atmosphere (ionosphere) can occur. Severe<br />
disruption in communications can occur following high altitude bursts. They also lead to generation of an<br />
intense electromagnetic pulse (EMP) that can significantly degrade per<strong>for</strong>mance of or destroy sophisticated<br />
electronic equipment. There are no known biological effects of EMP; however, indirect effects may result<br />
from failure of critical medical equipment.<br />
National Nuclear Security Administration (NNSA) Office of Secure Transportation (OST)<br />
The Department of Energy’s NNSA OST is responsible <strong>for</strong> the<br />
safe and secure transport in the contiguous United States of<br />
government-owned special nuclear materials. These<br />
classified shipments can contain nuclear weapons or<br />
components, enriched uranium, or plutonium. The cargo is<br />
transported in highly modified secure tractor-trailers and<br />
escorted by armed Federal Agents in other vehicles who<br />
provide security and national incident command system<br />
response in the event of emergencies. The Safeguards<br />
Transporter (SGT) is a specially designed part of an 18-wheel<br />
rig that incorporates various deterrents to prevent<br />
unauthorized removal of cargo.<br />
260
<strong>2010</strong>-<strong>2040</strong> <strong>HAZARDS</strong> <strong>ANALYSIS</strong> <strong>PLAN</strong><br />
The trailer has been designed to protect the cargo against damage in the event of an accident. superior<br />
structural characteristics and a highly reliable cargo tie - down system similar to that used aboard aircraft.<br />
The thermal characteristics of the SGT would allow the trailer to be totally engulfed in a fire without incurring<br />
damage to the cargo. The tractors are standard production units that have been modified to provide the<br />
federal agents protection against attack. Escort vehicles accompany the tractor-trailers during transportation<br />
activities. Transport shipments occur to and from the Pantex facility in Amarillo, Texas and have passed<br />
through the State of <strong>Kansas</strong> (including <strong>Sedgwick</strong> <strong>County</strong>) using alternating routes.<br />
11.8.2 RADIOLOGICAL DISPERSAL DEVICE (RDD)<br />
An RDD or ―dirty bomb‖ combines a conventional explosive, such as dynamite, with radioactive material. In<br />
most instances, the conventional explosive itself would have more immediate lethality than the radioactive<br />
material. At the levels created by most probable sources, not enough radiation would be present in a dirty<br />
bomb to kill people or cause severe illness. Contamination caused by the use of certain types of radioactive<br />
materials would be the main concern in the release of an RDD.<br />
11.8.3 ELECTROMAGNETIC RADIATION/PULSE (EMR/EMP)<br />
The electromagnetic radiation from an explosion (especially nuclear explosions) or an intensely fluctuating<br />
magnetic field caused by Compton-recoil electrons (increase in wavelength decrease in energy) which<br />
occurs when X-ray (or gamma ray) photons with energies of around 0.5 MeV to 3.5 MeV interact with<br />
electrons in a material) and photoelectrons from photons scattered in the materials of the electronic or<br />
explosive device or in a surrounding medium. An EMP acts like a stroke of lightning but is stronger, faster,<br />
and shorter. It can seriously damage electronic devices connected to power sources or antennas. This<br />
includes communication systems, computers, electrical appliances, and automobile or aircraft ignition<br />
systems. The damage could range from a minor interruption to actual burnout of components. Batterypowered<br />
radios with short antennas generally would not be affected. A nuclear burst of approximately 20<br />
megatons over the central part of the United States at an altitude of 500 kilometers would produce an EMP<br />
field that would incapacitate all communications systems in the continental United States.<br />
Electrical power is necessary to maintain and support critical infrastructure with main sources of power and<br />
transmission lines located above ground. Hazards to these sources include natural, technological, and civil<br />
disruptions. It is anticipated by power utility companies that interruptions to service will be limited with a<br />
short recovery time based on previous disasters that have occurred around the world. During the ―Cold<br />
War‖, civil defense became concerned with the misuse of atomic power leading to the concern <strong>for</strong> a high<br />
altitude detonation above the United States causing an electromagnetic pulse which would dampen electrical<br />
and communications systems with slow recovery across the country. This concern is still reflected in the<br />
United States Congress including a special 2008 commission report which states:<br />
The electromagnetic pulse (EMP) generated by a high altitude nuclear explosion is one of a<br />
small number of threats that can hold our society at risk of catastrophic consequences. The<br />
increasingly pervasive use of electronics of all <strong>for</strong>ms represents the greatest source of<br />
vulnerability to attack by EMP. Electronics are used to control, communicate, compute,<br />
store, manage, and implement nearly every aspect of United States (U.S.) civilian systems.<br />
The Commission’s view is that the Federal Government does not today have sufficiently<br />
robust capabilities <strong>for</strong> reliably assessing and managing EMP threats. 42<br />
EMP is a burst of electromagnetic radiation (EMR) that can be derived from nuclear explosions, non-nuclear<br />
explosions, and geomagnetic storms. Saturation of the air by high electron volts can result in damaging or<br />
destroying telecommunications and electrical systems. The intensity of EMP is the proximity of the explosion<br />
to the target, and <strong>for</strong> high altitude nuclear explosions, based on the magnetic field intensity of the earth and<br />
ionization of the upper atmosphere. Nuclear EMP components include:<br />
E1 Pulse – high altitude/fast moving gamma radiation of two million electron volts (2 MeV) knocking<br />
electrons out of the air (electrifying) and proceeding at near light speed velocity towards the earth<br />
42 Report of the Commission to Assess the Threat to the United States from Electromagnetic Pulse (EMP)<br />
Attack – Critical National Infrastructures, April 2008<br />
261
<strong>2010</strong>-<strong>2040</strong> <strong>HAZARDS</strong> <strong>ANALYSIS</strong> <strong>PLAN</strong><br />
with an electric current (Compton Effect) and lasting less than one to a few nanoseconds. Faraday<br />
cages do not protect against this type of pulse.<br />
E2 Pulse – typically follows an E1 pulse and lasts from one microsecond to one second over a large<br />
geographic area, generally comparable to a multiple lightning strike.<br />
E3 Pulse – considered to be the late time EMP, can last a minute or more and comparable to an<br />
extreme geomagnetic storm (Category 5).<br />
Although there have been nuclear tests conducted during the ―Cold War‖ with megaton yields to determine<br />
the effect of EMP on a large area (i.e. continental United States), concerns of the 21 st century are from<br />
smaller explosions and geomagnetic storms.<br />
10 Kiloton Nuclear Detonation – Considered to be a plausible threat in high altitude or ground detonation<br />
(gun-type weapon) within the United States by rogue countries with nuclear power or terrorist organizations<br />
(i.e. Al-Qaeda) with adequate funding and procurement. The following excerpts are from the 1999<br />
congressional testimony 43 to the Committee on Armed Forces in relation to the North Korean nuclear threat<br />
of that time from Dr. Lowell Wood, Commissioner of the EMP Commission:<br />
―Special purpose nuclear warheads, on a kiloton scale, can have much more of EMP effect<br />
than ordinary nuclear warheads on the megaton scale. Less than ten kilotons properly<br />
employed in the type of warheads which have actually been examined, both in the Soviet<br />
Union and in the United States experimentally, warheads of less than 10-kiloton yields can<br />
put out very large EMP signals.‖<br />
―In order to be noncontroversial, I will just quote a CIA estimate that has been briefed by a<br />
senior cognizant CIA national intelligence officer on the Hill here during the last year, on an<br />
unclassified basis, where he considered a hypothetical laydown of the type that could be<br />
posed by a Taepo Dong missile over the central United States and presented the<br />
unclassified calculations of what the EMP yield or the EMP consequences would be at the<br />
coasts of the United States; in other words, most distant from the explosion. The EMP field<br />
strengths that were calculated there—and nobody seriously questions these calculations,<br />
they are with tool sets that are community tool sets that have been around <strong>for</strong> decades—with<br />
the field strengths that were demonstrated at the coasts, the maximum distance, you would<br />
see upset or damage to a wide variety of civilian equipment that has been documented to fail<br />
at these field strengths, and you would see some damage to military equipment.‖<br />
According to the 2008 commission report, the following are considered examples of non-nuclear EMP<br />
disruptions:<br />
Bellingham Pipeline Incident. On June 10, 1999, one of the Olympic pipelines transporting<br />
gasoline ruptured in the Whatcom Falls Park area of Bellingham, Washington. Causes<br />
included improperly set relief valves, delayed maintenance inspections, and SCADA system<br />
discrepancies. The electronic disturbance of an EMP event could be expected to precipitate<br />
SCADA failures and the ensuing loss of valve controls.<br />
Carlsbad Pipeline Incident. On August 19, 2000, an explosion occurred on one of three<br />
adjacent large natural gas pipelines near Carlsbad, New Mexico, operated by the El Paso<br />
Natural Gas Company. The explosion happened because of failures in maintenance and<br />
loss of situational awareness, conditions that would be replicated by data acquisition<br />
disruptions caused by an EMP event.<br />
Pembroke Refinery Incident. On July 24, 1994, a severe thunderstorm passed over the<br />
Pembroke refinery in the United Kingdom. Lightning strikes resulted in a 0.4 second power<br />
loss and subsequent power dips throughout the refinery. Consequently, numerous pumps<br />
43 Electromagnetic Pulse Threats to the U.S. Military and Civilian Infrastructure (1999), Committee on Armed<br />
Services, House of Representatives, 106 th Congress, pg 49 and 50<br />
262
<strong>2010</strong>-<strong>2040</strong> <strong>HAZARDS</strong> <strong>ANALYSIS</strong> <strong>PLAN</strong><br />
and overhead fin-fan coolers tripped repeatedly, resulting in the main crude column pressure<br />
safety valves lifting and major upsets in the process units in other refinery units, including<br />
those within the fluid catalytic cracking (FCC) complex. There was an explosion in the FCC<br />
unit and a number of isolated fires continued to burn at locations within the FCC, butamer,<br />
and alkylation units. The disturbances caused by the lightning strikes — power loss and<br />
degradation — would also result from an EMP event.<br />
The Commission has also investigated the impact of a 100-year super storm. The induced geomagnetic<br />
superstorm currents in the transmission lines will cause hundreds of high voltage trans<strong>for</strong>mers to saturate,<br />
creating a severe reactive load in the power system leading to voltage collapse in the affected area and<br />
damage to elements of the transmission system.<br />
11.8.4 GEOMAGNETIC STORMS 44<br />
Solar Cycle 10 began in 1855 with a smoothed sunspot number maximum of 96 by September 1959. At<br />
11:18 AM on the cloudless morning of Thursday, September 1, 1859, 33-year-old Richard Carrington<br />
captured the likeness of an enormous group of sunspots. Suddenly, two brilliant beads of blinding white light<br />
appeared over the sunspots, intensified rapidly, and became kidney-shaped. Approximately 18 hours later.<br />
just be<strong>for</strong>e dawn the next day, skies all over planet Earth erupted in red, green, and purple auroras so<br />
brilliant that newspapers could be read as easily as in daylight. Auroras pulsated even at near tropical<br />
latitudes over Cuba, the Bahamas, Jamaica, El Salvador, and Hawaii. However, telegraph systems<br />
worldwide went haywire. Spark discharges shocked telegraph operators and set the telegraph paper on fire.<br />
Even when telegraphers disconnected the batteries powering the lines, aurora-induced electric currents in<br />
the wires still allowed messages to be transmitted. ―What Carrington saw was a white-light solar flare—a<br />
magnetic explosion on the sun," explained David Hathaway, solar physics team lead at NASA's Marshall<br />
Space Flight Center in Huntsville, Alabama.<br />
A huge solar flare on August 4, 1972 during Solar Cycle 20 knocked out long-distance telephone<br />
communication across Illinois. That event caused AT&T to redesign its power system <strong>for</strong> transatlantic cables.<br />
A similar flare on March 13, 1989, provoked geomagnetic storms that disrupted electric power transmission<br />
from the Hydro Québec generating station in Canada, blacking out most of the province and plunging 6<br />
million people into darkness <strong>for</strong> 9 hours; aurora-induced power surges even melted power trans<strong>for</strong>mers in<br />
New Jersey as well as damaging a 1200 MVA 500kV trans<strong>for</strong>mer at the Salem nuclear power plant. In<br />
December 2005, X-rays from another solar storm disrupted satellite-to-ground communications and Global<br />
Positioning System (GPS) navigation signals <strong>for</strong> about 10 minutes.<br />
11.8.5 NATURAL EMP VS EMP ATTACK<br />
Historically, only one or several critical elements within a system were incapacitated; whereas, an EMP<br />
attack would damage or disrupt multiple elements over a broad geographic area with cascading failures.<br />
Telecommunications and SCADA systems typically were not affected by natural EMP; however, an attack<br />
would cause damage and disruption of these systems and require minimal communications <strong>for</strong> immediate<br />
responses to restore the system.<br />
Critical infrastructure sectors would be temporarily impeded in a natural EMP; however, multiple sectors (i.e.<br />
finance, transportation, etc) would continue to deteriorate from the EMP attack and cause secondary<br />
disasters (i.e. accidents, economic impact, etc).<br />
11.8.6 SOLAR CYCLES/FLARES AND CORONAL MASS EJECTIONS<br />
Coronal Mass Ejection (CME): Are balloon-shaped bursts of solar wind rising above the solar corona,<br />
expanding as they climb. Solar plasma is heated to tens of millions of degrees, and electrons, protons, and<br />
heavy nuclei are accelerated to near the speed of light. The super-heated electrons from CMEs move along<br />
the magnetic field lines faster than the solar wind can flow. Rearrangement of the magnetic field, and solar<br />
flares may result in the <strong>for</strong>mation of a shock that accelerates particles ahead of the CME loop. Each CME<br />
44 NASA Science News, May 6, 2008<br />
263
<strong>2010</strong>-<strong>2040</strong> <strong>HAZARDS</strong> <strong>ANALYSIS</strong> <strong>PLAN</strong><br />
releases up to 100 billion kg (220 billion lb) of this material, and the speed of the ejection can reach 1000<br />
km/second (2 million mph) in some flares. Solar flares and CMEs are currently the biggest "explosions" in our<br />
solar system, roughly approaching the power in ONE BILLION hydrogen bombs. (NASA definition)<br />
Solar Cycle: Occurs every 11 years. Solar maximum is the term <strong>for</strong> the maximum in solar activity that<br />
takes place approximately every eleven years; solar minimum is the lowest point of solar activity. The<br />
current prediction <strong>for</strong> Solar Cycle 24 gives a smoothed sunspot number maximum of about 89 in May of<br />
2013. Increased activity in the last few months has raised the predicted maximum above the 64.2 <strong>for</strong> the<br />
Cycle 14 maximum in 1907. The current predicted size still make this the smallest sunspot cycle in over 80<br />
years.<br />
CMEs, along with solar flares of other origin, can disrupt radio transmissions and cause damage to satellites<br />
and electrical transmission line facilities, resulting in potentially massive and long-lasting power outages.<br />
CMEs typically reach Earth one to five days after the eruption from the Sun. CMEs interact with the solar<br />
wind and the Interplanetary Magnetic Field (IMF). As a consequence, slow CMEs are accelerated toward the<br />
speed of the solar wind and fast CMEs are decelerated toward the speed of the solar wind. Fast CMEs<br />
(faster than about 500 km s −1 ) eventually drive a shock. This shock wave is part of a geomagnetic storm<br />
which interacts with the Earth's magnetic field. The increase in the solar wind pressure initially compresses<br />
the magnetosphere and the solar wind magnetic field will interact with the Earth’s magnetic field and transfer<br />
an increased amount of energy into the magnetosphere. (National Academy of Sciences)<br />
Co-author John Kappenmann of the Metatech Corporation looked at the great geomagnetic storm of May<br />
1921, which produced ground currents as much as ten times stronger than the 1989 Quebec storm (Solar<br />
Cycle 22 with a smoothed sunspot number maximum of 158), and modeled its effect on the modern power<br />
grid. He found more than 350 trans<strong>for</strong>mers at risk of permanent damage and 130 million people without<br />
power. The loss of electricity would ripple across the social infrastructure with "water distribution affected<br />
within several hours; perishable foods and medications lost in 12-24 hours; loss of heating/air conditioning,<br />
sewage disposal, phone service, fuel re-supply and so on. The State of <strong>Kansas</strong> is shown with 27% potential<br />
264
<strong>2010</strong>-<strong>2040</strong> <strong>HAZARDS</strong> <strong>ANALYSIS</strong> <strong>PLAN</strong><br />
loss of power that could extend into years. http://science.nasa.gov/science-news/science-atnasa/2009/21jan_severespaceweather/<br />
The National Oceanic and Atmospheric Administration (NOAA)<br />
Space Weather Prediction Center (SWPC) monitors solar activity<br />
from the sun to determine the effects of geomagnetic storms,<br />
solar radiation storms, and radio blackouts that may occur on<br />
Earth. Intensities of each of these solar effects are measured on a<br />
scale from 1 (minor) to 5 (extreme). Geomagnetic storms are<br />
disturbances in the geomagnetic field caused by gusts in the solar<br />
wind that blows by Earth; Solar radiation storms have elevated<br />
levels of radiation that occur when the numbers of energetic<br />
particles increase; and, Radio blackouts are disturbances of the<br />
ionosphere caused by X-ray emissions from the Sun.<br />
Descriptions of each of these storm types, occurrences, durations, and potential effects on Earth are shown<br />
below:<br />
11.8.7 NOAA SPACE WEATHER SCALES<br />
265
<strong>2010</strong>-<strong>2040</strong> <strong>HAZARDS</strong> <strong>ANALYSIS</strong> <strong>PLAN</strong><br />
An example of a G5 storm is one that occurred in 1989 that made currents on the ground that caused a<br />
failure in the Hydro-Quebec electric power system. This prevented 6 million people in Canada and the US<br />
from having electricity <strong>for</strong> over 9 hours.<br />
Regulatory<br />
There are no regulatory guidelines except those in place <strong>for</strong> the tracking and management of nuclear<br />
material by the U.S. Department of Energy, Nuclear Regulatory Commission, and U.S. Department of<br />
Transportation.<br />
266
<strong>2010</strong>-<strong>2040</strong> <strong>HAZARDS</strong> <strong>ANALYSIS</strong> <strong>PLAN</strong><br />
Hazard Severity Ratings<br />
The following rating table indicates the probability of a radiological event occurring rarely, impacting less than<br />
25% of the land. It is not anticipated to impact health and safety, property, the environment, or economic<br />
value.<br />
Catastrophic Event<br />
RADIOLOGICAL HAZARD AND EVENT RATING TABLE<br />
Consequence<br />
Probable<br />
Rating<br />
Catastrophic<br />
Rating<br />
Area Impacted 1 3<br />
Probability 0 0<br />
Health & Safety 0 1<br />
Property 0 0<br />
Environment 0 0<br />
Economic 0 1<br />
Total Ratings 1 5<br />
The catastrophic event mentioned shows the probability of a solar radiation occurrence in which some power<br />
outages may occur and reduction of telecommunications. EMP protection typically does not exist in the<br />
State of <strong>Kansas</strong> or <strong>Sedgwick</strong> <strong>County</strong> with the exception of key buildings housing security in<strong>for</strong>mation sharing<br />
(i.e. Fusion Centers). None of the utilities have been actively pursuing EMP protection; however, many<br />
SCADA systems do have manual controls in case of failure or cyber attack. For the most part, critical<br />
infrastructure affecting the 18 sector specific areas is not considered to be protected against any of the EMP<br />
pulse classifications. Recovery time will be based on availability of parts <strong>for</strong> repair, and repair time required<br />
to service connections and lines/cables.<br />
267
<strong>2010</strong>-<strong>2040</strong> <strong>HAZARDS</strong> <strong>ANALYSIS</strong> <strong>PLAN</strong><br />
11.9 FIRE/WILDFIRE<br />
Definition: A rapid, persistent chemical change that releases heat and light and is accompanied by flame,<br />
especially the exothermic oxidation of a combustible substance.<br />
The history of fire in <strong>Sedgwick</strong> <strong>County</strong> goes back to the late 1800s and early 1900s. Range fires were<br />
common in the 30s, 40s, and 50s. During the 20-year period between 1954 and 1973 inclusive, there was<br />
an average of one fire with an estimated loss of more than $100,000 per year. The worst single year was<br />
1968 with four such fires recorded totaling $902,000 loss. The worst single fire in the period was recorded in<br />
1959 with an $800,000 loss. Seven of those twenty years experienced no fires of $100,000 or more loss.<br />
In 2009, the Wichita Fire Department responded to 43,711 calls <strong>for</strong> service with an average response time of<br />
0:04:34. Calls <strong>for</strong> service in 2009 included:<br />
Fires (All Types) 1,645<br />
Emergency Medical Services 31,352<br />
Hazardous Conditions (Not Involving Fire) 1,117<br />
Good Intent (No Emergency or Hazard Found) 4,315<br />
False Alarms 1,632<br />
Public Assistance 2,663<br />
In 2009, <strong>Sedgwick</strong> <strong>County</strong> Fire District #1 responded to 6,071 calls <strong>for</strong> service with an average response<br />
time of 0:06:02. Calls <strong>for</strong> service in 2009 included:<br />
Fires (All Types) 618<br />
Emergency Medical Services 3,583<br />
Hazardous Conditions (Not Involving Fire) 190<br />
Good Intent (No Emergency or Hazard Found) 897<br />
False Alarms 282<br />
Public Assistance 501<br />
The following table shows the fire and medical response calls provided by each of the 7 in-county fire<br />
departments and the <strong>Sedgwick</strong> <strong>County</strong> Emergency Management fire reserve unit:<br />
DISPATCH CALLS OF VOLUNTEER FIRE DEPARTMENTS FOR 2005*<br />
Department Fire Calls Medical Calls Total Calls<br />
Bentley 59 34 93<br />
Cheney 86 105 191<br />
Clearwater 15 156 171<br />
Colwich 68 66 134<br />
Mount Hope 28 43 71<br />
Valley Center 173 65 238<br />
Viola 26 11 37<br />
Fire Reserve Unit 140 117 257<br />
* In<strong>for</strong>mation from <strong>Sedgwick</strong> <strong>County</strong> Emergency Communications<br />
The following volunteer organizations were shown to have made dispatch calls in 2005 to support fire<br />
departments developed from <strong>Sedgwick</strong> <strong>County</strong> Emergency Communications:<br />
Red Cross: 72 calls<br />
Salvation Army: 4 calls<br />
268
<strong>2010</strong>-<strong>2040</strong> <strong>HAZARDS</strong> <strong>ANALYSIS</strong> <strong>PLAN</strong><br />
Regulatory<br />
Regulatory guidance is contained in National Fire Protection Association (NFPA) codes and standards and<br />
the 2003 International Fire Code. Compliance with ISO fire suppression requirements <strong>for</strong> specific fire<br />
insurance ratings.<br />
Hazard Severity Ratings<br />
The following rating table indicates the probability of a fire event occurring more than once per year but<br />
affecting less than 25% of an area. Minor injuries and/or illnesses have been reported on occasion, with<br />
some buildings damaged or destroyed. Minor environmental damages, mostly resulting from run-off, and the<br />
potential <strong>for</strong> high direct costs associated with equipment and personnel.<br />
Catastrophic Event<br />
Consequence<br />
FIRE HAZARD AND EVENT RATING TABLE<br />
Probable<br />
Rating<br />
Catastrophic<br />
Rating<br />
Area Impacted 1 1<br />
Probability 4 3<br />
Health & Safety 1 3<br />
Property 2 3<br />
Environment 1 2<br />
Economic 2 2<br />
Total Ratings 11 14<br />
A catastrophic event could occur in the event of a natural disaster causing numerous fires and affecting high<br />
rise structures and chemical facilities. Since the fire departments respond to hazardous materials releases,<br />
a combination of fire and hazardous material local response could exhaust resources quickly.<br />
269
<strong>2010</strong>-<strong>2040</strong> <strong>HAZARDS</strong> <strong>ANALYSIS</strong> <strong>PLAN</strong><br />
11.10 WEAPON OF MASS DESTRUCTION<br />
Definition: According to Title 18 United States Code (USC) Section 2332a, a weapon of mass destruction is<br />
defined as: ―(A) any destructive device as defined in section 921 of this title; (B) any weapon that is<br />
designed or intended to cause death or serious bodily injury through the release, dissemination, or impact of<br />
toxic or poisonous chemicals, or their precursors; (C) any weapon involving a biological agent, toxin, or<br />
vector (as those terms are defined in section 178 of this title); or (D) any weapon that is designed to release<br />
radiation or radioactivity at a level dangerous to human life.‖<br />
An explosive is a sudden rapid violent release of mechanical, chemical, or nuclear energy from a confined<br />
region; especially such a release that generates a radial transmitting shock wave accompanied by a loud,<br />
sharp report, flying debris, heat, light and fire. There are three types of explosives: low, high and tertiary.<br />
11.10.1 Low Explosives<br />
A low explosive is a combustible substance that decomposes rapidly (deflagration), but does not explode<br />
under normal conditions. Under certain conditions, though, it is possible <strong>for</strong> them to detonate, usually through<br />
the combined use with high explosives. Low explosives are normally employed as propellants. Most low<br />
explosives are mixtures; most high explosives are compounds, but to both there are notable exceptions.<br />
They undergo deflagration at rates that vary from a few centimeters per second to approximately 400 meters<br />
per second. Included in this group are smokeless powders and pyrotechnics such as flares and illumination<br />
devices.<br />
11.10.2 High Explosives<br />
High explosives are normally employed in mining, demolition, and military warheads. They undergo<br />
detonation at rates of 1,000 to 9,000 meters per second. High explosives are conventionally subdivided into<br />
two classes differentiated by sensitivity:<br />
Primary explosives are extremely sensitive to shock, friction, and heat. They will burn rapidly or<br />
detonate if ignited.<br />
Secondary explosives, also called base explosives, are relatively insensitive to shock, friction, and<br />
heat. They may burn when ignited in small, unconfined quantities, but detonation can occur. These<br />
are sometimes added in small amounts to blasting caps to boost their power.<br />
11.10.3 Tertiary Explosives<br />
Also called blasting agents, are so insensitive to shock that they cannot be reliably detonated by practical<br />
quantities of primary explosive, and instead require an intermediate explosive booster of secondary<br />
explosive.<br />
11.10.4 Emergency Response Calls<br />
<strong>Sedgwick</strong> <strong>County</strong> Emergency Communications is the primary answering point <strong>for</strong> 9-1-1 calls in <strong>Sedgwick</strong><br />
<strong>County</strong> and provides dispatch services <strong>for</strong> the <strong>Sedgwick</strong> <strong>County</strong> Sheriff's Office, <strong>Sedgwick</strong> <strong>County</strong> Fire<br />
Department, and <strong>Sedgwick</strong> <strong>County</strong> Emergency Medical Service. Additionally, they provide dispatch services<br />
<strong>for</strong> the Wichita Police and Fire Departments, as well as outlying municipalities including: Andale, Bel Aire,<br />
Cheney, Clearwater, Colwich, Eastborough, Garden Plain, Goddard, Kechi, Maize, Mt. Hope and Park City.<br />
As a result, <strong>Sedgwick</strong> <strong>County</strong> agencies generally respond to 60 device calls, 24 bomb threats, and 114<br />
explosive calls annually. Some of these calls included the discovery of pipe bombs, hand grenades,<br />
fireworks, artillery shells, and methamphetamine laboratories.<br />
Regulatory<br />
The Wichita Police Department’s Explosive Ordnance Disposal (EOD) team is assigned to the Special<br />
Operations Bureau and is one of only several bomb units within the state of <strong>Kansas</strong>, and the only civilian<br />
team within the southern half of the state. The EOD Team supports the regional office of Bureau of Alcohol,<br />
270
<strong>2010</strong>-<strong>2040</strong> <strong>HAZARDS</strong> <strong>ANALYSIS</strong> <strong>PLAN</strong><br />
Tobacco and Firearms (BATF) within their 69 county regional jurisdictions. They are called upon to respond<br />
to any incident that requires handling or securing of explosives, suspected devices, or weapons of mass<br />
destruction. McConnell AFB also has an EOD team; however, they are used to handle only un-improvised<br />
military style ordinance outside the military installation.<br />
Hazard Severity Ratings<br />
The following rating table indicates the probability of a fire event occurring more than once per year but<br />
affecting less than 25% of an area. Minor injuries and/or illnesses have been reported on occasion, with<br />
some buildings damaged or destroyed. Minor environmental damages and the potential <strong>for</strong> low direct costs<br />
associated with equipment and personnel.<br />
Catastrophic Event<br />
EXPLOSIVE HAZARD AND EVENT RATING TABLE<br />
Consequence<br />
Probable<br />
Rating<br />
Catastrophic<br />
Rating<br />
Area Impacted 1 1<br />
Probability 4 0<br />
Health & Safety 1 4<br />
Property 2 2<br />
Environment 1 2<br />
Economic 1 2<br />
Total Ratings 10 11<br />
A catastrophic event would result from an incident involving a special event (see Terrorism).<br />
271
<strong>2010</strong>-<strong>2040</strong> <strong>HAZARDS</strong> <strong>ANALYSIS</strong> <strong>PLAN</strong><br />
11.11 POLLUTION<br />
Definition: To pollute is to contaminate an environment with natural or man-made material.<br />
11.11.1 AIR QUALITY<br />
For reporting year 2000, the total fugitive air and stack release amounts (in pounds) reported by the U.S.<br />
EPA was over 2.2 millions pounds <strong>for</strong> on-site and off-site locations in <strong>Sedgwick</strong> <strong>County</strong>. In addition, over 18<br />
grams of dioxin or dioxin-like compounds were also reportedly released. <strong>Sedgwick</strong> <strong>County</strong>. The city of<br />
Wichita measures ground level ozone at four sites in <strong>Sedgwick</strong> <strong>County</strong>. A monitor at Peck records the level<br />
of ozone in the air as it blows into our community from the south. Readings taken at the monitor at 1900 E.<br />
Ninth St. are considered typical levels in the city. A monitor near Park City measures ozone in the air as it<br />
exits Wichita. The fourth monitor near <strong>Sedgwick</strong> was added in 2009. Three years’ data must be collected<br />
be<strong>for</strong>e adding this new site to the graph below.<br />
Ozone readings from three consecutive years are averaged when determining a community’s ozone status.<br />
The levels of ozone in <strong>Sedgwick</strong> <strong>County</strong> are currently below the current .075 ppm ozone standard.<br />
11.11.2 WASTE CHEMICAL RELEASES<br />
The U.S. EPA also indicates 85,466 pounds of waste chemicals have been released into the environment<br />
due to catastrophic or one-time events by industry. Historically, there have been environmental releases<br />
onto the ground by industrial businesses in the City of Wichita. Some of these releases have resulted in<br />
contamination of the groundwater where remediation is currently being conducted.<br />
11.11.3 HAZARDOUS WASTE SITES<br />
There are 28 identified hazardous waste sites in various stages of remediation in <strong>Sedgwick</strong> <strong>County</strong>. These<br />
sites are the result of historical chemical releases and dumping from industrial facilities. One of these sites<br />
remains on the U.S. EPA’s national priorities list (NPL). The primary concern from these sites is<br />
groundwater contamination.<br />
11.11.4 DISPOSAL/SOLID WASTE SITES<br />
Solid waste facilities are permitted by the <strong>Kansas</strong> Department of Health and Environment (KDHE) and<br />
operate under stringent federal, state, and local regulations. <strong>Sedgwick</strong> <strong>County</strong> per<strong>for</strong>ms weekly inspections<br />
at the transfer stations and construction and demolition (C & D) landfills. There are more than 60 closed<br />
272
<strong>2010</strong>-<strong>2040</strong> <strong>HAZARDS</strong> <strong>ANALYSIS</strong> <strong>PLAN</strong><br />
dumps and landfills scattered throughout <strong>Sedgwick</strong> <strong>County</strong>.<br />
<strong>Sedgwick</strong> <strong>County</strong> Environmental Resources.<br />
The following in<strong>for</strong>mation is provided by<br />
Active and Closed Disposal Sites in <strong>Sedgwick</strong> <strong>County</strong><br />
Solid waste, or municipal solid waste (MSW), includes more than trash. The construction or the demolition of<br />
homes, commercial buildings, roads and highways produces waste that is called construction and demolition<br />
(C&D) debris. In 2001, <strong>Sedgwick</strong> <strong>County</strong> banned commercially generated C&D debris from the transfer<br />
stations. This waste is taken to a C&D landfill. There are two C&D landfills in <strong>Sedgwick</strong> <strong>County</strong>.<br />
MSW also includes wood waste, yard waste and household hazardous waste. Household hazardous waste<br />
is the term given to the chemicals we use at our homes such as paint and paint products, automobile fluids,<br />
garden chemicals, and cleaners. MSW includes household and business recyclables.<br />
273
<strong>2010</strong>-<strong>2040</strong> <strong>HAZARDS</strong> <strong>ANALYSIS</strong> <strong>PLAN</strong><br />
In 2009, 63 percent of the MSW generated in <strong>Sedgwick</strong> <strong>County</strong> passed through the transfer stations be<strong>for</strong>e<br />
disposal in a MSW landfill. The remaining 37 percent was diverted to a C&D landfill, or through recycling,<br />
composting and the Household Hazardous Waste Facility.<br />
Transfer Station Tonnage by Quarter<br />
In 2008 - 2009, <strong>Sedgwick</strong> <strong>County</strong> took an in-depth look at the trash in the local transfer stations. The results<br />
of this analysis will help determine the direction of future waste minimization ef<strong>for</strong>ts. The results of the waste<br />
analysis will also help determine if grass clippings should be banned from the transfer stations. A similar<br />
study was per<strong>for</strong>med in 1997 - 1998 at Brooks Landfill. The intent of that study was to evaluate the<br />
composition of the trash disposed of at the landfill. The new study will allow the county to assess the<br />
progress made by recycling and other waste diversion programs since 1998.<br />
Commercial Waste Characterization Study Results Breakdown<br />
Waste % Waste %<br />
Paper<br />
Glass<br />
Metal<br />
Plastic<br />
Food Waste<br />
36.9<br />
2.1<br />
3.6<br />
19.5<br />
7.7<br />
Yard Waste<br />
Construction/Demolition<br />
Textiles, Rubber, Leather<br />
Other<br />
2.8<br />
14.6<br />
5.7<br />
7.1<br />
274
<strong>2010</strong>-<strong>2040</strong> <strong>HAZARDS</strong> <strong>ANALYSIS</strong> <strong>PLAN</strong><br />
Residential Waste Characterization Study Results Breakdown<br />
Waste % Waste %<br />
Paper<br />
Glass<br />
Metal<br />
Plastic<br />
Food Waste<br />
21.8<br />
3.3<br />
3.2<br />
9.1<br />
11.8<br />
Yard Waste<br />
Construction/Demolition<br />
Textiles, Rubber, Leather<br />
Other<br />
31.0<br />
1.7<br />
6.4<br />
11.7<br />
Overall Waste Characterization Study Results Breakdown<br />
Waste % Waste %<br />
Paper<br />
Glass<br />
Metal<br />
Plastic<br />
Food Waste<br />
29.2<br />
2.7<br />
3.4<br />
14.3<br />
9.8<br />
Yard Waste<br />
Construction/Demolition<br />
Textiles, Rubber, Leather<br />
Other<br />
17.1<br />
8.0<br />
6.0<br />
9.5<br />
275
<strong>2010</strong>-<strong>2040</strong> <strong>HAZARDS</strong> <strong>ANALYSIS</strong> <strong>PLAN</strong><br />
In 2009, 63 percent of the MSW generated in <strong>Sedgwick</strong> <strong>County</strong> passed through the transfer stations be<strong>for</strong>e<br />
disposal in a MSW landfill. The remaining 37 percent was diverted to a C&D landfill, or through recycling,<br />
composting and the Household Hazardous Waste Facility.<br />
Regulatory<br />
The Wichita Health Department per<strong>for</strong>ms inspections of waste sites and air pollution permits. The <strong>Sedgwick</strong><br />
<strong>County</strong> Household Hazardous Waste Department has a program to assist businesses with hazardous waste<br />
disposal and waste reduction<br />
Hazard Severity Ratings<br />
The following rating table indicates the probability of a pollution event occurring more than once per year but<br />
affecting less than 25% of an area. Minor injuries and/or illnesses have been reported on occasion, with few<br />
properties damaged. Minor environmental damages and the potential <strong>for</strong> low direct costs associated with<br />
equipment and personnel.<br />
Catastrophic Event<br />
POLLUTION HAZARD AND EVENT RATING TABLE<br />
Consequence<br />
Probable<br />
Rating<br />
Catastrophic<br />
Rating<br />
Area Impacted 1 3<br />
Probability 4 0<br />
Health & Safety 1 4<br />
Property 1 1<br />
Environment 1 2<br />
Economic 1 3<br />
Total Ratings 10 13<br />
A catastrophic event would result in the release by a facility’s Risk Management Plan chemical release worst<br />
case scenario affecting at least one quarter or more of the population, or a transportation accident resulting<br />
in the total release a chemical having a reportable quantity.<br />
276
<strong>2010</strong>-<strong>2040</strong> <strong>HAZARDS</strong> <strong>ANALYSIS</strong> <strong>PLAN</strong><br />
11.12 DAMS AND LEVEES<br />
Definition: A dam is an artificial barrier usually constructed across a stream channel to impound water. A<br />
dike or levee is any artificial barrier together with appurtenant works that will divert or restrain the flow of a<br />
stream or other body of water <strong>for</strong> the purpose of protecting an area from inundation by floodwaters.<br />
There have been no dam or levee failures reported in <strong>Sedgwick</strong> <strong>County</strong>. There are 68 low hazard, seven<br />
significant hazard, and five high hazard dams with none considered to be in poor condition.<br />
11.12.1 TUTTLE CREEK DAM STUDY<br />
Cheney reservoir dam is similarly constructed to the Tuttle Creek Dam that is located approximately five<br />
miles north of Manhattan, <strong>Kansas</strong>. Based on in<strong>for</strong>mation developed in the Hazards Analysis plan, there is a<br />
potential <strong>for</strong> up to a magnitude 6 earthquake in <strong>Sedgwick</strong> <strong>County</strong>. The following in<strong>for</strong>mation, developed on<br />
Tuttle Creek Dam by the U.S. Army Corps of Engineers, may help in determining the probability of a natural<br />
breach Cheney Reservoir Dam in the event of an earthquake.<br />
Currently, seismologists at the U.S. Army Corps of Engineers are studying Tuttle Creek Dam. The study<br />
found that a magnitude 5.7 earthquake, located 12 miles from the dam (at the Humboldt fault), is the smallest<br />
earthquake that could potentially cause significant damage. This hypothetical earthquake would probably not<br />
cause consequential movement of the dam, but it could damage relief wells that control the flow of water<br />
under the dam and lead to dam failure. A seismic event of this nature has a probability of occurrence of<br />
about once in 1,800 years.<br />
On the other hand, a magnitude 6.6 earthquake would cause the sand deposits under the dam to liquefy, or<br />
turn to quicksand, and lose their ability to support the dam. This, in turn, would allow the base of the dam to<br />
spread and the top to drop, and cracking would significantly reduce the ability of the dam to hold water.<br />
Although the top of the dam would probably not drop below the lake level, cracking and de<strong>for</strong>mation could<br />
allow water to seep through the dam, leading to internal erosion, and eventually, uncontrolled release of the<br />
lake. This scenario has a very low probability of occurrence of about once in 10,000 years.<br />
Regulatory<br />
Effective October 13, 2004, <strong>Sedgwick</strong> <strong>County</strong> adopted a resolution (#183-2004) amending Chapter 13 of the<br />
<strong>Sedgwick</strong> <strong>County</strong> Code related to Floodplain Management <strong>for</strong> <strong>Sedgwick</strong> <strong>County</strong>, <strong>Kansas</strong>. The purpose of<br />
the chapter is to promote public health, safety, and general welfare and to minimize public and private losses<br />
due to flood conditions in specific areas by provisions designed to: protect human life and health; minimize<br />
expenditure of public money <strong>for</strong> costly flood control projects; minimize the need <strong>for</strong> rescue and relief ef<strong>for</strong>ts<br />
associated with flooding and generally undertaken at the expense of the general public; minimize prolonged<br />
business interruptions; minimize damage to public facilities and utilities such as water and gas mains,<br />
electric, telephone and sewer lines, streets and bridges located in floodplains; help maintain a stable tax<br />
base by providing <strong>for</strong> the sound use and development of flood prone areas in such a manner as to minimize<br />
future flood blight areas; ensure that potential home buyers are notified that property is in a flood area; and,<br />
ensure that those who occupy the areas of special flood hazard assume responsibility <strong>for</strong> their actions.<br />
Creation of a stormwater utility by the City of Wichita under section 16.30.020. Pursuant to the provisions of<br />
K.S.A. 12-3101, et seq., as modified by city Charter Ordinance No. 147, the Wichita city council does<br />
establish a stormwater utility and stormwater management system and declares its intention to be<br />
responsible <strong>for</strong> the operation, construction, maintenance and repair of a stormwater management system<br />
and stormwater utility. (Ord. No. 41-948 § 2)<br />
Title 33, Chapter 15 of the U.S. Code of Federal Regulations addresses flood control to include floodplain<br />
management, projects, and levees. Cheney reservoir dam is maintained under the Reclamation Safety of<br />
Dams Act, Public Law 95-578 and amended in 1984 under Public Law 98-404.<br />
277
<strong>2010</strong>-<strong>2040</strong> <strong>HAZARDS</strong> <strong>ANALYSIS</strong> <strong>PLAN</strong><br />
Hazard Severity Ratings<br />
The following rating table indicates the probability of a major levee or dam failure event occurring at least<br />
once every 25 years, impacting less than 25% of the land, resulting in minor injuries and/or illnesses with few<br />
homes destroyed and/or damaged, having short term recovery of resources, and low direct and/or indirect<br />
costs.<br />
Catastrophic Event<br />
LEVEE OR DAM FAILURE HAZARD EVENT RATING TABLE<br />
Consequence<br />
Probable<br />
Rating<br />
Catastrophic<br />
Rating<br />
Area Impacted 1 3<br />
Probability 3 2<br />
Health & Safety 1 4<br />
Property 2 4<br />
Environment 2 3<br />
Economic 1 4<br />
Total Ratings 10 20<br />
A probable and catastrophic worst-case event resulting in the failure of the Wichita and Valley Center<br />
Floodway located on the west of the city. Events leading up to this type of event are conditions equal or<br />
exceeding the 1979 and 1998 flood events with near maximum capacities of the Little Arkansas River and<br />
Wichita Drainage Canals. Over half of the City of Wichita would be inundated by a sizeable breach of the<br />
levee system.<br />
278
<strong>2010</strong>-<strong>2040</strong> <strong>HAZARDS</strong> <strong>ANALYSIS</strong> <strong>PLAN</strong><br />
11.13 EMERGING PUBLIC HEALTH THREATS<br />
Definition: Threats of illness and disease (viral and bacteriological), community infections, early diagnosis<br />
and treatment of illnesses and diseases, or any other health related mechanism that can cause harm to<br />
individuals, whether intentional or accidental. This includes the potential <strong>for</strong> widespread (epidemic) outbreak<br />
of a disease, or a large number of cases of a disease in a single community or relatively small area. An<br />
epidemic may be restricted to one locale or may even be global (pandemic).<br />
11.13.1 HISTORY<br />
A March 7, 1885 <strong>Kansas</strong> quarantine law against the Texas tick fever prohibited the entry of Texas bovines<br />
along the Chisholm Trail, and the January 1886 blizzard which killed all of the cattle in southwest <strong>Kansas</strong><br />
destroyed most of the range cattle industry<br />
11.13.2 COMMUNICABLE DISEASE<br />
The following reported numbers and respective communicable disease were identified by the <strong>Kansas</strong><br />
Division of Environment and Health (KDHE) during the period Jan 1, 1995 through October 6, 2005:<br />
COMMUNICABLE DISEASE<br />
Case Counts<br />
AMEBIASIS 7<br />
ANIMAL BITE 2<br />
BLASTOCYSTIS HOMINIS 18<br />
BOTULISM, INFANT 2<br />
BRUCELLOSIS 1<br />
CALICIVIRUS/NORWALK-LIKE VIRUS 1<br />
CAMPYLOBACTER 391<br />
CRYPTOSPORIDIOSIS 36<br />
DENGUE FEVER 1<br />
E. COLI O157:H7 27<br />
E. COLI, ETEC 17<br />
EHRLICHIOSIS HUMAN, OTHER 3<br />
EHRLICHIOSIS, HUMAN GRANULOCYTIC (HGE) 16<br />
EHRLICHIOSIS, HUMAN MONOCYTIC (HME) 17<br />
ENCEPHALITIS, CALIFORNIA 1<br />
ENCEPHALITIS, INFECTIOUS, OTHER 1<br />
ENCEPHALITIS, ST. LOUIS 2<br />
ENCEPHALITIS, WESTERN EQUINE 1<br />
FLU-LIKE ILLNESS 1<br />
FOOD BORNE ILLNESS 8<br />
GIARDIASIS 322<br />
GUILLAIN-BARRE 1<br />
HAEMOPHILUS INFLUENZAE 3<br />
HAEMOPHILUS, BACTEREMIA 1<br />
HEPATITIS A 185<br />
HEPATITIS B, ACUTE 140<br />
HEPATITIS B, CHRONIC 770<br />
HEPATITIS C, ACUTE 18<br />
HEPATITIS C, CHRONIC (HUMAN IMMUNE-DEFICIENCY VIRUS) 4,430<br />
INFLUENZA, A&B 88<br />
INFLUENZA, HIB 1<br />
LEAD, ADULT 1<br />
279
<strong>2010</strong>-<strong>2040</strong> <strong>HAZARDS</strong> <strong>ANALYSIS</strong> <strong>PLAN</strong><br />
COMMUNICABLE DISEASE<br />
Case Counts<br />
LEAD, PEDIATRIC 4<br />
LEGIONELLOSIS 8<br />
LISTERIOSIS 3<br />
LYME DISEASE 52<br />
MALARIA 7<br />
MEASLES 9<br />
MENINGITIS, ASEPTIC 36<br />
MENINGITIS, CRYPTOCOCCAL 4<br />
MENINGITIS, HIB 2<br />
MENINGITIS, NEISSERIA MENINGITIDIS 15<br />
MENINGITIS, OTHER BACTERIAL 34<br />
MENINGITIS, OTHER FUNGAL 7<br />
MENINGITIS, STREP PNEUMONIAE 23<br />
MENINGOCOCCEMIA 8<br />
MUMPS 18<br />
MYCOBACTERIUM OTHER THAN TB (MOTT) 316<br />
PERTUSSIS 211<br />
Q FEVER 37<br />
RESPIRATORY SYNCITIAL VIRUS (RSV) 1<br />
RHEUMATIC FEVER 1<br />
ROCKY MOUNTAIN SPOTTED FEVER 56<br />
RUBELLA 15<br />
SALMONELLA 653<br />
SHIGELLA 269<br />
STAPH. NOSOCOMIAL 4<br />
STREP. A, INVASIVE 110<br />
STREP. PNEUMONIA, INVASIVE 169<br />
TETANUS 1<br />
TOXIC SHOCK SYNDROME, STAPHYLOCOCCAL 2<br />
TRICHINOSIS 1<br />
TUBERCULOSIS, ACTIVE DISEASE 562<br />
TUBERCULOSIS, INFECTION 8,749<br />
TULAREMIA 20<br />
TYPHOID FEVER 3<br />
VARICELLA (CHICKENPOX) 223<br />
WEST NILE, ACUTE FLACCID PARALYSIS 1<br />
WEST NILE, ENCEPHALITIS/MENINGITIS 18<br />
WEST NILE, NON-NEUROLOGICAL (INCLUDES WEST NILE FEVER) 17<br />
YERSINIOSIS 1<br />
11.13.3 REPORTABLE DISEASE OUTBREAKS<br />
Examples of outbreaks from reportable diseases from poor health practices:<br />
Marion <strong>County</strong> Viral Gastroenteritis Outbreak Attributed to Norovirus (July 2005) - 52 of 96 people<br />
contracted norovirus (foodborne illness)<br />
Greenwood <strong>County</strong> Assisted Living Facility Outbreak of Diarrheal Illness (April 2005) - 22 of 40<br />
people contracted diarrheal illness (improper health prevention)<br />
Osage <strong>County</strong> Grade School Viral Gastroenteritis Outbreak Attributed to Norovirus (March 2005) -<br />
55 of 70 students contracted viral gastroenteritis and norovirus (foodborne illness)<br />
280
<strong>2010</strong>-<strong>2040</strong> <strong>HAZARDS</strong> <strong>ANALYSIS</strong> <strong>PLAN</strong><br />
<strong>Sedgwick</strong> <strong>County</strong> Day Care Viral Gastroenteritis Outbreak Attributed to Norovirus (February 2005) -<br />
6 of 6 people contracted norovirus (foodborne illness)<br />
Salmonella typhimurium Outbreak at a Department Store - <strong>Kansas</strong> November-December 2004 - 27<br />
of 99 people contracted salmonella (foodborne illness)<br />
Examples of large outbreaks from reportable diseases from accidental contamination:<br />
New York <strong>County</strong> Fair (Albany, NY): In September 1999, there was a reported 1,013 suspected and<br />
confirmed cases of E. coli O157:H7 infection resulted from drinking water from a contaminated well<br />
and spread from person to person because of poor sanitary practices.<br />
Municipal Water Supply (Walkerton, Ontario): In May 2000, 1,304 people became infected with E.<br />
coli O157:H7 after one of the city’s water wells became contaminated due to flooding from<br />
agricultural field run-off from a cattle manure farm and overwhelming the water treatment system<br />
because of increased turbidity.<br />
11.13.4 EPIDEMIC AND PANDEMIC DISEASES<br />
Examples of recent epidemic and pandemic diseases:<br />
West Nile Virus: According to the 2003 Public Health Service’s Centers <strong>for</strong> Disease Control and<br />
Prevention report Epidemic/Epizootic West Nile Virus in the United States: Guidelines <strong>for</strong><br />
Surveillance, Prevention, and Control, the first domestically acquired human cases of West Nile<br />
(WN) encephalitis were documented in the U.S. in late summer 1999. Surveillance tracked the<br />
spread of WNV throughout much of the U.S. between 2000 and 2002. By the end of 2002, WNV<br />
281
<strong>2010</strong>-<strong>2040</strong> <strong>HAZARDS</strong> <strong>ANALYSIS</strong> <strong>PLAN</strong><br />
activity had been identified in 44 states and the District of Columbia. The 2002 WNV epidemic and<br />
epizootic resulted in reports of 4,156 reported human cases of WN disease (including 2,942<br />
meningoencephalitis cases and 284 deaths), 16,741 dead birds, 6,604 infected mosquito pools, and<br />
14,571 equine cases. The 2002 WNV epidemic was the largest recognized arboviral<br />
meningoencephalitis epidemic in the Western Hemisphere and the largest WN meningoencephalitis<br />
epidemic ever recorded. Significant human disease activity was recorded in Canada <strong>for</strong> the first time,<br />
and WNV activity was also documented in the Caribbean basin and Mexico.<br />
Avian Influenza: In the United States, an outbreak of highly pathogenic avian influenza (HPAI) A<br />
(H5N2) was detected in February 2004 through routine surveillance and reported in a flock of 7,000<br />
chickens in Gonzales <strong>County</strong> in south-central Texas. This was the first outbreak of HPAI in the<br />
United States in 20 years. During the same time, an outbreak of low pathogenic avian influenza<br />
(LPAI) A (H7N2) was reported on two chicken farms in Delaware; LPAI H7N2 was reported from a<br />
flock of chickens in Pocomoke City, Maryland: and, LPAI H2N2 was reported in a layer flock located<br />
in Pennsylvania. In November 2003, there was been one reported case of human infection through<br />
the LPAI H7N2 in New York, and two Canadian poultry related laboratory confirmed cases of H7N3<br />
in the Fraser Valley region of British Columbia. Influenza A (H5N1) virus was first identified in birds<br />
in South Africa and has spread throughout 14 countries in Asia and resulted in the death or<br />
destruction of more than 100 million birds including poultry. In 1997 the first case of spread from a<br />
bird to a human was seen during an outbreak of bird flu in poultry in Hong Kong causing severe<br />
respiratory illness in 12 people and six deaths. Since that time, there have been human cases of<br />
H5N1 infection occurring in Thailand, Vietnam and Cambodia during large H5N1 outbreaks in<br />
poultry. H5N1 has a human mortality rate of 50 percent.<br />
11.13.5 NATURALLY OCCURRING OUTBREAKS<br />
Hantavirus Pulmonary Syndrome: Although present in the U.S. since 1959, it was not until 1993<br />
when an outbreak occurred in the southwest U.S. after heavy rains created an overpopulation of<br />
rodents. Between May 1993 and July 6, 2005, a total of 396 cases (14 in <strong>Kansas</strong>) of hantavirus<br />
pulmonary syndrome have been reported in the United States. Thirty-six percent of all reported<br />
cases have resulted in death.<br />
Monkeypox: A rare viral disease that occurs mostly in central and western Africa first found in 1958<br />
in laboratory monkeys and later found in African squirrels, rats, mice, and rabbits. Monkeypox was<br />
reported in humans <strong>for</strong> the first time in 1970, and a multi-state outbreak occurred in the United States<br />
(including one in <strong>Kansas</strong>) in July 2003 infecting 71 people after importation of small mammals to<br />
Texas from Ghana. The mortality rate is estimated between one and ten percent of those infected.<br />
11.13.6 BIOLOGICAL WEAPON POTENTIAL<br />
Diseases potentially used as biological weapons:<br />
This type of usage includes any infectious agents or toxic chemical that could in theory be engineered <strong>for</strong><br />
deliberate use as a weapon. Experts in this field believe that anthrax, botulism, plague, smallpox, tularemia,<br />
and viral hemorrhagic fever are the pathogens most likely to be used.<br />
Anthrax: Grazing livestock can become infected by anthrax spores in the soil, and humans can<br />
contract the disease by handling products (cutaneous transmission) from infected animals, by<br />
breathing (inhalation transmission) anthrax spores from infected animal products (i.e. wool from<br />
sheep), or eating (digestive transmission) undercooked meat from infected animals. In the United<br />
States, 22 cases of anthrax infection were reported from a higher grade <strong>for</strong>m of anthrax and<br />
delivered through the mail system to intentionally contaminate individuals <strong>for</strong> terrorist purposes.<br />
Botulism: There are three main kinds of botulism: foodborne botulism is caused by eating foods that<br />
contain the botulism toxin; wound botulism is caused by toxin produced from a wound infected with<br />
Clostridium botulinum; and, infant botulism is caused by consuming the spores of the botulinum<br />
bacteria, which then grow in the intestines and release toxin. In the United States an average of 110<br />
cases of botulism are reported each year of which 25% are foodborne and 72% are infant botulism.<br />
282
<strong>2010</strong>-<strong>2040</strong> <strong>HAZARDS</strong> <strong>ANALYSIS</strong> <strong>PLAN</strong><br />
Regulatory<br />
Plague: Plague is an infectious disease of animals and humans caused by a bacterium named<br />
Yersinia pestis. Fleas feeding on infected animals transmit the disease to humans and mammals.<br />
The disease can also be transmitted through handling infected animals or exposure to persons or<br />
animals with plague pneumonia and cough. Human plague in the United States has occurred as<br />
mostly scattered cases in rural areas (an average of 5 to 15 persons each year). About 14% (1 in 7)<br />
of all plague cases in the United States are fatal.<br />
Smallpox: Smallpox is a serious, contagious, and sometimes fatal infectious disease. The last case<br />
of smallpox in the United States was in 1949. The last naturally occurring case in the world was in<br />
Somalia in 1977. Smallpox also can be spread through direct contact with infected bodily fluids,<br />
direct and fairly prolonged face-to-face contact, or contaminated objects such as bedding or clothing.<br />
Tularemia: Tularemia is one of the most infectious pathogenic bacteria known that occurs naturally<br />
in the United States and is caused by the bacterium Francisella tularensis which is especially found<br />
in rodents, rabbits, and hares. Humans can become infected through diverse environmental<br />
exposures to include bites by infected arthropods; handling infectious animal tissues or fluids; direct<br />
contact with or ingestion of contaminated food, water, or soil; and inhalation of infective aerosols. It<br />
is. Between 1985 and 1992, 1409 cases and 20 deaths were reported in the U.S., a case fatality<br />
rate of 1.4%.<br />
Viral Hemorrhagic Fever: Generally, this group of illnesses cause severe multisystem syndrome<br />
(multiple organ systems in the body are affected), the overall vascular system is damaged, and the<br />
body's ability to regulate itself is impaired. For the most part, rodents and arthropods are the main<br />
reservoirs <strong>for</strong> the viruses. This includes Argentine hemorrhagic fever, Bolivian hemorrhagic fever,<br />
Sabia-associated hemorrhagic fever, Venezuelan hemorrhagic fever, Lassa fever, Lymphocytic<br />
choriomeningitis (LCM), Crimean-Congo hemorrhagic fever (CCHF), Hantavirus Pulmonary<br />
Syndrome (HPS), hemorrhagic fever with renal syndrome (HFRS), Rift Valley fever, Ebola<br />
hemorrhagic fever, Marburg hemorrhagic fever, Kyasanur Forest disease, Omsk hemorrhagic fever,<br />
tick-borne encephalitis, Hendra virus disease, and Nipah virus encephalitis.<br />
There are numerous health plans in effect; medical quarantine procedures by local area hospitals, and<br />
inoculations are required of school-aged children.<br />
Hazard Severity Ratings<br />
The following rating table indicates the probability of an emerging public health threat event occurring at least<br />
once every 25 years, impacting less than 25% of the land, resulting in minor injuries and/or illnesses.<br />
Catastrophic Event<br />
EMERGING PUBLIC HEALTH THREAT HAZARD EVENT RATING TABLE<br />
Consequence Probable Rating Catastrophic Rating<br />
Area Impacted 1 4<br />
Probability 4 0<br />
Health & Safety 1 4<br />
Property 0 0<br />
Environment 0 0<br />
Economic 0 2<br />
Total Ratings 6 10<br />
A catastrophic worst-case event could result in quarantines resulting from an H5N1 type<br />
pandemic influenza impact to <strong>Sedgwick</strong> <strong>County</strong>.<br />
283
<strong>2010</strong>-<strong>2040</strong> <strong>HAZARDS</strong> <strong>ANALYSIS</strong> <strong>PLAN</strong><br />
11.14 UTILITIES<br />
Definition: Utilities can be defined as a public service that provides power, heat and water. Forms of<br />
energy and planning <strong>for</strong> use in <strong>Sedgwick</strong> <strong>County</strong> are nuclear, electric, gas, solar, wind and petroleum base<br />
fuels.<br />
11.14.1 ELECTRIC<br />
Contact with a Westar official established that their records typically indicate that several times per year<br />
small areas in <strong>Sedgwick</strong> <strong>County</strong> have resulted in a power outage with on-line capabilities within hours to<br />
several days depending on the extent of damage to utilities. These outages are significant enough to call all<br />
available crews to duty <strong>for</strong> more than a 24-hour period. Causes of the power failures are largely due to high<br />
winds that damage power lines. Lightning, ice storms, and heavy rain or snowstorms have also contributed<br />
to the cause of power outages. Rural electric companies such as Butler Rural Electric Cooperative are more<br />
susceptible to long duration outages due to population density over a large area resulting in longer electric<br />
power transfer or switching time. Natural gas and electric companies have internal dispatch centers to<br />
maintain service.<br />
11.14.2 PIPELINES<br />
The U.S. Department of Transportation’s Office of Pipeline Safety average and summary statistics <strong>for</strong><br />
hazardous liquid and distribution/transmission of natural gas were reviewed <strong>for</strong> determining commodity type,<br />
cause, and numbers of pipeline incidents. The only pipeline incident in the south-central <strong>Kansas</strong> area was<br />
reported in 2000 at Winfield, <strong>Kansas</strong>.<br />
All of the pipeline companies routinely do fly over inspections of the entire pipeline systems <strong>for</strong> visual<br />
indications of leakages or damage to the pipelines. Electronic monitoring equipment continually monitors<br />
pressure changes within the pipelines to aid in leak or breach detections. ConocoPhillips also has aquatic<br />
response capability <strong>for</strong> the pipeline located at El Dorado Lake.<br />
ABENGOA BIOENERGY<br />
Methane wells located within the <strong>for</strong>mer Brooks landfill site are siphoned off to an<br />
underground pipeline which proceeds to the Abengoa Bioenergy Colwich plant <strong>for</strong> ethanol<br />
processing. The plant is one of three operational plants fully owned by Abengoa Bioenergy<br />
Corporation in North America. manufacturers approximately 25 million gallons of ethanol<br />
from grain annually.<br />
Regulatory<br />
AIR PRODUCTS & CHEMICALS INC<br />
Air Products operates a hydrogen transmission pipeline in <strong>Sedgwick</strong> <strong>County</strong> near the Air<br />
Products & Chemicals plan west of Haysville.<br />
The <strong>Kansas</strong> Corporation Commission protects the public interest through impartial and efficient resolution of<br />
all jurisdictional issues. The agency regulates rates, service and safety of public utilities, common carriers,<br />
motor carriers, and regulates oil and gas production by protecting correlative rights and environmental<br />
resources.<br />
Hazard Severity Ratings<br />
The following rating table indicates the probability of an emerging public health threat event occurring at least<br />
once every 25 years, impacting less than 25% of the land, resulting in minor injuries and/or illnesses.<br />
284
<strong>2010</strong>-<strong>2040</strong> <strong>HAZARDS</strong> <strong>ANALYSIS</strong> <strong>PLAN</strong><br />
Consequence<br />
UTILITIES HAZARD EVENT RATING TABLE<br />
Probable<br />
Rating<br />
Catastrophic<br />
Rating<br />
Area Impacted 1 4<br />
Probability 4 0<br />
Health & Safety 1 3<br />
Property 0 0<br />
Environment 0 0<br />
Economic 0 2<br />
Total Ratings 6 9<br />
Catastrophic Event<br />
A catastrophic worst-case event would be loss of electrical power at peak summer or winter<br />
months where restoration may take days.<br />
285
<strong>2010</strong>-<strong>2040</strong> <strong>HAZARDS</strong> <strong>ANALYSIS</strong> <strong>PLAN</strong><br />
11.15 TRANSPORTATION ACCIDENTS<br />
Definition: Transportation accidents can be all modes of travel in and around the community.<br />
Major highway transportation routes in <strong>Sedgwick</strong> <strong>County</strong> include: I-35, I-135, I-235, and U.S. 54/U.S. 400,<br />
and K-96. Railroads in <strong>Sedgwick</strong> <strong>County</strong> include the Burlington, Northern and Santa Fe (BNSF); <strong>Kansas</strong><br />
and Oklahoma (K&O); the Union Pacific; and, the Wichita Terminal Association. Airports in <strong>Sedgwick</strong><br />
<strong>County</strong> average approximately 900 flights per day and include: Mid-Continent, Beech, Cessna, Colonel<br />
James Jabara, Riverside, Westport, Cook, Hamilton, and Maize. There are an average of three motor carrier<br />
accidents annually, two accidents per year involving railroads, and less than two accidents per year <strong>for</strong><br />
aircraft. Notable accidents that have occurred in <strong>Sedgwick</strong> <strong>County</strong> are as follows:<br />
Regulatory<br />
A motor carrier incident occurred on March 22, 1979 when a semi-trailer overturned at the I-235<br />
overpass near the Meridian Street exit containing refined uranium 235 ―Yellow Cake‖ (uranium oxide)<br />
LSA drums. Several drums were breached and radioactivity was detected on the ground requiring<br />
over excavating of topsoil.<br />
A BNSF train derailment occurred August 30, 2001 near the intersection of Greenwich & 103 rd Street<br />
South in <strong>Sedgwick</strong> <strong>County</strong>. Several railcars were on fire with the following chemicals: carbon<br />
dioxide (2 cylinders of 12 kilograms each), nitrogen (one cylinder of 0.75 kilogram), perfume products<br />
(1,358 pounds), white asbestos (44,782 pounds plus 1,020 pounds of intermodal), plastics & FAK,<br />
and sodium hydroxide. Evacuation was at one-mile from site with two reported injuries.<br />
A KC-135R military tanker crashed after take-off near north 20 th Street and Piatt in east Wichita on<br />
January 16, 1965 resulting in over 20 homes destroyed and 23 people killed. The tanker contained<br />
over 240,000 pounds of jet fuel prior to impact.<br />
The respective carriers and haulers maintain transportation safety regulations.<br />
Hazard Severity Ratings<br />
The following rating table indicates the probability of an emerging public health threat event occurring<br />
annually and impacting less than 25% of the area.<br />
Catastrophic Event<br />
TRANSPORTATION HAZARD EVENT RATING TABLE<br />
Consequence<br />
Probable<br />
Rating<br />
286<br />
Catastrophic<br />
Rating<br />
Area Impacted 1 1<br />
Probability 4 0<br />
Health & Safety 0 4<br />
Property 0 3<br />
Environment 0 2<br />
Economic 0 2<br />
Total Ratings 5 12<br />
A worst-case scenario would be one involving a release of chemicals passing across the most populated<br />
areas of the <strong>County</strong>. The magnitude of a catastrophic event would be comparable to the 2001 BNSF train<br />
derailment in a populated area.
<strong>2010</strong>-<strong>2040</strong> <strong>HAZARDS</strong> <strong>ANALYSIS</strong> <strong>PLAN</strong><br />
11.16 CIVIL DISTURBANCES<br />
Definition: Civil disturbances can be riots, protests, demonstrations, bomb threats, and any <strong>for</strong>m resulting in<br />
terrorism.<br />
The following civil disturbances are the most notable that have occurred in <strong>Sedgwick</strong> <strong>County</strong> since 1958:<br />
A three-week sit-in protest in Wichita in August 1958 involving African-Americans protesting local<br />
racial segregation laws by banding together to demand service, often at whites-only lunch counters,<br />
and refusing to leave until served.<br />
In August 1976, 19 year old Michael Soles had positioned himself in the southwest area on top of the<br />
26-story Holiday Inn plaza and started shooting into crowds below on the city streets, killing two and<br />
injuring seven.<br />
In April 1979, a riot erupted at Herman Hill Park between police and concert goers that initially<br />
started as police ordering people to remove their cars from the grass.<br />
Racial tensions building between the minority community and the police department erupted in<br />
violence in April 1980 along the 21st Street corridor between Grove and Hillside.<br />
Operation Rescue conducted its ―Summer of Mercy‖ anti-abortion protest in July 1991 resulting in sit<br />
downs, blockading and storming the Women's Health Care Services Clinic (<strong>for</strong>merly Wichita Family<br />
Planning) in 1991 resulting in 13 arrests.<br />
11.16.1 HATE GROUPS<br />
According to in<strong>for</strong>mation provided by the Southern Poverty Law Center, some of the nationally recognized<br />
hate groups that are present in <strong>Sedgwick</strong> <strong>County</strong> are Midland Hammerskins 1 (racist skinheads), the National<br />
Socialist Movement 2 (neo-Nazi), and the Imperial Klans of America Knights of the Ku Klux Klan 3 . The most<br />
recent incident in <strong>Sedgwick</strong> <strong>County</strong> occurred at Derby in August 2003 where a cross was burned on the front<br />
yard of a Hispanic family's residence and a brick with a racial message written on it was thrown through one<br />
of the windows. Westboro Baptist Church (WBC) has conducted nationwide protests.<br />
Racist Skinheads <strong>for</strong>m a particularly violent element of the white supremacist<br />
movement, and have often been referred to as the "shock troops" of the hoped-<strong>for</strong><br />
revolution. The classic Skinhead look is a shaved head, black Doc Martens boots, jeans<br />
with suspenders and an array of typically racist tattoos.<br />
Neo-Nazi groups share a hatred <strong>for</strong> Jews and a love <strong>for</strong> Adolf Hitler and Nazi<br />
Germany. While they also hate other minorities, homosexuals and even sometimes<br />
Christians, they perceive "the Jew" as their cardinal enemy, and trace social problems<br />
to a Jewish conspiracy that supposedly controls governments, financial institutions and<br />
the media. While some neo-Nazi groups emphasize simple hatred, others are more<br />
focused on the revolutionary creation of a fascist political state.<br />
The Ku Klux Klan, with its mystique and its long history of violence, is the most<br />
infamous -- and oldest -- of American hate groups. Although blacks have typically been<br />
the Klan's primary target, it also has attacked Jews, immigrants, homosexuals and,<br />
until recently, Catholics.<br />
Incorporated in 1967 as a not-<strong>for</strong>-profit organization, WBC considers itself an ―Old<br />
School (or Primitive)‖ Baptist Church. WBC’s leader is Fred Phelps and several of his<br />
children and dozens of his grandchildren appear to constitute the majority of the<br />
group’s members. Protests include anti-Semitic, anti-gay, schools and churches<br />
perceived to be pro-gay, veteran funerals, etc.<br />
287
<strong>2010</strong>-<strong>2040</strong> <strong>HAZARDS</strong> <strong>ANALYSIS</strong> <strong>PLAN</strong><br />
11.16.2 GANGS<br />
According to Wichita Police Department statistics, there are at least 62 gang sets in the Wichita area and<br />
2,986 documented gang members of which 1,717 members are active with 772 associates. On average 350<br />
are incarcerated annually and 71 were deceased. The average age of active and associate gang members<br />
is 20.6 years. Drive-by shootings have decreased from a high of 241 in 1993 to 38 by 2009 (28 gang<br />
related). The following gangs have been identified by Wichita Police as active, and are broken down<br />
according to race:<br />
AFRICAN AMERICAN GANGS<br />
CRIPS<br />
Neighborhood Crips<br />
North Side Crips<br />
357 Clown Crips<br />
Hoover 107 Crips<br />
Insane Crips<br />
Pretty Boy Gangster Crips<br />
BLOODS<br />
Lincoln Park Bloods<br />
Piru Bloods<br />
Inglewood Family Gangsters<br />
Original Wichita Villains<br />
Bounty Hunter Bloods<br />
Family Bloods<br />
FOLKS<br />
Black Gangster Disciples<br />
Gangster Disciples<br />
Tru Boys<br />
LOCAL<br />
Ask Park Gangsters<br />
Junior Boys<br />
2 nd Street<br />
Hill Block<br />
Original Mafia Gangsters<br />
Young Bucks<br />
Two Thirds/Lost Boy Gangsters<br />
HISPANIC GANGS<br />
Vato Loco Boys<br />
Spanish Disciples<br />
Junior Loco Boys<br />
Mara Salvatrucha (MS-13)<br />
Playboy Locos<br />
Florencia 13 (FL 13) – Surenos<br />
Banditos (BDS) – Surenos<br />
Kids of Destruction<br />
Latin Kings<br />
Latin Queens<br />
Northside Gangsters<br />
Players <strong>for</strong> Life<br />
Meadow Creek Gangsters<br />
Jackson Street Gangsters<br />
WHITE GANGS<br />
River City Skin Heads<br />
Aryan Brotherhood<br />
8-Ball Kings<br />
Insane Clown Posse<br />
Mix with other race gangs:<br />
Dark Side Bloods<br />
Gangster Disciples<br />
2 nd Street<br />
Insane Crips<br />
Delano Mafia Gangsters<br />
ASIAN GANGS<br />
Asian Pride<br />
Asian Boyz<br />
Buc Lao Killers<br />
Lao Boy Crips<br />
Oriental Lazy Boyz<br />
Viet Boyz<br />
Dead Everlasting Gangsters<br />
Flat Line<br />
Oriental Killer Boyz<br />
West Side Jones Boys<br />
Kai Bang<br />
Young Oriental Gangsters<br />
Little Saigon Hoodlums<br />
Cold Blooded Cambodians<br />
Krazy Boyz<br />
Oriental Troops<br />
Oriental Boy Soldiers<br />
288
<strong>2010</strong>-<strong>2040</strong> <strong>HAZARDS</strong> <strong>ANALYSIS</strong> <strong>PLAN</strong><br />
11.16.3 ACTIVIST GROUPS<br />
ANONYMOUS 45<br />
An international hacking group, spread through the Internet, initiating active civil disobedience, while<br />
attempting to maintain anonymity. Originating in 2003, the term refers to the concept of many online<br />
community users simultaneously existing as an anarchic, chaotic, global brain. It is also generally considered<br />
to be a blanket term <strong>for</strong> members of certain Internet subcultures, a way to refer to the actions of people in an<br />
environment where their actual identities are not known. Beginning with 2008, the Anonymous collective has<br />
become increasingly associated with collaborative, international hacktivism, undertaking protests and other<br />
actions, often with the goal of promoting internet freedom and freedom of speech. The following are recent<br />
examples of criminal DDOS attacks against companies:<br />
In December <strong>2010</strong>, the Dutch police arrested a 16-year old <strong>for</strong> cyber attacks against Visa,<br />
MasterCard and PayPal.<br />
In January 2011, the FBI issued more than 40 search warrants in a probe against the Anonymous<br />
attacks on companies that did not explicitly support Wikileaks.<br />
In January 2011, the British police arrested five boys and men between the ages of 15 and 26.<br />
On June 10, 2011 the Spanish police captured three purported members of Anonymous in the cities<br />
of Gijon, Barcelona and Valencia. This particular group had made attacks on the web servers of the<br />
Playstation store, BBVA, Bankia, and the websites of the governments of Egypt, Algeria, Libya, Iran,<br />
Chile, Colombia and New Zealand.<br />
During Operation Avenge Assange in July <strong>2010</strong>, more than 20 arrests were made of suspected<br />
Anonymous hackers in the U.S., U.K., and the Netherlands.<br />
OCCUPY MOVEMENT 46<br />
The Occupy movement is an international protest movement which is primarily directed against economic<br />
and social inequality. The first Occupy protests to be widely covered were ―Occupy Wall Street‖ in New York<br />
City and ―Occupy San Francisco‖, both taking place on September 17, 2011. By October 9, Occupy protests<br />
had taken place or were ongoing in over 95 cities across 82 countries, and over 600 communities in the<br />
United States. The movement was initiated by the Canadian activist group Adbusters, and partly inspired by<br />
the Arab Spring, especially Cairo's Tahrir Square protests, and the Spanish Indignants. The protests have<br />
focused on social and economic inequality, high unemployment, greed and corruption, and the undue<br />
influence of corporations—particularly that of the financial services sector—on government, and the<br />
movement commonly uses the slogan ―We are the 99%.‖<br />
SOVEREIGN CITIZENS 47<br />
The "sovereign citizen" movement is a loosely organized collection of groups and individuals who have<br />
adopted a right-wing anarchist ideology originating in the theories of a group called the Posse Comitatus in<br />
the 1970s. Its adherents believe that virtually all existing government in the United States is illegitimate and<br />
they seek to "restore" an idealized, minimalist government that never actually existed. To this end, sovereign<br />
citizens wage war against the government and other <strong>for</strong>ms of authority using "paper terrorism" harassment<br />
and intimidation tactics, and occasionally resorting to violence. Notable actions taken by the movement<br />
include the 1996 Montana Freeman standoff; 1997 Republic of Texas standoff Tactics "Paper terrorism,"<br />
including frivolous lawsuits, frivolous liens, fictitious financial instruments, fictitious automobile-related<br />
documents, and misuse of genuine documents such as IRS <strong>for</strong>ms; various frauds and scams. In April <strong>2010</strong>,<br />
a sovereign citizen group calling itself Guardians of the Free Republics issued ultimatums to all 50 governors<br />
to vacate their offices within 72 hours. On May 20, <strong>2010</strong>, two West Memphis, Arkansas, police officers were<br />
killed and two Crittenden <strong>County</strong> sheriff’s officers wounded in two linked shootouts involving an antigovernment<br />
sovereign citizen with ties to Ohio and Florida.<br />
45 Wikipedia<br />
46 Wikipedia<br />
47 Anti Defamation League<br />
289
<strong>2010</strong>-<strong>2040</strong> <strong>HAZARDS</strong> <strong>ANALYSIS</strong> <strong>PLAN</strong><br />
PEOPLE FOR THE ETHICAL TREATMENT OF ANIMALS (PETA) 48<br />
Founded in 1980, PETA is the largest animal rights organization in the world, with more than 3 million<br />
members and supporters based in Norfolk, Virginia. PETA focuses its attention on the four areas in which<br />
the largest numbers of animals suffer the most intensely <strong>for</strong> the longest periods of time: on factory farms, in<br />
the clothing trade, in laboratories, and in the entertainment industry. We also work on a variety of other<br />
issues, including the cruel killing of beavers, birds, and other "pests" as well as cruelty to domesticated<br />
animals. PETA works through public education, cruelty investigations, research, animal rescue, legislation,<br />
special events, celebrity involvement, and protest campaigns.<br />
ANIMAL LIBERATION FRONT (ALF) 49<br />
Founded in 1976, ALF is an international, underground leaderless resistance that engages in illegal direct<br />
action in pursuit of animal liberation. Activists see themselves as a modern-day ―Underground Railroad‖,<br />
removing animals from laboratories and farms, destroying facilities, arranging safe houses and veterinary<br />
care, and operating sanctuaries where the animals live out the rest of their lives. ALF has used violence (i.e.<br />
bombings and arson) to further their cause. Between 1996 and 2002, the Animal Liberation Front (ALF) and<br />
the Earth Liberation Front (ELF) had committed more than 600 criminal acts since 1996 that resulted in a<br />
minimum of $43 million in damage. 50<br />
EARTH LIBERATION FRONT (ELF) 51<br />
Founded in 1977 as the Environmental Life Force, ELF’s first ―commando style‖ attack was an attempt to<br />
place fire bombs on seven crop dusters. ELF would have no central leadership or chain of command with<br />
each cell intended to be autonomous. Today's ELF, Earth Liberation Front, came into being around 1992<br />
and rejoined the battle to protect Earth by using the same tactics employed by the original ELF fifteen years<br />
earlier. Members who ―have served or are serving their prison sentences honorably (without snitching), can<br />
make official comments and speak as a legitimate ELF spokesperson. Prison validates an ELF<br />
spokesperson's credentials.‖<br />
11.16.4 TERRORISM<br />
There is no single, universally accepted, definition of terrorism. Terrorism is defined in the Code of Federal<br />
Regulations as ―the unlawful use of <strong>for</strong>ce and violence against persons or property to intimidate or coerce a<br />
government, the civilian population, or any segment thereof, in furtherance of political or social objectives‖<br />
(28 C.F.R. Section 0.85).<br />
The FBI describes terrorism as either domestic or international, depending on the origin, base, and<br />
objectives of the terrorist organization. For purposes of clarification, the FBI uses following definitions:<br />
Domestic terrorism is the unlawful use, or threatened use, of <strong>for</strong>ce or violence by a group or<br />
individual based and operating entirely within the United States or Puerto Rico without <strong>for</strong>eign<br />
direction committed against persons or property to intimidate or coerce a government, the civilian<br />
population, or any segment thereof in furtherance of political or social objectives.<br />
International terrorism involves violent acts or acts dangerous to human life that are a violation of the<br />
criminal laws of the United States or any state, or that would be a criminal violation if committed<br />
within the jurisdiction of the United States or any state. These acts appear to be intended to<br />
intimidate or coerce a civilian population, influence the policy of a government by intimidation or<br />
coercion, or affect the conduct of a government by assassination or kidnapping. International terrorist<br />
acts occur outside the United States or transcend national boundaries in terms of the means by<br />
which they are accomplished, the persons they appear intended to coerce or intimidate, or the locale<br />
in which their perpetrators operate or seek asylum.<br />
48 PETA Website<br />
49 Wikipedia<br />
50 Southern Poverty Law Center/FBI<br />
51 ELF Website<br />
290
<strong>2010</strong>-<strong>2040</strong> <strong>HAZARDS</strong> <strong>ANALYSIS</strong> <strong>PLAN</strong><br />
The FBI Divides Terrorist-Related Activities into Two Categories:<br />
A terrorist incident is a violent act or an act dangerous to human life, in violation of the criminal laws<br />
of the United States, or of any state, to intimidate or coerce a government, the civilian population, or<br />
any segment thereof, in furtherance of political or social objectives.<br />
A terrorism prevention is a documented instance in which a violent act by a known or suspected<br />
terrorist group or individual with the means and a proven propensity <strong>for</strong> violence is successfully<br />
interdicted through investigative activity.<br />
A chronological summary of 204 terrorist incidents (excludes 111 in Puerto Rico) between 1980 and 2005, recorded in<br />
the FBI’s Terrorism/Terrorism in the United States series, has been extrapolated and shown below:<br />
The following local event is classified as an attempted attack related to international terrorism by an extremist<br />
group:<br />
<strong>Kansas</strong> Letter Bomb, Leavenworth KS<br />
On January 3, 1997 – Three letter bombs disguised as holiday cards and postmarked from<br />
Alexandria, Egypt were discovered by a postal worker outside the Leavenworth penitentiary and<br />
were addressed to a parole officer at the prison. At the time Leavenworth’s inmate population<br />
included Mohammed Salameh who was one of four people convicted in the 1993 World Trade<br />
Center bombing. The letter bombs were believed to have been tied to the five letter bombs<br />
discovered a day earlier in Washington DC.<br />
The following national events are some of the successful and attempted attacks that have occurred in the<br />
U.S. which are classified as terrorism.<br />
World Trade Center, New York City NY (1993)<br />
Islamic extremist groups (including the Islamic Jihad, Hamas and Sudanese National Islamic Front)<br />
gathered materials <strong>for</strong> approximately two months prior to the February 26 bombing. They resided in<br />
New Jersey and apparently rented storage space that was used as a staging area <strong>for</strong> the bomb and<br />
subsequent loading of it into a Ryder rental van. The terrorists drove the 1,500-pound urea-nitrate<br />
bomb into the basement parking area of the World Trade Center’s North Tower and then set the<br />
timer and left. It was intended to knock the North Tower (Tower One) into the South Tower (Tower<br />
Two), bringing both towers down and killing thousands of people. However, at 12:17PM Ramzi<br />
Yousef detonated the explosive and blast opened a 100 foot (30 m) hole through five sublevels with<br />
291
<strong>2010</strong>-<strong>2040</strong> <strong>HAZARDS</strong> <strong>ANALYSIS</strong> <strong>PLAN</strong><br />
the greatest damage occurring on levels B1 and B2 and significant structural damage on level B3 of<br />
the North Tower killing six people and injuring 1,042 others.<br />
Alfred P. Murrah Federal Building, Oklahoma City OK (1995)<br />
Timothy McVeigh, U.S. Army veteran and militia movement sympathizer, chose to bomb the Murrah<br />
building in retaliation <strong>for</strong> the government actions of the Waco Siege (which happened exactly two<br />
years prior in 1993) and the siege at Ruby Ridge. The building was approximately 75 feet wide, 318<br />
feet long and nine stories tall and occupied the block bordered by NW 4th and 5th Streets between<br />
Robinson and Harvey Avenues. The building contained regional offices <strong>for</strong> the Social Security<br />
Administration, the Drug En<strong>for</strong>cement Administration (DEA), and the Bureau of Alcohol, Tobacco,<br />
and Firearms (ATF). The building also contained recruiting offices <strong>for</strong> both the U.S. Army and the<br />
U.S. Marine Corps. The building housed approximately 550 employees and a daycare center. At<br />
9:02 a.m. on April 19, a Ryder rental truck, containing approximately 5,000 pounds (2,300 kg) of<br />
ammonium nitrate fertilizer, nitromethane, and diesel fuel was parked along NW 5th Street between<br />
the building and the street in a loading zone located in front of the building’s north entrance and<br />
detonated. The blast destroyed a third of the building and caused severe damage to several other<br />
buildings located nearby. As a result of the explosion, 168 people were killed, including 19 children,<br />
and over 800 others were injured. Two individuals killed were in the Oklahoma Water Resources<br />
Building, one person was in the Athenian Building, one person was outside the building near the<br />
blast and a nurse who lost her life in the rescue ef<strong>for</strong>ts. Rescue and recovery ef<strong>for</strong>ts were concluded<br />
at 11:50 p.m. on May 4, with the bodies of all but three victims recovered.<br />
Centennial, Olympic Park, Atlanta GA (1996)<br />
The park was designed as the "town square" of the Olympics, and thousands of spectators had<br />
gathered <strong>for</strong> a late concert by the band Jack Mack and the Heart Attack. Eric Robert Rudolf planted<br />
a green U.S. military ALICE pack (field pack) containing a steel plate as a directional device, three<br />
pipe bombs weighing in excess of 40 pounds, and nitroglycerin surrounded by nails underneath a<br />
bench near the base of a concert sound tower. He then left the pack but at some point was tipped<br />
over and helped minimize the blast area. A security guard, discovering the bag and reporting it to<br />
the Georgia Bureau of Investigation, began clearing the immediate area be<strong>for</strong>e the bomb exploded<br />
at 1:20 a.m. on July 27 th . The bomb killed one and wounded 111 others. Turkish cameraman Melih<br />
Uzunyol died from a heart attack he suffered while running to cover the blast<br />
Columbine High School, Columbine CO (1999)<br />
Starting in 1996, both Eric Harris and Dylan Klebold were involved in video gaming and journal<br />
entries with an ever growing anger on society and later placed in diversion <strong>for</strong> theft of equipment and<br />
tools in 1998. Harris continued under a psychologist's care until a few months be<strong>for</strong>e the attack, all<br />
while he and Klebold plotted; the pair felt as if they were at war against society and needed to take<br />
action toward those they hated. Journal entries revealed that the pair had an elaborate plan <strong>for</strong> a<br />
major bombing rivaling that of Oklahoma City. Prior to the attack, they acquired two 9mm firearms<br />
and two 12-gauge shotguns, as well as building 99 improvised explosive devices of various designs<br />
and sizes. At 11:10 a.m. April 20, they arrived at Columbine High School in separate cars. After<br />
entering the cafeteria, two 20 pound (9 kg) propane bombs in bags were placed and left back to their<br />
cars. When the bombs failed to explode, they began shooting at students outside at 11:19 a.m. and<br />
proceeded to enter the school library hallway. Carbon dioxide bombs were thrown into the cafeteria<br />
area and started shooting in the library at 11:37 a.m. be<strong>for</strong>e leaving at 11:42 a.m... At 12:08p.m.,<br />
they re-entered the library and committed suicide. In the aftermath, they killed 12 students and one<br />
teacher. They also injured 21 other students directly, and three people were injured while attempting<br />
to escape. Although Harris complained of depression, anger, and suicidal thoughts at a meeting with<br />
his psychiatrist and prescribed antidepressants, it was determined he was a clinical psychopath with<br />
a messianic-level superiority complex, while Klebold was depressive.<br />
292
<strong>2010</strong>-<strong>2040</strong> <strong>HAZARDS</strong> <strong>ANALYSIS</strong> <strong>PLAN</strong><br />
World Trade Center, New York City NY (2001)<br />
World Trade Center (WTC) was a complex of seven buildings in Lower Manhattan in New York City<br />
built between 1975 and 1981 and contained 13.4 million square feet of office space. Financial/trade<br />
and communications offices were in WTC #1 (North Tower) and WTC #2 (South Tower); Marriott<br />
Hotel in WTC #3); various exchanges, Deutsche Bank and NY Board of Trade in WTC #4; financials<br />
and various offices in WTC #5; U.S. government office in WTC #6; and, financials as well as U.S.<br />
government offices and the New York City Office of Emergency Management in WTC #7. On<br />
September 11, 19 Al-Qaeda-affiliated hijackers flew two 767 jets into the complex, American Airlines<br />
Flight 11 in the North Tower at 08:46, impacting between the 93rd and 99th floors, and 17 minutes<br />
later United Airlines Flight 175 into the South Tower, impacting between the 77th and 85th floors. At<br />
9:59 a.m., the South Tower collapsed due to fire, and the North Tower collapsed at 10:28 a.m. The<br />
attacks on the World Trade Center resulted in 2,752 deaths including 343 firefighters and 60 police<br />
officers from New York City and the Port Authority. World Trade Center 7 collapsed later in the day<br />
and the other buildings, although they did not collapse, had to be demolished because they were<br />
damaged beyond repair. The process of cleanup and recovery at the World Trade Center site took<br />
eight months.<br />
Pentagon (2001)<br />
Within 30 minutes of two planes hitting the World Trade Center twin towers, American Airlines Flight<br />
77 departed Dulles International Airport bound <strong>for</strong> Los Angeles. The Boeing 757 was hijacked and<br />
crashed, loaded with 10,000 gallons of fuel, at 345 mph into the west side of the Pentagon. The<br />
plane hit the helicopter landing pad and hit the outermost ring of the Pentagon, (E Ring) midway<br />
between corridors 4 and 5. It cut a wedge through the D and C rings and stopping at the B ring. All<br />
58 passengers, four flight attendants, and both pilots on board, as well as 125 occupants of the<br />
Pentagon died in the attack.<br />
Shanksville, Pennsylvania (2001)<br />
United Airlines Flight 93, a Boeing 757-200, was hijacked around 9:28 a.m. by four al-Qaeda<br />
terrorists 46 minutes into the flight from Newark International Airport to San Francisco International<br />
Airport. Originally projected to leave at 8:01 a.m., the plane was delayed until 8:42 a.m. be<strong>for</strong>e<br />
takeoff. It is believed the pilot was overpowered and diverted toward Washington D.C. until<br />
passengers overpowered the terrorists. The plane crashed in a field in Stonycreek Township, near<br />
Shanksville, in Somerset <strong>County</strong>, Pennsylvania, about 80 miles southeast of Pittsburgh and<br />
150 miles northwest of Washington, D.C., killing all 37 passengers and seven crew members,<br />
including the four hijackers.<br />
American Airlines Flight 63 (2001) - Attempted<br />
On December 22, Islamic fundamentalist Richard Colvin Reid unsuccessfully tried to light a fuse<br />
leading into a shoe containing 100 milligrams of TATP and PETN while flying from Charles De<br />
Gaulle International Airport in Paris, France, to Miami International Airport in Miami, Florida. After<br />
being subdued in-flight, the plane was redirected to Logan International Airport in Boston,<br />
Massachusetts.<br />
West Nickel Mines School, Nickel Mines PA (2006)<br />
On October 2, Charles Carl Roberts IV (a milk truck driver who served several Amish farms in the<br />
area) backed a pickup truck up to the front of the Amish one-room schoolhouse and entered the<br />
school at approximately 10:25 a.m. EDT with a 9mm handgun, shortly after the children had returned<br />
from recess. He had the boys carry lumber, a shotgun, a stun-gun, wires, chains, nails, tools and a<br />
small bag. Also brought into the classroom was a length of wooden board with multiple sets of metal<br />
eye-hooks. The contents of the bag included a change of clothes, toilet paper, candles, and flexible<br />
plastic ties. Using wooden boards, Roberts barricaded the front door. He ordered the girls to line up<br />
against the chalkboard and allowed a pregnant woman, three parents with infants, and all remaining<br />
boys to exit the building. At approximately 11:07 a.m., Roberts began shooting the ten remaining<br />
293
<strong>2010</strong>-<strong>2040</strong> <strong>HAZARDS</strong> <strong>ANALYSIS</strong> <strong>PLAN</strong><br />
girls (aged 6-13 years). As the first Pennsylvania State trooper reached a window, the shooting<br />
abruptly stopped after Roberts had committed suicide. Five of the girls were all shot in the head at<br />
close range, with 17 or 18 shots fired in all.<br />
Fort Dix, New Jersey (2007) - Attempted<br />
On May 8, six radical extremists (Dritan Duka (age 28), Shain Duka (26) and Eljvir Duka (23) ethnic<br />
Albanians from the Republic of Macedonia; Mohamad Ibrahim Shnewer (22), Dritan Duka's brotherin-law,<br />
a Palestinian cab driver from Jordan; Serdar Tatar, born in Turkey; and, Agron Abdullahu,<br />
Albanian from Kosovo) were arrested by the FBI after attempting to murder U.S. service members.<br />
In 2006, they practiced firing semi-automatic weapons at a Pennsylvania firing range complete with<br />
video footage be<strong>for</strong>e authorities were alerted by a Circuit City store employee where the video was<br />
taken <strong>for</strong> duplication processing. The group was intending on purchasing a large number of<br />
weapons and grenade launchers from undercover FBI agents in early 2007 be<strong>for</strong>e the arrest.<br />
Virginia Polytechnic Institute, Blacksburg VA (2007)<br />
Virginia Polytechnic Institute also known as Virginia Tech is a public university that was the location<br />
of an attack by a student on faulty and students alike on April 16. Seung-Hui Cho was senior English<br />
major and diagnosed with severe anxiety disorder. Cho shot his two students around 7:15 a.m. in<br />
West Ambler Johnston Hall using a .22 caliber Walther P22 and 9mm Glock 19 be<strong>for</strong>e walking into<br />
Norris Hall two hours later with a backpack containing several chains, locks, a hammer, a knife, the<br />
two handguns, nineteen 10- and 15-round magazines, and almost 400 rounds of ammunition.<br />
During the second assault, Cho fired at least 174 rounds killing 29 more (five faculty and 24<br />
students) be<strong>for</strong>e committing suicide.<br />
Fort Hood, Killeen TX (2009)<br />
On November 5, 39-year old U.S. Army Major Nidal Malik Hasan (psychiatrist) entered his<br />
workplace, the Soldier Readiness Center, at 1:34PM where personnel receive routine medical<br />
treatment immediately prior to and on return from deployment. He started shooting armed with an<br />
FN Five-Seven handgun and .357 Magnum revolver. Over the next 10 minutes of shooting, 30<br />
people were wounded and 13 killed (12 soldiers and one civilian) of which 11 died at the scene and<br />
two died later in a hospital. Investigations showed there were 146 spent shell casings recovered<br />
inside the building, and another 68 collected outside, <strong>for</strong> a total of 214. When the shooting ended,<br />
the wounded Hasan was still carrying 177 rounds of unfired ammunition in his pockets, contained in<br />
both 20- and 30-round magazines. Note: Possible ties to Anwar al-Awlaki.<br />
Northwest Airlines Flight 253, Detroit MI (2009) - Attempted<br />
On December 25, 23-year old Umar Farouk Abdulmutallab is a Nigerian citizen who attempted to<br />
detonate plastic explosives hidden in his underwear while on board Northwest Airlines Flight 253, en<br />
route from Amsterdam to Detroit, Michigan. Reports indicate that he spent about 20 minutes in the<br />
bathroom as the flight approached Detroit, and then covered himself with a blanket after returning to<br />
his seat. Other passengers then heard popping noises, smelled a foul odor, and some saw<br />
Abdulmutallab’s trouser leg and the wall of the plane on fire. His underwear contained a six-inch<br />
(15-cm) packet of PETN explosive which was sewn in along with TAPN. He indicated that he had<br />
been directed by al Qaeda, and that he had obtained the device in Yemen. He was subsequently<br />
charged on six criminal counts, including attempted use of a weapon of mass destruction and<br />
attempted murder of 289 people. Note: Possible ties to Anwar al-Awlaki.<br />
Times Square, New York NY (<strong>2010</strong>) - Attempted<br />
On May 1, 30-year old Pakistani-born U.S. citizen Faisal Shahzad attempted to set of a vehicle<br />
borne device in Times Square. At 6:28 p.m., a video surveillance camera recorded what was<br />
believed to be the dark green Nissan S.U.V. driving west on 45th Street. Moments later, a T-shirt<br />
vendor on the sidewalk saw smoke coming out of vents near the back seat of the S.U.V. containing<br />
three canisters of propane, five-gallon cans of gasoline and consumer grade fireworks. The vendor<br />
294
<strong>2010</strong>-<strong>2040</strong> <strong>HAZARDS</strong> <strong>ANALYSIS</strong> <strong>PLAN</strong><br />
called to a mounted police officer, who smelled gunpowder when he approached the S.U.V. and<br />
called <strong>for</strong> assistance. The police began evacuating Times Square, from 43rd Street to 48th Street,<br />
and from Sixth to Eighth Avenues which was closed <strong>for</strong> much of the evening.<br />
Christmas Lighting, Portland OR (<strong>2010</strong>) - Attempted<br />
On November 26, 19-year old Mohamed Osman Mohamud, a Somali-born U.S. citizen and part-time<br />
student at Oregon State University, was arrested at 5:42 p.m., 18 minutes be<strong>for</strong>e the tree lighting<br />
was to occur, on an attempt to use a cell phone to explode a vehicle borne device loaded with six 55-<br />
gallon drums with detonation cords and plastic caps at the Christmas tree-lighting ceremony in<br />
Portland's Pioneer Courthouse Square. Unknown to Mohamud, he and undercover FBI agents<br />
traveled to a remote spot in Lincoln <strong>County</strong> on November 4 where they detonated a bomb concealed<br />
in a backpack as a trial run <strong>for</strong> the upcoming attack. The arrest was the culmination of a long-term<br />
undercover operation, during which Mohamud had been monitored <strong>for</strong> months as his alleged bomb<br />
plot developed <strong>for</strong> participating in violent jihad.<br />
Military Recruitment Center, Catonsville MD (<strong>2010</strong>) – Attempted<br />
On December 8, 19-year old Mohamed Osman Mohamud was arrested in connection with a scheme<br />
to attack an Armed Forces recruiting station in Catonsville, Maryland, with a vehicle bomb. There<br />
was no actual danger to the public as the explosives were inert and the suspect had been carefully<br />
monitored by law en<strong>for</strong>cement <strong>for</strong> months. Believing he was receiving help from a larger ring of<br />
jihadists, he communicated details of the plot, including where to park the van filled with explosives<br />
to hurt the most people, was actually provided to undercover agents.<br />
Local Resources<br />
There are over 840 commissioned officers and staff in the Wichita Police Department, over 500 personnel in<br />
the Sheriff’s department, and over 100 commissioned officers and staff in all remaining cities within<br />
<strong>Sedgwick</strong> <strong>County</strong>. Besides standard operating procedures, special event planning procedures are also<br />
used. Some of the sections administered by these departments include: adult and juvenile detention, K-9<br />
unit, exploited and missing child unit (EMCU), work release, extradition, special weapons and tactics<br />
(SWAT), and investigations.<br />
State Resources<br />
<strong>Kansas</strong> Homeland Security<br />
<strong>Kansas</strong> Homeland Security, within the Adjutant General's Department, coordinates statewide<br />
activities pertaining to the prevention of and protection from terrorist-related events. This involves all<br />
aspects of prevention/mitigation, protection/preparedness, response and recovery. <strong>Kansas</strong><br />
Homeland Security serves as a liaison between federal, state and local agencies and the private<br />
sector on matters relating to the security of <strong>Kansas</strong> and its citizens.<br />
<strong>Kansas</strong> Bureau of Investigation (KBI)<br />
The KBI is dedicated to providing professional investigative and laboratory services to criminal<br />
justice agencies, and the collection and dissemination of criminal justice in<strong>for</strong>mation to public and<br />
private agencies, <strong>for</strong> the purpose of promoting public safety and the prevention of crime in <strong>Kansas</strong>.<br />
The <strong>Kansas</strong> Threat Integration Center (KSTIC) is a component of the KBI. The In<strong>for</strong>mation<br />
Technology department consists of application developers, technical support staff and in<strong>for</strong>mation<br />
security personnel that collectively provide technology services to the KBI as well as technical and<br />
administrative support <strong>for</strong> the <strong>Kansas</strong> Criminal Justice In<strong>for</strong>mation System (KCJIS). KCJIS provides<br />
access to vital, time-sensitive in<strong>for</strong>mation from national and state criminal justice databases on a<br />
secure and reliable network. Through KCJIS criminal justice and law en<strong>for</strong>cement agencies have<br />
access to in<strong>for</strong>mation sources such as the National Crime In<strong>for</strong>mation center (NCIC) wanted<br />
persons, known gang and terrorists and stolen property files.<br />
295
<strong>2010</strong>-<strong>2040</strong> <strong>HAZARDS</strong> <strong>ANALYSIS</strong> <strong>PLAN</strong><br />
<strong>Kansas</strong> Highway Patrol – Homeland Security<br />
Homeland Security/Special Operations is assigned to the Patrol's General Headquarters, is<br />
responsible <strong>for</strong> the agency's homeland security related functions, and administers the Homeland<br />
Security Grant Program and other related grant programs. It also includes the agency's personnel<br />
assigned to Criminal Interdiction/Asset Forfeiture, the U.S. Drug En<strong>for</strong>cement Agency (DEA) Task<br />
Force, and the FBI's Joint Terrorism Task Force (JTTF).<br />
Federal Resources<br />
FBI Counterterrorism Division<br />
The FBI’s Counterterrorism Division collects, analyzes, and shares critical in<strong>for</strong>mation and<br />
intelligence with the proper authorities to combat terrorism on three fronts: 1) international terrorism<br />
operations both within the United States and in support of extraterritorial investigations; 2) domestic<br />
terrorism operations; and 3) counterterrorism relating to both international and domestic terrorism.<br />
National Counterterrorism Center (NCTC)<br />
At the NCTC, analysts from the FBI, CIA, DHS, DOD, DOE, Health and Human Services, the<br />
Nuclear Regulatory Commission, and the Capitol Police work side-by-side to analyze and confront<br />
the threats facing the U.S. and our interests. NCTC analysts produce the National Threat Bulletin <strong>for</strong><br />
the president, the Threat Matrix, and other analytic products. Its secure website, NCTC Online, is the<br />
primary dissemination system <strong>for</strong> terrorism in<strong>for</strong>mation produced by the NCTC and other<br />
counterterrorism mission partners, including international partners. The NCTC also conducts<br />
strategic operational planning.<br />
Joint Terrorism Task Force (JTTF).<br />
These task <strong>for</strong>ces combine the resources of the Bureau, the intelligence community, the military, and<br />
state and local police officers. The National Joint Terrorism Task Force, located just outside<br />
Washington, D.C., includes representatives from more than 40 agencies, including components of<br />
the Department of Homeland Security (DHS), Central Intelligence Agency (CIA), Department of<br />
Defense (DOD), and the Department of Energy (DOE).<br />
Federal Resources – Cont’d<br />
FBI Terrorist Screening Center (TSC)<br />
The TSC was established in December 2003 to create a single comprehensive database of known or<br />
suspected terrorists (both domestic and international). The TSC leverages the FBI’s law en<strong>for</strong>cement<br />
databases to provide real-time actionable intelligence to state and local law en<strong>for</strong>cement.<br />
FBI Terrorism Financing Operations Section (TFOS)<br />
The TFOS coordinates ef<strong>for</strong>ts to track and shut down terrorist financing and to exploit financial<br />
in<strong>for</strong>mation in an ef<strong>for</strong>t to identify previously unknown terrorist cells and recognize potential<br />
activity/planning. TFOS builds on the FBI’s expertise in conducting complex criminal financial<br />
investigations and long-established relationships with the financial services sector. Through this<br />
ef<strong>for</strong>t, the FBI has made tremendous progress in tracking and freezing terrorists’ assets.<br />
FBI Counterintelligence Division<br />
The FBI has the principal authority to conduct and coordinate counterintelligence investigations and<br />
operations within this country. It is the only federal agency with a mandate to investigate <strong>for</strong>eign<br />
counterintelligence cases within U.S. borders. Specially trained FBI counterintelligence experts<br />
monitor and neutralize <strong>for</strong>eign intelligence operations against the United States and investigate<br />
violations of federal laws against espionage, misuse of classified data, and other criminal matters<br />
296
<strong>2010</strong>-<strong>2040</strong> <strong>HAZARDS</strong> <strong>ANALYSIS</strong> <strong>PLAN</strong><br />
relating to national security. The counterintelligence program is also involved in international<br />
terrorism threats, weapons of mass destruction threats, and attacks on the nation’s critical<br />
infrastructures (i.e., communications, banking systems, and transportation systems).<br />
FBI Safe Streets Task Forces (SSTFs)<br />
SSFTs are dedicated to identifying, prioritizing, and targeting violent gangs. These SSTFs are<br />
comprised of more than 2,000 local, federal, and state investigators representing 653 law<br />
en<strong>for</strong>cement agencies throughout the United States.<br />
National Gang Intelligence Center (NGIC)<br />
The NGIC is a multi-agency ef<strong>for</strong>t that integrates gang-related intelligence assets from federal, state,<br />
and local law en<strong>for</strong>cement entities. It serves as a centralized intelligence resource <strong>for</strong> gang<br />
in<strong>for</strong>mation and analytical support. The NGIC is co-located with GangTECC—the Gang Targeting,<br />
En<strong>for</strong>cement, and Coordination Center—which is the national, multi-agency anti-gang task <strong>for</strong>ce<br />
created by the attorney general.<br />
Hazard Severity Ratings<br />
The following rating table indicates the probability of a civil disturbance hazard event occurring at least once<br />
every 25 years, impacting less than 25% of the land, resulting in minor injuries and/or illnesses.<br />
Catastrophic Event<br />
CIVIL DISTURBANCE HAZARD EVENT RATING TABLE<br />
Consequence<br />
Probable<br />
Rating<br />
Catastrophic<br />
Rating<br />
Area Impacted 1 2<br />
Probability 3 0<br />
Health & Safety 1 4<br />
Property 1 3<br />
Environment 1 2<br />
Economic 1 2<br />
Total Ratings 8 13<br />
A catastrophic worst-case event could result in the event of martial law had to be declared due to widespread<br />
damages from a natural disaster and resulting in looting and rioting.<br />
297
<strong>2010</strong>-<strong>2040</strong> <strong>HAZARDS</strong> <strong>ANALYSIS</strong> <strong>PLAN</strong><br />
11.17 SINKHOLES/SUBSIDENCE<br />
Definition: Sinkhole development is associated with several of the following structural and topographic<br />
conditions: Structural crests of anticlines, upland drainage divides, nearly level to gently sloping land surface,<br />
entrenched river valleys nearby, and lack of thick surficial cover. These factors in combination are thought to<br />
enhance the possibility <strong>for</strong> vertical drainage of water into highly fractured, soluble bedrock with resulting<br />
sinkhole solution. Another example of potential sinkhole development is solution mining where water is<br />
injected into a salt <strong>for</strong>mation and brine is extracted.<br />
Sinkhole development has historically occurred in the western portion of <strong>Sedgwick</strong> <strong>County</strong> where the<br />
Hutchinson Salt member extends from a thickness of 300 feet near the Kingman <strong>County</strong> line and feathering<br />
out to the western edge of the City of Wichita. Some of the sinkholes have led to the development of several<br />
lakes, most notably Cadillac Lake in northwest Wichita. Indications from studies per<strong>for</strong>med by the KGS<br />
seem to indicate sinkhole development is active in western <strong>Sedgwick</strong> <strong>County</strong> as salt brine is being carried<br />
away naturally by subsurface water erosion and brine extracts through solution mining.<br />
Trapped gases created in sinkholes as well as natural gases released from abandoned wells are an<br />
explosive hazard consideration. Surface subsidence in western <strong>Kansas</strong> is possible and geologic subsurface<br />
evaluations are of great importance prior to development on the Hutchinson Salt member.<br />
In<strong>for</strong>mation obtained from a June 22, 2006 letter from Mr. Howard Lubliner, <strong>Kansas</strong> Department of<br />
Transportation (KDOT) Road Design Engineer, the proposed Northwest Wichita Bypass (KDOT Project No.<br />
87 K-8236-01) indicates there are no sinkhole locations along the proposed alignment based on geological<br />
investigations. KDOT is unaware of any oil and gas wells that would allow an influx of water into the salt<br />
layer that could cause a sinkhole. The risk of catastrophic collapse is extremely low because of the slow<br />
nature of the salt dissolution and the structural strength of the overlying sediment is not sufficient to allow<br />
bridging of the bedrock.<br />
An active sinkhole in <strong>Sedgwick</strong> <strong>County</strong> is located near the intersection of 87 th Street South and 135 th Street<br />
West. The size of the sinkhole is generally 300 feet south of the intersection to 650 feet north of the<br />
intersection with an approximate 200-foot width. According to in<strong>for</strong>mation from <strong>Sedgwick</strong> <strong>County</strong> Public<br />
Works, the surface in this area has subsided by as much as 5.5 feet between 1980 and 2004.<br />
298
<strong>2010</strong>-<strong>2040</strong> <strong>HAZARDS</strong> <strong>ANALYSIS</strong> <strong>PLAN</strong><br />
Regulatory<br />
Since around 1955, the <strong>Kansas</strong> Department of Health and Environment (KDHE) has had requirements <strong>for</strong><br />
capping abandoned oil and gas wells; however, wells prior to 1955 may be improperly capped due.<br />
Hazard Severity Ratings<br />
The following rating table indicates the probability of a sinkhole hazard event may rarely occur, impacting<br />
less than 25% of the land, few damages to property and minor environmental damage.<br />
Catastrophic Event<br />
SINKHOLE/SUBSIDENCE HAZARD EVENT RATING TABLE<br />
Consequence Probable Rating Catastrophic Rating<br />
Area Impacted 1 1<br />
Probability 0 0<br />
Health & Safety 0 1<br />
Property 1 1<br />
Environment 1 2<br />
Economic 0 2<br />
Total Ratings 3 7<br />
A catastrophic worst-case event could result if a sinkhole developed within a city causing structural collapse<br />
of buildings and/or railroad impairment causing a hazardous materials derailment.<br />
299
<strong>2010</strong>-<strong>2040</strong> <strong>HAZARDS</strong> <strong>ANALYSIS</strong> <strong>PLAN</strong><br />
11.18 ASTEROIDS AND METEORITES<br />
Definition: The following definitions are given <strong>for</strong> meteors, meteoroids, meteorites, and asteroids:<br />
Meteor: is a bright streak of light that appears briefly in the sky and appears when a particle or chunk of<br />
metallic or stony matter called a meteoroid enters the earth's atmosphere from outer space. Meteoroids that<br />
reach the Earth are called meteorites.<br />
Meteorite: Meteorites may be stony, iron, or stony-iron composition may disintegrate if they are too small or<br />
cause a mid-air explosion be<strong>for</strong>e reaching the Earth’s surface. The largest meteorite ever found weighs<br />
about 66 short tons (60 metric tons).<br />
Asteroid: Asteroids are metallic, rocky bodies without atmospheres that orbit the Sun but are too small to be<br />
classified as planets. Asteroids with orbits that bring them within 1.3 AU (121 million miles) of the Sun are<br />
known as Earth-approaching or near-Earth asteroids (NEAs). Approximately 250 NEAs have been found to<br />
date, probably only a few percent of their total population. The largest NEA presently known is 1036<br />
Ganymed, with an approximate diameter of 25.5 miles.<br />
Near-Earth Objects (NEOs): Comets and asteroids that have been nudged by the gravitational attraction of<br />
nearby planets into orbits that allow them to enter the Earth's neighborhood. Composed mostly of water ice<br />
with embedded dust particles, comets originally <strong>for</strong>med in the cold outer planetary system while most of the<br />
rocky asteroids <strong>for</strong>med in the warmer inner solar system between the orbits of Mars and Jupiter.<br />
The following asteroids were recorded as recent near misses:<br />
March 23, 1989 – an asteroid 0.25-mile wide came within 400,000 miles of Earth.<br />
2002 – a small asteroid (2002 MN) 150–360 ft in diameter, passed within 75,000 miles of Earth<br />
The following interplanetary objects entered earth’s atmosphere:<br />
Peekskill – October 9, 1992, a 1.7 meter diameter meteor fireball was observed from Kentucky to<br />
West Virginia and covered a ground path between 700 to 800 kilometers. One H6 monomict breccia<br />
meteorite in Peekskill, New York from this event had a mass of 27 pounds.<br />
Pennsylvania – On July 23 rd , 2001, a small asteroid or piece of comet was observed as a fireball<br />
brighter than a full moon over several states to include Maryland, New York and New Jersey the<br />
fireball was moving on an east-west trajectory that carried it directly over the state of Pennsylvania.<br />
"It was traveling perhaps 15 km/s (34,000 mph) or faster when it exploded in the atmosphere with<br />
the <strong>for</strong>ce of about 3 kilotons of TNT," says Bill Cooke, a member of the Space Environments team at<br />
the Marshall Space Flight Center. If this was a rocky asteroid, then it probably measured between 1<br />
and 2 meters across and weighed 30 or so metric tons. "The pressure wave from the airburst<br />
shattered some windows in towns west of Williamsport," Cooke continued. "Breaking glass requires<br />
an overpressure of about 5 millibars (0.5 kPa), which means that those homes were within 100 km of<br />
the explosion."<br />
Indonesia – On October 8 th , 2009, a 10 meter wide asteroid exploded with an estimated yield of<br />
about 50 kilotons at 3:00 Greenwich time. According to NASA, a fireball event of this magnitude<br />
occurs about once every 2 to 12 years on average. As a rule, the most common types of stony<br />
asteroids would not be expected to cause ground damage unless their diameters were about 25<br />
meters in diameter or larger.<br />
Salt Lake City, Utah – On November 18 th , 2009, a bolide meteor not part of the Leonid debris stream<br />
exploded over Utah after midnight (MST) and was observed as far away as Los Angeles and Las<br />
Vegas with an estimated yield of up to one kiloton.<br />
Eastern Slovakia – On March 2, <strong>2010</strong>, a meteor estimated to be 0.5 to one meter in diameter was<br />
observed around 11:30 at night at an altitude of 30 kilometers and exploded causing a loud<br />
explosion followed by a shock wave.<br />
Chicago, Illinois – On April 14 th , <strong>2010</strong>, during a Gamma Virginids event a meteor was observed after<br />
10PM (CST) causing numerous sightings over several states and causing sonic booms in Iowa’s<br />
Quad City area be<strong>for</strong>e reaching the horizon and breaking apart.<br />
300
<strong>2010</strong>-<strong>2040</strong> <strong>HAZARDS</strong> <strong>ANALYSIS</strong> <strong>PLAN</strong><br />
On a daily basis, about one hundred tons of interplanetary material drifts down to the Earth's surface. Most of<br />
the smallest interplanetary particles that reach the Earth's surface are the tiny dust particles that are released<br />
by comets as their ices vaporize in the solar neighborhood. The vast majority of the larger interplanetary<br />
material that reaches the Earth's surface originates as the collision fragments of asteroids that have run into<br />
one another some eons ago.<br />
With an average interval of about 100 years, rocky or iron asteroids larger than about 50 meters would be<br />
expected to reach the Earth's surface and cause local disasters or produce the tidal waves that can inundate<br />
low lying coastal areas. On an average of every few hundred thousand years or so, asteroids larger than a<br />
kilometer could cause global disasters. In this case, the impact debris would spread throughout the Earth's<br />
atmosphere so that plant life would suffer from acid rain, partial blocking of sunlight, and from the firestorms<br />
resulting from heated impact debris raining back down upon the Earth's surface. Since their orbital paths<br />
often cross that of the Earth, collisions with near-Earth objects have occurred in the past and we should<br />
remain alert to the possibility of future close Earth approaches. It seems prudent to mount ef<strong>for</strong>ts to discover<br />
and study these objects, to characterize their sizes, compositions and structures and to keep an eye upon<br />
their future trajectories.<br />
Source: NASA Jet Propulsion Laboratory<br />
Potential Impact<br />
Astronomers estimate that there are approximately 1,100 NEAs larger than 0.6 mi in diameter, and more<br />
than a million larger than 30m in diameter (the approximate threshold <strong>for</strong> penetration through the Earth's<br />
atmosphere).<br />
Potential Outcome<br />
The most recent NEA hitting the earth was at<br />
Tunguska, Siberia in 1908 which was 60 meters in<br />
diameter and produced a very destructive explosion of<br />
about 10-15 megatons energy and causing a 20 mile<br />
area of felled and scorched trees when it disintegrated<br />
at an altitude of 6-8 km. In contrast, the energy of a<br />
30 m stony asteroid at the same speed is about 1<br />
megaton of kinetic energy, and it does not penetrate<br />
within 10 km of the surface.<br />
According to NASA’s Science Definition Team (SDT), the following studies were found regarding asteroid<br />
impact potentials:<br />
301
<strong>2010</strong>-<strong>2040</strong> <strong>HAZARDS</strong> <strong>ANALYSIS</strong> <strong>PLAN</strong><br />
Regulatory<br />
Damage from a stony asteroid falls off very rapidly <strong>for</strong> sizes smaller than Tunguska, going to zero <strong>for</strong><br />
energies below about 2 megatons.<br />
A one-megaton explosion exploding 15 km in the air may cause a large sonic boom with breakage of<br />
some windows near ground zero, but buildings would not generally suffer structural damage and<br />
trees would not be knocked down. Flying debris from short-lived gale-<strong>for</strong>ce winds might cause some<br />
injuries.<br />
There is a significant atmospheric attenuation of the hazard <strong>for</strong> impactors below about 70 m<br />
diameter, and that there would be no deaths from an impact smaller than about 45 m diameter.<br />
There are no regulatory procedures <strong>for</strong> this type of event.<br />
Hazard Severity Ratings<br />
The following rating table indicates the probability of an asteroid and meteorite hazard event<br />
may rarely occur, impacting less than 25% of the land and few damages to property.<br />
Catastrophic Event<br />
ASTEROID AND METEORITE HAZARD EVENT RATING TABLE<br />
Consequence<br />
Probable<br />
Rating<br />
Catastrophic<br />
Rating<br />
Area Impacted 1 2<br />
Probability 0 0<br />
Health & Safety 0 4<br />
Property 1 3<br />
Environment 0 3<br />
Economic 0 2<br />
Total Ratings 2 14<br />
A catastrophic worst-case event equal or exceeding the Tunguska, Siberia event of 1908 that<br />
would level many buildings and cause widespread damage from debris.<br />
302
<strong>2010</strong>-<strong>2040</strong> <strong>HAZARDS</strong> <strong>ANALYSIS</strong> <strong>PLAN</strong><br />
11.19 CYBERSPACE THREATS<br />
Definition: The Department of Defense (DoD) defines cyberspace as follows: A global domain within the<br />
in<strong>for</strong>mation environment consisting of the interdependent network of in<strong>for</strong>mation technology infrastructures,<br />
including the Internet, telecommunications networks, computer systems, and embedded processors and<br />
controllers. (Joint Publication 1-02, DoD Dictionary of Military Terms, Washington, D.C.: Joint Staff, Joint<br />
Doctrine Division, J-7, October 17, 2008.) This encompasses hundreds of thousands of interconnected<br />
computers, servers, routers, switches, and fiber optic cables that typically allow critical infrastructures to<br />
work. Supervisory Control and Data Acquisition (SCADA) systems can also be attacked, especially since<br />
they have increasingly become more dependent on internet protocol-based systems.<br />
Cyber-based threats to government systems and critical infrastructure are evolving and growing. These<br />
threats can be unintentional or intentional, targeted or non-targeted, and can come from a variety of sources,<br />
including criminals, terrorists, and adversarial <strong>for</strong>eign nations, as well as hackers and disgruntled employees.<br />
Pervasive and sustained cyber attacks continue to pose a potentially<br />
devastating threat to the systems and operations of the federal<br />
government. In recent months, federal officials have cited the continued<br />
ef<strong>for</strong>ts of <strong>for</strong>eign nations and criminals to target government and private<br />
sector networks; terrorist groups have expressed a desire to use cyber<br />
attacks to target the United States; and press accounts have reported<br />
attacks on the Web sites of government agencies. The ever-increasing<br />
dependence of federal agencies on computerized systems to carry out<br />
essential, everyday operations can make them vulnerable to an array of<br />
cyber-based risks.<br />
Cyber attacks on United States in<strong>for</strong>mation networks can have serious<br />
consequences such as disrupting critical operations, causing loss of<br />
revenue and intellectual property, or loss of life. The annual cost of cyber<br />
crime is estimated to be over $1 trillion, and coordinated cyber attacks<br />
have crippled and compromised critical infrastructure in some countries.<br />
Additionally, attacks have included espionage, indentifying targets,<br />
creating back doors or other means <strong>for</strong> future access of vulnerable<br />
systems, intimidation, and eroding public confidence.<br />
While in<strong>for</strong>mation and communication technologies have allowed <strong>for</strong> easier in<strong>for</strong>mation sharing and<br />
gathering within the public and private sectors, increasing threats from social networking, cloud computing<br />
plat<strong>for</strong>ms, flash drives and other portable devices can unintentionally compromise unwitting third parties,<br />
which in turn can become the basis <strong>for</strong> actionable attacks against those third parties. Cyber attacks can be<br />
launched from literally anywhere, including cybercafés, open Wi-Fi nodes, and suborned third-party<br />
computers. They do not require expensive or rare machinery. They leave next to no unique physical trace.<br />
The National Strategy to Secure Cyberspace is part of the overall ef<strong>for</strong>t to protect the Nation. It is an<br />
implementing component of the National Strategy <strong>for</strong> Homeland Security and is complemented by a National<br />
Strategy <strong>for</strong> the Physical Protection of Critical Infrastructures and Key Assets.<br />
303
<strong>2010</strong>-<strong>2040</strong> <strong>HAZARDS</strong> <strong>ANALYSIS</strong> <strong>PLAN</strong><br />
11.19.1 THREAT AND VULNERABILITY: A 5-LEVEL PROBLEM<br />
Managing threat and reducing vulnerability in cyberspace is a particularly complex challenge because of the<br />
number and range of different types of users. Cyberspace security requires action on multiple levels and by a<br />
diverse group of actors because literally hundreds of millions of devices are interconnected by a network of<br />
networks. The problem of cyberspace security can be best addressed on five levels.<br />
Level 1, the Home User/Small Business<br />
Though not a part of a critical infrastructure the computers of home users can become part of<br />
networks of remotely controlled machines that are then used to attack critical infrastructures.<br />
Undefended home and small business computers, particularly those using digital subscriber line<br />
(DSL) or cable connections, are vulnerable to attackers who can employ the use of those machines<br />
without the owner’s knowledge. Groups of such ―zombie‖ machines can be used by third-party actors<br />
to launch denial-of-service (DoS) attacks on key Internet nodes and other important enterprises or<br />
critical infrastructures.<br />
Level 2, Large Enterprises<br />
Large-scale enterprises (corporations, government agencies, and universities) are common targets<br />
<strong>for</strong> cyber attacks. Many such enterprises are part of critical infrastructures. Enterprises require<br />
clearly articulated, active in<strong>for</strong>mation security policies and programs to audit compliance with cyber<br />
security best practices. According to the U.S. intelligence community, American networks will be<br />
increasingly targeted by malicious actors both <strong>for</strong> the data and the power they possess.<br />
Level 3, Critical Sectors/Infrastructures<br />
When organizations in sectors of the economy, government, or academia unite to address common<br />
cyber security problems, they can often reduce the burden on individual enterprises. Such<br />
collaboration often produces shared institutions and mechanisms, which, in turn, could have cyber<br />
vulnerabilities whose exploitation could directly affect the operations of member enterprises and the<br />
sector as a whole. Enterprises can also reduce cyber risks by participating in groups that develop<br />
best practices, evaluate technological offerings, certify products and services, and share in<strong>for</strong>mation.<br />
Several sectors have <strong>for</strong>med In<strong>for</strong>mation Sharing and Analysis Centers (ISACs) to monitor <strong>for</strong> cyber<br />
attacks directed against their respective infrastructures. ISACs are also a vehicle <strong>for</strong> sharing<br />
in<strong>for</strong>mation about attack trends, vulnerabilities, and best practices.<br />
Level 4, National Issues and Vulnerabilities<br />
Some cyber security problems have national implications and cannot be solved by individual<br />
enterprises or infrastructure sectors alone. All sectors share the Internet. Accordingly, they are all at<br />
risk if its mechanisms (e.g., protocols and routers) are not secure. Weaknesses in widely used<br />
software and hardware products can also create problems at the national level, requiring coordinated<br />
activities <strong>for</strong> the research and development of improved technologies. Additionally, the lack of<br />
trained and certified cyber security professionals also merits national level concern.<br />
Level 5, Global<br />
The worldwide web is a planetary in<strong>for</strong>mation grid of systems. Internationally shared standards<br />
enable interoperability among the world’s computer systems. This interconnectedness, however,<br />
also means that problems on one continent have the potential to affect computers on another. We<br />
there<strong>for</strong>e rely on international cooperation to share in<strong>for</strong>mation related to cyber issues and, further,<br />
to prosecute cyber criminals. Without such cooperation, the collective ability to detect, deter, and<br />
minimize the effects of cyber-based attacks would be greatly diminished.<br />
304
<strong>2010</strong>-<strong>2040</strong> <strong>HAZARDS</strong> <strong>ANALYSIS</strong> <strong>PLAN</strong><br />
11.19.2 EXAMPLE ATTACKS (2008)<br />
A disgruntled software developer used stolen radio equipment to hack into a system controlling a<br />
sewage plant. On nearly 50 occasions, he sent malicious code that opened control valves, causing<br />
more than 200,000 gallons of sewage to ooze into nearby rivers and parks.<br />
Successful cyber attacks against critical national infrastructures from outside the United States. The<br />
cyber attacks were used to disrupt power equipment in several regions outside the U.S, and in at<br />
least one case, the disruption caused a power outage affecting multiple cities.<br />
Computers exploited with the Conficker worm turned into junk mail-spewing robots (bots) capable of<br />
sending billions of spam messages a day and clogging e-mail systems and servers.<br />
The most significant breach of U.S. military computers was caused by an infected flash drive<br />
inserted into a U.S. military laptop on a post in the Middle East. Malicious code placed on the drive<br />
by a <strong>for</strong>eign intelligence agency uploaded itself onto a network run by the U.S. military's Central<br />
Command and spreading undetected on both classified and unclassified systems.<br />
11.19.3 RESOURCES<br />
Local Resources<br />
Wichita Police Department<br />
The Financial Crimes Section assesses and prioritizes the investigation of employee embezzlements, thefts<br />
by fraud, <strong>for</strong>geries, check crimes, financial card crimes, identity theft, and computer crimes occurring within<br />
our jurisdiction.<br />
State Resources<br />
<strong>Kansas</strong> Homeland Security<br />
<strong>Kansas</strong> Homeland Security, within the Adjutant General's Department, coordinates statewide activities<br />
pertaining to the prevention of and protection from terrorist-related events. This involves all aspects of<br />
prevention/mitigation, protection/preparedness, response and recovery. <strong>Kansas</strong> Homeland Security serves<br />
as a liaison between federal, state and local agencies and the private sector on matters relating to the<br />
security of <strong>Kansas</strong> and its citizens. This includes implementing the National Infrastructure Protection Plan<br />
along with a cyber security plan in conjunction with the State's In<strong>for</strong>mation Technology Department.<br />
Federal Resources<br />
Federal Bureau of Investigation (FBI)<br />
The FBI's cyber mission is four-fold: first and <strong>for</strong>emost, to stop those behind the most serious computer<br />
intrusions and the spread of malicious code; second, to identify and thwart online sexual predators who use<br />
the Internet to meet and exploit children and to produce, possess, or share child pornography; third, to<br />
counteract operations that target U.S. intellectual property, endangering our national security and<br />
competitiveness; and fourth, to dismantle national and transnational organized criminal enterprises engaging<br />
in Internet fraud. Pursuant to the National Strategy to Secure Cyberspace signed by the President, the<br />
Department of Justice and the FBI lead the national ef<strong>for</strong>t to investigate and prosecute cybercrime.<br />
Cyber Action Team (CAT) – Small, highly trained teams of FBI agents, analysts, and computer<br />
<strong>for</strong>ensics and malicious code experts who travel around the world on a moment’s notice to respond<br />
to cyber intrusions. Along the way, they gather vital intelligence on emerging threats and trends that<br />
help identify the cyber crimes that are most dangerous to national security and the economy.<br />
305
<strong>2010</strong>-<strong>2040</strong> <strong>HAZARDS</strong> <strong>ANALYSIS</strong> <strong>PLAN</strong><br />
National Cyber Security Division<br />
National Cyberspace Response System – The National Cyber Security Division seeks to protect the critical<br />
cyber infrastructure 24 hours a day, 7 days a week. The National Cyberspace Response System coordinates<br />
the cyber leadership, processes, and protocols that will determine when and what action(s) need to be taken<br />
as cyber incidents arise. Examples of current cyber preparedness and response programs include:<br />
Cyber Security Preparedness and the National Cyber Alert System - Cyber threats are<br />
constantly changing. Both technical and non-technical computer users can stay prepared <strong>for</strong><br />
these threats by receiving current in<strong>for</strong>mation by signing up <strong>for</strong> the National Cyber Alert<br />
System.<br />
US-CERT Operations - US-CERT is responsible <strong>for</strong> analyzing and reducing cyber threats<br />
and vulnerabilities, disseminating cyber threat warning in<strong>for</strong>mation, and coordinating incident<br />
response activities.<br />
National Cyber Response Coordination Group - Made up of 13 federal agencies, this is the<br />
principal federal agency mechanism <strong>for</strong> cyber incident response. In the event of a nationally<br />
significant cyber-related incident, the NCRCG will help to coordinate the federal response,<br />
including US-CERT, law en<strong>for</strong>cement and the intelligence community.<br />
Cyber Cop Portal – Coordination with law en<strong>for</strong>cement helps capture and convict those<br />
responsible <strong>for</strong> cyber attacks. The Cyber Cop Portal is an in<strong>for</strong>mation sharing and<br />
collaboration tool accessed by over 5,300 investigators worldwide who are involved in<br />
electronic crimes cases.<br />
Federal Network Security (FNS)<br />
The Federal Network Security branch serves as the single, accountable focal point <strong>for</strong> achieving an<br />
enterprise model dedicated to federal cyber infrastructure security. FNS is driving change across federal<br />
executive civilian departments and agencies that will enhance the cyber security posture of the federal<br />
government.<br />
Cyber-Risk Management Programs<br />
Through Cyber Risk Management, the National Cyber Security Division seeks to assess risk, prioritize<br />
resources, and execute protective measures critical to securing our cyber infrastructure. Examples of current<br />
cyber risk management programs include:<br />
Cyber Exercises: Cyber Storm - Cyber Storm is an international cyber security exercise series that<br />
takes place every two years (February 2006, March 2008, and September <strong>2010</strong>) to assess<br />
preparedness capabilities in response to a cyber incident of national significance. Cyber Storm was<br />
the Department of Homeland Security’s first cyber exercise testing response across the private<br />
sector as well as international, federal and state governments.<br />
National Outreach Awareness Month - Every October the National Cyber Security Division<br />
coordinates with multiple states, universities and the private sector to produce National Cyber<br />
Security Awareness month.<br />
Software Assurance Program - This program seeks to reduce software vulnerabilities, minimize<br />
exploitation, and address ways to improve the routine development and deployment of trustworthy<br />
software products. Together, these activities will enable more secure and reliable software that<br />
supports mission requirements across enterprises and the critical infrastructure.<br />
306
<strong>2010</strong>-<strong>2040</strong> <strong>HAZARDS</strong> <strong>ANALYSIS</strong> <strong>PLAN</strong><br />
Regulatory<br />
There are no regulatory procedures <strong>for</strong> this type of event.<br />
Hazard Severity Ratings<br />
The following rating table indicates the probability of cyber attacks routinely occur; however,<br />
the level of magnitude of impact can vary.<br />
Catastrophic Event<br />
CYBERSPACE THREAT HAZARD EVENT RATING TABLE<br />
Consequence<br />
Probable<br />
Rating<br />
Catastrophic<br />
Rating<br />
Area Impacted 1 4<br />
Probability 4 0<br />
Health & Safety 0 4<br />
Property 1 3<br />
Environment 0 3<br />
Economic 1 4<br />
Total Ratings 7 18<br />
A catastrophic worst-case event would be impacting any of the sector specific areas as to impair or shut<br />
down its functionality and severe any interface with other sector specific areas.<br />
307
<strong>2010</strong>-<strong>2040</strong> <strong>HAZARDS</strong> <strong>ANALYSIS</strong> <strong>PLAN</strong><br />
SUMMARY<br />
Table A on the following page depicts graphically the 16 types of specific hazards<br />
both natural and man-made that are of concern to <strong>Sedgwick</strong> <strong>County</strong> and rates<br />
each of the hazards as high, medium, or low in potential.<br />
Table B illustrates the scoring <strong>for</strong> each of the hazards that are prevalent in the county<br />
and takes into account the area impacted, probability of occurrence, health and<br />
safety, property, environment, and economic impacts.<br />
Table C shows the possible secondary events that could be triggered as a<br />
consequence of one of the 16 primary disasters occurring. It should be noted that<br />
it is generally more useful to consider all secondary events as a part of, and in the<br />
context of, the overall, situation created by the primary event.<br />
308
<strong>2010</strong>-<strong>2040</strong> <strong>HAZARDS</strong> <strong>ANALYSIS</strong> <strong>PLAN</strong><br />
309
<strong>2010</strong>-<strong>2040</strong> <strong>HAZARDS</strong> <strong>ANALYSIS</strong> <strong>PLAN</strong><br />
TABLE B<br />
RANKED HAZARD AND EVENT RATING TABLE<br />
Hazard Probable Rating Catastrophic Rating<br />
Tornado 13 17<br />
Storm 11 16<br />
Fire 11 14<br />
Drought 11 14<br />
Flood 10 20<br />
Dams and Levees 10 20<br />
Pollution 10 13<br />
Weapon of Mass Destruction 10 11<br />
Earthquake 8 15<br />
Civil Disturbances 8 13<br />
Cyberspace Threats 7 18<br />
Emerging Public Health Threats 6 10<br />
Utility 6 9<br />
Hazardous Materials 5 13<br />
Transportation Accidents 5 12<br />
Fog 5 4<br />
Sinkholes/Subsidence 3 7<br />
Asteroids and Meteorites 2 14<br />
Radiological 1 5<br />
310
Aircraft Accident<br />
Animals-Loss/Injured/Dead<br />
Crop Damage<br />
Dam / Dike Failure<br />
Epidemic<br />
Explosion<br />
Fallout<br />
Fire<br />
Flash Flood<br />
Food Shortage<br />
Fuel Shortage<br />
Hazardous Materials Incident<br />
Housing Shortage<br />
Human Injured / Dead<br />
Industrial Accident<br />
Power / Gas Failure<br />
Radiological Incident<br />
Structural Collapse<br />
Train Derailment<br />
Vehicular Wreck<br />
Water Shortage<br />
<strong>2010</strong>-<strong>2040</strong> <strong>HAZARDS</strong> <strong>ANALYSIS</strong> <strong>PLAN</strong><br />
TABLE C<br />
Possible Secondary Events<br />
(Events that could possibly be<br />
of major consequence in a<br />
selected area are presented in<br />
this listing.)<br />
Primary Disaster<br />
NATURAL<br />
1. Flood<br />
a. River X X X X X X X X X X X X X X<br />
b. Creeks X X X X X X X X X X X X X X<br />
c. Flash X X X X X X X X X X X X X X<br />
2. Tornadoes X X X X X X X X X X X X X X X X<br />
3. Storms<br />
a. Lightning X X X X X X X X X<br />
b. Hail X X X X X X X<br />
c. Wind X X X X X X X X X X X<br />
d. Blizzard<br />
1. Heavy snow X X X X X X X X X X X X X X X X X<br />
2. Ice or Glaze X X X X X X X X X X X X<br />
4. Drought X X X X X X<br />
5. Earthquake X X X X X X X X X X X X X X<br />
6. Fog X X X X X X<br />
MAN-MADE<br />
1. Hazardous Materials<br />
a. Transportation<br />
1. Vehicular Wreck X X X X X X X X<br />
2 Train Derailment X X X X X X X X X<br />
3 Downed Aircraft X X X X X X<br />
b. Industrial<br />
1. Explosion X X X X X X X X X<br />
2. Fire X X X X X X X X<br />
3. Accidental Release X X X X X X<br />
4. Theft / Loss X X<br />
2. Radiological X X X X X X X X X X X X X X X X X X X<br />
3. Fire<br />
a. High Rise X X X<br />
b. Multiple Buildings X X X X X<br />
c. Industrial X X X X X X X X<br />
d. Rangeland X X X X X<br />
e. Gas Lines X X X X X X<br />
f. Refinery X X X X X X<br />
g. Chemical Plant X X X X X X X<br />
h. Health Care Facilities X X X X X<br />
311
Aircraft Accident<br />
Animals-Loss/Injured/Dead<br />
Crop Damage<br />
Dam / Dike Failure<br />
Epidemic<br />
Explosion<br />
Fallout<br />
Fire<br />
Flash Flood<br />
Food Shortage<br />
Fuel Shortage<br />
Hazardous Materials<br />
Incident<br />
Housing Shortage<br />
Human Injured / Dead<br />
Industrial Accident<br />
Power / Gas Failure<br />
Radiological Incident<br />
Structural Collapse<br />
Train Derailment<br />
Vehicular Wreck<br />
Water Shortage<br />
<strong>2010</strong>-<strong>2040</strong> <strong>HAZARDS</strong> <strong>ANALYSIS</strong> <strong>PLAN</strong><br />
TABLE C<br />
Possible Secondary Events<br />
(Events that could possibly be<br />
of major consequence in a<br />
selected area are presented in<br />
this listing.)<br />
Primary Disaster<br />
4. Explosion<br />
a. Pipe Lines X X X X X X X X X<br />
b. Industrial X X X X X X X X X<br />
c. Chemical X X X X X X<br />
5. Pollution<br />
a. Air X X X<br />
b. Water<br />
1. Mineral Inflow X X X X X<br />
2. Rural Runoff X X X<br />
3. Urban Runoff X X<br />
6.Water Related<br />
a. Dam or Reservoir Failures X X X X X X X X X X X X<br />
b. Dike or Levee Failures X X X X X X X X X X X X<br />
c. Water Shortage X X X X<br />
7. Medical Epidemic<br />
a. Human X X<br />
b. Animal X X<br />
8. Utility<br />
a. Power / Light<br />
1. Sub Stations X X X<br />
2. Downed Lines X X X X<br />
3. Downed Poles X X X<br />
b. Natural Gas X X X X X X<br />
c. Water<br />
1. Water Plant X X X<br />
2. Water Mains X<br />
d. Storm Drainage X<br />
e. Sanitary Drainage<br />
1. Disposal Plant X X X<br />
2. Mains X X<br />
3. Lift Stations X X<br />
4. Settling Ponds<br />
9. Transportation Accidents<br />
a. Truck X X X X X X X X X X<br />
b. Rail X X X X X X X X X<br />
c. Air X X X X X X X<br />
10. Civil Disturbance<br />
a. Riot X X X X X X X<br />
b. Bomb Threat X X X X X X X X X<br />
c. Terrorism / Sabotage X X X X X X X X X X X X X X X X X X X X X<br />
312
DEFINITIONS
Casualty – is a term used in this analysis to refer to human injury or death as a result of a disaster event.<br />
Other losses categorized as a result of a disaster, such as property, the environment or social and economic<br />
activity is to be evaluated under the category of property <strong>for</strong> vulnerability and maximum threat ratings.<br />
Disaster/Emergency – An event that causes or threatens to cause loss of life, human suffering, public and<br />
private property damage, and economic and social disruption. Disasters and emergencies require guidance<br />
and resources that are beyond the scope of local agencies in routine responses to day-to-day emergencies<br />
and accidents, and may be of such magnitude or unusual circumstances as to require response by several<br />
or all levels of government – local, state, and federal.<br />
Federal Emergency Management Agency (FEMA) – Responsible <strong>for</strong> overall disaster-related federal<br />
programs involved with mitigation, preparedness, response and recovery to natural and man-made disasters<br />
or nuclear attack.<br />
Hazard – A potential event or situation that presents a threat to life and property.<br />
Hazard Identification – The determination of possible hazards, their probability and intensity, and the impact<br />
area.<br />
Hazard Analysis – A review of the vulnerability of life, property, the environment, and social and economic<br />
activity to the actual or potential impact of hazards.<br />
History – The record of occurrences of previous disasters or events.<br />
Local Emergency Preparedness Coordinator is the person who is responsible <strong>for</strong> preparing, coordinating,<br />
training, organizing, and planning of emergency preparedness functions <strong>for</strong> the county and cities.<br />
Maximum Treat – The greatest destruction that can be expected from an event.<br />
Mitigation – Those actions (including threat and vulnerability assessments) taken to reduce the exposure to<br />
and detrimental effects of a WMD incident.<br />
Plume – Airborne material spreading from a particular source; the dispersal of particles, gases, vapors, and<br />
aerosols into the atmosphere.<br />
Probability – The likelihood that an even will occur.<br />
Radiation – High-energy particles or gamma rays that are emitted by an atom as the substance undergoes<br />
radioactive decay. Particles can be either charged alpha or beta particles or neutral neutron or gamma rays.<br />
Recovery – Includes all types of emergency actions dedicated to continued protection of the public or<br />
promoting the resumption of normal activities in the affected area.<br />
Response – Executing the plan and resources identified to per<strong>for</strong>m those duties and services to preserve<br />
and protect life and property as well as provide services to the surviving population.<br />
Terrorism – The unlawful use of <strong>for</strong>ce or violence against persons or property to intimidate or coerce a<br />
government, the civilian population, or any segment thereof, in furtherance of political or social objectives.<br />
Domestic terrorism involves groups or individuals who are based and operate entirely within the United<br />
States and U.S. territories without <strong>for</strong>eign direction and whose acts are directed at elements of the U.S.<br />
government or population.<br />
Toxicity – A measure of the harmful effects produced by a given amount of a toxin on a living organism.<br />
Vulnerability (or Risk) – The degree to which people, property, the environment, or social and economic<br />
activity – in short, all elements at risk – are susceptible to injury, damage, disruption, or loss.
Weapons-Grade Material – Nuclear material considered most suitable <strong>for</strong> a nuclear weapon. It usually<br />
connotes uranium enriched to above 90% uranium-235 or plutonium with greater than about 90% plutonium-<br />
239.<br />
Weapon of Mass Destruction (WMD) – Any explosive, incendiary, or poison gas, bomb, grenade, rocket<br />
having a propellant charge of more than 4 ounces, or a missile having an explosive incendiary charge of<br />
more than 0.25 ounce, or mine or device similar to the above; poison gas; weapon involving a disease<br />
organism; or weapon that is designed to release radiation or radioactivity at a level dangerous to human life.<br />
(Source: 18 USC 2332a as referenced in 18 USC 921)
BIBLIOGRAPHY
BIBLIOGRAPHY – WEB SITES<br />
AIRNAV<br />
AIRPORT DIRECTORY<br />
HTTP://WWW.AIRNAV.COM/AIRPORTS/US/KS<br />
KANSAS DEPARTMENT OF HEALTH & ENVIRONMENT<br />
BUREAU OF HEALTH FACILITIES –<br />
HTTP://WWW.KDHE.STATE.KS.US/BHFR/FAC_LIST/INDEX.HTML<br />
BUREAU OF WASTE MANAGEMENT –<br />
HTTP://PUBLIC1.KDHE.STATE.KS.US/LANDFILLS/LANDFILLS.NSF?OPENDATABASE<br />
KANSAS DEPARTMENT OF TRANSPORTATION<br />
SPILL INCIDENTS, OFFICE OF HAZARDOUS MATERIALS SAFETY –<br />
HTTP://HAZMAT.DOT.GOV/FILES/HAZMAT/HMISFRAME.HTM<br />
KANSAS GEOLOGICAL SURVEY<br />
OIL AND GAS FIELDS –<br />
HTTP://WWW.KGS.UKANS.EDU/PRS/COUNTY/RS/SEDGWICK.HTML<br />
KANSAS STATE DEPARTMENT OF EDUCATION<br />
K-12 SCHOOL REPORTS –<br />
HTTP://WWW.KSBE.STATE.KS.US/WELCOME.HTML<br />
NATIONAL OCEANIC ATMOSPHERIC ADMINISTRATION<br />
HISTORICAL EARTHQUAKE INTENSITY DATABASE –<br />
HTTP://WWW.NGDC.NOAA.GOV/SEG/HAZARD/INT_SRCH.SHTML<br />
HISTORICAL WEATHER, NATIONAL CLIMATIC DATA CENTER –<br />
HTTP://WWW4.NCDC.NOAA.GOV/CGI-WIN/WWCGI.DLL?WWEVENT~STORMS<br />
NATIONAL RESPONSE CENTER<br />
HAZARDOUS MATERIAL INCIDENTS –<br />
HTTP://WWW.NRC.USCG.MIL/WDBCGI/WDBCGI.EXE/WWWUSER/WEBDB.FOIA_QUERY.SHOW_PARMS<br />
U.S. CENSUS BUREAU<br />
COUNTY DEMOGRAPHICS –<br />
HTTP://QUICKFACTS.CENSUS.GOV/QFD/STATES/20000.HTML<br />
TOWNSHIP & CITY DEMOGRAPHICS –<br />
HTTP://WWW.CENSUS.GOV/PROD/CEN2000/DP1/2KH20.PDF<br />
U.S. CORPS OF ENGINEERS<br />
NATIONAL INVENTORY OF DAMS –<br />
HTTP://CRUNCH.TEC.ARMY.MIL/NID/WEBPAGES/NID.CFM<br />
U.S. DEPARTMENT OF TRANSPORTATION<br />
RAIL AFFAIRS UNIT –<br />
HTTP://KDOT1.KSDOT.ORG/PUBLIC/KDOT/BURRAIL/RAILWBPG/FRNTPAGE.HTM
U.S. ENVIRONMENTAL PROTECTION AGENCY<br />
WATERSHEDS –<br />
HTTP://CFPUB.EPA.GOV/SURF/STATE.CFM?STATEPOSTAL=KS<br />
TOXIC RELEASE INVENTORY EXPLORER –<br />
HTTP://WWW.EPA.GOV/TRIEXPLORER/REPORTS.HTM
APPENDIX A
HISTORIC FLOOD EVENTS<br />
May 18, 1877: According to National Weather Service records, the largest flood on the Arkansas<br />
River at Wichita occurred on May 18, 1877. Unprecedented high waters in the lower Arkansas River<br />
during May 1877 carried away or disabled all the bridges in Cowley <strong>County</strong> including the 6th Avenue<br />
Bridge in Arkansas City. The Arkansas River at Wichita (station 07144300) reached a stage of 21<br />
feet; flood stage is 12 feet (river gage site and datum from reports of the U.S. Weather Bureau).<br />
July 8, 1904: The second largest flood on the river occurred July 8, 1904, and its level was about<br />
one-half foot lower than the 1877 flood. The Arkansas River at Wichita (station 07144300) reached a<br />
stage of 20.3 feet (river gage site and datum from reports of the U.S. Weather Bureau). Despite a<br />
slightly lower gage height than the 1877 flood, flooding was more widespread in Wichita because of<br />
backwater and overflow of the Little Arkansas River and Chisholm Creek as they entered the narrow<br />
channel of the Arkansas River in Wichita. Also, the six pile bridges crossing the Arkansas River at<br />
the time-collected drift that retarded the flood-causing overflow. Approximately 30 percent of Wichita<br />
was submerged on July 8 resulting in $30,000 in damages (almost $600,000 in 2005 dollars) The<br />
1904 flood caused more damage than the 1877 flood because Wichita was more populated in 1904.<br />
According to the Wichita Eagle, the Douglas Avenue Bridge was destroyed in the early afternoon of<br />
July 7, 1904.<br />
October 1908: Historic in<strong>for</strong>mation indicates that the October 1908 flood was the largest along the<br />
main stem of the upper Arkansas River in <strong>Kansas</strong> since the turn of the century. The flood resulted<br />
from excessive rains between Holly and Las Animas, Colorado, and northward over the Big Sandy<br />
Creek drainage basin in southwestern Colorado. Maximum flows were estimated at 97,000 cubic feet<br />
per second near Coolidge and 87,000 cubic feet per second at Syracuse.<br />
September 6, 1911: During the late evening of September 6th and into the early<br />
morning hours of September 7th, Wichita received 7.99 inches of rain, which is the city's greatest 24-<br />
hour rainfall ever observed. Other records were set including, 4.94 inches in 3 hours and 3.54 inches<br />
in 2 hours.<br />
June 8-9, 1923: During the month of June, the entire drainage area between Hutchinson and<br />
Arkansas City received excessive rains. On June 8 and 9, Wichita reported 7.06 inches, Newton<br />
5.75 inches, and Arkansas City 2.06 inches. Excessive precipitation fell over all of the Little<br />
Arkansas, Ninnescah, and Chikaskia River Basins as well as the Arkansas River Valley, and major<br />
flooding occurred on all of the affected streams. Wichita and Arkansas City were severely damaged.<br />
In Wichita, 6 square miles were inundated. At Arkansas City two lives were lost. Property damage<br />
was estimated at nearly $20 million.<br />
April 21-23, 1944: The year 1944 was one of generally above-normal precipitation in the lower<br />
Arkansas River Basin. The most severe flood of that year occurred at Wichita and downstream to<br />
Arkansas City as a result of rains on April 21 to 23. On April 22, Wichita received 6.03 inches of rain,<br />
Newton 2.47 inches, Hutchinson, 3.05 inches, and Wellington 3.38 inches. The merging of the flows<br />
from the Arkansas and Little Arkansas Rivers in Wichita almost reached Douglas Avenue and<br />
resulted in the flooding of about 2,000 homes and businesses in the city. Damages <strong>for</strong> <strong>Sedgwick</strong><br />
<strong>County</strong> were estimated at nearly $5 million. At about the same time as the Wichita flood the Walnut<br />
River at Winfield rose close to a record-breaking stage, with great overflows of Timber and Dutch<br />
Creeks, covering much of the city with water and resulting in damage estimated at $2,000,000.<br />
Flood stages at Arkansas City approached those of the 1923 flood.<br />
May-July, 1951: The highest stages along the Arkansas River during 1951 occurred near Coolidge<br />
and at Garden City as the result of an intense storm on May 15, 1951. In the Wichita area, Big<br />
Slough and Little Slough experienced flooding in July 1951. Annual precipitation in 1951 was 50.48‖,<br />
which is the highest annual precipitation on record <strong>for</strong> Wichita. Flood-damage estimates compiled by<br />
the U.S. Army Corps of Engineers <strong>for</strong> the May-July 1951 flooding total $2,868,000 along the main<br />
stem of the Arkansas River.<br />
May 16–17, 1957: Frequent precipitation after April 30 and high soil moisture content set the stage<br />
<strong>for</strong> flooding on May 16–17, 1957, in the Arkansas River Basin in south-central <strong>Kansas</strong>. The State<br />
Highway Commission (now the <strong>Kansas</strong> Department of Transportation) reported 45 road closures in<br />
APPENDIX A
the area, and extensive crop damage was left behind by floodwaters. In the Wichita area, the newly<br />
completed Big Slough-Cowskin floodway successively diverted one-third of the peak flow around the<br />
Arkansas River at Wichita gage and prevented more serious flooding in the city.<br />
June 17–25, 1965: Severe flooding occurred along the Arkansas River upstream from Great Bend<br />
during June 17–25, 1965, as a result of storms in the foothills and plains east of the Rocky<br />
Mountains in Colorado and New Mexico. Because the main storm did not directly affect <strong>Kansas</strong>,<br />
local flooding was minimal, but the Arkansas River overflowed from the western State line<br />
downstream to Great Bend. Flow in the Arkansas River peaked near the Colorado-<strong>Kansas</strong> State line<br />
on June 17. The peak discharges recorded at all gauging stations on the Arkansas River and<br />
upstream from Great Bend were larger than any previously recorded and had recurrence intervals<br />
greater than 50 years. As the crest of the flood progressed downstream to its junction with the Little<br />
Arkansas River on June 25, the peak discharge had decreased to a magnitude having a recurrence<br />
interval less than 10 years. Although inundation of the flood plain caused considerable damage to<br />
urban areas, such as Garden City and Dodge City, most of the estimated $16 million in damage was<br />
to cropland.<br />
September–October 1973: Significant flooding occurred in September and October 1973 in southcentral<br />
<strong>Kansas</strong>. The flood was the result of abundant precipitation that continued <strong>for</strong> several weeks.<br />
Two USGS streamflow-gauging stations on Rattlesnake Creek recorded maximum stages and<br />
discharges <strong>for</strong> their respective periods of record on September 26 and 29, as did the gauging station<br />
on the Arkansas River near Hutchinson on September 28.<br />
October 31, 1979: The largest flood since the USGS began operating the gage in 1934 occurred<br />
October 31, 1979. By this time many changes had occurred on the river. The largest change was the<br />
completion of the Big Slough-Cowskin Creek and Valley Center Floodway projects. The 1979 total<br />
streamflow volume was much larger than the 1904 flood volume however, more than 30 percent of<br />
the water was diverted around the city through the floodway and flood damages were minimal. A<br />
similar event occurred on Halloween 1998 when the combined flow of the Arkansas River and the<br />
floodway nearly reached the 1904 level. Many homes along Cowskin Creek were damaged as a<br />
result of this flood.<br />
June 15, 1981: On the afternoon of June 14, 1981, a series of intense thunderstorms along the<br />
<strong>for</strong>ward edge of a stalled cold front produced 5 to 20 inches of precipitation in about 12 hours near<br />
Great Bend. The storm affected about 350 square miles of tributaries to the Arkansas River<br />
upstream from Great Bend. The most extensive flooding occurred along Walnut and Dry Walnut<br />
Creeks in southwestern Barton <strong>County</strong>. Significant urban flooding was limited to the communities of<br />
Pawnee Rock and Great Bend. An estimated 3,000 people were evacuated by boat, truck, or<br />
helicopter in Great Bend. Two-thirds of the city remained under about 4 feet of water on June 16.<br />
The Arkansas River south of Great Bend was 1 to 2 miles wide in places, and Walnut Creek had<br />
swollen to 2 miles wide. The resulting runoff produced peak discharges on Dry Walnut Creek on<br />
June 15 that were 1.5 to 3 times the discharge having a 100-year recurrence interval and caused<br />
about $42 million in damages. The storm was so localized that gauging stations around its perimeter<br />
recorded only nominal discharge, generally having a recurrence interval less than 2 years.<br />
September 12, 1985: Stationary thunderstorms produced 10 inches of rain near<br />
Garden Plain <strong>Kansas</strong>. Reports of 7 to 9 inches were common across the area.<br />
September 5, 1989: Thunderstorms produced 6 to 10 inches of rain in south central <strong>Kansas</strong><br />
between 6 AM and Noon. Serious flooding was reported around Wichita, with water 4 feet deep<br />
along some roads.<br />
May–September 1993: Excessive precipitation fell across south-central and southeastern <strong>Kansas</strong><br />
from May–September 1993 with more than the annual average falling during the 5-month period.<br />
May thunderstorms produced substantial precipitation that caused flooding in the lower Arkansas<br />
River Basin and its tributaries. USGS streamflow-gauging stations on the Ninnescah River near Peck<br />
and the Arkansas River at Arkansas City had notable maximum discharges. During the latter part of<br />
July, maximum peak discharges <strong>for</strong> the period of record were recorded at 10 streamflow-gauging<br />
stations, including Pawnee River near Burdett, Walnut Creek near Rush Center, Rattlesnake Creek<br />
APPENDIX A
near Zenith, Arkansas River near Maize, and the Arkansas River at Derby. Damage in the area was<br />
estimated at $6.5 million with two lives lost. Two hundred fifty-four houses were damaged, several<br />
thousand head of livestock were lost, more than 120,000 acres of crops were damaged, and nearly<br />
$1 million worth of farm machinery was destroyed. A Presidential Declaration (FEMA-1000-DR-KS)<br />
was declared in 1993 <strong>for</strong> 57 <strong>Kansas</strong> counties to include <strong>Sedgwick</strong> <strong>County</strong>. A total of 108 individual<br />
assistance applications were submitted <strong>for</strong> this flood event that primarily affected the town of<br />
<strong>Sedgwick</strong> and near the City of Mulvane.<br />
1998 Halloween Flood: A large and intense fall storm slowly rolled over the eastern one-half of<br />
<strong>Kansas</strong> on Halloween 1998 leaving a 2-day deluge of more than 6 inches of rainfall over a 20-county<br />
area. Some locations received almost a foot of rain that led to flash flooding as well as historic<br />
flooding of rivers draining the region. The Walnut, Cottonwood, Whitewater and Arkansas Rivers<br />
reached record levels. Nearly one-third of the USGS streamflow-gauging stations in <strong>Kansas</strong><br />
recorded water levels above flood stage during the first week of November 1998 thus documenting<br />
the largest area flooded in <strong>Kansas</strong> since the 1993 floods.<br />
Six USGS gauging stations on the Arkansas and Little Arkansas Rivers were above National<br />
Weather Service flood stage between October 31 and November 3, 1998. One notable occurrence of<br />
flooding was in the Cowskin Creek area of western Wichita resulting in about $4 million in flood<br />
damage <strong>for</strong> nearly 170 homes and businesses along Cowskin Creek and its tributaries.<br />
Totals from the flood resulted in 37.8 million dollars in damage, and the evacuation of over 5,300<br />
people. With all the devastation, only 2 people were<br />
injured and only 1 person was killed.<br />
The widespread flooding of 1998 resulted in<br />
Presidential Declaration FEMA-1258-DR affecting<br />
20 <strong>Kansas</strong> counties to include <strong>Sedgwick</strong> <strong>County</strong> <strong>for</strong><br />
both individual and public assistance.<br />
September 27, 1999: Stationary thunderstorms positioned themselves over the City of Wichita<br />
resulting in rain beginning on the evening of the 26th, and lasting through the early morning hours of<br />
the 27th. Many rainfall records were set. Some of which include 3.85 inches in one hour, 4.89<br />
inches in 2 hours, and 5.63 inches in 3 hours. A total of 7.93 inches of rain fell in the 24 hour period,<br />
which is the second highest on record. The 24-hour record is 7.99 inches, occurring on September<br />
6th and 7th, 1911.<br />
2008 Fall Flood: A record amount of rain fell in the Wichita Area on September 12th, 2008. The<br />
NWS office at the Wichita Mid-Continent Airport measured 10.31 inches of rainfall on September<br />
12th. This total not only breaks the daily record rainfall <strong>for</strong> September 12th in Wichita, but it also<br />
breaks the 24 hour rainfall total of 7.99 inches that has been held since September 6-7, 1911. A<br />
stationary boundary interacted with the tropical remnants of Lowell. The rain kept training along in<br />
the same location, which was un<strong>for</strong>tunately right over south central <strong>Kansas</strong>, including the city of<br />
Wichita. In addition to the street flooding, the Cowskin Creek and other small creeks overflowed with<br />
the torrential rainfall. The flooded roads caused a headache <strong>for</strong> Wichita residents as it peaked during<br />
rush hour. Over 100 vehicles were stranded due to high water in Wichita along with many flooded<br />
homes. In addition to the Cowskin Creek in Wichita, many other flood warnings had been issued <strong>for</strong><br />
rivers in south central and southeast <strong>Kansas</strong>. Those rivers include: the Arkansas River, the<br />
Ninnescah River, the Walnut River, the Whitewater River, the Chikaskia River, the Cottonwood<br />
River, and the Neosho River.<br />
September 2, 2009: Governor Mark Parkinson requested a major disaster declaration due to severe<br />
storms, accompanied by large hail, lightening, high winds, and torrential rains during the period of<br />
July 8-14, 2009. The Governor requested a declaration <strong>for</strong> Public Assistance <strong>for</strong> eight counties and<br />
Hazard Mitigation <strong>for</strong> all counties. During the period of August 3 to September 2, 2009, joint Federal,<br />
State, and local Preliminary Damage Assessments (PDAs) were conducted in the requested<br />
APPENDIX A
counties with a total Public Assistance estimate of $3.5 million affecting Anderson <strong>County</strong>, Bourbon<br />
<strong>County</strong>, Franklin <strong>County</strong>, Linn <strong>County</strong>, and <strong>Sedgwick</strong> <strong>County</strong>.<br />
APPENDIX A
APPENDIX B
HISTORIC TORNADIC EVENTS<br />
June 12, 1881 – An F2 Tornado moved NW of Mulvane to 3 miles NE of Douglas destroying two<br />
homes 1 mile north of Mulvane and injuring 2 people.<br />
March 1, 1888 – An F3 tornado moved NE to within 7 miles south of Halstead resulting in two deaths<br />
and 15 injuries in western <strong>Sedgwick</strong> and Harvey counties.<br />
March 31, 1892 – Several tornadoes up to F4 moved NNE near South Haven and dissipating in<br />
extreme SE <strong>Sedgwick</strong> <strong>County</strong> resulted in 7 deaths and 40 injuries.<br />
May 13, 1892 – An F3 tornado moved NE from south of Haysville, passing just north of Derby and<br />
continuing to south of Augusta. Prior to reaching Augusta, buildings were destroyed on about 20<br />
farms, and at least 15 buildings and 10 homes were destroyed in Augusta. There were 5 reported<br />
injuries caused by the tornado.<br />
May 1, 1895 – An F5 tornado moved NE from NW <strong>Sedgwick</strong> <strong>County</strong>, passing west of Halstead and<br />
dissipating six miles NW of Newton. At least 25 farms were destroyed along with numerous<br />
livestock, and causing eight deaths and 25 injuries.<br />
May 26, 1903 – An F4 tornado moved NE passing four miles NW of Valley Center and 12 miles SE<br />
of Newton. Numerous farms and 12 homes were destroyed, and six injuries were caused by the<br />
tornado.<br />
November 10, 1915 – An F4 tornado cut a 16 mile path from five miles SW of Zyba, passing within<br />
four miles south of Peck and dissipating near the edge of Derby. Eight homes were destroyed and<br />
three people were killed at Zyba. At least two homes were destroyed and one person was killed at<br />
Derby. In addition to four deaths, there were 28 injuries caused by the tornado.<br />
May 25, 1917 – This one mile wide F5 tornado touched down 4 miles NNW of Cheney and moved<br />
NE through the SE part of Andale, continuing across the south edge of the City of <strong>Sedgwick</strong>, and<br />
terminating three miles NE of Florence. A total of 118 farms, homes and businesses were destroyed<br />
and caused over $600,000 in damages. About half the city of Andale was damaged or destroyed,<br />
and had 12 deaths reported. Eight people died near the east of the City of <strong>Sedgwick</strong>, two more<br />
deaths near McLain, and one death near Elbing. In addition to 23 deaths, a total of 70 people were<br />
injured.<br />
May 22, 1923 – An F2 tornado moved NNE from Viola, through Clonmel, and terminating four miles<br />
NE of Clonmel. There were a total of 2 injuries and over $70,000 in damages caused by this first<br />
event. A second event occurred 45 minutes later in northern Wichita were the F2 tornado preceded<br />
east and then SE. One home was destroyed; three homes and a refinery were damaged during the<br />
2 nd event. Total loss <strong>for</strong> this event was estimated at $30,000 and caused three injuries.<br />
February 24, 1935 – An F2 tornado moved NE from west Wichita to near Kechi. Six homes and a<br />
school were damaged, causing $50,000 in damages and six injuries.<br />
June 8, 1941 – An F4 tornado <strong>for</strong>med seven miles SW of Maize and moved NE <strong>for</strong> 42 miles be<strong>for</strong>e<br />
dissipating five miles West of Burns. At least five homes were destroyed and dozens of farms were<br />
damaged causing $200,000 in damages. One death was reported near Valley Center and seven<br />
others near Whitewater. There were also 20 injuries reported <strong>for</strong> this event.<br />
June 20, 1942 – A strong tornado moved in a semi-circular path around the city<br />
of Mulvane.<br />
March 18, 1948 – An F2 tornado touched down ESE of Wichita in the Beechwood area and tracked<br />
one mile be<strong>for</strong>e dissipating. Federal housing project homes sustained roof damages valued at<br />
approximately $100,000. The Beech Aircraft Company reported $100,000 in damages to hangars<br />
and airplanes. There were a total of two injuries from this event.<br />
APPENDIX B
May 1, 1948 – An F2 tornado traveled over a 40-mile track starting NE of Andale to south of Newton<br />
and ending near Peabody. Over $50,000 in damages occurred on ten farms and resulting in the<br />
destruction of barns and other buildings.<br />
Jun 21, 1948 – An F4 tornado touched down seven miles SW of Wichita and moved NE through the<br />
NW part of the city. Two farms were destroyed, and over $1,000,000 in damages to businesses and<br />
to aircraft based at Westport airport. There were a total of 12 injuries caused by this event.<br />
Jun 25, 1950, 1845 CST – An F0 tornado with a width of 33 yards touched down <strong>for</strong> a brief period<br />
causing approximately $2,500 in property damage.<br />
Jun 21, 1953, 2125 CST – An F2 tornado touched down <strong>for</strong> a brief period and causing three injuries.<br />
Jul 15, 1953, 1408 CST – An F0 touched down <strong>for</strong> a brief period causing approximately $250,000 in<br />
property damages.<br />
Apr 29, 1954, 1915 CST – An F0 touched down <strong>for</strong> a brief period with no reported property damages<br />
losses.<br />
Sep 09, 1954, 0200 CST – An F2 touched down <strong>for</strong> a brief period with no reported property damages<br />
losses.<br />
Oct 04, 1954, 1800 CST – An F2 touched down <strong>for</strong> a brief period causing approximately $25,000 in<br />
property damages.<br />
May 27, 1955, 2115 CST – An F0 touched down <strong>for</strong> a brief period with no reported property<br />
damages losses.<br />
May 27, 1955, 2115 CST – Another F0 touched down <strong>for</strong> a brief period with no reported property<br />
damages losses.<br />
May 30, 1956, 2045 CST – An F0 touched down <strong>for</strong> a brief period with no reported property<br />
damages losses.<br />
July 1, 1956, 1725 CST – An F2 tornado briefly touched down and destroyed barns three miles NE<br />
of Andale and resulted in $25,000 in damages.<br />
Jun 21, 1957, 2209 CST – An F0 tornado with a width of 100 yards touched down and tracked <strong>for</strong><br />
two miles resulting in approximately $2,500 in property damages.<br />
June 7, 1958, 0600 CST – An F3 tornado with a width of 1,760 yards traveled five miles and<br />
destroyed three barns at the extreme edge of SE Wichita causing one injury and approximately<br />
$25,000 in property damage.<br />
June 11, 1958, 2315 CST – An F2 tornado struck Wichita, damaged 50 homes in an eight block area<br />
on the north side of the city, caused six injuries, and approximately $250,000 in property damage.<br />
May 04, 1959, 1833 CST – An F0 tornado down <strong>for</strong> a brief period with no reported property damage<br />
losses.<br />
May 04, 1959, 1905 CST – An F0 tornado down <strong>for</strong> a brief period with no reported property damage<br />
losses.<br />
May 04, 1959, 1905 CST – Another F0 tornado down <strong>for</strong> a brief period with no reported property<br />
damage losses.<br />
April 28, 1960, 1930 CST – An F3 tornado with a width of 440 yards touched down two miles SW of<br />
St. Mark, traveling NE over a seven-mile track, and ending two miles east of Colwich. Damages<br />
APPENDIX B
included houses and a church, caused six injuries from flying glass, and approximately $25,000 in<br />
property damage.<br />
Jul 12, 1960, 1705 CST – An F1 tornado down <strong>for</strong> a brief period with only $300 in reported property<br />
damage losses.<br />
Aug 28, 1960, 1944 CST – An F1 tornado down <strong>for</strong> a brief period with only $2,500 in reported<br />
property damage losses.<br />
November 27, 1960 – An F2 tornado touched down three miles NE of Mulvane and proceeded to<br />
within one mile south of Augusta causing destruction to barns and shifting one home. Two injuries<br />
were reported from an overturned car.<br />
May 25, 1963, 1830 CST – An F0 tornado down <strong>for</strong> a brief period with only $2,500 in reported<br />
property damage losses.<br />
Apr 03, 1964, 1620 CST – An F2 tornado down <strong>for</strong> a brief period with no reported property damage<br />
losses.<br />
May 13, 1965, 2130 CST – An F3 tornado with a width of 100 yards was reported eight miles SSW of<br />
Wellington and continued on a 31 mile track northward to the west edge of Wichita. Barns were<br />
destroyed, cattle were killed, and 10 injuries from a mobile home park near Wellington were<br />
reported. Property damage was estimated at $250,000.<br />
September 3, 1965, 2000 CST – An F3 tornado traveling NE skipped <strong>for</strong> 0.5 mile on the east side of<br />
Wichita shifting homes off foundations and causing 27 injuries. Property damage was estimated at<br />
$2.5 million.<br />
September 20, 1965, 1822 CST – An F2 tornado with a width of 33 yards traveling NNE skipped<br />
over a 44 mile track starting two miles south of McConnell Air Force Base and continued NNW of<br />
Burns be<strong>for</strong>e terminating SSW of Florence. One home was unroofed and planes were destroyed at<br />
the base; however, most damages were caused by F1 intensity at losses of approximately $25,000.<br />
Sep 20, 1965, 1934 CST – An F0 tornado with a width of 33 yards touched down <strong>for</strong> a brief period,<br />
tracking one mile, with no reported property damage losses.<br />
June 23, 1969, 1600 CST – An F4 tornado with a width of 700 yards and tracked nine miles. It<br />
started SW of Goddard, moved eastward and then SE progressing to F4 strength and dissipating to<br />
a weak F0 tornado five miles SW of the Wichita Airport. Several farm homes were severely<br />
damaged or destroyed resulting in approximately $250,000 in property damages with six injuries<br />
reported.<br />
Jun 02, 1971, 1115 CST – An F0 tornado with a width of 233 yards touched down <strong>for</strong> a brief period<br />
with only $300 in reported property damage losses.<br />
May 26, 1973, 1425 CST – An F1 tornado with a width of 100 yards touched down at Cheney<br />
Reservoir and tracked <strong>for</strong> four miles. Damages included uprooting trees on shore, and striking a<br />
boat that killed three occupants.<br />
May 26, 1973, 1515 CST – An F3 tornado with a width of 400 yards touched down north of Goddard<br />
and proceeded NE <strong>for</strong> four miles. Damages included three homes destroyed, damaged six other<br />
homes, and destroying a bridge with an estimate loss of approximately $250,000. One injury was<br />
reported during this event.<br />
APPENDIX B
October 11, 1973, 1630 CST – An F2 tornado with a width of 200 yards and tracking one mile<br />
touched down. Losses of approximately $250,000 were reported from 25 trailers damaged or<br />
destroyed in the SE part of Wichita. There were 15 injuries reported.<br />
October 25, 1973, 0200 CST – An F1 tornado with a width of 100 yards touched down briefly and<br />
resulted in approximately $25,000 in property damages.<br />
May 13, 1974, 2200 CST – An F0 tornado with a width of 27 yards tracked 40 miles and resulted in<br />
approximately $2,500 in property damages.<br />
Aug 23, 1974, 1004 CST – An F1 tornado with a width of 20 yards touched down briefly and with no<br />
reported property damages.<br />
May 08, 1981, 1500 CST – An F0 tornado with a width of 17 yards touched down briefly and with no<br />
reported property damages.<br />
Jun 29, 1981, 1332 CST – An F0 tornado with a width of 17 yards touched down briefly and with no<br />
reported property damages.<br />
May 14, 1982, 1230 CST – An F0 tornado with a width of 17 yards touched down briefly and resulted<br />
in approximately $250,000 in property damages.<br />
April 29, 1984 – An outbreak of seven tornadoes of F2 intensity occurred on the east side of Wichita<br />
and traveled NE <strong>for</strong> two miles striking Eastgate Shopping Center and causing extensive damage to<br />
the businesses, a K-Mart store, and destroying mobile homes. Reports also indicated that at least<br />
20 funnels were seen during the event. A breakdown of the tornado events are shown below:<br />
1038 CST – An F0 tornado with a width of 10 yards touched down briefly and with no reported<br />
property damages.<br />
1038 CST – Another F0 tornado with a width of 10 yards touched down briefly and with no reported<br />
property damages.<br />
1040 CST – An F0 tornado with a width of 33 yards touched down briefly and resulted in<br />
approximately $300 in property damages.<br />
1050 CST – Another F0 tornado with a width of 33 yards touched down briefly and resulted in<br />
approximately $300 in property damages.<br />
1058 CST – Another F0 tornado with a width of 33 yards touched down briefly and resulted in<br />
approximately $2,500 in property damages.<br />
1100 CST – Another F1 tornado with a width of 20 yards tracked <strong>for</strong> one mile and resulted in<br />
approximately $25,000 in property damages.<br />
1105 CST – Another F0 tornado with a width of 33 yards touched down briefly and resulted in<br />
approximately $300 in property damages.<br />
1105 CST – Another F1 tornado with a width of 33 yards touched down briefly and resulted in<br />
approximately $25,000 in property damages.<br />
1110 CST – Another F2 tornado with a width of 20 yards tracked <strong>for</strong> two miles and resulted in<br />
approximately $250,000 in property damages.<br />
1425 CST – Another F0 tornado with a width of 33 yards touched down briefly with no reported<br />
property damages.<br />
1440 CST – Another F1 tornado with a width of 10 yards tracked <strong>for</strong> ten miles and resulted in<br />
approximately $25,000 in property damages.<br />
APPENDIX B
Jun 22, 1984, 1445 CST – An F0 tornado with a width of 50 yards tracked <strong>for</strong> one mile with no<br />
reported property damages.<br />
Jun 22, 1984, 1455 CST – Another F0 tornado briefly touched down with no reported property<br />
damages.<br />
Jul 05, 1987, 0520 CST – An F1 tornado with a width of 200 yards tracked <strong>for</strong> two miles and resulted<br />
in approximately $250,000 in property damages and two injuries.<br />
May 02, 1988, 1920 CST – An F1 tornado with a width of 30 yards tracked <strong>for</strong> seven miles and<br />
resulted in approximately $25,000 in property damages and two injuries.<br />
Jun 19, 1990, 2355 CST – An F0 tornado with a width of 100 yards tracked <strong>for</strong> one mile and resulted<br />
in no property damage.<br />
Mar 26, 1991, 1950 CST – An F0 tornado with a width of 73 yards tracked <strong>for</strong> two miles and resulted<br />
in no property damage.<br />
April 26, 1991 – Originating from a strong storm system causing numerous tornado outbreaks in<br />
Oklahoma, a supercell in south-central <strong>Kansas</strong> spawned several tornadoes. The first two<br />
touchdowns were NE of Anthony (F0) and NW of Argonia (F0). The third and strongest tornado<br />
started as an F1 tornado five miles south of Clearwater and quickly became a multi vortex tornado<br />
within 1.5 miles of touchdown. The tornado tracked NE <strong>for</strong> 45 miles striking the northern part of<br />
Haysville (F2-F3), continuing through McConnell Air Force Base (F3) and Andover (F5), be<strong>for</strong>e lifting<br />
north of El Dorado (F1). Damages were extensive as 233 of 241 Golden Spur Mobile Home Park<br />
homes in Andover were destroyed in addition to 84 frame homes and 14 businesses. Four people<br />
were killed in <strong>Sedgwick</strong> <strong>County</strong> in a housing development east of Wichita, and 13 people died in<br />
Butler <strong>County</strong> at the Golden Spur Mobile Home Park in Andover. Over 200 people were injured from<br />
this single tornadic event. The fourth tornado (F2) spawned by the same supercell touched down at<br />
the NE end of El Dorado Lake and moved parallel to the <strong>Kansas</strong> turnpike. In all, 21 tornadoes struck<br />
<strong>Kansas</strong> that day, with 55 tornadoes occurring nationwide. A breakdown of the tornado events are<br />
shown below:<br />
1647 CST – An F1 tornado with a width of 50 yards tracked <strong>for</strong> two miles and resulted in<br />
approximately $25,000 in property damages.<br />
1657 CST – An F5 tornado with a width of 440 yards tracked <strong>for</strong> 24 miles and resulted in<br />
approximately $250 million in property damages with four fatalities and 75 injuries reported.<br />
1710 CST – An F1 tornado with a width of 50 yards tracked <strong>for</strong> 11 miles and resulted in<br />
approximately $25,000 in property damages.<br />
1933 CST – An F0 tornado with a width of 50 yards tracked <strong>for</strong> 1 mile and resulted in approximately<br />
$2,500 in property damages.<br />
May 16, 1991, 1625 CST – Starting two miles east of Clearwater and proceeding northeast to within<br />
nine miles southeast of Wichita along a similar tracking of the April 26 th tornado, this F3 tornado with<br />
a width of 200 yards tracked 20 miles and caused about $2.5 million in property damages including<br />
20 homes.<br />
Jun 19, 1992, 0400 CST – An F0 tornado with a width of 20 yards briefly touched down with no<br />
reported property damage.<br />
Jun 19, 1992, 1105 CST – An F0 tornado with a width of 30 yards briefly touched down with only<br />
$300 in reported property damage.<br />
Sep 05, 1992, 1759 CST – An F2 tornado with a width of 200 yards tracked <strong>for</strong> three miles and<br />
resulted in approximately $25 million in property damages and one injury.<br />
APPENDIX B
Sep 05, 1992, 1918 CST – An F1 tornado with a width of 100 yards tracked <strong>for</strong> six miles and resulted<br />
in approximately $2,500 in property damages.<br />
Sep 05, 1992, 1930 CST – An F1 tornado with a width of 100 yards tracked <strong>for</strong> four miles and<br />
resulted in approximately $2.5 million in property damages.<br />
Jul 31, 1994, 1620 CST – An F0 tornado with a width of 20 yards briefly touched down from a<br />
thunderstorm 15 miles SW of Wichita with no reported property damage.<br />
May 22, 1995, 1805 CST – An F0 tornado with a width of 20 yards briefly touched down two miles<br />
north of Bentley on <strong>Sedgwick</strong> and Harvey <strong>County</strong> lines with no reported property damage.<br />
Nov 09, 1998, 1925 CST – An F0 tornado with a width of 50 yards touched down three miles NW of<br />
Clearwater and tracked <strong>for</strong> one mile causing approximately $50,000 in property damage and hitting<br />
one home.<br />
Apr 05, 1999, 0610 CST – An F0 tornado with a width of 350 yards touched down one mile south of<br />
Andale and tracked <strong>for</strong> two miles causing approximately $100,000 in property damage. The tornado,<br />
embedded in strong downburst winds, inflicted minor damage to three houses, one silo, and one<br />
trailer and to numerous trees. Synoptic-scale high winds of 39-53kts with gusts to 63kts ripped<br />
across Central <strong>Kansas</strong> from mid-morning thru late afternoon.<br />
Apr 05, 1999, 0640 CST – An F0 tornado with a width of 50 yards <strong>for</strong>med along the gust front of a<br />
downburst in East Wichita. Initial touchdown occurred just west of the East Harry/South Oliver<br />
intersection. The tornado moved northeast to the Kellogg/Oliver intersection, then almost due north<br />
to just east of the Central/Oliver intersection where it lifted. The two-mile tornado track resulted in<br />
extensive tree damage, destroyed two portable grade school classrooms, caved in the ceiling of a<br />
supermarket, and caused extensive roof damage to homes and businesses. Property damage from<br />
this event was approximately $2 million.<br />
May 3, 1999, 1930 to 1955 CST – A magnitude F4 tornado with a width of 880 yards initially touched<br />
down four miles north of Wellington in Central Sumner <strong>County</strong>. SKYWARN reports indicated the<br />
tornado crossed the Sumner/<strong>Sedgwick</strong> <strong>County</strong> line at 1930, one mile west of Peck. Moving<br />
northeast at 30kts, the tornado hit Haysville at 1935, destroying a subdivision just southwest of the<br />
South Seneca-South 87th Street intersection where the first 2 fatalities occurred in a mobile home<br />
park when a woman and her grandson were killed while running <strong>for</strong> shelter. A 6th fatality attributed<br />
to this storm resulted when an elderly man died from his injuries at a Wichita hospital on May 23rd.<br />
The tornado then moved north along South Seneca Avenue, entering the Haysville Central Business<br />
District at 1938. The 3rd fatality occurred at this point when an elderly man was killed in a mobile<br />
home at South 75th Street. At the South Seneca/South 71st Street intersection, most of the<br />
businesses were heavily damaged or destroyed. Damage summary <strong>for</strong> Haysville (damaged or<br />
destroyed): 150 homes, 27 businesses, 3 churches, 1 library, 4 historic buildings and 1 lodge. The<br />
tornado entered South Wichita at 1943 when it crossed South 55th Street. The tornado then veered<br />
slightly toward the northwest. At South 47th Street it reassumed a northeast track. Crossing<br />
MacArthur Avenue, the tornado leveled the Lakeshore and Pacesetter mobile home parks located<br />
just northeast of the South Seneca/MacArthur intersection where the 4th and 5th fatalities occurred,<br />
one at each mobile home park. At 1945, the tornado crossed the East Harry Street interchange on I-<br />
135 and continued to move northeast, lifting in the College Hill District in Northeast Wichita. Along<br />
this entire track, the tornado left a path of destruction 14 miles long and 1/4 to 1/2 mile wide.<br />
A presidential declaration (FEMA-1273-DR) was declared May 4, 1999 and covered the period<br />
May 3 through 6, 1999. Sumner and <strong>Sedgwick</strong> <strong>County</strong> were authorized<br />
APPENDIX B
to receive both public and individual<br />
assistance caused by this disaster.<br />
Damage summary <strong>for</strong> <strong>Sedgwick</strong> <strong>County</strong>:<br />
8,480 buildings (all types) damaged or<br />
destroyed. Of these, 2,456 were at least<br />
50% destroyed and 1,109 totally destroyed.<br />
There were a total of six fatalities and 150<br />
injuries reported with the storm.<br />
Jul 06, 1999, 1650 CST – An F0 tornado with a width of 55 yards touched down in open country five<br />
miles north of Wichita and tracked <strong>for</strong> one mile with no reported property damage.<br />
Jul 06, 1999, 1657 CST – An F0 tornado with a width of 55 yards touched down in north Wichita and<br />
tracked <strong>for</strong> one mile with no reported property damage.<br />
Jul 06, 1999, 1710 CST – An F0 tornado with a width of 55 yards touched down in NW Wichita and<br />
tracked <strong>for</strong> one mile with no reported property damage.<br />
May 20, 2001, 1844 CST – An F0 tornado with a width of 55 yards touched down in open country<br />
near Oaklawn and tracked <strong>for</strong> one mile with no reported property damage.<br />
Jul 09, 2003, 1830 CST – An F0 tornado with a width of 50 yards touched down two miles east of<br />
Cheney in open country and tracked <strong>for</strong> one mile and terminating two miles ESE of Cheney with no<br />
reported property damage.<br />
Jul 03, 2005, 1731 CST – An F0 tornado with a width of 55 yards touched down two miles SW of<br />
Colwich in open country and tracked <strong>for</strong> one mile with no reported property damage.<br />
Jun 12, 2008, 1935 to 1936 CST – A brief F0 tornado touched down in a wheat field approximately<br />
three miles SSW of Oaklawn and proceeded to three miles WNW of Derby. The tornado also<br />
knocked down a few power poles. Supercell thunderstorms developed along a nearly stationary<br />
frontal boundary across Central and South Central <strong>Kansas</strong> during the late afternoon hours. The<br />
highly sheared environment lead to the supercells producing tornadoes between Wichita, <strong>Kansas</strong><br />
and Winfield <strong>Kansas</strong>. The supercell thunderstorms evolved into a complex of thunderstorms during<br />
the early morning hours of June 13th, 2008. The complex of thunderstorms moved slowly over<br />
Southeast <strong>Kansas</strong> producing flash flooding. Property damage was estimated at $800.<br />
Apr 26, 2009, 1649 to 1656 CST – The F1 tornado moved southwest from six miles SSE of Garden<br />
Plain to northeast across the Lake Afton area to four miles SSW of Goddard, inflicting moderate<br />
damage to a residence. Two people were injured when their camper rolled at Lake Afton. A slow<br />
moving frontal boundary in conjunction with rich low-level moisture and various upper level<br />
disturbances resulted in numerous rounds of heavy showers and thunderstorms from the afternoon<br />
of the 25th into the evening hours of the 27th across portions of central, south-central and southeast<br />
<strong>Kansas</strong>. These storms at times produced the full gamut of severe weather, including large hail,<br />
damaging winds, tornadoes and flooding. Portions of Marion, Harvey, Butler, <strong>Sedgwick</strong> and<br />
McPherson counties were especially affected by straight-line damaging winds, as a pair or bow<br />
echoes surged east to northeast across the area, inflicting damage to numerous barns, outbuildings<br />
and some other structures, uprooting trees and downing power poles. Additionally, a handful of<br />
relatively weak, short-lived tornadoes skipped across portions of Sumner, Cowley, Butler, Marion<br />
and <strong>Sedgwick</strong> counties during the afternoon and evening hours on the 25th and 26th. A tornado near<br />
Lake Afton in southwest <strong>Sedgwick</strong> <strong>County</strong> inflicted moderate damage to a residence, and also<br />
injured two people. Furthermore, heavy thunderstorms training over the same areas produced<br />
widespread areal flooding, river flooding and flash flooding across mainly south-central, east-central<br />
and southeast <strong>Kansas</strong>. Numerous rural and city roads were flooded and subsequently closed due to<br />
high water. Various water rescues were needed <strong>for</strong> stranded motorists, as well as homeowners<br />
threatened by flood waters. Property damage was estimated at $85,000.<br />
APPENDIX B
May 15, 2009, 1631 to 1632 CST – A funnel cloud briefly touched the ground two miles WSW of<br />
Goddard and proceeded to one mile WSW of Goddard. A cold front in conjunction with rich low-level<br />
moisture and an upper level disturbance erupted a line of strong to severe thunderstorms that moved<br />
southeast across south-central and southeast <strong>Kansas</strong> during the afternoon and evening hours of the<br />
15th. Four relatively weak and brief tornadoes touched down across portions of south-central<br />
<strong>Kansas</strong>, producing no known damage. Additionally, tennis ball sized hail occurred in and around<br />
Hutchinson, and 70 mph winds occurred south of Argonia.<br />
May 10, <strong>2010</strong>, 1558 to 1607 CST – Severe thunderstorms developed during the afternoon and<br />
evening hours of May 10th, <strong>2010</strong>, ahead of an approaching dry line and warm front. This dynamic<br />
environment coupled with an unstable air mass led to the development of thunderstorms to the west<br />
and south of Wichita, <strong>Kansas</strong> with tornado producing supercells moving across portions of South<br />
Central <strong>Kansas</strong>. Two supercells in particular produced significant damage across portions of<br />
Kingman, <strong>Sedgwick</strong> and Cowley counties with some of the damage classified as EF-2 damage by<br />
survey teams. The 300 yard wide tornado developed six miles SSE of Garden Plain to five miles<br />
SSE of Goddard mainly causing damage to trees; however, a few shingles were blown off of homes<br />
in and around the tornado path with an estimated $50,000 in property damages.<br />
Sep 15, <strong>2010</strong>, 1728 to 1736 CST – A combination of a low pressure area along the <strong>Kansas</strong><br />
Oklahoma border, and an outflow boundary across South Central <strong>Kansas</strong>, led to the development of<br />
supercell thunderstorms across South Central <strong>Kansas</strong>. The supercells thunderstorms were noted <strong>for</strong><br />
a swath of very large hail that extended from West Wichita to near Udall <strong>Kansas</strong>. Numerous reports<br />
of grapefruit or larger hail were reported across Wichita, with one such hail stone in West Wichita,<br />
<strong>Kansas</strong>, breaking the state record <strong>for</strong> diameter of 7.75 inches. A few weak tornadoes were also<br />
produced, with all the tornadoes moving across open country from one mile west of Haysville to one<br />
mile WNW of Haysville, and another three miles SSW of Haysville. One F0 tornado was also visible<br />
six miles SSE of Derby to 6 miles southeast of Derby.<br />
References:<br />
NOAA National Weather Service, National Climatic Data Center<br />
Grazulis, T. P. (1993). Significant Tornadoes 1680-1991. Vermont: The Tornado Project.<br />
APPENDIX B