title - Acta Metallurgica Slovaca
title - Acta Metallurgica Slovaca
title - Acta Metallurgica Slovaca

You also want an ePaper? Increase the reach of your titles
YUMPU automatically turns print PDFs into web optimized ePapers that Google loves.
<strong>Acta</strong> <strong>Metallurgica</strong> <strong>Slovaca</strong>, Vol. 18, 2012, No.2-3, p. 100-108 100<br />
THERMAL DIFFUSION OF ZINC FROM ZINC-CONTAINING BOROSILICATE<br />
GLASS INTO CADMIUM CHALCOGENIDE NANOCRYSTALS<br />
Yu.M. Azhniuk 1)* , V. Stoyka 2) , V.V. Lopushansky 1) , I. Petryshynets 2) , F. Kováč 2) , A.V.<br />
Gomonnai 1) , D.R.T. Zahn 3)<br />
1) Institute of Electron Physics, Ukr. Nat.Acad. Sci., Universytetska Str. 21, Uzhhorod, 88017,<br />
Ukraine<br />
2) Institute of Materials Science, Slovak Academy of Sciences, Watsonova 47, Košice 04001,<br />
Slovakia<br />
3) Semiconductor Physics, Chemnitz University of Technology, D-09107, Chemnitz, Germany<br />
Received 24.11.2011<br />
Accepted 06.03.2012<br />
*Corresponding author: e-mail: yu.azhniuk@gmail.com, telephone: +380 312 643822, fax:<br />
+380 312 643650, Institute of Electron Physics, Ukr. Nat.Acad. Sci., Universytetska Str. 21,<br />
Uzhhorod, 88017, Ukraine<br />
Abstract<br />
Studies of Raman scattering spectra and scanning electron microscopy imaging combined with<br />
energy-dispersive X-ray spectroscopy data of II-VI semiconductor nanocrystals formed in zinccontaining<br />
borosilicate glass matrix are carried out. It is shown that diffusion of zinc from the<br />
matrix at 625 to 700 C results in the formation of mixed Cd 1-y Zn y S 1-x Se x nanocrystals with Zn<br />
content up to 30 %, as determined from the LO phonon frequencies. An increase of the Zn<br />
content in the nanocrystals with the thermal treatment temperature and duration is observed. A<br />
uniform distribution of zinc over the nanocrystal volume is assumed based on the diffusion<br />
coefficient data.<br />
Keywords: interface diffusion, annealing, scanning electron microscopy (SEM), energy<br />
dispersive X-ray spectroscopy (EDXS), compound semiconductors,<br />
nanocrystalline materials, Raman spectroscopy.<br />
1 Introduction<br />
Diffusion-limited growth from a supersaturated solution in a silicate glass is a well-known<br />
technique to obtain dilute semiconductor nanocrystals embedded in a dielectric matrix [1–6]. It<br />
is well elaborated for fabrication of binary and ternary II-VI cadmium chalcogenide nanocrystals<br />
in borosilicate glass traditionally used as optical cutoff filters in the spectral range from yellow<br />
to near infrared and considered as promising materials for non-linear optical applications [4].<br />
Diffusion-limited growth takes place at thermal treatment in the range from 500 to 700 C. The<br />
average size of nanocrystals increases with the thermal treatment temperature and duration.<br />
Several studies were devoted to the dependence of ternary (mostly CdS 1-x Se x ) nanocrystal<br />
composition on the thermal treatment parameters [5, 6]. Besides, experimental evidence for zinc<br />
incorporation from zinc-containing matrices into CdS [7–10] and CdS 1-x Se x [11, 12] nanocrystals<br />
was reported.<br />
Here we report on scanning electron microscopy and Raman scattering studies of thermal<br />
diffusion of zinc into II-VI nanocrystals in zinc-containing borosilicate glass and formation of<br />
ternary (Cd 1–x Zn x S) and quaternary (Cd 1–y Zn y S 1-x Se x ) nanocrystals.
<strong>Acta</strong> <strong>Metallurgica</strong> <strong>Slovaca</strong>, Vol. 18, 2012, No.2-3, p. 100-108 101<br />
2 Materials and experimental methods<br />
II-VI nanocrystals were obtained in borosilicate glass by diffusion-limited growth from<br />
commercially available LZOS or Schott cutoff filters which were heated to 1000 C for 2 h. This<br />
resulted in the glass melting and decolouring, the existing nanocrystals were thus dissolved in<br />
the borosilicate glass, providing a random distribution of cadmium and chalcogen atoms over the<br />
borosilicate glass structural network. After rapid quenching the obtained colourless transparent<br />
glass samples were cut into pieces and subjected to thermal treatment at controlled temperatures<br />
within the range from 600 to 700 C. Consequently, batches of samples prepared from the same<br />
initial mixture at different thermal treatment temperatures and durations were obtained.<br />
Scanning electron microscopy (SEM) studies combined with energy dispersive X-ray<br />
spectroscopy (EDX) were performed using a SEM JEOL 7000F microscope.<br />
Raman spectra were measured using a Dilor XY 800 spectrometer with a CCD camera, the<br />
excitation was provided by an Ar + laser ( exc = 457.9, 476.5, 488 and 514.5 nm). The<br />
instrumental width was better than 2.5 cm –1 . No noticeable differences were revealed between<br />
the spectra measured in macro-and micro-Raman scattering configurations. In many cases the<br />
Raman spectra were observed with a background of a broad phtoluminescence band which was<br />
subsequently subtracted for the analysis of the Raman spectra. Optical absorption spectra were<br />
measured with a LOMO MDR-23 spectrometer. All measurements were carried out at 293 K.<br />
3 Results and discussion<br />
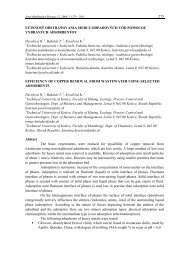
As can be seen from Fig. 1, SEM studies combined with EDX elemental analysis enabled us to<br />
choose samples where the glass matrix contained a considerable amount of zinc. Note that no<br />
traces of cadmium, sulphur, or selenium could be noticed from the EDX data since the cadmium<br />
chalcogenide fraction in the glass matrix does not exceed 1 % which is below the measurement<br />
sensitivity level.<br />
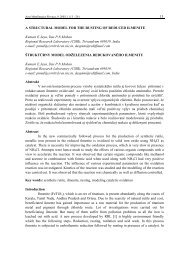
Optical absorption spectra of samples obtained from the same batch of the zinc-containing glass<br />
doped with Cd, S, and Se at various thermal treatment durations and temperatures are shown in<br />
Fig. 2. A sharp edge observed in the absorption spectrum is evidence for the formation of II-VI<br />
semiconductor nanocrystals in the glass matrix. If the average nanocrystal radius is below the<br />
Bohr exciton radius for the given compound one can observe characteristic confinement-related<br />
maxima at the absorption edge at the energies given by [13]<br />
E<br />
( ne<br />
, le<br />
),( nh<br />
, lh<br />
)<br />
E<br />
b<br />
2 2<br />
ne<br />
, le<br />
2<br />
nh<br />
, lh<br />
2 * *<br />
2r<br />
me<br />
mh<br />
(1.)<br />
where E b is the energy gap for the bulk material, r is the nanocrystal radius, n,l are spherical<br />
Bessel function roots for the corresponding quantum numbers, m * e and m * h are effective masses<br />
of electrons and holes, respectively. One can estimate the average nanocrystal radius from the<br />
most pronounced first confinement-related maximum energy position E 1 ( n,l =1). Besides, since<br />
the II-VI nanocrystals undergo a considerable (near 0.5 GPa) pressure from the glass matrix (due<br />
to the difference in thermal expansion coefficients of the semiconductor nanocrystals and the<br />
matrix), one should take into account the pressure-related energy gap variation<br />
E :<br />
p<br />
g<br />
E<br />
1<br />
E<br />
b<br />
E<br />
p<br />
g<br />
2<br />
1 1 . (2.)<br />
2 * *<br />
2r<br />
me<br />
mh
<strong>Acta</strong> <strong>Metallurgica</strong> <strong>Slovaca</strong>, Vol. 18, 2012, No.2-3, p. 100-108 102<br />
Fig.1 SEM images of two zinc-containing borosilicate glass samples as well as their EDX<br />
spectra with the corresponding elemental composition determined from the EDX data.<br />
Fig.2 Optical absorption spectra of zinc-containing borosilicate glass doped with Cd, S,<br />
and Se, after heat treatment.<br />
As can be seen from Fig. 2, a considerable red shift of the optical absorption edge and the<br />
confinement-related maxima with the thermal treatment duration and temperature T a is the<br />
evidence for the increase in average nanocrystal size.<br />
The most efficient and reliable technique to determine the composition of mixed II-VI<br />
semiconductor nanocrystals grown in a glass matrix is Raman spectroscopy which is especially<br />
well elaborated for CdS 1-x Se x nanocrystals [14–17]. The CdS 1-x Se x mixed crystal system exhibits<br />
two-mode compositional behaviour of the phonon spectrum containing CdSe-like TO 1 and LO 1<br />
as well as CdS-like TO 2 and LO 2 phonon modes [14–17]. Meanwhile, Cd 1-y Zn y S [7–10] and<br />
Cd 1-y Zn y Se [18–20] ternary systems reveal a one-mode behaviour with only one pair of TO and<br />
LO phonons for each intermediate composition, both frequencies gradually increasing with y.
<strong>Acta</strong> <strong>Metallurgica</strong> <strong>Slovaca</strong>, Vol. 18, 2012, No.2-3, p. 100-108 103<br />
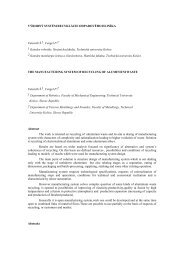
Fig.3 Raman spectra of Cd 1-y Zn y S nanocrystals formed in zinc-containing borosilicate glass<br />
doped with Cd and S, under thermal treatment (a) and compositional dependence of LO<br />
(solid line) and TO (dashed line) phonon frequencies in Cd 1-y Zn y S (b). The spectra were<br />
measured using excitation with exc = 457.9 nm.<br />
The fraction of the semiconductor phase in II-VI nanocrystal-doped borosilicate glass is usually<br />
very small (below 1 %), hence resonance Raman scattering conditions are important in order to<br />
obtain a reliably detectable Raman signal. Therefore, only LO phonon maxima are observed in<br />
their Raman spectra since the resonance Raman enhancement is much more pronounced for LO<br />
phonons [17]. In the two-mode systems, like CdS 1-x Se x , the nanocrystal composition can be<br />
determined from the LO phonon peak frequency in the Raman spectra, or, more exactly, from<br />
the difference of frequencies of the two LO phonon peaks [14]. In this case the specific effects<br />
of phonon confinement [16, 17], surface phonon scattering [15, 16], and glass matrix pressure<br />
[21] are better taken into account. With regard to one-mode systems, the nanocrystal<br />
composition can be estimated from the frequency of the sole LO phonon in the Raman spectrum.<br />
Fig. 3 a illustrates the experimental first-order Raman spectra of Cd- and S-doped zinccontaining<br />
borosilicate glass subjected to intense thermal treatment. The least intense thermal<br />
treatment results in the appearance of a Raman peak at 305 cm –1 which corresponds to the LO<br />
phonon of CdS nanocrystals. The increase of the thermal treatment duration and temperature<br />
results in an increase of the LO phonon peak frequency. This can be explained by annealinginduced<br />
partial substitution of one of the nanocrystal lattice components by lighter atoms. This<br />
cannot be attributed to partial replacement of sulphur in the nanocrystals by oxygen from the<br />
glass matrix. Such anion substitution should also have been observed for nanocrystals grown in<br />
zinc-free borosilicate matrix while neither our earlier experiments for such systems [6, 22], nor<br />
studies performed by other groups [5, 23] have revealed any evidence for annealing-induced<br />
increase of LO phonon frequency for glass-embedded II-VI nanocrystals which could be related<br />
to substitution of sulphur by oxygen from the glass matrix. Hence, we conclude that the thermal<br />
treatment results in a partial substitution of Cd in the nanocrystals by Zn from the matrix and<br />
formation of Cd 1-y Zn y S nanocrystals. Knowing the compositional dependence of the LO phonon
<strong>Acta</strong> <strong>Metallurgica</strong> <strong>Slovaca</strong>, Vol. 18, 2012, No.2-3, p. 100-108 104<br />
frequency in Cd 1-y Zn y S (Fig. 3, b) based on the known Raman data for CdS [24] and ZnS [25] as<br />
well as for the mixed crystals [7], one can evaluate the nanocrystal composition. The values<br />
corresponding to the experimental data are shown by circles in Fig. 3, b and given explicitly in<br />
the spectra of Fig. 3a. It should be noted that in our earlier paper [10] the concentration of zinc<br />
in Cd 1-y Zn y S nanocrystals was noticeably underestimated due to a computational error.<br />
A similar behaviour of Raman spectra is observed for zinc-containing borosilicate glass doped<br />
with Cd, S, and Se where two LO phonon peaks are observed in the first-order Raman scattering<br />
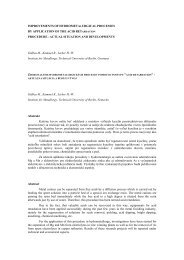
spectra. It can be seen from Fig. 4a that for the least intensely annealed sample (625 C, 2 h),<br />
CdSe-like LO 1 and CdS-like LO 2 phonon peaks are observed at 194 and 287.5 cm –1 . As follows<br />
from the comparison with the known data for CdS 1-x Se x nanocrystals grown in a glass matrix<br />
[14, 26], the difference of these frequencies, as the most reliable measure of the chemical<br />
composition of glass-embedded ternary nanocrystals with a two-mode behaviour [14, 16, 26],<br />
corresponds to a selenium content of x=0.38 0.03. The corresponding composisional<br />
dependence of the LO 1 and LO 2 phonon frequencies in CdS 1-x Se x nanocrystals is shown by solid<br />
lines in Fig. 4 b, and the open circles (denoting the experimentally observed LO 1 and LO 2<br />
phonon frequencies for the least intensely annealed sample) show a good agreement with it.<br />
Fig.4 Raman spectra of Cd 1-y Zn y S 0.62 Se 0.38 nanocrystals formed in borosilicate glass under<br />
thermal treatment (a) and compositional dependence of LO (solid lines) and TO<br />
(dashed lines) phonon frequencies in CdS 1-x Se x and the data obtained for the<br />
Cd 1-y Zn y S 0.62 Se 0.38 nanocrystals (b). The spectra were measured using excitation with<br />
exc = 488 nm.<br />
With increasing thermal treatment duration or temperature T a , both peaks shift towards higher<br />
frequencies, indicating partial substitution of atoms in CdS 1-x Se x nanocrystals by lighter species<br />
which, in view of the above discussed reasons, is evidently zinc. Thus, due to the diffusion of<br />
zinc from the matrix, quaternary Cd 1-y Zn y S 1-x Se x nanocrystals are formed. Zn content in the<br />
nanocrystals can be evaluated from the LO phonon frequencies in the Raman spectra. The<br />
phonon frequencies in the spectra increase with and T a , being evidence for the increase of zinc<br />
concentration y in the nanocrystals. Since the difference between the LO 2 and LO 1 phonon
<strong>Acta</strong> <strong>Metallurgica</strong> <strong>Slovaca</strong>, Vol. 18, 2012, No.2-3, p. 100-108 105<br />
frequencies remains practically unchanged, one can assume that the S/Se concentration ratio in<br />
the nanocrystals remains constant with and T a . This is apparent from the experimental points in<br />
Fig. 4,b while moving from open circles to dark circles and further to open and dark triangles.<br />
Based on the two-mode behaviour of CdS 1-x Se x and ZnS 1-x Se x as well as on the one-mode<br />
behaviour of Cd 1-y Zn y S and Cd 1-y Zn y Se systems, one can reasonably assume that the quaternary<br />
Cd 1-y Zn y S 1-x Se x system possesses two-mode compositional behaviour with respect to x with<br />
selenide-like (LO 1 ) and sulphide-like (LO 2 ) phonons, each of them exhibiting one-mode-like<br />
frequency shift with y. For one-mode Cd 1-y Zn y S and Cd 1-y Zn y Se ternary systems the<br />
compositional shift of the LO phonon frequencies is monotonous and the zinc-induced<br />
increment is given by<br />
= 91.4y–44.2y 2 (cm –1 ) (for Cd 1-y Zn y S [9]), (3.)<br />
= 51y–9y 2 (cm –1 ) (for Cd 1-y Zn y Se [18]). (4.)<br />
By weighing Eqs. (3) and (4) by compositional factors (1–x) and x, respectively, the<br />
dependences of the selenide-like LO 1 and sulphide-like LO 2 phonon frequencies on the Zn<br />
content y for Cd 1-y Zn y S 1-x Se x nanocrystals were obtained [12]. The corresponding values for the<br />
samples under investigation are shown in Fig. 4.<br />
However, a parallel upward shift of both LO 1 and LO 2 phonon peaks with heat treatment,<br />
consistent with the Cd Zn substitution in the nanocrystals, is observed only for the samples<br />
with comparable content of S and Se (in our case, x=0.38). For the samples with strong<br />
predominance of sulphur over selenium or vice versa a clear shift with Zn content increase is<br />
observed only for the LO phonon which corresponds to the predominant chalcogen (CdS-like or<br />
CdSe-like, respectively). Meanwhile, the "minority" LO phonon maximum (CdSe-like for S-rich<br />
and CdS-like for Se-rich Cd 1-y Zn y S 1-x Se x nanocrystals) exhibits a much smaller shift with heat<br />
treatment or sometimes even does not shift in frequency at all. Such situation is illustrated by<br />
Fig. 5 where the Raman spectra of a series of samples prepared from the same Cd-, Se-, and S-<br />
doped borosilicate glass (with Se content strongly prevailing over S) at different thermal<br />
treatment parameters and T a are shown. It is obvious that the frequency of LO 1 phonon<br />
corresponding to the predominant Se chalcogen, shifts with annealing from 203 to 220 cm –1<br />
while the overall variation of the frequency of LO 2 phonon corresponding to the minority<br />
chalcogen (sulphur) varies only within 2–3 cm –1 .<br />
A reasonable explanation of such behaviour can be proposed in view of our recent results<br />
showing that the composition of CdS 1-x Se x nanocrystals prepared from the same initial mixture<br />
depends on the thermal treatment parameters ( and T a ) and on the ratio of S and Se content in<br />
the initial mixture [6]. Namely, with increasing and T a the content of the predominant<br />
chalcogen in the nanocrystals increases while the minority chalcogen is pushed out into the<br />
matrix. Hence, the increase of the predominant chalcogen (in this case – Se) concentration in the<br />
nanocrystals with and T a results in the LO 1 and LO 2 phonon band convergence, as follows<br />
from the two-mode behaviour, while a simultaneous effect of increasing zinc diffusion with<br />
and T a leads to the upward shift of both LO phonon peaks. This finally results in the observed<br />
considerable shift of the selenide-like LO 1 phonon band and the tiny variation of the LO 2 phonon<br />
frequency. Taking into account the two effects enabled us to estimate sulphur and selenium<br />
content for the nanocrystals of each sample from the LO 2 and LO 1 phonon frequency difference<br />
while zinc content y was evaluated from Eqs. (3) and (4) weighed by the corresponding (1–x)<br />
and x factors. The points in Fig. 5, b clearly show the increase of the Zn-induced increment of<br />
the LO 1 and LO 2 phonon frequencies over the corresponding values for CdS 1-x Se x nanocrystals<br />
with and T a (from open circles to dark circles, triangles and squares).
<strong>Acta</strong> <strong>Metallurgica</strong> <strong>Slovaca</strong>, Vol. 18, 2012, No.2-3, p. 100-108 106<br />
Fig.5 Raman spectra of Se-rich Cd 1-y Zn y S 1-x Se x nanocrystals formed in zinc-containing<br />
borosilicate glass doped with Cd, S, and Se, under thermal treatment (a) and<br />
compositional dependence of LO (solid lines) and TO (dashed lines) phonon<br />
frequencies in CdS 1-x Se x along with the experimental data for the Cd 1-y Zn y S 1-x Se x<br />
nanocrystals (b). The spectra were measured using excitation with exc = 488.0 nm.<br />
The increase of zinc amount in the nanocrystals is not linear with the heat treatment duration<br />
(Fig. 6). At T a = 625 C the limiting Zn concentration y = 0.19 is reached at 8 h. At higher<br />
temperatures the trend is similar, however, higher limiting Zn content values can be reached.<br />
Fig.6 Dependence of Zn content in Se-rich Cd 1-y Zn y S 1-x Se x nanocrystals on the heat treatment<br />
duration (T a = 625 C).<br />
Formation of II–VI nanocrystals in silicate glasses is generally known to comprise three stages –<br />
nucleation, diffusion-limited growth and coalescence (competitive growth, or Ostwald ripening)<br />
[2–4]. The mechanisms of nucleation and growth for Cd 1–y Zn y S and CdS 1-x Se x nanocrystals in<br />
glass matrices are stated to be quite different. Namely, in Cd 1–y Zn y S a stage of homogeneous<br />
nucleation is followed by a rapid transition to ripening while CdS 1-x Se x nanocrystals undergo<br />
nucleation and growth simultaneously with a gradual transition into the ripening stage [5]. One<br />
can expect the growth pattern for quaternary Cd 1-y Zn y S 1-x Se x nanocrystals to be somewhat<br />
intermediate, possessing features of both types. In our opinion, fruitful discussion on the<br />
competing mechanisms of Cd 1-y Zn y S 1-x Se x nanocrystals growth requires further studies with an<br />
extended set of techniques as well as for a variety of samples with a wider range of x and y.
<strong>Acta</strong> <strong>Metallurgica</strong> <strong>Slovaca</strong>, Vol. 18, 2012, No.2-3, p. 100-108 107<br />
Substitution of Cd by Zn due to thermal diffusion was also reported for CdSe/ZnSe quantum<br />
structures grown by molecular-beam epitaxy [27] as well as in CdSe/ZnSe [28] and CdSe/ZnS<br />
[29] core/shell nanostructures where Zn atoms from the shell partly replace Cd in the core. An<br />
important issue for the discussion of our results is whether within a glass-embedded nanocrystal<br />
the distribution of zinc is homogeneous or does it concentrate mostly at the surface. Such effect<br />
is not untypical for diffusion of ions from the matrix or substrate into nanocrystals. For example,<br />
interdiffusion-related inhomogeneous distribution of atoms in Si 1–x Ge x nanoislands grown by<br />
molecular beam epitaxy on Si substrate was reported [30]. Therefore, following Ref. 9, we tried<br />
to estimate the duration of cation mixing within a particle at the growth temperature. We did not<br />
manage to find the explicit value for zinc diffusion coefficient D in CdS or CdSe, hence we tried<br />
to make some estimations using the known expressions for cation self-diffusion in ZnS<br />
D = 4.5 10 –3 exp[–(0.69 eV/kT)] cm 2 s –1 (below 850 C) [31]. The estimated D for our data<br />
ranged from 1.2 10 –8 cm 2 s –1 (625 C) to 4.8 10 –8 cm 2 s –1 (700 C). Hence, in assumption of the<br />
diffusion process uniformity over the crystallite volume, for the growth duration and<br />
temperature T a employed, the diffusion length L=(D ) 1/2 ranged from 1.2 10 –4 cm (625 C, 2 h)<br />
to 7.6 10 –4 cm (700 C, 12 h). As the average nanocrystal diameter ranged from 4 10 –7 cm (the<br />
lowest T a and the shortest ) to 9 10 –7 cm (the most intense heat treatment, 700 C, 12 h), the<br />
duration of Zn cation diffusion through a nanocrystal is less than 1 min. Hence, the duration for<br />
the complete mixing of cations in the nanocrystals is much shorter than the heat treatment<br />
duration. Therefore, homogeneous distribution of zinc within a nanocrystal can be assumed.<br />
However, specific features of the nanocrystal/matrix interface can generally favour nearinterface<br />
location of one sort of cations. This issue requires more detailed studies, especially by<br />
X-ray absorption spectroscopy. It is also the question of further studies whether the limit of zinc<br />
content in the nanocrystals is determined only by the glass matrix composition and ratio of Cd<br />
and Zn concentrations in the initial mixture, or whether it is restricted by any other effect.<br />
4 Conclusions<br />
The performed Raman scattering studies and SEM imaging data combined with EDX analysis<br />
have shown that diffusion of zinc from borosilicate glass matrix to CdS 1-x Se x nanocrystals being<br />
formed in the course of diffusion-limited growth at 625–700 C results in the formation of<br />
mixed Cd 1-y Zn y S 1-x Se x nanocrystals with zinc content up to 30 %. The latter can be efficiently<br />
evaluated from the LO phonon frequencies in the Raman spectra. An increase of Zn content in<br />
the nanocrystals with the thermal treatment temperature and duration is observed. A uniform<br />
distribution of zinc over the nanocrystal volume is assumed based on the diffusion coefficient<br />
data. More detailed studies are required to find out whether the growth mechanism for these<br />
quaternary nanocrystals is predominantly homogeneous or heteogeneous.<br />
References<br />
[1] N.F. Borrelli, D. Hall, H. Holland, D. Smith: Journal of Applied Physics, Vol. 61, 1987,<br />
No. 12, p. 5399-5409<br />
[2] L.-C. Liu, S.H. Risbud: Journal of Applied Physics, Vol. 68, 1990, No. 1, p. 28-32<br />
[3] A. Ekimov: Journal of Luminescence, Vol. 70, 1996, No. 1–6, p. 1-20<br />
[4] U. Woggon: Optical properties of semiconductor quantum dots. first ed., Springer, Berlin,<br />
1997<br />
[5] M. H. Yükselici: Journal of Physics: Condensed Matter, Vol. 13, 2001, No. 27,<br />
p. 6123-6131<br />
[6] Yu.M. Azhniuk et al.: Journal of Crystal Growth, Vol. 312, 2010, No. 10, p. 1709-1716
<strong>Acta</strong> <strong>Metallurgica</strong> <strong>Slovaca</strong>, Vol. 18, 2012, No.2-3, p. 100-108 108<br />
[7] H. Yükselici, P.D. Persans, T.M. Hayes: Physical Review B, Vol. 52, 1995, No 16,<br />
p. 11763-11772<br />
[8] M. Rajalakshmi, T. Sakuntala, A.K. Arora: Journal of Physics: Condensed Matter, Vol. 9,<br />
1997, No. 45, p. 9745-9757<br />
[9] P. D. Persans, L. B. Lurio, J. Pant, G. D. Lian, T. M. Hayes: Physical Review B, Vol. 63,<br />
2001, No. 11, p. 115320-1-115320-8<br />
[10] Yu.M. Azhniuk, A.V. Gomonnai, Yu.I. Hutych, V.V. Lopushansky, I.I. Turok, D.R.T.<br />
Zahn: Journal of Physics: Conference Series, Vol. 92, 2007, No. 1, p. 012044-1012044-4<br />
[11] Yu.M. Azhniuk et al.: Physica Status Solidi A, Vol. 201, 2004, No. 7, p. 1578-1587<br />
[12] Yu.M. Azhniuk, A.G. Milekhin, A.V. Gomonnai, Yu.I. Hutych, V.V. Lopushansky,<br />
D.R.T. Zahn: Physica Status Solidi C, Vol. 6, 2009, No. 9, p. 2068-2071<br />
[13] S. V. Gaponenko: Optical Properties of Semiconductor Nanocrystals. first ed., Cambridge,<br />
Cambridge University Press, 1998<br />
[14] A. Tu, P.D. Persans: Applied Physics Letters, Vol. 58, 1991, no. 14, p. 1506–1508<br />
[15] A. Mlayah, A.M. Brugman, R. Carles, J.B. Renucci, M.Ya. Valakh, A.V. Pogorelov: Solid<br />
State Communications, Vol. 90, 1994, No. 9, p. 567-570<br />
[16] A. Roy, A. K. Sood: Physical Review B, Vol. 53, 1996, No. 18, p. 12127-12132<br />
[17] A. Ingale, K. C. Rustagi: Physical Review B, Vol. 58, 1998, No. 11, p. 7197-7204<br />
[18] O. Brafman: Solid State Communications, Vol. 11, 1972, No. 4, p. 447-451<br />
[19] W. Meredith et al.: Journal of Crystal Growth, Vol. 159, 1996, No. 1-4, p. 103-107<br />
[20] L.K. Vodopyanov, N.N. Melnik, Yu.G. Sadof'ev: Semiconductors, Vol. 33, 1999, No. 3,<br />
p. 283-286<br />
[21] G. Scamarcio, M. Lugara, D. Manno: Physical Review B, Vol. 45, 1992, No. 23,<br />
p. 13792-13795<br />
[22] Yu.M. Azhniuk, V.V. Lopushansky, A.V. Gomonnai, V.O. Yukhymchuk, I.I. Turok, Ya.I.<br />
Studenyak: Journal of Physics and Chemistry of Solids, Vol. 69, 2008, No. 1, p. 139-146<br />
[23] W.S.O. Rodden, C.N. Ironside, C.M. Sotomayor Torres: Semiconductor Science and<br />
Technology, Vol. 9, 1994, No. 10, p. 1839-1842<br />
[24] B. Tell, T.C. Damen, S.P.S. Porto: Physical Review, Vol. 144, 1966, No. 2, p. 771-774<br />
[25] O. Brafman, S. S. Mitra: Physical Review, Vol. 171, 1968, No. 3, p. 931-934<br />
[26] Yu.M. Azhniuk et al: Journal of Physics: Condensed Matter, vol. 16, 2004, No. 49,<br />
p. 9069-9082<br />
[27] T. Passow et al.: Physical Review B, Vol. 64, 2001, No. 19, p. 193311-1-193311-4<br />
[28] H. Lee, P.H. Holloway, H. Yang, L. Hardison, V.D. Kleiman: Journal of Chemical Physics,<br />
Vol. 125, 2006, No. 16, p. 164711-1-164711-8<br />
[29] V.M Dzhagan, M.Ya. Valakh, A.E. Raevskaya, A.L. Stroyuk, S.Ya. Kuchmiy, D.R.T. Zahn:<br />
Nanotechnology, Vol. 18, 2007, No. 28, p. 285701-1-285701-7<br />
[30] M.Ya. Valakh et al.: Nanotechnology, vol. 16, 2005, No. 9, p, 1464-1468<br />
[31] K. Lott, T. Nirk, O. Volobujeva: Crystal Engineering, Vol. 5, 2002, No. 3-4, p. 147-153<br />
Acknowledgements<br />
The research was in part performed in the framework of Slovak-Ukrainian Research and<br />
Development Cooperation project No. SK-UA-0024-09. The first author is grateful to Deutsche<br />
Forschungsgemeinschaft for the support of his research in Chemnitz University of Technology.