Variation in Populations.pdf
Variation in Populations.pdf
Variation in Populations.pdf

Create successful ePaper yourself
Turn your PDF publications into a flip-book with our unique Google optimized e-Paper software.
<strong>Variation</strong> <strong>in</strong> <strong>Populations</strong><br />
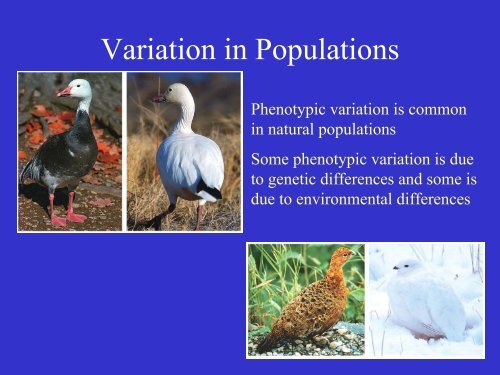
Phenotypic variation is common<br />
<strong>in</strong> natural populations<br />
Some phenotypic variation is due<br />
to genetic differences and some is<br />
due to environmental differences
Commonly, phenotypic<br />
variation has an<br />
underly<strong>in</strong>g genetic basis<br />
but is polygenic with<br />
many genes <strong>in</strong>fluenc<strong>in</strong>g<br />
the phenotype.<br />
<strong>Variation</strong> that has an<br />
underly<strong>in</strong>g genetic basis<br />
is important<br />
evolutionarily. The<br />
frequency of different<br />
forms of a gene can<br />
change.
Dist<strong>in</strong>guish<strong>in</strong>g between genetic and environmental sources of<br />
variation can be accomplished <strong>in</strong> several ways:<br />
1. Controlled crosses - cross<strong>in</strong>g <strong>in</strong>dividuals of different<br />
phenotypes to produce an F1 and F2 generation can show that<br />
variation segregates <strong>in</strong> an Mendelian fashion (3:1, 1:2:1, 9:3:3:1,<br />
etc.)<br />
2. Correlation between relatives. On average parents and<br />
children share half their genes. Genetically identical tw<strong>in</strong>s<br />
should be identical for genetically determ<strong>in</strong>ed traits.<br />
12<br />
Ideally, relatives should<br />
10<br />
be reared <strong>in</strong> different<br />
8<br />
6<br />
environments to<br />
4<br />
r = 1<br />
dist<strong>in</strong>guish genetic and<br />
2<br />
0<br />
environmental sources<br />
0 5 10 15<br />
Tw<strong>in</strong> 1<br />
of variation..<br />
Tw<strong>in</strong> 2
3. Common garden study - variation seen between two different<br />
natural populations could be due to genetic differences or due to<br />
the differences <strong>in</strong> the environments that <strong>in</strong>fluence the phenotype.<br />
To dist<strong>in</strong>guish between them, <strong>in</strong>dividuals from both populations<br />
can be reared <strong>in</strong> a common environment.<br />
Lake Verret<br />
Reelfoot Lake<br />
Wild Offspr<strong>in</strong>g Mass 0.81 mg 0.93 mg<br />
Common Garden Mass 0.66 mg 0.79 mg<br />
The difference <strong>in</strong> offspr<strong>in</strong>g size<br />
rema<strong>in</strong>s (there is a genetic basis<br />
for the difference) but the<br />
offspr<strong>in</strong>g were not as large as<br />
found <strong>in</strong> natural populations (there<br />
is also a environmental effect on<br />
offspr<strong>in</strong>g size).
How Genetic <strong>Variation</strong> Behaves <strong>in</strong> Natural <strong>Populations</strong> - the<br />
Hardy We<strong>in</strong>berg Pr<strong>in</strong>ciple.<br />
Regardless of the <strong>in</strong>itial distribution of genotypes, one generation<br />
of random mat<strong>in</strong>g will produce a b<strong>in</strong>omial distribution of alleles<br />
among genotypes - and this distribution will persist <strong>in</strong>def<strong>in</strong>itely ...
… so long as mat<strong>in</strong>g is random, the population is very large, there<br />
is no <strong>in</strong>put of alleles from other populations, there is no<br />
mutational change <strong>in</strong> alleles, and there is no differential survival<br />
or reproduction of different genotypes.<br />
Violation of any of these requirements can result <strong>in</strong> a distribution of<br />
genotypes other than b<strong>in</strong>omial or can result <strong>in</strong> a change <strong>in</strong> the<br />
frequencies of alleles from one generation to the next, i.e. evolution.<br />
Non-random mat<strong>in</strong>g can take several forms - like mat<strong>in</strong>g with like,<br />
like mat<strong>in</strong>g with non-like, or any active preference of certa<strong>in</strong><br />
phenotypes for mates.<br />
Inbreed<strong>in</strong>g - the mat<strong>in</strong>g of close relatives - is a type of nonrandom<br />
mat<strong>in</strong>g that can be detected by exam<strong>in</strong><strong>in</strong>g genotypic frequencies - the<br />
frequency of heterozygotes is less than expected for a randomly<br />
mat<strong>in</strong>g population.
The difference between the observed frequency of heterozygotes<br />
(H) and the expected frequency of heterozygotes (H 0 - if mat<strong>in</strong>g<br />
was random) relative to the expected frequency (H 0 ) is a measure<br />
of <strong>in</strong>breed<strong>in</strong>g - the <strong>in</strong>breed<strong>in</strong>g coefficient (F).<br />
F<br />
=<br />
H<br />
−<br />
H<br />
0<br />
0<br />
H<br />
If <strong>in</strong>breed<strong>in</strong>g is<br />
the cause of the<br />
heterozygote<br />
deficiency, then<br />
F should be<br />
nearly the same<br />
for all genes.
Studies of <strong>in</strong>bred l<strong>in</strong>es of Drosophila revealed that heterozygotes<br />
often have higher viability than homozygotes. There is a large of<br />
amount of deleterious genetic variation <strong>in</strong> natural populations that<br />
is not expressed <strong>in</strong> heterozygotes.<br />
Other studies have<br />
confirmed the high<br />
degree of deleterious<br />
recessive genetic<br />
variation <strong>in</strong> wild<br />
populations of other<br />
organisms.
Inbreed<strong>in</strong>g results <strong>in</strong> greater expression of deleterious recessive<br />
alleles than would be seen <strong>in</strong> randomly mat<strong>in</strong>g populations. The<br />
overall reduction of the average fitness of <strong>in</strong>dividuals <strong>in</strong> the<br />
population is called “<strong>in</strong>breed<strong>in</strong>g depression.”<br />
From a study of humans <strong>in</strong><br />
Italy 1903-1907.<br />
Viability was <strong>in</strong>creased <strong>in</strong> a small<br />
population of adders <strong>in</strong> Sweden<br />
when <strong>in</strong>dividuals from outside were<br />
<strong>in</strong>troduced <strong>in</strong> 1992.
Although genetically based phenotypic variation is common, it<br />
only accounts for a small fraction of the total genome. Prote<strong>in</strong><br />
variation - the product of genes - can be assessed us<strong>in</strong>g gel<br />
electrophoresis.<br />
Lewont<strong>in</strong> & Hubby (1966) first assessed prote<strong>in</strong> variation <strong>in</strong><br />
Drosophila us<strong>in</strong>g gel electrophoresis. They assayed enzymatic<br />
variation. Different forms of an enzyme are called allozymes.<br />
Allozymes differ by one or more am<strong>in</strong>o acids and thus migrate at<br />
different rates when placed <strong>in</strong> an electric field.<br />
Their study and similar studies<br />
<strong>in</strong> other organisms have shown<br />
that on average <strong>in</strong>dividuals are<br />
heterozygous for 10% or more<br />
of their genes. There is a lot of<br />
genetic variation <strong>in</strong> populations.
Although random mat<strong>in</strong>g among any distribution of genotypes<br />
produces a b<strong>in</strong>omial distribution of genotypes <strong>in</strong> just one generation,<br />
the variation at two different genes does not mix as quickly.<br />
For two genes, A and B, each with two alleles (A 1 , A 2 , B 1 , B 2 ) and<br />
with each allele <strong>in</strong> equal frequency [f(A 1 )=p, f(A 2 )=q, f(B 1 )=r,<br />
f(B 2 )=s] we should expect each to have a b<strong>in</strong>omial distribution and<br />
be present <strong>in</strong> all possible comb<strong>in</strong>ations <strong>in</strong> proportion to their<br />
frequencies.<br />
Substitut<strong>in</strong>g a for A 2 and b for B 2 :<br />
For the A gene:<br />
f(AA) = p 2 , f(Aa) = 2pq, f(aa) = q 2<br />
For the B gene:<br />
f(BB) = r 2 , f(Bb) = 2rs, f(bb) = s 2<br />
For both genes together<br />
f(AABB) = p 2 * r 2<br />
f(AABb) = p 2 * 2rs<br />
f(AAbb) = p 2 * s 2<br />
f(AaBB) = 2pq * r 2<br />
f(AaBb) = 2pq * 2rs<br />
f(Aabb) = 2pq * s 2<br />
f(aaBB) = q 2 * s 2<br />
f(aaBb) = q 2 * 2rs<br />
f(aabb) = q 2 * s 2
Equilibrium at 2 genes can take<br />
several generations to achieve.<br />
When a population is not at<br />
equilibrium for multiple genes it is <strong>in</strong><br />
“l<strong>in</strong>kage disequilibrium.”<br />
Disequilibrium can be measured as<br />
d = f(AB)*f(ab) – f(Ab)*f(aB)<br />
d 0 = 0.5*0.5 - 0*0= 0.25<br />
d 1 = 0.375*0.375 - 0.125*0.125 = 0.125<br />
d 2 =0.3075*0.3075 - 0.1875*0.1875 =0.0594<br />
with cont<strong>in</strong>ued random mat<strong>in</strong>g<br />
disequilibrium decreases to 0.
Even though it is called l<strong>in</strong>kage disequilibrium it occurs with l<strong>in</strong>ked<br />
or nonl<strong>in</strong>ked genes. The example above assumed the genes were on<br />
different chromosomes, assort<strong>in</strong>g <strong>in</strong>dependently. If the genes are on<br />
the same chromosome, cross<strong>in</strong>g-over is required to produce the<br />
recomb<strong>in</strong>ant gametes (Ab, and aB <strong>in</strong> this case). The more closely<br />
l<strong>in</strong>ked the genes are the less will be the frequency of cross<strong>in</strong>g-over<br />
and it will take longer to achieve l<strong>in</strong>kage equilibrium.<br />
Most populations exhibit<br />
equilibrium for multiple genes,<br />
but there are some exceptions.<br />
Inversion heterozygotes don’t<br />
produce recomb<strong>in</strong>ant gametes -<br />
preserv<strong>in</strong>g the orig<strong>in</strong>al gene<br />
comb<strong>in</strong>ations and l<strong>in</strong>kage<br />
disequilibrium.<br />
Primrose<br />
Primula vulgaris<br />
G and A are closely l<strong>in</strong>ked
Polygenic <strong>in</strong>heritance - for many traits,<br />
phenotypic variation is due to multiple<br />
genes that each have small effects on<br />
the phenotype - quantitative variation.
The environment can also <strong>in</strong>fluence the phenotype. Phenotypic<br />
variation that is due to different environmental conditions is<br />
called environmental variation (V e )
<strong>Variation</strong> <strong>in</strong> phenotypes is due<br />
to the environment (Ve) and due<br />
to genetic differences (Vg). The<br />
contributions of each can be<br />
quantified.<br />
With<strong>in</strong> genetically identical<br />
l<strong>in</strong>es the only phenotypic<br />
variation is environmental<br />
variation.
Heritability (H 2 )- the proportion of phenotypic variation (Vp) <strong>in</strong><br />
the population that is due to underly<strong>in</strong>g genetic variation (Vg)<br />
Vp = Ve + Vg H 2 = Vg/Vp<br />
H 2 = 1 all phenotypic variation is due to genetic differences<br />
H 2 = 0 all phenotypic variation is due to environmental<br />
differences<br />
H 2 = 0.6 60% of the phenotypic variation <strong>in</strong> the population is<br />
due to genetic variation, 40% is due to environmental variation
Measurement of Heritability<br />
tw<strong>in</strong> studies - a large set of identical tw<strong>in</strong>s reared apart can<br />
<strong>in</strong>dicate the how much variation is due to environmental<br />
differences s<strong>in</strong>ce there are no genetic differences between<br />
identical tw<strong>in</strong>s.<br />
12<br />
12<br />
10<br />
10<br />
8<br />
8<br />
Tw<strong>in</strong> 2<br />
6<br />
Tw<strong>in</strong> 2<br />
6<br />
4<br />
r = 1<br />
4<br />
r = 0.5<br />
2<br />
2<br />
0<br />
0 5 10 15<br />
Tw<strong>in</strong> 1<br />
0<br />
0 5 10 15<br />
Tw<strong>in</strong> 1<br />
For identical tw<strong>in</strong>s reared apart, the<br />
correlation coefficient (r) is equal to the<br />
heritability of the phenotypic trait.<br />
Tw<strong>in</strong> 2<br />
12<br />
10<br />
8<br />
6<br />
4<br />
2<br />
r = 0<br />
0<br />
0 5 10 15<br />
Tw<strong>in</strong> 1
Correlation between close relatives - the correlation statistic (r)<br />
between the phenotypes of close relatives should reflect their degree<br />
of genetic relatedness if the trait has heritability near 1. A<br />
correlation less than expected based on genetic relatedness <strong>in</strong>dicates<br />
that some of the phenotypic difference between relatives is due to<br />
environmental differences. Most often parents and offspr<strong>in</strong>g are<br />
compared us<strong>in</strong>g the parental mean phenotype of the offspr<strong>in</strong>g mean<br />
phenotype.
Selection experiments - selection based on phenotypic differences<br />
should result <strong>in</strong> change <strong>in</strong> the average phenotype of the next<br />
generation if the phenotypic difference is heritable. The amount of<br />
change relative to the amount of selection reflects heritability.<br />
Selection experiment:<br />
Parental generation has an average phenotype<br />
of P<br />
Some of those parents are selected to produce<br />
the next generation. They have an average<br />
phenotype of S<br />
They produce offspr<strong>in</strong>g with an average<br />
phenotype of O.<br />
The selection <strong>in</strong>tensity: I = S-P<br />
The response to selection: R = O-P<br />
Heritability: H 2 = R/I
Flies with no overall preference for fly<strong>in</strong>g<br />
toward or away from the light can be selected<br />
for positive phototaxis or negative phototaxis.<br />
H 2 = 0.09<br />
After many generations of selection the<br />
response to selection decreases.<br />
Pure-bred l<strong>in</strong>es have little genetic<br />
variation for respond<strong>in</strong>g to selection.<br />
<strong>Variation</strong> with<strong>in</strong> pure-bred l<strong>in</strong>es is<br />
mostly or entirely environmental -<br />
heritability is very low.
All estimates of heritability apply only to the environment <strong>in</strong><br />
which they were measured.<br />
Vp = Ve + Vg H 2 = Vg/Vp<br />
If the study is done <strong>in</strong> an environment that varies little, then little<br />
phenotypic variation will result from environmental variation and<br />
the estimate of heritability will be high.<br />
If the study is done <strong>in</strong> an environment that varies greatly, then<br />
there may be a large amount of phenotypic variation that is due to<br />
environmental variation and the estimate of heritability will be<br />
low.
The expression of a s<strong>in</strong>gle genotype may be different <strong>in</strong> different<br />
environments. The pattern of change <strong>in</strong> expression with change <strong>in</strong><br />
environment is called the “norm of reaction.”
When the norm of reaction differs between<br />
different genotypes there is a<br />
genotype x environment <strong>in</strong>teraction<br />
The measurement of heritability often<br />
depends on the environment <strong>in</strong> which the<br />
measurement is made.<br />
V p large and V e small -> H 2 high<br />
V p small and V e larger -> H2 low
Migration (gene flow) and genetic variation.<br />
Gene flow has a homogeniz<strong>in</strong>g effect on populations<br />
The amount of gene flow depends on species mobility and barriers<br />
to dispersal.
Read: <strong>Variation</strong> among <strong>Populations</strong> (p 212-216)