CLIOwin 6.5 PCI User's Manual - Audiomatica Srl
CLIOwin 6.5 PCI User's Manual - Audiomatica Srl
CLIOwin 6.5 PCI User's Manual - Audiomatica Srl

You also want an ePaper? Increase the reach of your titles
YUMPU automatically turns print PDFs into web optimized ePapers that Google loves.
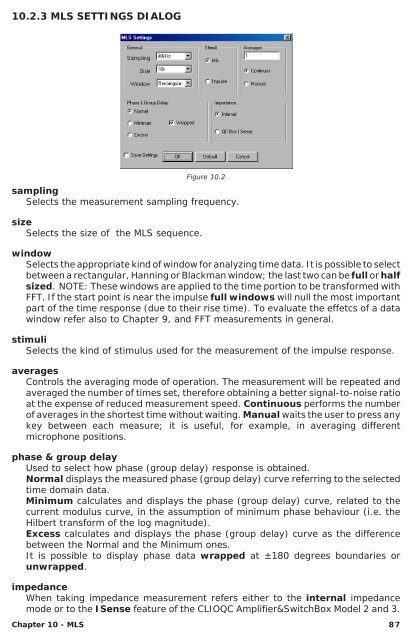
10.2.3 MLS SETTINGS DIALOG<br />
Figure 10.2<br />
sampling<br />
Selects the measurement sampling frequency.<br />
size<br />
Selects the size of the MLS sequence.<br />
window<br />
Selects the appropriate kind of window for analyzing time data. It is possible to select<br />
between a rectangular, Hanning or Blackman window; the last two can be full or half<br />
sized. NOTE: These windows are applied to the time portion to be transformed with<br />
FFT. If the start point is near the impulse full windows will null the most important<br />
part of the time response (due to their rise time). To evaluate the effetcs of a data<br />
window refer also to Chapter 9, and FFT measurements in general.<br />
stimuli<br />
Selects the kind of stimulus used for the measurement of the impulse response.<br />
averages<br />
Controls the averaging mode of operation. The measurement will be repeated and<br />
averaged the number of times set, therefore obtaining a better signal-to-noise ratio<br />
at the expense of reduced measurement speed. Continuous performs the number<br />
of averages in the shortest time without waiting. <strong>Manual</strong> waits the user to press any<br />
key between each measure; it is useful, for example, in averaging different<br />
microphone positions.<br />
phase & group delay<br />
Used to select how phase (group delay) response is obtained.<br />
Normal displays the measured phase (group delay) curve referring to the selected<br />
time domain data.<br />
Minimum calculates and displays the phase (group delay) curve, related to the<br />
current modulus curve, in the assumption of minimum phase behaviour (i.e. the<br />
Hilbert transform of the log magnitude).<br />
Excess calculates and displays the phase (group delay) curve as the difference<br />
between the Normal and the Minimum ones.<br />
It is possible to display phase data wrapped at ±180 degrees boundaries or<br />
unwrapped.<br />
impedance<br />
When taking impedance measurement refers either to the internal impedance<br />
mode or to the ISense feature of the CLIOQC Amplifier&SwitchBox Model 2 and 3.<br />
Chapter 10 - MLS 87