Example: Choosing Between the Full and Reduced Models Litters ...
Example: Choosing Between the Full and Reduced Models Litters ...
Example: Choosing Between the Full and Reduced Models Litters ...

You also want an ePaper? Increase the reach of your titles
YUMPU automatically turns print PDFs into web optimized ePapers that Google loves.
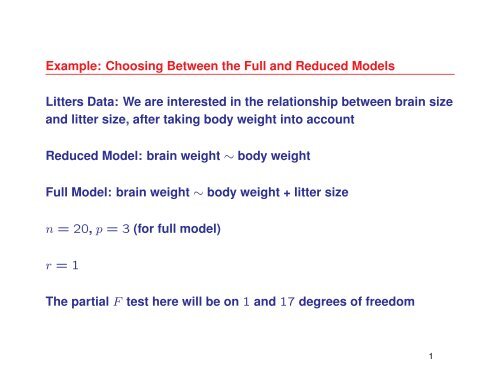
<strong>Example</strong>: <strong>Choosing</strong> <strong>Between</strong> <strong>the</strong> <strong>Full</strong> <strong>and</strong> <strong>Reduced</strong> <strong>Models</strong><br />
<strong>Litters</strong> Data: We are interested in <strong>the</strong> relationship between brain size<br />
<strong>and</strong> litter size, after taking body weight into account<br />
<strong>Reduced</strong> Model: brain weight ∼ body weight<br />
<strong>Full</strong> Model: brain weight ∼ body weight + litter size<br />
n = 20, p = 3 (for full model)<br />
r = 1<br />
The partial F test here will be on 1 <strong>and</strong> 17 degrees of freedom<br />
1
<strong>Full</strong> Model Analysis<br />
litters.lm
Conducting <strong>the</strong> Partial F Test<br />
> anova(littersred.lm, litters.lm)<br />
Analysis of Variance Table<br />
Model 1: brainwt ˜ bodywt<br />
Model 2: brainwt ˜ lsize + bodywt<br />
Res.Df RSS Df Sum of Sq F Pr(>F)<br />
1 18 0.0030806<br />
2 17 0.0024287 1 0.00065186 4.5628 0.04751 *<br />
---<br />
Signif. codes: 0 *** 0.001 ** 0.01 * 0.05 . 0.1 1<br />
Conclusion: After accounting for body weight, we have evidence<br />
that litter size <strong>and</strong> brain weight are related<br />
Note: p-value for this test matches <strong>the</strong> p-value for <strong>the</strong> test of<br />
H 0 : β 2 = 0. Why?<br />
3