Analysis and Applications of Design Structure Matrix, Domain ... - MIT
Analysis and Applications of Design Structure Matrix, Domain ... - MIT
Analysis and Applications of Design Structure Matrix, Domain ... - MIT

Create successful ePaper yourself
Turn your PDF publications into a flip-book with our unique Google optimized e-Paper software.
Massachusetts Institute <strong>of</strong> Technology<br />
Engineering Systems Division<br />
ANALYSIS AND APPLICATIONS OF DESIGN STRUCTURE MATRIX, DOMAIN<br />
MAPPING MATRIX, AND ENGINEERING SYSTEM MATRIX FRAMEWORKS<br />
Bartolomei, J. 1 , Cokus, M. 2 , Dahlgren, J. 3 , de Neufville, R. 4 , Maldonado, D. 5 , Wilds, J. 6<br />
Abstract<br />
The structure <strong>of</strong> this paper consists <strong>of</strong> three parts. Part 1 discusses three different, yet<br />
related, modeling frameworks: DSMs, DSM/DMMs, <strong>and</strong> ESMs. Part 2 examines the<br />
existing analysis techniques as applied to the different modeling frameworks. It also<br />
includes additional potential analysis techniques proposed for application to the three<br />
modeling frameworks. Part 3 provides a more detailed discussion <strong>of</strong> the application <strong>of</strong><br />
the analysis techniques describe in Part 2 specifically to the DSM/DMM <strong>and</strong> ESM<br />
methodologies. Finally, conclusions <strong>and</strong> suggestions for future research are presented.<br />
Part 1: Modeling Frameworks<br />
Modeling frameworks are used to represent the knowledge about a system. Common<br />
modeling frameworks include axiomatic design, the <strong>Design</strong> System <strong>Matrix</strong> (DSM),<br />
system architectural frameworks, Quality Functional Deployment (QFD), <strong>and</strong> Unified<br />
Program Planning. Additionally, two newly conceptualized frameworks include <strong>Domain</strong><br />
Mapping <strong>Matrix</strong> (DMM) developed by Browning <strong>and</strong> Danilovic (2007) <strong>and</strong> the<br />
Engineering System <strong>Matrix</strong> (ESM) developed by Bartolomei (2007).<br />
The DSM, DMM, <strong>and</strong> ESM methodologies are closely related. It can be argued that the<br />
methods are somewhat evolutionary. Koo (2005) researched types <strong>of</strong> models engineers<br />
utilize to represent complex systems; this research included the Entity-Relationship<br />
Modeling (E-R Modeling). The E-R model applies graphical formalism to relations<br />
between abstract entities. DSM, DMM, <strong>and</strong> ESM are all forms <strong>of</strong> E-R models. The<br />
DSM is a single domain matrix <strong>of</strong> entities <strong>and</strong> relationships; the DMM is a two-domain<br />
matrix; <strong>and</strong> the ESM is a multi-domain matrix.<br />
<strong>Design</strong> <strong>Structure</strong> <strong>Matrix</strong> (DSM)<br />
The DSM methodology emerged in the early 1980s as scholars demonstrated how graph<br />
theory can be used to analyze complex engineering projects. (Steward 1981) Steward<br />
showed how the sequence <strong>of</strong> design tasks could be represented as a network <strong>of</strong><br />
interactions. The DSM materialized as an nxn adjacency matrix <strong>of</strong> nodes <strong>and</strong> relations<br />
with identical row <strong>and</strong> column headings.<br />
1 Massachusetts Institute <strong>of</strong> Technology, Engineering Systems Division, jbart@mit.edu<br />
2 The <strong>MIT</strong>RE Corporation, msc@mitre.org<br />
3 The <strong>MIT</strong>RE Corporation, Dahlgren@mitre.org<br />
4 Massachusetts Institute <strong>of</strong> Technology, Engineering Systems Division, ardent@mit.edu<br />
5 The <strong>MIT</strong>RE Corporation, dcmaldon@mitre.org<br />
6 Massachusetts Institute <strong>of</strong> Technology, Engineering Systems Division, wilds@mit.edu<br />
1 <strong>of</strong> 31
A DSM can represent relations among components <strong>of</strong> a product, teams concurrently<br />
working on a project, activities or tasks <strong>of</strong> a process, <strong>and</strong>/or parameters within the<br />
system. In Steward’s model, nodes represent individual design tasks, <strong>and</strong> relations<br />
represent information flows, thereby creating a DSM <strong>of</strong> the activities or process domain.<br />
DSMs have also been used to represent <strong>and</strong> analyze technical artifacts where nodes<br />
represent system components DSM (Pimmler <strong>and</strong> Eppinger 1994; Malmstrom <strong>and</strong><br />
Malmquist 1998), design <strong>and</strong> analyze organizations with nodes representing individual<br />
members <strong>of</strong> the team (Eppinger 1997; Eppinger 2001), model the parametric<br />
relationships between technical parts (Smith <strong>and</strong> Eppinger 1997).<br />
Pimmler <strong>and</strong> Eppinger (1994) suggest that all relations between nodes can be represented<br />
within four categories: Spatial, Energy, Information, <strong>and</strong> Material. A ‘Spatial’ DSM<br />
provides for adjacency or orientation between two elements. ‘Energy’ DSMs are used<br />
when there are needs for energy transfer/exchange between two elements. ‘Information’<br />
DSMs define data or signal exchanges between two elements, <strong>and</strong> ‘Material’ DSMs<br />
represent material exchanges between two nodes within the matrix. By selecting the<br />
definition <strong>of</strong> nodes <strong>and</strong> the category <strong>of</strong> relations, the DSM can describe different<br />
contexts.<br />
Types <strong>of</strong> DSMs<br />
The nodes <strong>and</strong> relations differentiate the types <strong>of</strong> DSMs. According to Browning (2001),<br />
there are two main categories <strong>of</strong> DSMs: static-based <strong>and</strong> time-based. Each category<br />
contains two types <strong>of</strong> DSMs; component-based DSMs <strong>and</strong> organizational or team-based<br />
DSMs are static, while activity-based DSMs <strong>and</strong> parameter-based DSMs are time-based.<br />
Figure 1 depicts this proposed DSM hierarchy.<br />
Figure 1 Hierarchy <strong>of</strong> DSMs (Source: Browning 2001)<br />
Static-Based DSMs<br />
A static-based DSM consists <strong>of</strong> nodes that are independent <strong>of</strong> time, ie all nodes exist<br />
simultaneously. Thus, the ordering <strong>of</strong> rows <strong>and</strong> columns reflects groupings, not time<br />
flow. The nodes in static-based DSMs are usually system components or people within<br />
organizations. System evolution or change over time may cause a time dependency <strong>of</strong><br />
the existence or relations <strong>of</strong> a node within the system, but the nodes themselves remain<br />
static. For example, if a team member leaves an organization, he does not cease to exist,<br />
2 <strong>of</strong> 31
ut rather removes all or some relations to the organization. The organization has<br />
changed, but the departing team member remains static relative to the organization. This<br />
distinction <strong>of</strong> time-dependency is important when discussing analysis methods later in<br />
this paper.<br />
Component-based DSMs are used for modeling system architectures based on<br />
components <strong>and</strong>/or subsystems <strong>and</strong> the relationships to each other. Pimmler <strong>and</strong> Eppinger<br />
(1994) used component-based DSMs to represent the product decomposition <strong>of</strong> an<br />
automotive climate control system. In this well known example, the nodes are<br />
components at the subsystem level, <strong>and</strong> the interactions are material relations. Other<br />
examples <strong>of</strong> component-based DSMs can be found throughout the literature in a<br />
multitude <strong>of</strong> industries, including building construction, semiconductor, photographic,<br />
aerospace, electronics, <strong>and</strong> telecom industries.<br />
Organizational/Team-based DSMs are used for organizational analysis <strong>and</strong> design based<br />
on information flow among organizational entities. The nodes represent the individual<br />
team members or teams within the organization, while the relations represent the required<br />
communication flows between the nodes. Eppinger (1997, 2001) has used the teambased<br />
DSMs to attempt mapping the organizational structure to effective product<br />
architectures <strong>and</strong> efficient task allocations. In this example, the nodes are product<br />
development teams (PDTs) in a project corresponding to subsystems within a new<br />
product. The relations indicate the flow <strong>of</strong> information between the teams, emphasizing<br />
the capture <strong>of</strong> the frequency <strong>and</strong> direction <strong>of</strong> the information flow. McCord <strong>and</strong> Eppinger<br />
(1993) provide broad application examples from engine design to laptop development.<br />
Browning (1996) <strong>and</strong> Danilovic (1999) applied this research to the aerospace <strong>and</strong><br />
automotive industries, <strong>and</strong> several other organizational DSMs can be found in the<br />
literature. Sosa, Eppinger, <strong>and</strong> Rowles (2004) defined a hierarchical organization DSM<br />
including individuals belonging to “Modular <strong>Design</strong> Teams” <strong>and</strong> “Integrative <strong>Design</strong><br />
Teams” that were further decomposed into team groups.<br />
Time-based DSMs<br />
A time-based DSM consists <strong>of</strong> nodes that are time dependent. Ordering <strong>of</strong> rows <strong>and</strong><br />
columns in a time-based DSM corresponds to sequencing or time flow. The interactions<br />
between nodes constitute feedforward <strong>and</strong> feedback interfaces. Time-based DSMs<br />
provide directed graph representations. The most common forms <strong>of</strong> time dependent<br />
nodes are activities or tasks within a process.<br />
Activity or tasked-based DSMs are used to depict the dependency <strong>of</strong> one activity on<br />
another. The activities DSM can help identify activities that need to be completed in<br />
order for other activities to start. Kusiak <strong>and</strong> Wang (1993) applied the activities DSM to<br />
the automotive design industry. In the example, the nodes are design tasks for<br />
automobile design, <strong>and</strong> the relations represent the interaction (or activity<br />
information/material inputs/outputs) between the activities. Park <strong>and</strong> Cutowsky (1999)<br />
used a similar methodology to assess collaborative project management <strong>and</strong> to create<br />
process templates for rapid manufacturing.<br />
3 <strong>of</strong> 31
A parameter-based DSM is constructed from a “bottom-up” approach to identify the lowlevel<br />
activities that influence the design parameters. The difference between an activitiesbased<br />
DSM <strong>and</strong> a parameter-based DSM is the level <strong>of</strong> analysis. The nodes <strong>of</strong> the<br />
parameter-based DSM represent system activities, rather than the process activities as in<br />
the activities DSM. For example, the activities-based DSM might include program<br />
reviews, documentation requirements, <strong>and</strong> system/subsystem tests, while the parameterbased<br />
DSM might include subroutines <strong>of</strong> a s<strong>of</strong>tware algorithm or tasks describing “how”<br />
the physical system works. Cesiel (1993) provided an example <strong>of</strong> the application <strong>of</strong> a<br />
parameter-based DSM to the calibration development for automotive diagnostic systems.<br />
Rask <strong>and</strong> Sunnersjo (1998) defined a parameter-based DSM to represent design variables<br />
<strong>of</strong> a robotic arm <strong>and</strong> housing, in which the nodes were design variables <strong>of</strong> system<br />
components. For example, the housing was decomposed to outer radius, inner length,<br />
shaft radius, inner height, <strong>and</strong> wall thickness. Then, the relations represented the<br />
dependence <strong>of</strong> one design parameter on another. Parameter-based DSMs are the least<br />
documented in the DSM literature, however future applications may be extended upon<br />
the development <strong>of</strong> mathematical algorithms to analyze <strong>and</strong> incorporate DSMs with<br />
system dynamics modeling. This idea will be discussed later in this paper.<br />
Completing a DSM<br />
While completing a DSM appears to include merely inserting an “X” in a box showing a<br />
relationship between the row <strong>and</strong> column elements, the task is somewhat more<br />
complicated. The key first step is to determine the purpose <strong>of</strong> the DSM (i.e. what<br />
question(s) the DSM/ESM is intended to help answer) <strong>and</strong> define the relationship that the<br />
DSM represents. Failure to determine this information means that every person<br />
contributing to the DSM may be focusing on different purposes <strong>and</strong> completing the DSM<br />
by asking different questions. Context is the universal set <strong>of</strong> elements that will be<br />
considered for the model, as well as the expression <strong>of</strong> relations. Thus, several system<br />
models with different contexts can have same elements, but the expressions <strong>of</strong> the<br />
relations vary across the contexts. Same is true <strong>of</strong> the perspective—experience,<br />
knowledge, <strong>and</strong> bias contribute to the social element <strong>of</strong> perspective. For example, two<br />
key stakeholders asked to provide inputs regarding the relationships <strong>of</strong> the nodes may<br />
resolve very different models due to the differing perspectives. Dong (1999) suggests<br />
that engineers have different mental models <strong>of</strong> the design <strong>and</strong> no single actor had the<br />
complete picture <strong>of</strong> the technical system. Therefore, documenting the DSM’s<br />
represented relationship <strong>and</strong> purpose, as well as the context, is essential to further<br />
analysis using the DSM.<br />
Deciding the purpose <strong>of</strong> the DSM <strong>and</strong> determining the question that the DSM is meant to<br />
answer helps systems engineers decide if the elements should be completed in a binary<br />
manner, using an “X” or a 1 to show coupling, or if the elements should be completed<br />
using a numerical or relative ranking. Relative rankings can include H/M/L to indicate a<br />
High, Medium, or Low. Another method includes using positive <strong>and</strong> negative numerical<br />
values such as -2, -1, 1, <strong>and</strong> 2. (Browning 2001) The 2 is used to indicate a high degree<br />
<strong>of</strong> coupling, the 1 a much less degree <strong>of</strong> coupling, <strong>and</strong> empty box indicates no coupling.<br />
The negative numbers indicate where systems engineers want to ensure no coupling <strong>and</strong><br />
the relative strength <strong>of</strong> limiting this coupling. Currently available analysis tools for<br />
4 <strong>of</strong> 31
DSMs do not work well with negative indicators; therefore, systems engineers find other<br />
scales or alternative representations more useful.<br />
The DSM is a flat matrix methodology, meaning that the methodology does not allow<br />
clear representation <strong>of</strong> multiple types <strong>of</strong> relationships or node attributes. For example, in<br />
an organization-based DSM, the nodes may represent stakeholders <strong>of</strong> a system. The<br />
stakeholders may relate to each other by means <strong>of</strong> communicating information, physical<br />
proximity, or financial interactions. If a DSM is constructed only defining the existence<br />
<strong>of</strong> a relationship (ie place an “X” or 1 to designate any existence <strong>of</strong> a relationship<br />
regardless <strong>of</strong> communication, physical, or financial), the analysis may not provide an<br />
appropriate result if the consumer <strong>of</strong> the information desires funding flows only.<br />
Likewise, even if a numeric DSM is constructed, the scales for each relationship may not<br />
be similar, <strong>and</strong> a question <strong>of</strong> aggregation <strong>of</strong> all relationships still presents a challenge.<br />
Therefore, to ensure quality <strong>and</strong> clarity <strong>of</strong> the analysis, multiple relationships may be<br />
more appropriately analyzed by constructing multiple DSMs consisting <strong>of</strong> the same<br />
elements or nodes, yet representing independent relationships.<br />
Level <strong>of</strong> Detail within the DSM<br />
The level <strong>of</strong> abstraction when defining the nodes will be context-specific depending on<br />
the desired output or analysis (Sabbaghian 1998). The DSM provides significant<br />
flexibility in the granularity <strong>of</strong> the entities represented within the matrix. An entity could<br />
be a “small”, atomic component or a much more complicated component, made up <strong>of</strong><br />
several sub-components. Highly detailed DSMs based on lower-level components would<br />
likely be large <strong>and</strong> complex, consisting <strong>of</strong> several rows/columns. Less detailed DSMs<br />
tracking higher-level entities would likely have fewer rows/columns, but sacrifice details<br />
potentially necessary for system analysis.<br />
Due to the sheer size <strong>and</strong> complexity, highly detailed DSMs require automated analysis.<br />
Even with automation, analyzing very large DSM can represent significant challenges. In<br />
addition, gathering the data required to populate a large DSM may be impractical, <strong>and</strong><br />
<strong>of</strong>ten the benefit <strong>of</strong> analysis results is not realized for the required cost <strong>of</strong> constructing the<br />
DSM. Highly detailed DSMs are best suited for large systems which require detailed<br />
analysis <strong>of</strong> the component interaction. Such a project is more likely to be longer term,<br />
requiring resources <strong>and</strong> cooperation from subject matter experts, <strong>and</strong> recognition <strong>of</strong> the<br />
benefits <strong>of</strong> analysis may be better perceived.<br />
Alternatively, low-detail DSMs may be simple enough to allow analysis by<br />
h<strong>and</strong>/inspection, <strong>and</strong> not require significant costs in terms <strong>of</strong> time <strong>and</strong> resources.<br />
Although automation would be helpful, analysis is feasible without tools for simplified<br />
matrices. Low-detail DSMs are best suited for characterizing components which have<br />
known behavior apart from many sub-components, including sub-systems that have a<br />
specific functional purpose, such as “card reader”.<br />
Representation <strong>of</strong> organizations is a good example <strong>of</strong> how different levels <strong>of</strong> DSMs can<br />
be used. At the portfolio or even corporation level a less detailed DSM can help<br />
decision-makers determine major areas where groups should or should not collaborate in<br />
5 <strong>of</strong> 31
achieving functions. A medium-level DSM may focus more on the program level, <strong>and</strong><br />
still a detailed DSM may focus on the project <strong>and</strong> task level. All <strong>of</strong> these DSMs can have<br />
tremendous value to making the total organization work well, yet as previously discussed,<br />
identifying the context <strong>of</strong> the DSM is critical to informing the assumptions <strong>of</strong> the<br />
resulting analysis.<br />
Summary <strong>of</strong> DSMs<br />
In summary, the DSM is a matrix consisting <strong>of</strong> nodes <strong>and</strong> relations <strong>of</strong> a single domain.<br />
The DSM can be utilized for both the social <strong>and</strong> technical domains, yet traditionally has<br />
not addressed the system interactions with the environment since the matrix is flat. DSM<br />
does not allow clear representation <strong>of</strong> multiple relations or time evolutions, but can be<br />
very useful in intra-domain analysis which will be discussed later in this paper.<br />
<strong>Domain</strong> Mapping <strong>Matrix</strong> (DMM)<br />
Eppinger, <strong>and</strong> many other researchers in product development <strong>and</strong> management research,<br />
recognized that the analysis <strong>of</strong> the single-domain interaction patterns leads to “learning<br />
about the particular product development situation <strong>and</strong> how to improve.” Meanwhile,<br />
comparing patterns across the domains (multi-domain interactions) allows assessment <strong>of</strong><br />
“effectiveness <strong>of</strong> the process <strong>and</strong> organization to develop the particular product.”<br />
(Eppinger 2002) Although his framework only included three domains (Product,<br />
Process, <strong>and</strong> Organization), the realization <strong>of</strong> the importance <strong>of</strong> the multi-domain<br />
interactions has pushed the conceptualization <strong>of</strong> DSMs.<br />
Building upon the DSM literature, Danilovic <strong>and</strong> Browning (2007) present a framework<br />
that distinguishes the single- <strong>and</strong> multi- domain interactions using DSM <strong>and</strong> <strong>Domain</strong><br />
Mapping Matrices (DMM). The DMM examines the interactions across domains: the<br />
rows represent nodes <strong>of</strong> one domain, while the columns represent nodes <strong>of</strong> another<br />
domain. Unlike the DSM, the DMM is an mxn rectangular matrix since the rows <strong>and</strong><br />
columns are not identical. By combining both DSM <strong>and</strong> DMM methodologies, the<br />
analysis results are enriched, providing an exp<strong>and</strong>ed view <strong>of</strong> the system.<br />
The early research is largely focused on product development systems, identifying five<br />
domains important to the examination <strong>of</strong> product development projects. These domains<br />
include “the goals domain the product (or service, or result) system; the process system<br />
(<strong>and</strong> the work done to get the product system); the system organizing the people into<br />
departments, teams, groups, etc.; the system <strong>of</strong> tools, information technology solutions,<br />
<strong>and</strong> equipment they use to do the work; <strong>and</strong> the system <strong>of</strong> goals, objectives, requirements,<br />
<strong>and</strong> constraints pertaining to all the systems.” (Danilovic <strong>and</strong> Browning 2007) Figure 2<br />
depicts a generalized view <strong>of</strong> the DSM/DMM representation.<br />
6 <strong>of</strong> 31
Figure 2 DSM/DMM Framework (Source: Danilovic <strong>and</strong> Browning 2007)<br />
Each element along the diagonal represents a DSM representing the interactions within<br />
each <strong>of</strong> the five domains. The <strong>of</strong>f-diagonal matrices represent the interactions between<br />
domains.<br />
The DSM/DMM representation is similar to the flow-down matrices <strong>of</strong> QFD. (Danilovic<br />
<strong>and</strong> Browning 2007) However, because QFD representation is not easily manipulated for<br />
matrix analysis techniques, it is suggested that DSM/DMM methods help to focus the<br />
analysis results on interdependencies, interactions, <strong>and</strong> exchange <strong>of</strong> information within<br />
<strong>and</strong> across domains.<br />
This modeling framework is relatively new, <strong>and</strong> thus the current literature is limited.<br />
Only a small sample <strong>of</strong> examples has been documented. These examples include a<br />
military aircraft product system mapping the physical products to functionalities <strong>and</strong><br />
technologies, a manufacturing company assessment <strong>of</strong> the business portfolio mapping the<br />
7 <strong>of</strong> 31
physical product system <strong>and</strong> the organization, <strong>and</strong> a dynamic analysis <strong>of</strong> a multi-project<br />
structure across the product <strong>and</strong> organizational domains. (Danilovic <strong>and</strong> Browning 2007)<br />
While the DSM/DMM framework is newly conceptualized, researchers have been<br />
interested in multi-domain relations for many years. An example <strong>of</strong> multi-domain<br />
modeling not referring specifically to DSM/DMMs can be found in a study by Morelli,<br />
Eppinger, <strong>and</strong> Gulati (1995). The research attempted to improve the modeling <strong>and</strong><br />
prediction <strong>of</strong> the technical communications (tasks) <strong>of</strong> the organization. Whereas most<br />
models are developed assuming that the tasks <strong>and</strong> personnel are mapped one-for-one, this<br />
case study was not constrained by this assumption.<br />
As expected, the DMM is constructed in the same procedure as a DSM; after all a DMM<br />
is a variant <strong>of</strong> combining two DSMs. Similarly to the DSM methodology, the<br />
DSM/DMM framework lacks the capacity to analyze multiple relationships between<br />
single node pairs <strong>and</strong> express time. However, the DSM/DMM methodology provides<br />
significant benefits over the DSM framework by exp<strong>and</strong>ing the consideration beyond<br />
single domain information.<br />
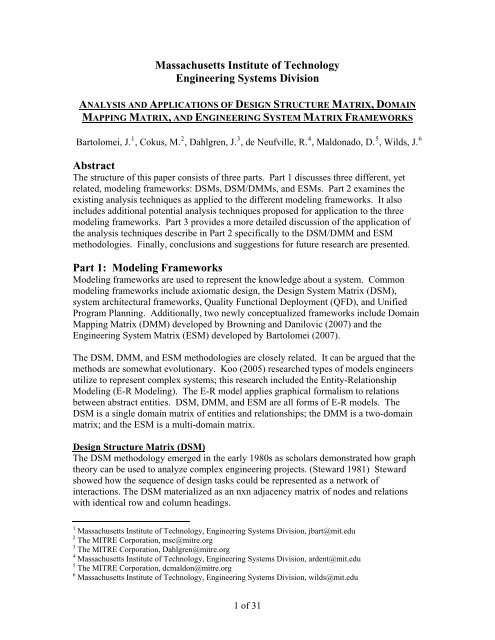
E ngineering System <strong>Matrix</strong> (ESM)<br />
The ESM methodology extends the DSM <strong>and</strong> DMM methods to include multiple<br />
domains, multiple relations, <strong>and</strong> changes over time. Bartolomei (2007) developed the<br />
ESM in response to the limitations <strong>of</strong> existing modeling frameworks to sufficiently<br />
represent the environmental interactions <strong>and</strong> influences <strong>of</strong> time to provide a more holistic<br />
representation <strong>of</strong> the system. The methodology reaches beyond the physical, social, <strong>and</strong><br />
process domains to include the system drivers, node attributes, <strong>and</strong> system evolution.<br />
Within the ESM methodology, there are six domains (environmental or system drivers,<br />
social or stakeholders, functional including objectives <strong>and</strong> functions, physical or objects,<br />
<strong>and</strong> process or activities) that are important to describe the engineering system. The<br />
ESM organizes this information using a matrix structure that can be used to facilitate<br />
network <strong>and</strong> graph theoretic analysis. The derived analysis consists <strong>of</strong> varying classes<br />
nodes, relations, <strong>and</strong> attributes. Nodes represent different classes <strong>of</strong> objects, relations<br />
describe interactions between two nodes, <strong>and</strong> attributes generically describe the<br />
parameters <strong>and</strong> descriptions for both nodes <strong>and</strong> relations. The conceptualization<br />
is both a<br />
hyper graph <strong>and</strong> a multi graph. “A hyper graph implies the graph contains different<br />
classes <strong>of</strong> nodes <strong>and</strong> there are interactions between nodes <strong>of</strong> different types. A multi<br />
graph implies multiple edges can exist between nodes. For example, two human actors<br />
might have a financial relationship <strong>and</strong> communication relationship between them. In<br />
addition, the ESM is a designed to represent how the graph (nodes, relations, <strong>and</strong><br />
attributes) changes over time.” (Bartolomei 2007)<br />
The ESM is an adjacency matrix with identical row <strong>and</strong> column headings, where the<br />
diagonal cells represent the system elements <strong>and</strong> the <strong>of</strong>f-diagonal cells represent the<br />
relationships between elements. The grey cell blocks along the diagonal represent a<br />
graph <strong>of</strong> a particular class <strong>of</strong> nodes. The <strong>of</strong>f-diagonal blocks <strong>of</strong> cells represent a multi-<br />
partite graph that relates two classes <strong>of</strong> nodes. Figure 3 displays a generalized ESM.<br />
<strong>of</strong><br />
8 <strong>of</strong> 31
System<br />
Drivers<br />
Stakeholders<br />
Objectives<br />
Functions<br />
Objects<br />
Activities<br />
System<br />
Drivers<br />
Env X Env<br />
S X Env<br />
V X Env<br />
F X Env<br />
O X Env<br />
A X Env<br />
Column Influences Row<br />
Stakeholders<br />
Objectives<br />
Functions<br />
Env X S<br />
Env X V<br />
Env X F<br />
S X S<br />
S X V<br />
S X F<br />
V X S<br />
V X V<br />
V X F<br />
F X S<br />
F X V<br />
F X F<br />
O X S<br />
O X V<br />
O X F<br />
A X S<br />
A X V<br />
A X F<br />
Sy stem Boundary<br />
Objects<br />
Env X O<br />
S X O<br />
V X O<br />
F X O<br />
O X O<br />
A X O<br />
Activities<br />
Env X A<br />
S X A<br />
V X A<br />
F X A<br />
O X A<br />
A X A<br />
Row is Influenced by Column<br />
Figure 3 The Engineering System <strong>Matrix</strong> (Source: Bartolomei 2007)<br />
As previously stated, the ESM includes six domains. These domains are represented in<br />
the ESM as System Drivers, Stakeholders, Objectives, Functions, Objects, <strong>and</strong> Activities.<br />
(Bartolomei 2007)<br />
o System Drivers represent the non-human components that affect or are affected<br />
by the engineering system that are beyond the control <strong>of</strong> the system’s human<br />
components.<br />
o Stakeholders represent the social network <strong>of</strong> the system <strong>and</strong> consist <strong>of</strong> the human<br />
components that affect or are affected by the system (including organizations).<br />
o Objectives represent the objectives, goals, <strong>and</strong> purposes <strong>of</strong> the engineering<br />
system.<br />
o Functions represent the functional architecture <strong>of</strong> that system.<br />
o Objects represent the physical, non-human components <strong>of</strong> the system that act or<br />
are acted upon.<br />
o Activities represent the processes, sub-processes, <strong>and</strong> tasks performed by the<br />
system.<br />
Each domain is populated with nodes <strong>and</strong> relations similar to the DSM <strong>and</strong> DMM<br />
methodologies. However, in the ESM nodes <strong>and</strong> relations in the system can be described<br />
with attributes. Attributes define the characteristics for each particular node or relation.<br />
9 <strong>of</strong> 31
“Attributes can be binary, string, numeric or a mathematical function” as demonstrated<br />
by Bartolomei (2007) in the development <strong>of</strong> the Qualitative Knowledge Construction<br />
tool. Furthermore, the ESM can store multiple relations in the same matrix, i.e. the<br />
matrix is not flat like a DSM or DMM.<br />
To incorporate the influences <strong>of</strong> time, each node <strong>and</strong> relation has at least one attribute<br />
known as existence. The representation <strong>of</strong> time in the system can be represented as a<br />
binary attribute for each node that defines whether a node or relation existed (1) or did<br />
not exist (0) for a particular time interval. For example, over the lifecycle <strong>of</strong> a system<br />
organizational changes result in the addition <strong>and</strong> removal <strong>of</strong> stakeholders over time. In<br />
some cases, stakeholders that may have existed in the beginning may have departed <strong>and</strong><br />
later returned. Therefore, each node may have several existence attributes to describe<br />
periods <strong>of</strong> involvement. In addition, “particular attributes <strong>of</strong> nodes may change over<br />
time.” (Bartolomei 2007) Component costs for particular products could be treated as<br />
independent variables that change periodically. Thus, discrete price changes for different<br />
time intervals can be captured in the system model. “Yet other attributes might be<br />
continuous, time dependent functions.” (Bartolomei 2007) For example, uncertainty <strong>of</strong><br />
stakeholder promotion, or rotation in or out <strong>of</strong> the system, may be a time-dependent<br />
function relating to the length <strong>of</strong> time he/she has served on the project. The ESM<br />
framework is designed to include these representations <strong>of</strong> time.<br />
In summary, the ESM provides a more complete modeling framework as compared to<br />
other modeling frameworks. As expected, the ESM is constructed in a similar procedure<br />
as a DSM <strong>and</strong> DMM, except that the ESM allows the use <strong>of</strong> attributes to more clearly<br />
describe the system. The ESM allows the modeler the ability to represent each domain <strong>of</strong><br />
the engineering system <strong>and</strong> maps interactions within <strong>and</strong> across these domains. Finally,<br />
the ESM allows the modeler the ability to manage time, parameterize the nodes <strong>and</strong><br />
relations by defining multiple attributes, <strong>and</strong> enumerate values <strong>of</strong> uncertainty for the<br />
quality <strong>of</strong> information <strong>and</strong>/or the uncertainty <strong>of</strong> the elements <strong>of</strong> the system.<br />
Part 2: Existing <strong>Analysis</strong> Techniques <strong>and</strong> <strong>Applications</strong><br />
This section reviews current analysis techniques that have been applied to DSMs <strong>and</strong><br />
ESMs, including classical DSM techniques, sensitivity analysis techniques, networkbased<br />
analysis techniques, coupling techniques, <strong>and</strong> real options techniques. Example<br />
applications are presented where available.<br />
Classical DSM Techniques<br />
A variety <strong>of</strong> techniques were developed to analyze information presented in DSMs.<br />
Table 1 shows the types <strong>of</strong> DSMs with the respective applications <strong>and</strong> classical DSM<br />
techniques that can be used for each.<br />
10 <strong>of</strong> 31
Table 1 Classical DSM Techniques for Types <strong>of</strong> DSMs<br />
DSM Data<br />
Types<br />
Task-based<br />
Team-based<br />
Parameterbased<br />
Componentbased<br />
Representation<br />
Task/Activity<br />
input/output<br />
relationships<br />
Parameter decision<br />
points <strong>and</strong> necessary<br />
precedents<br />
Multi-team interface<br />
characteristics<br />
Multi-component<br />
relationships<br />
Application<br />
Project scheduling,<br />
activity sequencing,<br />
cycle time reduction<br />
Low level activity<br />
sequencing <strong>and</strong><br />
process construction<br />
Organizational design,<br />
interface<br />
management, team<br />
integration<br />
System architecting,<br />
engineering <strong>and</strong><br />
design<br />
<strong>Analysis</strong><br />
Method<br />
Partitioning,<br />
Tearing,<br />
B<strong>and</strong>ing<br />
Partitioning,<br />
Tearing,<br />
B<strong>and</strong>ing<br />
Clustering<br />
Clustering<br />
Partitioning/Sequencing<br />
This analytical technique is designed to reorder system components with time-based<br />
dependencies. The sequencing algorithm manipulates the rows <strong>and</strong> columns<br />
simultaneously to produce a lower triangular matrix. Reordering rows <strong>and</strong> columns such<br />
that the sub-diagonal ticks move closer to the diagonal maximizes the feed-forward flow<br />
<strong>of</strong> information <strong>and</strong> materials, while simultaneously minimizing possible inefficiencies<br />
caused by feedback <strong>and</strong> rework. The technique does not alter the relationships recorded<br />
in the DSM, but merely re-orders the rows <strong>and</strong> columns to eliminate apparent feedback<br />
loops.<br />
In the results <strong>of</strong> sequencing, the ticks below the diagonal represent a precedence<br />
relationship between tasks, meaning the row node requires input in the form <strong>of</strong><br />
information or material from the column node. Contrastingly, the ticks above the<br />
diagonal represent feedback relationships, meaning the column node requires input from<br />
the row node. This type <strong>of</strong> relation indicates where in the process assumptions about<br />
downstream activities must be made.<br />
Minimizing feedback eliminates process iteration. Researchers applying DSMs to<br />
control systems historically have hypothesized that a system with feedback is inherently<br />
unstable. While this hypothesis is likely accurate for this specific application, many<br />
systems rely on process iteration. This leads to the question <strong>of</strong> whether automated tools<br />
that partition DSMs should only focus on eliminating feedback loops. Users must be<br />
very careful that the tools do not eliminate valuable information.<br />
Managers <strong>and</strong> operations staffs desiring to improve process or streamline work tasks have<br />
applied the sequencing algorithm to examine strategies for process design. (Eppinger,<br />
1990, Steward, 1981) Furthermore, Danilovic <strong>and</strong> Browning (2007) provide a sample<br />
analysis for DSM sequencing for a product development system in which the program<br />
milestones are ordered. The result emphasizes the need for assumptions required in task<br />
11 <strong>of</strong> 31
upstream from the information delivery. Because these assumptions require inefficient<br />
iterations, it is important for system engineers <strong>and</strong> managers to recognize where feedback<br />
is necessary to assess potential impacts <strong>and</strong> risks. (Danilovic <strong>and</strong> Browning 2007) This<br />
result is an advantage <strong>of</strong> the DSM technique over other program scheduling tools.<br />
Clustering<br />
<strong>Matrix</strong> clustering is a valuable technique for examining the structure <strong>of</strong> a system.<br />
Clustering is similar to sequencing; the technique applies graph theoretic cluster<br />
algorithms to reorder the rows <strong>and</strong> columns <strong>of</strong> the matrix by grouping highly related<br />
nodes, called clusters. By grouping nodes with high interaction into clusters, engineers<br />
<strong>and</strong> managers can more easily identify <strong>and</strong> examine interfaces between the clusters.<br />
In the result <strong>of</strong> clustering analysis, the clusters contain most, if not all, <strong>of</strong> interactions (i.e.<br />
ticks) internally <strong>and</strong> the interactions between clusters is eliminated or minimized.<br />
(Fern<strong>and</strong>ez 1998; Sharman <strong>and</strong> Yassine 2004; Yu et al. 2003) However, interactions<br />
between clusters may also be advantageous when considered in the system context. For<br />
example, engineers <strong>and</strong> program managers may desire interaction between two teams to<br />
share resources. Additionally, past discussions on clustering that discourage the<br />
overlapping <strong>of</strong> components into two clusters may not make sense for a tangible system or<br />
for an organization. This argument may have been based on a purely component based<br />
DSM, especially in binary DSM analysis. For example in an organizational DSM, the<br />
overlap may represent a person that participates in each group, ensuring the sharing <strong>of</strong><br />
essential information.<br />
One application <strong>of</strong> clustering analysis to the physical domain (i.e. system components) is<br />
to present subsets <strong>of</strong> components as c<strong>and</strong>idates for modularization. The clustering can<br />
show which components can be segmented into larger modules or platforms, thus<br />
enabling future designers to merely adopt that module. Other research suggests that the<br />
interdependent components highlighted in a cluster may best be treated as a single,<br />
higher-level subsystem in the physical design. DSM clustering can also be applied to the<br />
social domain (i.e. stakeholders). Sosa, Eppinger <strong>and</strong> Rowles (2004) analyzed team<br />
organization, resulting in clusters <strong>of</strong> highly interacting teams <strong>and</strong> individuals with<br />
minimal inter-cluster interactions. They concluded that the groupings represent a useful<br />
framework for organizational design by focusing on the predicted communication needs<br />
<strong>of</strong> different players. <strong>MIT</strong>RE Corporation recently used clustering to analyze the<br />
interdependence <strong>of</strong> several Air Force Missions. The result <strong>of</strong> this analysis shows that<br />
almost all missions are interdependent, however the analysis also indicated that one<br />
mission, Combat Search <strong>and</strong> Rescue (CSAR) did not depend on other missions for<br />
successful completion, yet was required for almost all missions.<br />
Recently, a possible new application for clustering has presented itself. A prevalent item<br />
in systems today is called a Line Replaceable Unit (LRU). An LRU represents the lowest<br />
level <strong>of</strong> component that is worked on by maintainers in field organizations. In an effort<br />
to minimize the challenges <strong>of</strong> field maintenance, many LRUs are now major subsystems.<br />
While this might minimize the challenges <strong>of</strong> field maintenance, it can <strong>of</strong>ten force<br />
organizations to procure spare parts that take up much space <strong>and</strong> are very costly to ship<br />
12 <strong>of</strong> 31
ack to the depot maintenance units. A clustered DSM can reveal the logical LRUs.<br />
Viewing some clustered DSMs also show that there can be subclusters within a major<br />
cluster. These subclusters can represent smaller LRUs that should be considered to<br />
develop an optimal grouping <strong>of</strong> LRUs. For example, the grouping may indicate that<br />
certain cards in an electronic system are a subcluster. Reliability <strong>and</strong> Maintainability<br />
experts can then analyze each subcluster to determine an optimal sparing concept,<br />
thereby minimizing the amount <strong>of</strong> equipment transferred to field units <strong>and</strong> also<br />
minimizing the equipment that must be returned to the depot for repair. Additionally, if<br />
the system is properly designed to facilitate the removal <strong>and</strong> replacement <strong>of</strong> the smaller<br />
LRUs, the major system should be operational a greater amount <strong>of</strong> time. These smaller<br />
LRUs may also facilitate more focused development <strong>of</strong> Built In Test (BIT) capabilities<br />
that enable the ready identification <strong>of</strong> the smaller LRU for removal <strong>and</strong> replacement.<br />
B<strong>and</strong>ing<br />
B<strong>and</strong>ing adds alternating light <strong>and</strong> dark shading to a DSM to show independent nodes or<br />
groups <strong>of</strong> nodes. (Grose 1994) Developed primarily for analyzing time-based DSMs,<br />
b<strong>and</strong>ing identifies activities that can be executed simultaneously or independent <strong>of</strong> one<br />
another. B<strong>and</strong>s represent the critical path to the project, where one node in each b<strong>and</strong> is a<br />
potential bottleneck. (Browning 2001)<br />
As in partitioning <strong>and</strong> clustering, b<strong>and</strong>ing manipulates the DSM without altering<br />
component relationships. The algorithm is similar to that <strong>of</strong> partitioning; however the<br />
feedback ticks are ignored in the process <strong>of</strong> determining the b<strong>and</strong>s. The DSM Tutorial 7<br />
provides an example <strong>of</strong> b<strong>and</strong>ing an activities-based DSM.<br />
B<strong>and</strong>ing, although typically associated with task-oriented DSMs, can also be employed in<br />
DSMs concerned with system components. Rather than identifying groups <strong>of</strong><br />
interdependent components (as in clustering), b<strong>and</strong>ing identifies groups <strong>of</strong> independent<br />
components. B<strong>and</strong>ing can be used to visually indicate groups <strong>of</strong> system components<br />
which do not affect one another. This can be very useful information in that designers<br />
can eliminate areas where they might have previously wasted time considering interfaces.<br />
This analysis may also prove useful in system testing. A component in a given b<strong>and</strong> can<br />
be tested in isolation from other components within the same b<strong>and</strong>. Particularly<br />
advantageous in testing large systems, b<strong>and</strong>ing may indicate opportunities to test<br />
components in parallel, resulting in significant time <strong>and</strong> cost savings for test phases.<br />
B<strong>and</strong>ing may also potentially be used on organizational DSMs containing data for<br />
information exchanges within an existing organization. The b<strong>and</strong>ed DSM may identify<br />
which people or subgroups do not interface. Management can then compare that<br />
information to a clustered DSM that shows which people or subgroups should exchange<br />
information <strong>and</strong> rectify the disparity.<br />
7 DSM Tutorial is a composition <strong>of</strong> many sources <strong>and</strong> can be found at http://www.dsmweb.org<br />
13 <strong>of</strong> 31
Tearing<br />
Tearing focuses on identifying various feedback marks that if removed from the matrix,<br />
<strong>and</strong> the matrix is repartitioned, will obtain a DSM with all marks in the lower triangle.<br />
Removing these marks is what is known as “tears”. Determining the tears to make<br />
involves making assumptions about what items have the least impact to the design<br />
process. Tears are generally done in two ways: (Browning 2001)<br />
o Minimal Number <strong>of</strong> Tears: this concept acknowledges that tears represent a<br />
guess/assumption, <strong>and</strong> as such designers should minimize their guesses.<br />
o Confine Tears to the Smallest Blocks on Diagonal: this concept focuses on that if<br />
there are to be small iterations within larger iterations (blocks within blocks), then<br />
designers want to limit the inner iterations to a small number <strong>of</strong> tasks.<br />
The concept <strong>of</strong> tearing is based on guessing <strong>and</strong> assumptions. While there was likely a<br />
good reason to develop this technique, these authors feel tearing should not be done<br />
unless absolutely necessary. Few examples exist in the literature. Tearing results in the<br />
loss <strong>of</strong> information. Possibly tearing may support a greater speed to the design process,<br />
but the cost is a loss <strong>of</strong> information. Engineers performing such tears should have a clear<br />
underst<strong>and</strong>ing <strong>of</strong> the cost/benefit ratio to this process.<br />
Sensitivity <strong>Analysis</strong> Technique<br />
Pairing classical DSM techniques with sensitivity calculations can potentially identify<br />
system elements that are sensitive to change; this is known as the Sensitivity DSM<br />
technique. (Kalligeros 2006) The technique uses a DSM containing information about<br />
the uncertainty <strong>of</strong> the impact due to the occurrence <strong>of</strong> a change event. Then, partitioning<br />
or clustering techniques, selected depending on the appropriate domain, is performed to<br />
determine groupings <strong>of</strong> interactions. “This analysis can result in platforming implications<br />
for groupings least sensitive to change impacts.” (Bartolomei 2007)<br />
For example, Kalligeros (2006) demonstrated this technique on a large engineered<br />
system, an <strong>of</strong>f-shore oil drilling platform. He constructed a components-based DSM,<br />
where interactions represented whether a 100% change in one subsystem would cause at<br />
least a 20% change in the related subsystem. Then, clustering analysis was used to<br />
determine possible platforms for oil company st<strong>and</strong>ardizations, providing a significant<br />
benefit to energy companies that previously designed mobile oil <strong>and</strong> natural gas<br />
platforms for a single design point based on expectations for a specific product <strong>and</strong> flow<br />
rate. Kalligeros (2006) also analyzed a functional DSM (where the nodes were functional<br />
requirements), thereby showing what functional requirements might have driven that<br />
component-level interactions. More generally, engineers <strong>and</strong> managers can use the<br />
Sensitivity DSM technique to identify system elements that can be st<strong>and</strong>ardized across<br />
designs, allowing faster <strong>and</strong> more economical designs <strong>and</strong> savings in lifecycle costs.<br />
Network-Based <strong>Analysis</strong> Techniques<br />
Systems represented as a large network allow calculation <strong>of</strong> a variety <strong>of</strong> network metrics<br />
generated by the social network community, such as betweeness, path length, <strong>and</strong><br />
centrality. (Bartolomei 2007) Betweeness is a measure <strong>of</strong> the number <strong>of</strong> times a vertex<br />
occurs on a geodesic (the short path connecting two vertices). Centrality is a measure <strong>of</strong><br />
14 <strong>of</strong> 31
the connectedness <strong>of</strong> each node. And path length refers to the distance between pairs <strong>of</strong><br />
nodes in the network.<br />
Bartolomei (2007) provides an example <strong>of</strong> analyzing the betweeness <strong>of</strong> the stakeholders<br />
in the social domain. This measure is associated with the control <strong>of</strong> information. Thus,<br />
“stakeholders with higher betweeness have greater influence on a social network when<br />
compared with stakeholders with lower betweeness.” (Bartolomei 2007) Furthermore,<br />
Bartolomei showed how redundancy <strong>of</strong> stakeholder interactions can be useful within an<br />
organization. “Two stakeholders maintaining the same interactions amongst other system<br />
stakeholders provide a shadowing effect. If one <strong>of</strong> the two stakeholders should leave the<br />
system, the remaining stakeholder maintains the continuity <strong>of</strong> interactions.” (Bartolomei<br />
2007) Additionally, an example <strong>of</strong> degree centrality analysis provided insights into<br />
identifying key system elements (stakeholders, components, <strong>and</strong> activities) that are highly<br />
connected within the system. Degree centrality is associated with power or importance.<br />
This information may assist the system engineers <strong>and</strong> managers in recognizing critical<br />
nodes to be carefully monitored.<br />
Future research is necessary to develop theories for multi-domain network analysis,<br />
analytical methods for analyzing dynamic networks, new metrics for engineering<br />
systems, <strong>and</strong> methods for comparing networks. Engineers should look for patterns<br />
across systems in hopes <strong>of</strong> “developing new theories <strong>and</strong> better heuristics that describe<br />
<strong>and</strong> explain the structure <strong>and</strong> behavior <strong>of</strong> engineering systems,” rather than just<br />
considering the social domain. (Bartolomei 2007)<br />
Coupling Techniques<br />
Coupling between system components can have a significant impact on the ability to<br />
make future changes to any single component since that may drive a requirement to make<br />
changes to other coupled components. (Dahlgren 2007) The requirement to make such<br />
changes is <strong>of</strong>ten strongly correlated to the tightness <strong>of</strong> coupling. At one time engineers<br />
worked to have systems tightly integrated, which became synonymous with tightly<br />
coupled. This may have been driven by the trend to design systems to a point solution,<br />
given specific requirement <strong>and</strong> expected funding. Research into some historical systems<br />
has shown that as subsystems become less tightly coupled to each other, the subsystems<br />
can evolve at independent rates. Systems engineers <strong>and</strong> managers can take advantage <strong>of</strong><br />
this evolution if recognized by quantifying degrees <strong>of</strong> coupling.<br />
The initial work on quantifying degrees <strong>of</strong> coupling was derived from Barabasi (2003)<br />
<strong>and</strong> Atkinson <strong>and</strong> M<strong>of</strong>fatt (2005). Here, a Coupling Coefficient (CC) is the ratio <strong>of</strong> tight<br />
connections divided by possible number <strong>of</strong> tight connections for a team. (Dahlgren 2007)<br />
A possible hardware analogy is to review the DSM <strong>and</strong> determine the number <strong>of</strong> tight<br />
<strong>and</strong> medium couplings between subsystems. Each coupling should be reviewed from a<br />
st<strong>and</strong>point <strong>of</strong> every level or layer that the systems can be tightly coupled. For example,<br />
in a computer <strong>and</strong> networking situation, showing that two systems are tightly coupled is<br />
necessary but not sufficient. In this case the coupling should be reviewed at each layer <strong>of</strong><br />
the Operational System Interconnect (OSI) stack. It is possible that each pair <strong>of</strong> tightly<br />
coupled subsystems could also be tightly coupled at a number <strong>of</strong> layers represented by<br />
15 <strong>of</strong> 31
the OSI, <strong>and</strong> then the degree <strong>of</strong> coupling is much larger, <strong>and</strong> probably problematic to<br />
designers, than what was originally anticipated by viewing the DSM.<br />
Additionally, it is important to distinguish whether systems are built to st<strong>and</strong>ards or built<br />
to the prevailing Commercial Off-The-Shelf (COTS) system when determining degrees<br />
<strong>of</strong> coupling. (Dahlgren 2007) While the use <strong>of</strong> COTS in government systems was meant<br />
to provide an option (a right but not an obligation) to use commercially developed<br />
products produced under commercial Research & Development efforts, the unfortunate<br />
reality has become that as some COTS products have come to dominate the industry, then<br />
the use <strong>and</strong> upgrade <strong>of</strong> these products become an obligation <strong>and</strong> thus is no longer an<br />
option. Each coupling identified in the DSM should be evaluated according to whether<br />
COTS products are used <strong>and</strong> the degree <strong>of</strong> coupling.<br />
In an effort to quantify degrees <strong>of</strong> coupling, <strong>and</strong> then to be able to quantify whether<br />
systems are tightly or loosely coupled, the following formula was developed. (Dahlgren<br />
2007) These formulas attempt to take into account the couplings identified in the DSMs,<br />
the possible considerations for each level <strong>of</strong> the OSI stack, <strong>and</strong> the coupling to COTS.<br />
These formulas are not all inclusive. Systems not related to Information Technology may<br />
not need to be evaluated according to the OSI stack. Systems Engineers should attempt<br />
to determine if a modified factor needs to replace the OSI factors <strong>and</strong> the COTS factor.<br />
m n<br />
Coupling Coefficient = ∑ OSI i [ ∑ S i S j ] number <strong>of</strong> possible tight couplings<br />
i = 1 j = 1<br />
j = 1<br />
n<br />
COTS Portion <strong>of</strong> Coupling Coefficient = ∑ S (COTS)i S (COTS)j /Years to upgrade<br />
j = 1<br />
j = 1<br />
When subsystems are found to be tightly coupled, engineers need to determine if new<br />
interfaces should be inserted such that the subsystems are tightly coupled to the<br />
interfaces, yet can still evolve separately. In some cases, those interfaces may become<br />
system st<strong>and</strong>ards for future designs. Theoretically, if each system remains coupled to the<br />
st<strong>and</strong>ard, then they can be loosely coupled to each other <strong>and</strong> evolve separately at their<br />
own clock speed. Systems engineers <strong>and</strong> program managers should attempt to include<br />
st<strong>and</strong>ards <strong>and</strong> show that coupling in the DSM/ESM framework. A judicious use <strong>of</strong><br />
st<strong>and</strong>ards <strong>and</strong> interfaces can greatly lower the degree <strong>of</strong> coupling on a major system.<br />
Unfortunately commercial vendors can attempt to “tweak” the implementation <strong>of</strong><br />
st<strong>and</strong>ards to form what might be considered a “semi-proprietary” solution, leading to a<br />
developer-forced proprietary solution <strong>and</strong> tight coupling for most customers <strong>and</strong><br />
applications.<br />
16 <strong>of</strong> 31
Coupling can also relate to processes <strong>and</strong> organizations. For instance, DSM techniques<br />
can be applied to the original design <strong>of</strong> an organization or to the redesign <strong>of</strong> an<br />
organization (Dahlgren <strong>and</strong> Cokus 2007). The type <strong>of</strong> information provided in an<br />
organizational DSM can also aid designers to determine the degree <strong>of</strong> coupling that is<br />
required between individuals performing the functions. For instance, in a small world<br />
network an organization has a mix <strong>of</strong> tight <strong>and</strong> loose couples. Those people requiring<br />
tight couples may need to communicate or interact frequently. Those people may also<br />
need to be collocated together to improve efficiency <strong>and</strong> effectiveness. Furthermore, by<br />
looking across social <strong>and</strong> technical domains, a DSM that shows the linkage between<br />
people on a project <strong>and</strong> between tasks may help engineers <strong>and</strong> managers improve<br />
underst<strong>and</strong>ing <strong>of</strong> the organization evolution. The clustering coefficient (CC) is the<br />
organizational equivalent <strong>of</strong> the coupling coefficient for component DSMs: CC = # tight<br />
connections/# possible tight connections (Barabasi 2003). Too many tight connections<br />
will lead to a task or project that fails to utilize long-reach connections to leverage work<br />
done by other organizations (Dahlgren 2007).<br />
<strong>MIT</strong>RE recently applied coupling techniques to analyze a components-based DSM for<br />
VISA International. (Cokus <strong>and</strong> Dahlgren 2007) <strong>MIT</strong>RE used high level DSMs in the<br />
analysis <strong>of</strong> historical changes <strong>of</strong> the four major subsystems <strong>of</strong> VISA International: credit<br />
card, card information reader, transmission system, <strong>and</strong> data base. The case study<br />
visually demonstrated the system change over time <strong>and</strong> how VISA International’s<br />
subsystems became more loosely coupled. Interactions were ranked as High, Medium, or<br />
Low to show historical system changes. As the subsystems became more loosely coupled,<br />
the overall VISA International system became more efficient to operate <strong>and</strong> easier for the<br />
customers to use (Cokus <strong>and</strong> Dahlgren 2007). Transactions were completed much faster<br />
<strong>and</strong> likely with much greater accuracy, which helped make credit cards a useful tool.<br />
Real Options<br />
To better manage the uncertainties surrounding engineering systems, engineers are<br />
devising new methods to designing systems that are flexible. “One <strong>of</strong> the challenges for<br />
designers is to identify where in the system to lay in flexibility, or real options, that allow<br />
systems designers <strong>and</strong> managers to easily change the system in order to maximize benefit<br />
<strong>and</strong> minimize cost.” (Bartolomei 2007) Strategies <strong>and</strong> methods for valuing flexibility<br />
are well documented in real options literature; however few have focused on how to<br />
screen a system to identify the best opportunities for options, or the “hot” spots in the<br />
design.<br />
Real Options <strong>Analysis</strong> (ROA) can be applied “on” a system or “in” a system. (Wilds <strong>and</strong><br />
Bartolomei, et al 2007) When analyzing options “on” a system, flexibility is external to<br />
the physical design. Alternatively, real options analysis “in” a system requires the flexible<br />
option be internal to the physical design. A real option “in” requires deep knowledge<br />
about the structure <strong>and</strong> behavior <strong>of</strong> the technical system.<br />
ROA tools can be used by system designers, manufacturers, <strong>and</strong> consumers alike to make<br />
informed decisions about the value <strong>of</strong> adding flexibility to the system at various stages <strong>of</strong><br />
development. This is most useful early in the development process when opportunities<br />
17 <strong>of</strong> 31
for flexibility are more available to developers. For example, Wilds <strong>and</strong> Bartolomei, et al<br />
(2007) value the predicted options for designing a Micro Air Vehicle. An option to alter<br />
the physical design to provide increased performance was valued from the perspective <strong>of</strong><br />
a product developer. The research applied decision analysis <strong>and</strong> the lattice method <strong>of</strong><br />
real options. The results showed that designing for the flexibility to modify the system to<br />
respond to changing performance requirements could be a valuable investment early in<br />
the design.<br />
One <strong>of</strong> the challenges for designers is to identify where in the system to lay in flexibility,<br />
or real options, that allow systems designers <strong>and</strong> managers to easily change the system in<br />
order to maximize benefit <strong>and</strong> minimize cost. Bartolomei (2007) attempted to develop a<br />
technique to identify hot <strong>and</strong> cold spots in a system. Hot spots are those spots that are<br />
expected to frequently change, possibly due to technological innovation. Cold spots are<br />
those areas that are not expected to change. Below is a proposed approach using the<br />
ESM that incorporates <strong>and</strong> extends both the Sensitivity DSM <strong>and</strong> change propagation<br />
techniques. (Kalligeros 2006; Suh 2005)<br />
Proposed Technique for Identifying Real Options<br />
(Souce: Bartolomei 2007)<br />
1. Construct ESM <strong>of</strong> a particular system<br />
2. Identify sources <strong>of</strong> uncertainty driving change<br />
3. Define change scenarios<br />
4. Identify change modes for each scenario (E.g. Suh’s<br />
change propagation method)<br />
5. Calculate how change modes affect objectives for<br />
each scenario (e.g. Kallegeros’ Sensitivity DSM.<br />
6. Calculate the cost <strong>of</strong> change for each scenario (e.g.<br />
Suh’s cost analysis)<br />
7. Identify Hot/Cold Spots for each scenario<br />
8. Examine Hot/Cold spots across scenarios<br />
9. Value flexibility using Real Options <strong>Analysis</strong><br />
Most research has focused on hot spots; however customers have shown interest in<br />
identifying cold spots that must “support” the frequent change <strong>of</strong> hot spots. One possible<br />
strategy <strong>of</strong> support would be to over-design the cold spots to facilitate hot spot changes<br />
that might require a greater engineering margin. Bartolomei (2007) also brought out the<br />
possible use <strong>of</strong> ESMs to model the system changes due to changing Concepts <strong>of</strong><br />
Operations, which is <strong>of</strong>ten common for a new system or new technology application.<br />
Real Options relate not only to tangible hardware systems, but also to processes <strong>and</strong><br />
organizations. “For ‘hot/cold’ spot analysis there are several advantages <strong>of</strong> representing<br />
each domain <strong>and</strong> the corresponding interactions between domains. For example, the ESM<br />
provides a richer picture for how changes propagate across domains (eg highlight how<br />
changes in the technical domain affect the process domain <strong>and</strong> social domains) <strong>and</strong> the<br />
18 <strong>of</strong> 31
identification <strong>of</strong> exogenous sources <strong>of</strong> uncertainties that might each <strong>of</strong> the domains by<br />
constructing the systems drivers matrix.” (Bartolomei 2007)<br />
Part 3: <strong>Applications</strong> <strong>of</strong> <strong>Analysis</strong> Techniques Across Multiple <strong>Domain</strong>s<br />
To review, the DSM is an nxn, square matrix containing nodes <strong>and</strong> relations within a<br />
single domain. The DMM is an mxn rectangular matrix containing nodes <strong>and</strong> relations<br />
across two domains, where the rows represent one domain <strong>and</strong> the columns represent<br />
another domain. (Browning <strong>and</strong> Danilovic 2007) Furthermore, the ESM is an mxn<br />
rectangular matrix consisting <strong>of</strong> nodes <strong>and</strong> relations, each having multiple attributes,<br />
across multiple domains. (Bartolomei 2007) Multi-domain analysis has many<br />
challenges, <strong>and</strong> the techniques described in Part 2 may not be applicable, or sufficient, to<br />
provide valid results. This section will consider the following questions:<br />
o Can the DMM/ESM be organized or manipulated to apply the analysis techniques<br />
presented in Part 2 due to technique assumptions?<br />
o Can the techniques presented in Part 2 be applied to DMMs <strong>and</strong> the ESM to<br />
provide useful analysis?<br />
The order <strong>of</strong> these questions is intentional. First, it is important to underst<strong>and</strong> how the<br />
ESM can be manipulated to accommodate the assumptions or constraints <strong>of</strong> the analysis<br />
techniques. Then, the practicality <strong>of</strong> applying those techniques to provide useful results<br />
can be considered.<br />
Assumptions <strong>of</strong> Techniques<br />
Classical DSM techniques assume square matrices <strong>and</strong> a single domain. The methods<br />
expect the rows <strong>and</strong> columns to be identical. Both the ESM <strong>and</strong> DMM violate both these<br />
conventions. While it is possible that a ESM or DMM may be square, this case would be<br />
the exception, not the rule. Attempts in past research to restrict the information matrix to<br />
square dimensions, forcing one-to-one mappings across domains, has produced<br />
incomplete or even misrepresented results, as expected.<br />
The ESM can be viewed in two different perspectives: the matrix as a whole containing<br />
all the entered data or a collection <strong>of</strong> matrices comprising the matrix as a whole.<br />
Consider the following decomposition <strong>of</strong> the ESM, divided by the domain boundaries, to<br />
blocks <strong>of</strong> information as shown in Figure 4.<br />
19 <strong>of</strong> 31
Figure 4 ESM Decomposition to DSMs <strong>and</strong> DMMs<br />
Notice that the blocks on the ESM diagonal are single domain DSMs. By further<br />
investigation, the <strong>of</strong>f-diagonal blocks are DMMs. Therefore, the information residing in<br />
the individual DSMs now follow the assumptions required to classical DSM analysis<br />
techniques.<br />
The DMM blocks may still violate the technique assumptions. The tools <strong>and</strong> algorithms<br />
currently employed for classical DSM analysis operate assuming a square matrix. Rather<br />
than forcing the use <strong>of</strong> insufficient tools, it is recommended that new algorithms be<br />
considered to accommodate rectangular matrices. Another approach might be to append<br />
“empty” rows or columns to create a square matrix; “empty” rows consist <strong>of</strong> a mock node<br />
that has no defined relationship to the true nodes in the matrix. However, this approach is<br />
not recommended. The influence <strong>of</strong> a mock node in the results may not be easily<br />
abstracted, thus invalidating any analysis.<br />
Looking beyond the dimensions <strong>of</strong> the matrix, classical DSM techniques such as<br />
clustering <strong>and</strong> partitioning involve identifying patterns <strong>of</strong> relationships around the matrix<br />
diagonal. DMMs do not have this “diagonal,” not only due to dimensions, but rather due<br />
to the rows <strong>and</strong> columns not being identical. The current algorithms for these techniques<br />
reorder the rows <strong>and</strong> columns together to form clusters or feedback loops. However, to<br />
apply clustering to DMMs, Danilovic <strong>and</strong> Browning (2007) required a new algorithm that<br />
moves the rows <strong>and</strong> columns individually in an attempt to find clusters <strong>of</strong> relations.<br />
Figure 5 displays an example <strong>of</strong> clustering <strong>of</strong> a DMM. (Danilovic <strong>and</strong> Browning 2007)<br />
Although no analysis has been accomplished to date, it is hypothesized that a similar<br />
algorithm, if not the same, could be applied to the ESM.<br />
20 <strong>of</strong> 31
Figure 5 Example <strong>of</strong> Clustering Applied to DMM (Source: Danilovic <strong>and</strong> Browning 2007)<br />
Non-DSM techniques also include assumptions impacting the application to multidomain<br />
analysis. However, most can be summarized by considering that typically only<br />
one domain is considered. Thus, analysis <strong>of</strong> the results must be carefully scrutinized to<br />
underst<strong>and</strong> the implications. This is the emphasis <strong>of</strong> the remainder <strong>of</strong> Part 3.<br />
Producing Useful Results<br />
Now that it seems possible to extend the analysis techniques beyond the original<br />
purposes, consider whether it is appropriate to apply the techniques <strong>and</strong> the validity <strong>of</strong> the<br />
results. This section will provide examples <strong>of</strong> applying the analysis techniques to the<br />
ESM <strong>and</strong> DMM.<br />
21 <strong>of</strong> 31
Application <strong>of</strong> Classical DSM Techniques<br />
As previously emphasized, partitioning <strong>and</strong> sequencing apply to time-based DSMs, while<br />
clustering applies to static-based DSMs. Recall from Part 1 that time-based DSMs <strong>and</strong><br />
static-based DSMs are distinguished by the domain represented by the nodes. Therefore,<br />
in the case <strong>of</strong> across domain analysis, as in a DMM or ESM, the application <strong>of</strong> clustering<br />
or partitioning is not clearly delineated. Classical DSM analysis techniques involve<br />
homogeneity <strong>of</strong> domain. However, Danilovic <strong>and</strong> Browning (2007) suggest that this<br />
assumption can be resolved with careful attention to interpreting the results. If the<br />
desired result is identifying interdependencies between system elements for instance,<br />
clustering would still identify groups <strong>of</strong> interdependent entities. The clusters derived<br />
from an ESM would likely be heterogeneous, with a potential for great variety <strong>of</strong> entities<br />
<strong>and</strong> relationships grouped in the clusters. Even though the implied meaning <strong>of</strong> an ESM<br />
cluster may not be immediately clear, clustering will uncover interdependencies across all<br />
the entities in the ESM. This result could be used to better underst<strong>and</strong> how elements<br />
from other domains are driving or impairing the system design. Additionally, once the<br />
clusters are brought to attention, subsequent analysis can be applied to determine the<br />
potential implications. Table 2 compares <strong>and</strong> contrasts clustering results as applied to<br />
single-domain analysis (DSM) <strong>and</strong> multi-domain analysis (DMM).<br />
Table 2 Outcome <strong>of</strong> Clustering <strong>Analysis</strong> (Source: Modified from Danilovic <strong>and</strong> Browning 2007)<br />
DSM<br />
DMM<br />
Technique Sequencing Clustering Clustering<br />
Partitioning<br />
Algorithm<br />
Outcome <strong>of</strong><br />
<strong>Analysis</strong><br />
Triangularization Clustering <strong>of</strong> blocks<br />
along diagonal<br />
Sequencing,<br />
minimizing<br />
feedback loops<br />
Clusters <strong>of</strong> items,<br />
hierarchical<br />
structures/interface<br />
identification<br />
Clustering <strong>of</strong> items<br />
Clusters <strong>of</strong> items,<br />
dependencies/interface<br />
identification<br />
The application <strong>of</strong> partitioning or sequencing implies time-based information, <strong>and</strong> not all<br />
domains in the ESM methodology have time implications. Recall that all elements in the<br />
ESM have a time attribute known as existence. However, this is not the same time<br />
description <strong>of</strong> time implied by sequencing. Sequencing involves a timed duration to<br />
achieve task completion or a timed event describing a schedule. Therefore, it is unclear if<br />
sequencing can be applied. One possible outcome is that all elements without time<br />
dependency would be “flushed out” to the bottom <strong>of</strong> the matrix. Although no examples<br />
have been accomplished to date, Danilovic <strong>and</strong> Browning (2007) suggest that sequencing<br />
may be appropriate if one or more <strong>of</strong> the domains is time dependent. Further research is<br />
required to better underst<strong>and</strong> this hypothesis.<br />
To better underst<strong>and</strong> the implications <strong>of</strong> classical DSM techniques consider the following<br />
example. A two-domain DMM mapping stakeholders to activities may be constructed to<br />
represent the responsibility or tasking relationship between the organization <strong>and</strong> the<br />
process <strong>of</strong> the product development. What algorithm should be used to perform analysis?<br />
22 <strong>of</strong> 31
The stakeholder domain implies a clustering algorithm, resulting in clusters <strong>of</strong><br />
dependencies. The activities domain suggests a sequencing algorithm, resulting in a<br />
efficiently sequenced process minimizing iterative time cycles. However, when pairing<br />
these domains, perhaps it is most important to first underst<strong>and</strong> why the interactions are<br />
being analyzed.<br />
To carry the example through, consider a program manager that is interested in rationally<br />
organizing the team to maximize productivity (reduce delays for information flow) <strong>and</strong><br />
allocation <strong>of</strong> expertise while diversifying to cover all fields <strong>of</strong> the project. Therefore, the<br />
manager is interested in underst<strong>and</strong>ing not only the stakeholder interactions (ie the<br />
stakeholder DSM) <strong>and</strong> the activities sequencing (ie activities DSM), but requires<br />
knowledge <strong>of</strong> how the stakeholders relate to the activities (ie the stakeholder-activities<br />
DMM). See Figure 6.<br />
Stakeholders<br />
Activities<br />
Stakeholders<br />
Stakeholders<br />
Activities<br />
Activities<br />
(a) Stakeholder<br />
DSM<br />
(b) Activities<br />
DSM<br />
(c) Stakeholder-<br />
Activities DMM<br />
Figure 6 Individual <strong>Matrix</strong> Representation for (a) Stakeholders DSM, (b) Activities DSM, <strong>and</strong> (c)<br />
Stakeholders-Activities DMM<br />
In this case, analyzing the two DSMs <strong>and</strong> the DMM separately may provide useful<br />
results. However, this compartmental strategy for analyzing the system may cause losses<br />
in true underst<strong>and</strong>ing <strong>of</strong> multi-domain interactions provided from a more holistic<br />
representation. Another strategy might be to apply techniques to a single combination<br />
matrix composed <strong>of</strong> the two-domains as shown in Figure 7.<br />
23 <strong>of</strong> 31
Stakeholders<br />
Stakeholders<br />
Stakeholder<br />
DSM<br />
Stakeholders<br />
Activities<br />
Activities-<br />
Stakeholder<br />
DMM<br />
Activities<br />
Activities<br />
Stakeholder –<br />
Activities<br />
DMM<br />
Activities<br />
DSM<br />
Figure 7 Stakeholder-Activities Combination <strong>Matrix</strong> Representation<br />
Notice that the single matrix construction yields a different matrix diagonal. When<br />
analyzed separately, the stakeholders-activities DMM could only represent the existence<br />
<strong>of</strong> a relation between the stakeholder <strong>and</strong> the activity. Yet, when analyzed as a whole,<br />
the matrix can represent whether the stakeholder impacts the activity or the activity<br />
impacts the stakeholder, yielding feedforward/feedback information. This realization<br />
indicates that separate analysis, while sufficient in some cases, does produce losses <strong>of</strong><br />
information or detail for clarity <strong>of</strong> information.<br />
Furthermore, the analysis <strong>of</strong> the combination matrix still neglects the interactions with all<br />
the other domains <strong>of</strong> the ESM. Bartolomei concluded that managers <strong>of</strong>ten recognize the<br />
first-order relationships, but fail to underst<strong>and</strong> the impacts <strong>of</strong> higher-order relations. For<br />
instance in this example, the program manager could most likely quickly interpret the<br />
analysis <strong>of</strong> the stakeholder-activities interactions from the individual DSMs <strong>and</strong> DMMs<br />
<strong>and</strong> the combination matrix with relative ease. However, answering why or how to affect<br />
the outcome requires additional information from other domains. Thus, expansion to<br />
multi-domain analysis <strong>and</strong> construction <strong>of</strong> an ESM might provide additional insights to<br />
consider, such as rotation requirements <strong>of</strong> stakeholders (system drivers), time delays <strong>of</strong><br />
component delivery due to subsystem dependencies (objects), etc.<br />
Application <strong>of</strong> Network <strong>Analysis</strong> Techniques<br />
Social network analysis metrics, such as betweeness, path length, <strong>and</strong> centrality each<br />
have a particular meaning in the context <strong>of</strong> social networks, yet may be extensible to<br />
analysis <strong>of</strong> matrices including elements within the social domain. Bartolomei (2007)<br />
questions to what extent existing social network measures apply when analyzing a<br />
heterogeneous network with components from multiple domains. While his research<br />
does not attempt to answer this question, it does explore observations gleaned by<br />
applying these metrics to a product development case study. The metrics calculated<br />
included average degree (the average number <strong>of</strong> in- <strong>and</strong> out- relations per node), average<br />
path length, <strong>and</strong> clustering coefficient metrics for five different times in the product<br />
development life-cycle. (Newman 2003) Bartolomei (2007) concluded that the results<br />
24 <strong>of</strong> 31
differed over time, <strong>and</strong> thus warranted further investigation <strong>of</strong> the changing elements. He<br />
then analyzed the individual domains <strong>of</strong> the nodes appearing highest among the centrality<br />
measures, allowing him to better underst<strong>and</strong> the product development dependency on a<br />
few critical system elements. Most interestingly to this discussion is that these critical<br />
elements were from multiple domains, results which could only be obtained by<br />
conducting multi-domain analysis.<br />
Bartolomei (2007) also compared the betweeness analysis <strong>of</strong> the single domain<br />
stakeholders DSM to the analysis conducted over the entire ESM network. In this<br />
example, the betweeness for the top ten stakeholders in each result was predicted to be<br />
identical. However, the results proved that by restricting the analysis to the social<br />
domain only, the significance <strong>of</strong> stakeholders with strong interactions across other<br />
domains was not realized. Figure 8 displays the results <strong>of</strong> the betweeness analysis <strong>of</strong><br />
both the DSM <strong>and</strong> the ESM.<br />
Rank MAV-PD Social Network Betweeness Rank MAV-PD Entire Network Betweeness<br />
1 PMWJ 500.199 1 PMWJ 10972.993<br />
2 STCC 199.471 2 KTRDM 3680.017<br />
3 PMBI (MAV-PD PM 3) 84.154 3 KTRNM 1972.081<br />
4 SPOMD 54.547 4 STCC 1556.707<br />
5 SPOKE 45.143 5 PMBI (MAV-PD PM 3) 1372.588<br />
6 SPOGR 43.867 6 KTRRC 1004.062<br />
7 KTRDM 40.153 7 KTRTT 618.312<br />
8 STYA 21.676 8 KTRBR 390.463<br />
9 STSP 20.47 9 SPOMD 293.354<br />
10 PMFC 15.23 10 STYA 275.212<br />
Figure 8 Stakeholder Betweeness Rankings Analyzed by (a) Single DSM <strong>and</strong> (b) the Entire ESM<br />
(Source: Bartolomei 2007)<br />
These two examples suggest the importance <strong>of</strong> considering multi-domain interactions in<br />
complex systems involving both social <strong>and</strong> technical domains. Network analysis<br />
techniques may be able to give managers <strong>and</strong> engineers a richer underst<strong>and</strong>ing <strong>of</strong> how the<br />
social actors influence the system <strong>and</strong>/or provide insights into possible cause/effect<br />
relationships within a socio-technical system.<br />
Network-based change propagation analysis been demonstrated as a tool for multidomain<br />
analysis, although using Axiomatic <strong>Design</strong> rather than DMMs or ESM. Suh<br />
(2005) applies network-based change propagation analysis to the system components in<br />
an Axiomatic <strong>Design</strong> framework to identify the components classified as “change<br />
multipliers”. (Bartolomei 2007) Axiomatic design consists <strong>of</strong> only four domains:<br />
customer domain, functional domain, physical domain, <strong>and</strong> process domain. (Suh 1995)<br />
Relating to ESMs, the customer domain can easily be correlated to the objectives matrix<br />
in terms <strong>of</strong> resident information. Likewise, the physical domain relates to the objects<br />
matrix, the process domain to the activities matrix, <strong>and</strong> the functional domain to the<br />
functions matrix. But the relationships above are not perfect <strong>and</strong> are incomplete. The<br />
ESM also contains information on the system drivers <strong>and</strong> the stakeholders. This<br />
information is indeed relevant <strong>and</strong> contained in axiomatic design, although not clearly<br />
observable. Suh (1995) suggests that the character vectors for the four domains changes<br />
depending on the context <strong>of</strong> the design as shown in Figure 9.<br />
25 <strong>of</strong> 31
Figure 9 Characteristics for the Four <strong>Domain</strong>s <strong>of</strong> the <strong>Design</strong> World [for various designs:<br />
manufacturing, materials, s<strong>of</strong>tware, organizations, systems] (Source: Suh 1995)<br />
Suh’s character vector determines the type <strong>of</strong> information that will reside in the domain,<br />
<strong>and</strong> thus may also change how that domain corresponds to the ESM. For example, when<br />
examining the context <strong>of</strong> an organization the process variables are most likely people;<br />
however, the context <strong>of</strong> material design utilizes processes to populate the process<br />
variables. Therefore, it may be unwise to attempt to force the structure <strong>of</strong> axiomatic<br />
design onto the ESM approach. Instead, ESM may benefit from the general thinking <strong>of</strong><br />
axiomatic design, specifically in thinking across two domains: function <strong>and</strong> form, form<br />
<strong>and</strong> process, or indirectly function <strong>and</strong> process.<br />
Conclusions <strong>and</strong> Future Research<br />
There are several promising analytical techniques <strong>and</strong> approaches that suggest that the<br />
DSM, DSM/DMM <strong>and</strong> ESM modeling frameworks can be useful to represent <strong>and</strong><br />
improve underst<strong>and</strong>ing about engineering systems. The ESM extends beyond the<br />
knowledge <strong>of</strong> both DSM <strong>and</strong> DMM, including multi-domain information <strong>and</strong> the ability<br />
to include attributes <strong>of</strong> time <strong>and</strong> value.<br />
This paper has provided many examples <strong>of</strong> each modeling framework <strong>and</strong> the application<br />
<strong>of</strong> analysis techniques. The literature contains numerous applications <strong>of</strong> classical DSM<br />
techniques applied to single domain matrices. However, the application <strong>of</strong> the<br />
DSM/DMM <strong>and</strong> ESM methodologies are limited at this time. Future work is required to<br />
determine the extent for which the methodologies can be efficiently used as a means to<br />
learn about the structure <strong>and</strong> behavior <strong>of</strong> engineering systems, with specific focus on<br />
multi-domain interactions. Additional consideration should be given to:<br />
1. How to apply appropriately the analysis techniques to the ESM Methodology?<br />
The ESM can be analyzed holistically or as a decomposition <strong>of</strong> selected<br />
information for analysis. Further investigation <strong>of</strong> the impact <strong>of</strong> combining<br />
26 <strong>of</strong> 31
information from multiple domains is required to underst<strong>and</strong> the meaning <strong>of</strong><br />
results from conventional analysis techniques. Additionally, research efforts for<br />
examining the integration <strong>of</strong> multi-design optimization, system dynamics models,<br />
<strong>and</strong> real options to the methodologies is critical for extending the applications <strong>of</strong><br />
the frameworks.<br />
2. What are the applications <strong>of</strong> the ESM methodology? Bartolomei (2007)<br />
suggested that the ESM methodology may be able to augment the development <strong>of</strong><br />
system architectectures such as the Department <strong>of</strong> Defense Architecture<br />
Framework (DoDAF). <strong>MIT</strong>RE has more recently exp<strong>and</strong>ed this effort <strong>and</strong><br />
continues to correlate the information residing in the ESM to the individual views<br />
<strong>of</strong> the DoDAF. Furthermore, new research to determine the ability to scale<br />
engineering systems <strong>and</strong> identify real options for flexibility continues to mature.<br />
Acknowledgements<br />
The work presented in this paper was supported <strong>and</strong> funded in part by The <strong>MIT</strong>RE<br />
Corporation, the US Air Force, <strong>and</strong> Massachusetts Institute <strong>of</strong> Technology Engineering<br />
Systems Division.<br />
27 <strong>of</strong> 31
References<br />
Atkinson, S. R. <strong>and</strong> M<strong>of</strong>fatt, J. (2005). “The Agile Organization: From Informal<br />
Networks to Complex Effects <strong>and</strong> Agility.” Assistant Secretary <strong>of</strong> Defense<br />
(C3I/Comm<strong>and</strong> Control Research Program), DTIC: Washington, DC. NTIS Order<br />
Number: ADA457169.<br />
http://www.ntis.gov/search/product.asp?ABBR=ADA457169&starDB=GRAHIST<br />
Barabasi, A. (2003). Linked: How Everything is Connected to Everything Else <strong>and</strong> What<br />
It Means. New York: Plume.<br />
Bartolomei, J. E. (2007). Qualitative Knowledge Construction for Engineering Systems:<br />
Extending the <strong>Design</strong> <strong>Structure</strong> <strong>Matrix</strong> Methodology in Scope <strong>and</strong> Procedure.<br />
Cambridge, MA. Massachusetts Institute <strong>of</strong> Technology, Engineering Systems Division.<br />
Doctoral Dissertation.<br />
Browning, T. R. (2001). “Applying the <strong>Design</strong> <strong>Structure</strong> <strong>Matrix</strong> to System<br />
Decomposition <strong>and</strong> Integration Problems: A Review <strong>and</strong> New Directions.” IEEE<br />
Transactions on Engineering Management 48: 292-306.<br />
http://sbufaculty.tcu.edu/tbrowning/Publications/Browning%20(2001)--IEEE-<br />
TEM%204%20DSMs.pdf<br />
Browning, T. R. (1996). Systematic IPT Integration in Lean Development Programs.<br />
Cambridge, MA. Massachusetts Institute <strong>of</strong> Technology, Technology <strong>and</strong> Policy<br />
Program. Master’s Thesis.<br />
Cesiel, D. S. (1993). A <strong>Structure</strong>d Approach to Calibration Development for Automotive<br />
Diagnostic Systems. Cambridge, MA. Massachusetts Institute <strong>of</strong> Technology, Alfred P.<br />
Sloan School <strong>of</strong> Management/E.E. Master’s Thesis.<br />
Cokus, M. S. <strong>and</strong> Dahlgren, J. W. (2007). “System Evolution in the Intelligent<br />
Enterprise: A Historical Case Study <strong>of</strong> VISA’s Transaction Processing Systems.” San<br />
Diego, CA. International Conference on Systems Engineering (INCOSE) Proceedings,<br />
Session 5, Track 1: Intelligent Enterprises. http://www.incose.org/symp2007/<br />
Dahlgren, J. W. (2007). “Developing a Framework for Exploring Clustering Coefficient<br />
to Evaluate System Coupling.” Newport, RI. International Comm<strong>and</strong> <strong>and</strong> Control<br />
Research Technology Symposium (ICCRTS) Conference Proceedings, Technologies <strong>and</strong><br />
Systems Track, No. 140.<br />
http://www.dodccrp.org/events/12th_ICCRTS/12th_ICCRTS_Detailed_Agenda.pdf<br />
Dahlgren, J. W. <strong>and</strong> Cokus, M. S. (2007). “Real Options <strong>and</strong> Flexibility in<br />
Organizational <strong>Design</strong>.” Honolulu, HI. First Annual Institute <strong>of</strong> Electrical <strong>and</strong><br />
Electronics Engineers (IEEE) Systems Conference Proceedings, Track 2: Enterprise<br />
Systems Engineering. http://www.ieeesystemscouncil.org/conference-<br />
2007/sysconference2007.asp<br />
28 <strong>of</strong> 31
Danilovic, M. <strong>and</strong> T. R. Browning (2007). "Managing Complex Product Development<br />
Projects with <strong>Design</strong> <strong>Structure</strong> Matrices <strong>and</strong> <strong>Domain</strong> Mapping Matrices." International<br />
Journal <strong>of</strong> Management 25: 300-314.<br />
Danilovic, M. L. (1999). Leadership <strong>and</strong> Organization <strong>of</strong> Integration in Product<br />
Development. Linkoping, Sweden. Linkoping University. Doctoral Dissertation.<br />
Dong, Q. (1999). Representing Information Flow <strong>and</strong> Knowledge Management in<br />
Product <strong>Design</strong> Using the <strong>Design</strong> <strong>Structure</strong> <strong>Matrix</strong>. Cambridge, MA. Massachusetts<br />
Institute <strong>of</strong> Technology, Department <strong>of</strong> Mechanical Engineering. Master’s Thesis.<br />
Eppinger, S. D. (2002). Patterns <strong>of</strong> Product Development Interactions. Cambridge,<br />
Mass. Massachusetts Institute <strong>of</strong> Technology: Working Paper No. ESD-WP-2003-01.05-<br />
ESD Internal Symposium. http://esd.mit.edu/WPS/author.htm#eppinger<br />
Eppinger, S. D. (2001). "Innovation at the speed <strong>of</strong> information." Harvard Business<br />
Review 79(1): 149-+.<br />
Eppinger, S. D. (1997). A Planning Method for Integration <strong>of</strong> Large-Scale Engineering<br />
Systems. International Conference on Engineering <strong>Design</strong>, Tampere.<br />
http://web.mit.edu/eppinger/www/publications.html<br />
Fern<strong>and</strong>ez, C. I. G. (1998). Integration <strong>Analysis</strong> <strong>of</strong> Product Architecture to Support<br />
Effective Team Co-Location. Cambridge, MA. Massachusetts Institute <strong>of</strong> Technology,<br />
Center for Innovation in Product Development. Master’s Thesis.<br />
http://cipd.mit.edu/education/theses.htm<br />
Grose, David L. (1994). "Reengineering the Aircraft <strong>Design</strong> Process.” Panama City<br />
Beach, FL. Fifth AIAA/USAF/NASA/ISSMO Symposium on Multidisciplinary<br />
<strong>Analysis</strong> <strong>and</strong> Optimization.<br />
http://www.aiaa.org/content.cfm?pageid=406&gTable=mtgpaper&gID=78880<br />
Kalligeros, K. (2006). Platforms <strong>and</strong> Real Options in Large-Scale Engineering Systems.<br />
Cambridge, MA. Massachusetts Institute <strong>of</strong> Technology, Engineering Systems Division.<br />
Doctoral Dissertation.<br />
Koo, B. (2005). A Meta-Language for Systems Architecting. Engineering Systems<br />
Division. Cambridge MA. Massachusetts Institute <strong>of</strong> Technology, Engineering Systems<br />
Division. Doctoral Dissertation.<br />
Kusiak, A. <strong>and</strong> Wang, J. (1993). “ Efficient Organizing <strong>of</strong> <strong>Design</strong> Activities.”<br />
International Journal <strong>of</strong> Production Research 31: 753-769.<br />
Malmstrom, J. <strong>and</strong> J. Malmquist (1998). Trade-Off <strong>Analysis</strong> <strong>of</strong> Product Decompositions.<br />
Minneapolis MN. ASME Conference on <strong>Design</strong> Theory <strong>and</strong> Methodology.<br />
http://catalog.asme.org/ConferencePublications/CDROM/1998_Proceedings_<strong>Design</strong>.cfm<br />
29 <strong>of</strong> 31
McCord, K. R. <strong>and</strong> Eppinger, S. D. (1993). Managing the Integration Problem in<br />
Concurrent Engineering. Cambridge, Mass. Alfred P. Sloan School <strong>of</strong> Management,<br />
Massachusetts Institute <strong>of</strong> Technology: Working Paper No. 3594.<br />
http://web.mit.edu/eppinger/www/publications.html<br />
Morelli, M.D., Eppinger, S.D., <strong>and</strong> Gulati, R.K. (1995). “Predicting Technical<br />
Communication in Product Development Organizations.” IEEE Transactions on<br />
Engineering Management 42: 215-222.<br />
http://web.mit.edu/eppinger/www/publications.html<br />
Park, H. <strong>and</strong> M. R. Cutowsky (1999). "Framework for Modeling Dependencies in<br />
Collaborative Engineering Processes." Research in Engineering <strong>Design</strong> 6(1): 1-12.<br />
Pimmler, T. U. <strong>and</strong> S. D. Eppinger (1994). Integration <strong>Analysis</strong> <strong>of</strong> Product<br />
Decompositions. Minneapolis, MN. ASME Conference on <strong>Design</strong> Theory <strong>and</strong><br />
Methodology, pp343-351. http://web.mit.edu/eppinger/www/publications.html<br />
Rask, I. <strong>and</strong> Sunnersjo, S. (1998). <strong>Design</strong> <strong>Structure</strong> Matrices for the Planning <strong>of</strong> Rule-<br />
Based Engineering Systems. Goteborg, Sweden. Proc. European Conference on<br />
Integration in Manufacturing.<br />
Sabbaghian, N., Eppinger, S. D., <strong>and</strong> Murman, E. (1998). Product Development Process<br />
Capture <strong>and</strong> Display Using Web-Based Technologies. La Jolla, CA. IEEE Conference<br />
on Systems, Man, <strong>and</strong> Cybernetics 3: 2664-2669.<br />
http://web.mit.edu/eppinger/www/publications.html<br />
Sharman, D. <strong>and</strong> Yassine, A. (2004). “Characterizing Complex Product Architectures.”<br />
Systems Engineering 7(1): pp35-60.<br />
Smith, R. P. <strong>and</strong> S. D. Eppinger (1997). "Identifying Controlling Features <strong>of</strong> Engineering<br />
<strong>Design</strong> Iteration." Management Science 43(3): 276-293.<br />
http://web.mit.edu/eppinger/www/publications.html<br />
Sosa, M. E., Eppinger, S. D., <strong>and</strong> Rowles, C. M. (2004). “The Misalignment <strong>of</strong> Product<br />
Architecture <strong>and</strong> Organizational <strong>Structure</strong> in Complex Product Development.”<br />
Management Science 50: 1674-1689.<br />
http://web.mit.edu/eppinger/www/publications.html<br />
Steward, D. V. (1981). "The <strong>Design</strong> <strong>Structure</strong> System: A Method for Managing the<br />
<strong>Design</strong> <strong>of</strong> Complex Systems." IEEE Transactions on Engineering Management 28: 71-<br />
74.<br />
Suh, E.S. (2005). Flexible Product Platforms. Cambridge, MA. Massachusetts Institute<br />
<strong>of</strong> Technology, Engineering Systems Division. Doctoral Dissertation.<br />
30 <strong>of</strong> 31
Suh, N. P. (1995). “<strong>Design</strong>ing-in <strong>of</strong> Quality Through Axiomatic <strong>Design</strong>.” IEEE<br />
Transactions on Reliability 44(2):256-264. http://dspace.mit.edu/h<strong>and</strong>le/1721.1/25610<br />
The <strong>Design</strong> <strong>Structure</strong> <strong>Matrix</strong> (DSM) Homepage. 10 July 2007. http://www.dsmweb.org/<br />
Wilds, J. W., Bartolomei, J. E., de Neufville, R. <strong>and</strong> Hastings, D. (2007). “Real Options<br />
In a Mini-UAV System.” Hoboken, NJ. 5th Conference on Systems Engineering<br />
Research, Track 1.1: Doctoral Research in System Engineering.<br />
http://www.stevens.edu/engineering/cser/<br />
Yu, T., Yassine, A., <strong>and</strong> Goldberg, D. (2003). “A Genetic Algorithm for Developing<br />
Modular Product Architectures.” Chicago, Illinois. ASME International <strong>Design</strong><br />
Engineering <strong>and</strong> Technical Conference: <strong>Design</strong> Theory <strong>and</strong> Methodology.<br />
http://66.102.1.104/scholar?hl=en&lr=&q=cache:ATeENrYmPLMJ:www.ge.uiuc.edu/pd<br />
lab/Papers/DTM-48657.pdf+<br />
31 <strong>of</strong> 31