Understanding CDM Methodologies - SuSanA
Understanding CDM Methodologies - SuSanA
Understanding CDM Methodologies - SuSanA

You also want an ePaper? Increase the reach of your titles
YUMPU automatically turns print PDFs into web optimized ePapers that Google loves.
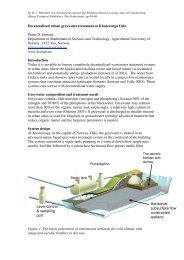
Project boundary<br />
The project encompasses the physical, geographical site of the methane<br />
recovery facility.<br />
Baseline scenario and additionality<br />
The baseline scenario is the situation where, in the absence of the project,<br />
biomass and other organic matter are left to decay anaerobically within the<br />
project boundary and methane is emitted to the atmosphere.<br />
Beyond the barrier analysis, project participants may use other tools to<br />
complement their additionality analysis, including the latest version of the<br />
“Tool for the demonstration and assessment of additionality”.<br />
Baseline Emissions<br />
Baseline Scenario:<br />
Waste that<br />
would decay<br />
anaerobically<br />
CO 2<br />
emissions<br />
only<br />
Default Flare<br />
Efficiency 90%, if<br />
Compliance with<br />
Manufacturer’s<br />
Specifications,<br />
otherwise 50%<br />
Open Flares<br />
Default Efficiency<br />
50%<br />
Temperature of<br />
below 500°C leads<br />
to zero Reductions<br />
Baseline emissions are calculated using the amount of waste that would<br />
decay anaerobically in the absence of the project and the appropriate<br />
emission factor. The latter should be calculated taking into account the<br />
amount of volatile solids produced in the manure and the maximum<br />
amount of methane able to be produced from that manure, as well as the<br />
characteristics of the manure management system 242 .<br />
Project Emissions<br />
Within the project boundaries, project participants shall only consider CO 2<br />
emissions from the use of fossil fuels or electricity to operate the facility.<br />
AMS-III.D provides no guidelines on how to calculate these emissions.<br />
Emission reductions<br />
Considering the low energy consumption of this type of projects and that<br />
leakage measurement is not required (with the exceptions mentioned below<br />
for PoA), project emissions and leakage are typically assumed to be zero.<br />
Hence, emissions reductions stem directly from the amount of methane<br />
fuelled or flared (with a maximal emission reductions equal to the methane<br />
generation potential calculated in the PDD for each specific year).<br />
Flare efficiency: In the case of methane flaring, the flaring efficiency may be<br />
determined by (i) the adoption of a 90% default value or (ii) the continuous<br />
monitoring of the efficiency. If a default value is used, a continuous<br />
monitoring process must be done to ensure compliance with manufacturer’s<br />
specification. Any non-compliance with these specifications shall result in the<br />
modification of the default value to 50% for all the duration of the noncompliance<br />
period.<br />
In the case of projects using open flares, a default value of 50% should be<br />
used, and if at any given time the temperature of the flare is below 500ºC, a<br />
default value equal to 0% should be used for this period.<br />
242<br />
For further guidance refer to 2006 IPCC Guidelines for National Greenhouse Gas Inventories, volume<br />
‘Agriculture, Forestry and other Land use’, chapter ‘Emissions from Livestock and Manure Management’. http://<br />
www.ipcc-nggip.iges.or.jp/public/2006gl/vol4.htm<br />
96