Understanding CDM Methodologies - SuSanA
Understanding CDM Methodologies - SuSanA
Understanding CDM Methodologies - SuSanA
You also want an ePaper? Increase the reach of your titles
YUMPU automatically turns print PDFs into web optimized ePapers that Google loves.
Investment<br />
Comparison for all<br />
Scenarios on Basis<br />
of Levelized Costs<br />
Sensitivity<br />
Analysis required<br />
Additionality<br />
Test repeats<br />
Investment<br />
Analysis<br />
Common Practice<br />
Test<br />
Impact of <strong>CDM</strong><br />
Scenario<br />
Registration Test<br />
Lowest of<br />
three Emissions<br />
Factors: BM, CM<br />
or Emissions<br />
Factor of Baseline<br />
Formula for<br />
Emissions Factor<br />
of Baseline<br />
Scenario<br />
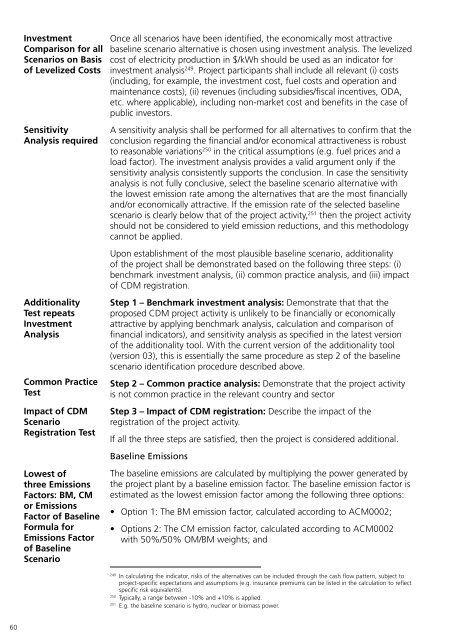
Once all scenarios have been identified, the economically most attractive<br />
baseline scenario alternative is chosen using investment analysis. The levelized<br />
cost of electricity production in $/kWh should be used as an indicator for<br />
investment analysis 249 . Project participants shall include all relevant (i) costs<br />
(including, for example, the investment cost, fuel costs and operation and<br />
maintenance costs), (ii) revenues (including subsidies/fiscal incentives, ODA,<br />
etc. where applicable), including non-market cost and benefits in the case of<br />
public investors.<br />
A sensitivity analysis shall be performed for all alternatives to confirm that the<br />
conclusion regarding the financial and/or economical attractiveness is robust<br />
to reasonable variations 250 in the critical assumptions (e.g. fuel prices and a<br />
load factor). The investment analysis provides a valid argument only if the<br />
sensitivity analysis consistently supports the conclusion. In case the sensitivity<br />
analysis is not fully conclusive, select the baseline scenario alternative with<br />
the lowest emission rate among the alternatives that are the most financially<br />
and/or economically attractive. If the emission rate of the selected baseline<br />
scenario is clearly below that of the project activity, 251 then the project activity<br />
should not be considered to yield emission reductions, and this methodology<br />
cannot be applied.<br />
Upon establishment of the most plausible baseline scenario, additionality<br />
of the project shall be demonstrated based on the following three steps: (i)<br />
benchmark investment analysis, (ii) common practice analysis, and (iii) impact<br />
of <strong>CDM</strong> registration.<br />
Step 1 – Benchmark investment analysis: Demonstrate that that the<br />
proposed <strong>CDM</strong> project activity is unlikely to be financially or economically<br />
attractive by applying benchmark analysis, calculation and comparison of<br />
financial indicators), and sensitivity analysis as specified in the latest version<br />
of the additionality tool. With the current version of the additionality tool<br />
(version 03), this is essentially the same procedure as step 2 of the baseline<br />
scenario identification procedure described above.<br />
Step 2 – Common practice analysis: Demonstrate that the project activity<br />
is not common practice in the relevant country and sector<br />
Step 3 – Impact of <strong>CDM</strong> registration: Describe the impact of the<br />
registration of the project activity.<br />
If all the three steps are satisfied, then the project is considered additional.<br />
Baseline Emissions<br />
The baseline emissions are calculated by multiplying the power generated by<br />
the project plant by a baseline emission factor. The baseline emission factor is<br />
estimated as the lowest emission factor among the following three options:<br />
• Option 1: The BM emission factor, calculated according to ACM0002;<br />
• Options 2: The CM emission factor, calculated according to ACM0002<br />
with 50%/50% OM/BM weights; and<br />
249<br />
In calculating the indicator, risks of the alternatives can be included through the cash flow pattern, subject to<br />
project-specific expectations and assumptions (e.g. insurance premiums can be listed in the calculation to reflect<br />
specific risk equivalents).<br />
250<br />
Typically, a range between -10% and +10% is applied.<br />
251<br />
E.g. the baseline scenario is hydro, nuclear or biomass power.<br />
60


