Interoil Exploration AS
Interoil Exploration AS
Interoil Exploration AS

Create successful ePaper yourself
Turn your PDF publications into a flip-book with our unique Google optimized e-Paper software.
<strong>Interoil</strong><br />
<strong>Exploration</strong> <strong>AS</strong><br />
1
Company objectives and strategy<br />
• Main objective to develop InterOil as a production and exploration<br />
company active primarily in South America and West Africa<br />
• Growth phases<br />
- Initial growth to come from purchase of junior oil and gas producers and/or producing assets<br />
- Secondary growth to come from developing organically the acquired assets through drilling new<br />
production wells, well operations and exploration / appraisal drilling<br />
- Further growth to come from purchase of discoveries ready for development and participating in<br />
strategic exploration opportunities<br />
- Long-term goal to participate in both onshore and offshore exploration and production activity and<br />
achieving a balanced portfolio consisting of exploration, appraisal, developing and producing assets<br />
• Organizational development<br />
- Build up local technical and operational competence in order to facilitate local demands and keep<br />
costs to a minimum<br />
- Build up a small and effective multi-discciplinary team of key professionals and outsource all<br />
services to the extent practical<br />
2
Organizational Structure of InterOil <strong>Exploration</strong> and Production Group*<br />
<strong>Interoil</strong> <strong>Exploration</strong> &<br />
Production <strong>AS</strong>A<br />
a Norwegian company<br />
<strong>Interoil</strong> E & P Peru <strong>AS</strong><br />
a Norwegian company<br />
<strong>Interoil</strong> E & P Colombia<br />
<strong>AS</strong><br />
a Norwegian company<br />
<strong>Interoil</strong> E& P Nigeria<br />
<strong>AS</strong><br />
a Norwegian company<br />
<strong>Interoil</strong> <strong>Exploration</strong><br />
SA<br />
a Swiss company<br />
Mercantile Peru Oil & Gas, S.A.,<br />
a Peruvian company<br />
Compañía Petrolera Rio Bravo S.A.,<br />
a Peruvian company<br />
Mercantile Colombia Oil and Gas Inc.,<br />
a British Virgin Islands company
Assets acquired in Peru and Colombia<br />
• Talara, Piura District in the<br />
Sechura Desert<br />
Piedras, Tolima Department,<br />
Middle Magdalena Valley<br />
• Middle Magdalena Valley in<br />
Colombia<br />
Talara, Piura District,<br />
Sechura Desert<br />
4
Peruvian assets – Facts<br />
Block IV<br />
Block III<br />
New Block<br />
• Includes three companies<br />
- Mercantile Peru Oil & Gas (Block III)<br />
- Cia. Petrolera Rio Bravo S.A. (Block IV)<br />
- Manitoba Services S.A. (Small service company)<br />
• Block III – Operator<br />
- Gross production approx. 900 bbl/d<br />
- Total number of wells 157<br />
- Operation start-up December 1995<br />
- Area 88,000 acres (356 km 2 )<br />
• Block IV – Partner (Rio Bravo operator)<br />
- Gross production approx. 850 bbl/d<br />
- Total number of wells 152<br />
- Operation start-up November 1997<br />
- Area 76,000 acres (307 km 2 )<br />
• New exploration block adjacent to existing blocks<br />
applied for and expected awarded soon<br />
RESERVE CATEGORY / BLOCK BLOCK III BLOCK IV PERU TOTAL<br />
P1 - Proven reserves (mill bbls) 4,3 2,8 7,0<br />
P2 - Probable reserves (mill bbls) 0,8 0,8 1,5<br />
P3 - Possible reserves (mill bbls) 0,8 0,7 1,4<br />
TOTAL RESERVES 5,8 4,2 10,0<br />
Reserves as of August 2, 2004. Source: Gaffney Cline & Associates<br />
5
Peruvian assets – Production and upside potential<br />
Oil production ('000 bbl/d)<br />
Operating costs (USD/bbl)<br />
5,0<br />
4,0<br />
3,0<br />
2,0<br />
1,0<br />
0,0<br />
20,0<br />
18,0<br />
16,0<br />
14,0<br />
12,0<br />
10,0<br />
8,0<br />
6,0<br />
4,0<br />
2,0<br />
0,0<br />
Peru - Net oil production and CAPEX<br />
Field CAPEX - right<br />
Oil prod. before royalties - left<br />
2001 2002 2003 2004 2005E<br />
Peru - OPEX structure per bbl<br />
10,0<br />
8,0<br />
6,0<br />
4,0<br />
2,0<br />
CAPEX (USDm)<br />
0,0<br />
Site restoration<br />
DD&A<br />
G&A - Corporate<br />
G&A - Peru<br />
Opex<br />
• Production<br />
- Production today approx 1,750bbl/d .<br />
- Realized oil price approx. USD 6.0 per bbl less than<br />
WTI due to quality difference<br />
• CAPEX<br />
- Minimal investments in 2001-03 due to financial<br />
distress<br />
- All operating cash flow in 2004 used for<br />
investments<br />
- Reduced investments in 2005 due to unclarified<br />
owner situation<br />
- Assume considerable CAPEX increase the next<br />
years<br />
• OPEX<br />
- Cost structure improved from 2001 to 2004<br />
- Assume slightly increase in OPEX going forward<br />
• Upside potential<br />
- Increased recovery potential in the fields<br />
- Appraisal and exploration potential in existing<br />
blocks<br />
2001 2002 2003 2004 2005E<br />
7
Colombian assets – Facts<br />
PULI ”C”<br />
BLOCK<br />
CONTRACTS<br />
• Includes one company and six contract areas<br />
- Toqui-Toqui field approx. 1,050 bbl/d (50% WI)<br />
- Rio Opia contract approx. 200 bbl/d (70% WI)<br />
- Ambrosia contract approx. 200 bbl/d (70% WI)<br />
- Mana contract no production (70% WI)<br />
- Armero contract no production (50% WI)<br />
- Paraiso contract exploration (70% WI)<br />
- Two additional exploration blocks adjacent to existing areas<br />
recently awarded<br />
• Gross production<br />
• Net production<br />
approx. 1450 bbl/d<br />
approx. 900 bbl/d<br />
• Total number of wells 38<br />
RESERVE CATEGORY<br />
COLOMBIA TOTAL<br />
P1 - Proven reserves (mill bbls) 4,9<br />
P2 - Probable reserves (mill bbls) 2,9<br />
P3 - Possible reserves (mill bbls) 2,0<br />
TOTAL RESERVES 9,8<br />
• Operation start-up 1984 (Toqui + Puli)<br />
• License expiry 2012 – 2034<br />
• Area 62,945 acres (258 km 2 )<br />
Reserves as of April 30, 2004. Source: Gaffney Cline & Associates<br />
8
Colombian assets – Production and upside potential<br />
Operating costs (USD/bbl)<br />
Oil production ('000 bbl/d)<br />
5,0<br />
4,0<br />
3,0<br />
2,0<br />
1,0<br />
0,0<br />
20,0<br />
18,0<br />
16,0<br />
14,0<br />
12,0<br />
10,0<br />
8,0<br />
6,0<br />
4,0<br />
2,0<br />
0,0<br />
Colombia - Net oil production and CAPEX<br />
Field CAPEX - right<br />
Oil prod. before royalties - left<br />
6,0<br />
4,0<br />
2,0<br />
0,0<br />
2001 2002 2003 2004 2005E<br />
Colombia - OPEX structure per bbl<br />
10,0<br />
8,0<br />
Site restoration<br />
DD&A<br />
G&A - Corporate<br />
G&A - Colom bia<br />
Opex<br />
2001 2002 2003 2004 2005E<br />
CAPEX (USDm)<br />
• Production<br />
- Production today approx. 900 bbl/d<br />
- Realized oil price approx. USD 11.0 per bbl less<br />
than WTI due to quality difference (USD 6.7) and<br />
transportation costs (USD 4.3)<br />
• CAPEX<br />
- Minimal investments in 2001-03 due to financial<br />
distress<br />
- All operating cash flow in 2004 used for<br />
investments<br />
- Reduced investments in 2005 due to unclarified<br />
owner situation<br />
- Assume considerable CAPEX increase the next<br />
years<br />
• OPEX<br />
- Stable cost structure from 2001 to 2004<br />
- Assume slightly increase in OPEX going forward<br />
• Upside potential<br />
- Increased recovery potential in the fields<br />
- Appraisal and exploration potential in existing<br />
blocks<br />
- Considerable resource potential in the exploration<br />
blocks recently awarded<br />
9
Toqui Toqui - Columbia<br />
10
Financials – Mercantile International Petroleum Inc.<br />
OIL PRODUCTION 2001 2002 2003 2004 2005 - H1<br />
Net oil production before royalties - bbl/d 1 916 1 961 2 102 2 134 2 564<br />
Net oil production before royalties - mmbbl 0,699 0,716 0,767 0,779 0,468<br />
Net oil production after royalties - bbl/d 1 267 1 334 1 436 1 530 1 699<br />
Net oil production after royalties - mmbbl 0,462 0,487 0,524 0,558 0,310<br />
PROFIT & LOSS (USDm) 2001 2002 2003 2004 2005 - H1<br />
Production revenues net of royalties 9,5 9,4 11,7 17,0 12,9<br />
Total production revenues net of royalties 9,5 9,4 11,7 17,0 12,9<br />
Field operating expenses (4,9) (3,9) (4,3) (4,3) (2,5)<br />
Corporate overhead (2,0) (2,0) (2,4) (2,3) (1,5)<br />
EBITDA 2,5 3,5 5,1 10,5 8,8<br />
Depletion, depreciation and amortization (4,9) (4,9) (5,2) (4,6) (3,1)<br />
Site restoration provision (0,1) (0,1) (0,1) (0,1) (0,1)<br />
Other provisions and amortizations (0,5) (0,5)<br />
EBIT (2,9) (2,0) (0,2) 5,8 5,6<br />
Cash interests and other income 1,2 0,2 0,2 0,1 0,0<br />
Debt interests and bank charges (0,2) (0,1) (0,1) (0,3) (0,1)<br />
Loan interests (4,6) (1,7)<br />
Retainer settlement (0,4)<br />
Profit before taxes (6,6) (3,9) (0,1) 5,6 5,5<br />
Payable taxes (0,3) (0,5) (0,6) (0,4) (0,5)<br />
Deferred taxes 0,3 0,0 1,9 (1,1) (0,5)<br />
Net profit (6,6) (4,4) 1,3 4,1 4,5<br />
Tax rate 1 % -12 % 1495 % 27 % 19 %<br />
• Strong improvement in financials from<br />
2001 to H1 2005 due to<br />
- Increased production<br />
- Increased oil prices<br />
- Reduced unit costs<br />
- Debt conversion to equity in 2002<br />
BALANCE SHEET (USDm) 2001 2002 2003 2004 2005 - H1<br />
Tangible fixed assets 48,5 46,9 42,9 51,1 53,4<br />
Other non-current assets & goodwill 0,5 - - - -<br />
Interest bearing long-term receivables - - - - -<br />
Other current assets 2,6 3,1 2,1 3,6 5,7<br />
Cash and liquid assets 1,3 1,6 3,8 4,2 6,0<br />
Total assets 52,8 51,6 48,8 58,9 65,1<br />
Shareholders' equity (14,1) 40,9 42,2 46,3 50,8<br />
Deferred tax 5,1 5,1 3,1 4,2 4,7<br />
Site restoration 0,6 0,7 0,7 0,8 0,9<br />
Interest bearing long-term debt 40,0 - - - -<br />
Other current liabilities 3,3 4,6 2,8 6,5 7,8<br />
Interest bearing current liabilities 18,0 0,3 - 1,1 0,9<br />
Total equity & liabilites 52,8 51,6 48,8 58,9 65,1<br />
Equity ratio -27 % 79 % 86 % 79 % 78 %<br />
C<strong>AS</strong>H FLOW (USDm) 2001 2002 2003 2004 2005 - H1<br />
Profit before taxes (6,6) (3,9) (0,1) 5,6 5,5<br />
Taxes paid (0,3) (0,5) (0,6) (0,4) (0,5)<br />
Depletion, depreciation and amortization 4,9 4,9 5,2 4,6 3,1<br />
Site restoration provision 0,1 0,1 0,1 0,1 0,1<br />
Other non-cash items 4,1 2,3 - - -<br />
Cash earnings 2,1 2,9 4,6 9,8 8,2<br />
Change in current assets and liabilities (1,7) 1,2 (0,9) 2,2 (0,8)<br />
Operating cash flow 0,4 4,0 3,7 12,0 7,4<br />
Investing activities<br />
Field development expenditures (0,9) (2,5) (1,2) (12,8) (5,5)<br />
Net cash from investing activities (0,9) (2,5) (1,2) (12,8) (5,5)<br />
Financing activities<br />
Net change in interest bearing debt (0,2) (1,2) (0,3) 1,1 (0,2)<br />
Net cash from financing activities (0,2) (1,2) (0,3) 1,1 (0,2)<br />
Net change in cash and liquid assets (0,7) 0,3 2,2 0,3 1,8<br />
11
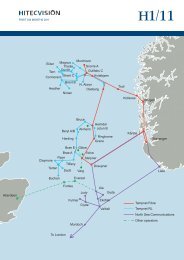
West Africa<br />
<strong>Interoil</strong> <strong>Exploration</strong> <strong>AS</strong> is<br />
reviewing opportunities in:_<br />
• Nigeria<br />
• Congo<br />
• Cote d’ Ivoire<br />
• Angola<br />
• Gabon<br />
12
Management team and key personnel – CV’s<br />
• Gian Angelo Perrucci, born 1943, is an Italian entrepreneur. He previously built up a major shipping company in USA and Europe. During<br />
the last 15 years, he has developed a major logistics operation in West Africa including supply bases, engineering and production yards, and<br />
offshore support vessels.<br />
• Joseph von der Weid, born 1934, has long experience from executive positions for Shell in South America. Has been E&P Manager in Shell<br />
Argentina, General Manager in Shell Peru (1981-86), President and CEO in Shell Columbia (1986-88) and President in Shell Argentina<br />
(1988-91).<br />
• Mårten Rød, born 1948, has long experience as entrepreneur and from the oil and gas industry both upstream and downstream. Was working<br />
11 years for Arco in the North Sea, founded Northern Energy UK in 1998, an oil company with production in Texas and Oklahoma, President<br />
in <strong>Interoil</strong> Norway from 1995, which participated in various oil and mineral projects in West-Africa.<br />
• Nils N. Trulsvik, born 1948, is a petroleum explorationist with extensive experience throughout the world. Was working seven years with<br />
Saga Petroleum with assignments in the North Sea, Mediterranean, Africa, South and North America. Co-founded Nopec in 1981, where he<br />
was working for 13 years with assignments in Northwest Europe, Africa and the Far East. Managing Director from 1987 until 1993. Has been<br />
working with various oil and gas projects the last 10 years.<br />
• Rudolf Berends, born 1948, is Dutch and has a doctoral degree in geophysics and a MBA from Stanford. Has been working for Shell and<br />
Chevron with worldwide exploration for more than 15 years, privatization manager for YPF/Worldbank in Argentina, senior vice president<br />
for Bridas International in UK/Argentina and president of the American branch in Preussag Energie. From 2002 CEO in Mercantile<br />
International.<br />
• René Graf, born 1947, has long international experience covering all aspects of exploration with focus on geophysical field operations,<br />
processing and interpretation, both 2-D and 3-D, land and marine. This experience has been acquired during a period of almost 20 years<br />
working for Shell International in The Netherlands, France, Malaysia and Colombia.<br />
• Beat Meier, born 1953, has long international experience covering all aspects of seismic interpretation including supervising the acquisition<br />
of high resolution seismic data and interpreting analogue and digital high resolution data from numerous Shell operating companies around<br />
the world. Special experience includes acreage evaluation studies, integrated structural and seismic stratigraphic studies using 2-D and 3-D<br />
exploration seismic and well data.<br />
• Peter Kuhn, born 1967, has experience covering all aspects of geophysical and petrophysical data acquisition, processing and interpretation.<br />
Special experience includes analysis and interpretation of borehole geophysical data. He was responsible for well log analysis and<br />
petrophysical evaluation for several energy related studies in Nigeria and Benin.<br />
• The project managers, Stefan Schaub (born 1959), Philippe Roth (born 1963) and Berni Gunzenhauser (born 1953), has extensive<br />
international experience within geology, sedimentology, geochemistry, geophysical data acquisition, seismic processing and interpretation<br />
from a wide variety of countries, geological basins and exploration projects.<br />
13
Realized oil prices<br />
Realized oil price (USD per bbl)<br />
Oil price spread (USD per bbl)<br />
60,0<br />
55,0<br />
50,0<br />
45,0<br />
40,0<br />
35,0<br />
30,0<br />
25,0<br />
13,0<br />
12,0<br />
11,0<br />
10,0<br />
9,0<br />
8,0<br />
7,0<br />
6,0<br />
5,0<br />
4,0<br />
3,0<br />
2,0<br />
1,0<br />
0,0<br />
Peru and Colombia - Realized oil prices<br />
WTI<br />
Peru<br />
Colom bia<br />
2004 - 1<br />
2004 - 2<br />
2004 - 3<br />
2004 - 4<br />
2004 - 5<br />
2004 - 6<br />
2004 - 7<br />
2004 - 8<br />
2004 - 9<br />
2004 - 10<br />
2004 - 11<br />
2004 - 12<br />
2005 - 1<br />
2005 - 2<br />
2005 - 3<br />
2005 - 4<br />
2005 - 5<br />
2005 - 6<br />
2005 - 7<br />
Peru and Colombia - Spread against WTI<br />
2004 - 1<br />
2004 - 2<br />
2004 - 3<br />
Peru spread<br />
Colom bia spread<br />
2004 - 4<br />
2004 - 5<br />
2004 - 6<br />
2004 - 7<br />
2004 - 8<br />
2004 - 9<br />
2004 - 10<br />
2004 - 11<br />
2004 - 12<br />
2005 - 1<br />
2005 - 2<br />
2005 - 3<br />
2005 - 4<br />
2005 - 5<br />
2005 - 6<br />
2005 - 7<br />
• Most oil in South American is sold related<br />
to the South American basket consisting of<br />
- Oman blend (Emirate of Oman) at 34 deg. API<br />
- Forties (UK) at 36 deg. API<br />
- Suez blend (Egypt) at 33 deg. API<br />
• Peru<br />
- Average realized oil prices in 2004 USD 6.25 per bbl less<br />
than WTI<br />
- Average realized oil prices first seven months of 2005<br />
USD 5.23 per bbl less than WTI<br />
- Oil transported by own trucks<br />
• Colombia<br />
- Average realized oil prices in 2004 USD 6.73 per bbl less<br />
than WTI<br />
- Average realized oil prices first seven months of 2005<br />
USD 9.42 per bbl less than WTI<br />
- Oil sale contract with EPC resigned at the end of 2004<br />
due to price squeezing<br />
- New contract entered into with Hocol, with real start-up<br />
in April 2005 after a transition period<br />
- Average realized oil prices excludes transportation costs<br />
of USD 4.32 per bbl<br />
- Oil transported by trucks to pipeline terminal and then by<br />
pipeline<br />
- Transportation costs of USD 1.50 per bbl for trucking<br />
and USD 2.82 per bbl for pipeline transport<br />
14
InterOil investment case<br />
First building<br />
block in place<br />
Large growth<br />
potential<br />
Well positioned<br />
to grow in West<br />
Africa<br />
Experienced<br />
team<br />
• Existing production in Peru<br />
• Existing production in Colombia<br />
• Existing local management in both countries<br />
• Portfolio provides for substantial organic growth<br />
• Considerable exploration potential in Columbia<br />
• <strong>Exploration</strong> potential in Peru<br />
• Strong historical presence in West Africa<br />
• Several projects under evaluation / negotiations<br />
• Awarded (not accepted) new license in Nigeria<br />
• Strong management with extensive experience in South<br />
America and West Africa<br />
• Strong local management to develop existing and new<br />
projects<br />
15