Appendix A.1 - Wollongong City Council
Appendix A.1 - Wollongong City Council
Appendix A.1 - Wollongong City Council

Create successful ePaper yourself
Turn your PDF publications into a flip-book with our unique Google optimized e-Paper software.
<strong>Wollongong</strong> <strong>City</strong> <strong>Council</strong><br />
Coastal Zone Study<br />
Volume 2 - Appendices<br />
FINAL<br />
LJ2822/R2564v2<br />
Prepared for <strong>Wollongong</strong> <strong>City</strong> <strong>Council</strong>*
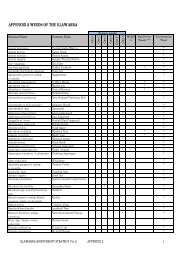
<strong>Appendix</strong> A<br />
WCC Geotechnical Data
PLEASE QUOTE Memo to be Filed <br />
Ref: KB<br />
Ext: 4590<br />
File No: W10284<br />
Tuesday, 17 November 2009<br />
To:<br />
Re:<br />
ENVIRONMENTAL STATEGY AND PLANNING DIVISION<br />
Ms Philomena Gangaiya<br />
WOLLONGONG COASTAL HAZARDS STUDY<br />
GEOTECHNICAL INVESTIGATION<br />
I refer to a request from your office for a geotechnical investigation to be conducted at<br />
twelve beach locations within the <strong>Wollongong</strong> LGA from Stanwell Park Beach in the<br />
north to Windang Beach in the south as per the email brief sent by your consultant<br />
Cardno Lawson Treloar P/L on 15 th October 2009.<br />
A geotechnical investigation was undertaken on the 3 rd to 9th of November, 2009<br />
GEOLOGY<br />
Reference to 1:100,000 scale geological maps supplied by The Department of Mineral<br />
Resources indicate that the beach areas are typically underlain by Quaternary deposits of<br />
medium to coarse grained marine quartz sand with shelly fragments. The foredune areas<br />
are typically underlain by fine to medium grained marine quartz sands. Some interdune<br />
silts and sands may also be found behind the foredune areas.<br />
The bedrock geology of the beaches in the <strong>Wollongong</strong> LGA is complicated by a general<br />
dip in bedrock strata to the north. The geology of the seacliffs and rock platforms at the<br />
beaches consist of interbedded sandstones with some claystone, siltstone and coal layers<br />
evident in the north of the study area (Stanwell Park to Fairy Creek at <strong>Wollongong</strong>). The<br />
rock quality underlying the northern beaches can be variable and in places deep<br />
weathered residual profiles consisting of sandy clays are observed (Sandon point Beach<br />
for example).<br />
The rock quality increases toward the south beyond Fairy Creek at <strong>Wollongong</strong> where<br />
Budgong Sandstone is prevalent. This lithic sandstone is intruded by various igneous<br />
flows of basalt that emerge at the beach (at Port Kembla North Beach for example).<br />
METHOD<br />
Twenty - three (23) test pits were excavated on twelve beaches as nominated in the<br />
consultant brief located as close as possible to the nominated test locations using a 3-<br />
tonne mini excavator equipped with a 1200mm gummy bucket. The maximum reach of
-2-<br />
this equipment was around 3.5 metres. Each test pit was excavated as far as possible and<br />
was limited either by presence of rock or collapse of sand due to groundwater inflow.<br />
The depth of test pitsvaried between1.0m to3.1m depth.<br />
The test pit information was further substantiated by Perth Sand Penetrometer (PSP)<br />
testing conducted at the most seaward test pit location on each beach. The PSP tests<br />
weretaken tovirtual refusal atbetween1.8mto 3.6m depth.<br />
AGPS easting and northing were recorded at each test pit location along with other<br />
pertinentsite information where required.<br />
The locationof thetestpitsand PSP’s areshown on theattached drawings<br />
RESULTS<br />
The test pit and PSP logs are attached.<br />
CONCLUSION<br />
Test pit analysis revealed that the foreshore area of beaches contain essentially single<br />
sized (poorly graded) beach sands to between 1.0m to 2.8m depth. Typically, excavation<br />
was discontinued due to water ingress and collapse of sands making further headway<br />
impossible. The foreshore areas were then further investigated by Perth Sand<br />
Penetrometer (PSP) in order to extend the investigation depth below the groundwater<br />
line.<br />
Test pits 4and 8ware located toward the rear of Wombarra and Sharkies Beaches<br />
respectively. These test pits located well nested boulder armour layers close to the rock<br />
cliffs at between2.5 to 2.8m depthfrom surface. Bedrock was notfound.<br />
Test Pit 11 located on Sandon Point Beach intercepted the underlying natural residual<br />
clay soils at 1.0m beneath the beach boulder armour at 0.6m depth. This sandy clay is a<br />
residual of sandstone and previous drilling at asite 50m south of this location shows that<br />
it can be in excess of 7m deep with some gravelly /rocky bands. This material is also<br />
prone to undercutting and collapse due wave run up during stormevents, aconsideration<br />
which led to the construction of aboulder armour seawall structure for the support of<br />
the cyclewaytothesouth.<br />
Test Pit 15 located on Bellambi Point beach uncovered lithic sandstone bedrock at 1.0m<br />
depth located immediately beneath the beach sands which is consistent with the visual<br />
assessment of other outcropsatthat beach.<br />
All other Test Pits were excavated to maximum reach or practical refusal due to<br />
progressivecollapse ofthe pit walls.<br />
Perth Sand Penetrometer testing was used to extend the information from each seaward<br />
test pit location. Bouncing refusal to PSP is indicative of intercept with either bedrock or<br />
awell nested boulder layer. Virtual refusal occurs where penetration is still possible but
-3-<br />
very slow and damaging to equipment and is indicative of very dense sand, pebbles or<br />
soft rock. Asummaryisincluded in Table2 of this report<br />
One sample from each beach was retrieved for laboratory testing. These were tested<br />
according to AS1289.3.6.1 particle grading analysis allowing various characteristics 1 tobe<br />
determined. These are summarised into the following table.<br />
Location<br />
Test<br />
Pit D10 D30 D50 D60 Cc Cu<br />
stanwell park 1 0.33 0.40 0.47 0.50 1.0 1.5<br />
wombarra 3 0.26 0.34 0.39 0.42 1.1 1.7<br />
coledale 5 0.20 0.31 0.36 0.39 1.3 1.9<br />
sharkies 7 0.19 0.28 0.34 0.36 1.2 1.9<br />
austinmer 9 0.22 0.32 0.36 0.38 1.2 1.8<br />
sandon pt beach 11 0.19 0.30 0.35 0.37 1.3 2.0<br />
bulli 12 0.21 0.32 0.36 0.39 1.2 1.8<br />
woonona 13 0.18 0.28 0.33 0.35 1.2 2.0<br />
bellambi 14 0.18 0.24 0.32 0.34 1.0 1.9<br />
bellambi pt 15 0.17 0.24 0.31 0.34 0.9 2.0<br />
east corrimal 16 0.18 0.27 0.35 0.39 1.1 2.1<br />
towradgi 18 0.28 0.33 0.38 0.40 1.0 1.4<br />
puckeys 19 0.31 0.35 0.40 0.43 0.9 1.4<br />
south beach 20 0.31 0.35 0.41 0.44 0.9 1.4<br />
coniston 21 0.22 0.32 0.36 0.38 1.2 1.8<br />
port kembla 22 0.17 0.20 0.24 0.27 0.9 1.6<br />
windang 23 0.17 0.21 0.27 0.30 0.9 1.8<br />
averages 0.22 0.30 0.35 0.38 1.1 1.8<br />
In general the coarsest grained sands were located in the north at Stanwell Park Beach.<br />
The more finely grained sands were located to the south at Bellambi Point, Port Kembla<br />
Beachand WindangBeaches.<br />
Any further investigation to extend this information particularly with regard to location<br />
of deep bedrock will require the use of adrill rig employing either cased push tube or<br />
auger drilling methods.<br />
For furtherinformation, please contact the undersigned,<br />
Yours Sincerely<br />
Ü·¹·¬¿´´§ ·¹²»¼ ¾§ Õ»ª·² Þ±¹·»<br />
ÜÒæ ½²ãÕ»ª·² Þ±¹·»ô<br />
±ãɱ´´±²¹±²¹ Ý·¬§ ݱ«²½·´ô<br />
Õ»ª·² Þ±¹·»<br />
KevinBogie<br />
Geotechnical Officer<br />
Infrastructure Division<br />
±«ãÙ»±¬»½¸²·½¿´ Ѻº·½»®ô ½ãËÍ<br />
Ü¿¬»æ îððçòïïòïè ïëæíïæëë õïïùððù<br />
Reviewed By<br />
Peter Tobin<br />
SeniorGeotechnical Engineer<br />
Infrastructure Division<br />
1 Cc = Coefficient of Curvature. Cu = Coefficientof Uniformity.
% Passing
% Passing
% Passing
% Passing
% Passing
% Passing
% Passing
% Passing
% Passing
% Passing
% Passing
% Passing
% Passing