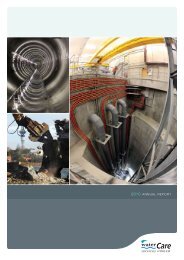
Annual Report 2011 - Watercare
Annual Report 2011 - Watercare
Annual Report 2011 - Watercare

You also want an ePaper? Increase the reach of your titles
YUMPU automatically turns print PDFs into web optimized ePapers that Google loves.
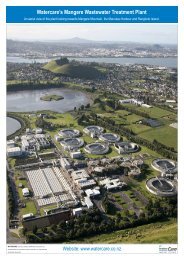
<strong>Watercare</strong> Services Limited<br />
<strong>2011</strong> ANNUAL REPORT<br />
STATEMENT OF FINANCIAL POSITION BY BUSINESS UNIT<br />
AS AT 30 JUNE <strong>2011</strong><br />
group and Company<br />
company<br />
Water Wastewater Total Water Wastewater Total<br />
<strong>2011</strong> <strong>2011</strong> <strong>2011</strong> 2010 2010 2010<br />
$000 $000 $000 $000 $000 $000<br />
ASSETS<br />
Current<br />
Short-term deposits - - - 5,000 5,000 10,000<br />
Other current assets 40,722 46,864 87,586 10,810 13,972 24,782<br />
Total current assets 40,722 46,864 87,586 15,810 18,972 34,782<br />
Non-current<br />
Inventories 635 2,405 3,040 173 3,064 3,237<br />
Derivative financial instruments 5,429 6,856 12,285 1,849 3,435 5,284<br />
Intangibles 14,207 16,022 30,229 6,552 7,822 14,374<br />
Property, plant and equipment 3,188,117 4,500,079 7,688,196 1,366,844 1,046,269 2,413,113<br />
Total non-current assets 3,208,388 4,525,362 7,733,750 1,375,418 1,060,590 2,436,008<br />
Total assets 3,249,110 4,572,226 7,821,336 1,391,228 1,079,562 2,470,790<br />
LIABILITIES<br />
Current<br />
Current liabilities 143,791 190,116 333,907 65,086 93,191 158,277<br />
Total current liabilities 143,791 190,116 333,907 65,086 93,191 158,277<br />
Non-current<br />
Accrued expenses 4,368 4,732 9,100 - - -<br />
Provisions 524 868 1,392 533 520 1,053<br />
Borrowings 436,205 551,399 987,604 133,280 283,220 416,500<br />
Derivative financial instruments 26,126 32,984 59,110 14,104 26,194 40,298<br />
Deferred tax liability 319,452 529,376 848,828 236,508 165,541 402,049<br />
Total non-current liabilities 786,675 1,119,359 1,906,034 384,425 475,475 859,900<br />
Total liabilities 930,466 1,309,475 2,239,941 449,511 568,666 1,018,177<br />
Equity attributable to owners of the parent 2,318,644 3,262,751 5,581,395 941,717 510,896 1,452,613<br />
Total equity and liabilities 3,249,110 4,572,226 7,821,336 1,391,228 1,079,562 2,470,790<br />
STATEMENT OF CASH FLOWS BY BUSINESS UNIT<br />
FOR THE YEAR ENDED 30 JUNE <strong>2011</strong><br />
group and Company<br />
company<br />
Water Wastewater Total Water Wastewater Total<br />
<strong>2011</strong> <strong>2011</strong> <strong>2011</strong> 2010 2010 2010<br />
$000 $000 $000 $000 $000 $000<br />
Net cash flows – operating activities 59,305 116,730 176,035 35,278 39,346 74,624<br />
Net cash flows – investing activities (79,978) (112,253) (192,231) (66,748) (59,497) (126,245)<br />
Net cash flows – financing activities 7,118 8,998 16,116 31,070 19,895 50,965<br />
Net change in cash flows (13,555) 13,475 (80) (400) (256) (656)<br />
The financial statements should be read in conjunction with the accounting policies and notes on pages 74 to 105.<br />
PAGE 73<br />
<strong>2011</strong> Financial <strong>Report</strong><br />
Return to Contents page