Annual Report 2011 - Watercare
Annual Report 2011 - Watercare
Annual Report 2011 - Watercare

You also want an ePaper? Increase the reach of your titles
YUMPU automatically turns print PDFs into web optimized ePapers that Google loves.
<strong>Watercare</strong> Services Limited<br />
<strong>2011</strong> ANNUAL REPORT<br />
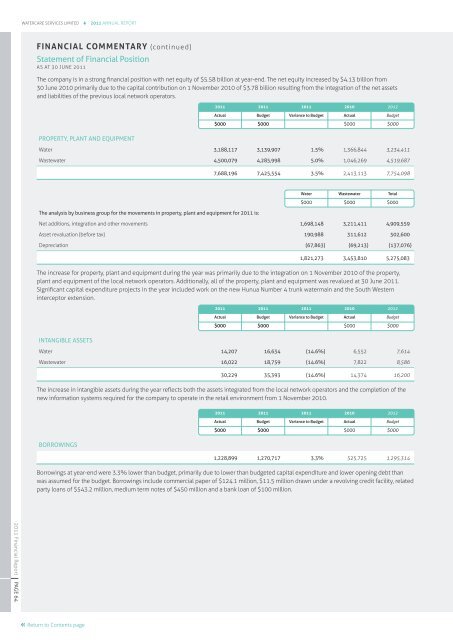
FINANCIAL COMMENTARY (continued)<br />
Statement of Financial Position<br />
AS AT 30 JUNE <strong>2011</strong><br />
The company is in a strong financial position with net equity of $5.58 billion at year-end. The net equity increased by $4.13 billion from<br />
30 June 2010 primarily due to the capital contribution on 1 November 2010 of $3.78 billion resulting from the integration of the net assets<br />
and liabilities of the previous local network operators.<br />
<strong>2011</strong> <strong>2011</strong> <strong>2011</strong> 2010 2012<br />
actual budget Variance to Budget Actual Budget<br />
$000 $000 $000 $000<br />
Property, plant and equipment<br />
Water 3,188,117 3,139,907 1.5% 1,366,844 3,234,411<br />
Wastewater 4,500,079 4,285,998 5.0% 1,046,269 4,519,687<br />
7,688,196 7,425,554 3.5% 2,413,113 7,754,098<br />
Water Wastewater Total<br />
$000 $000 $000<br />
The analysis by business group for the movements in property, plant and equipment for <strong>2011</strong> is:<br />
Net additions, integration and other movements 1,698,148 3,211,411 4,909,559<br />
Asset revaluation (before tax) 190,988 311,612 502,600<br />
Depreciation (67,863) (69,213) (137,076)<br />
1,821,273 3,453,810 5,275,083<br />
The increase for property, plant and equipment during the year was primarily due to the integration on 1 November 2010 of the property,<br />
plant and equipment of the local network operators. Additionally, all of the property, plant and equipment was revalued at 30 June <strong>2011</strong>.<br />
Significant capital expenditure projects in the year included work on the new Hunua Number 4 trunk watermain and the South Western<br />
interceptor extension.<br />
<strong>2011</strong> <strong>2011</strong> <strong>2011</strong> 2010 2012<br />
actual budget Variance to Budget Actual Budget<br />
$000 $000 $000 $000<br />
Intangible assets<br />
Water 14,207 16,634 (14.6%) 6,552 7,614<br />
Wastewater 16,022 18,759 (14.6%) 7,822 8,586<br />
30,229 35,393 (14.6%) 14,374 16,200<br />
The increase in intangible assets during the year reflects both the assets integrated from the local network operators and the completion of the<br />
new information systems required for the company to operate in the retail environment from 1 November 2010.<br />
<strong>2011</strong> <strong>2011</strong> <strong>2011</strong> 2010 2012<br />
actual budget Variance to Budget Actual Budget<br />
$000 $000 $000 $000<br />
Borrowings<br />
1,228,899 1,270,717 3.3% 525,725 1,295,314<br />
Borrowings at year-end were 3.3% lower than budget, primarily due to lower than budgeted capital expenditure and lower opening debt than<br />
was assumed for the budget. Borrowings include commercial paper of $124.1 million, $11.5 million drawn under a revolving credit facility, related<br />
party loans of $543.2 million, medium term notes of $450 million and a bank loan of $100 million.<br />
<strong>2011</strong> Financial <strong>Report</strong><br />
PAGE 64<br />
Return to Contents page