Annual Report 2011 - Watercare
Annual Report 2011 - Watercare
Annual Report 2011 - Watercare

Create successful ePaper yourself
Turn your PDF publications into a flip-book with our unique Google optimized e-Paper software.
<strong>Watercare</strong> Services Limited<br />
<strong>2011</strong> ANNUAL REPORT<br />
FINANCIAL COMMENTARY<br />
The financial result for the year was a net deficit after tax of $12.3 million, compared with a budgeted net deficit of $0.58 million (2010 – Net<br />
deficit after tax of $27.7 million). The deficit was primarily due to the unfavourable revaluation of the company’s interest rate swap contracts to<br />
market value of $13.6 million and the change in deferred tax due to the reduction of the tax depreciation rates to zero on buildings with useful<br />
lives greater than 50 years which were integrated from the previous local network operators.<br />
Key Points<br />
• On 1 November 2010, the company acquired the water and wastewater businesses conducted by Metrowater Limited, Manukau Water Limited,<br />
North Shore City Council, Waitakere City Council, Rodney District Council and Franklin District Council in accordance with the Local Government<br />
(Tamaki Makaurau Reorganisation) Act 2009, the Local Government (Auckland Council) Act 2009 and the Local Government (Auckland<br />
Transitional Provisions) Act 2010. The company now provides total water and wastewater services to the Auckland region and as a result,<br />
the assets, liabilities, revenues and costs of the company have increased significantly in the financial year to 30 June <strong>2011</strong>.<br />
• During the year the company’s Standard & Poor’s corporate credit rating was raised to ‘A’ long-term and ‘A-1’ short-term, with a positive outlook.<br />
The credit rating on the company’s long-term debt was raised to ‘AA’, consistent with the change to Auckland Council’s long-term credit rating.<br />
Subsequent to year end, Standard & Poor’s raised the company’s corporate credit rating to ‘AA-‘ long-term and ‘A-1+’ short term with a stable<br />
outlook (refer to note 27 for further detail).<br />
• A $150 million medium-term note issue was completed in February <strong>2011</strong>. The notes were for a term of four years, and the proceeds were<br />
largely used to refinance maturing intercompany loans from Auckland Council.<br />
• No price adjustment was paid in the <strong>2011</strong> year (2010 – $nil).<br />
• Under NZ IFRS, the company has chosen to revalue its interest rate swaps and forward foreign exchange contracts to fair value. These resulted<br />
in a decrease in current year operating surplus from trading operations by $13.6 million (2010 – decrease in operating surplus from trading<br />
operations by $20.5 million).<br />
• Operating costs were 6.0% lower than budget due to savings in asset operating costs, maintenance and overheads.<br />
• The deferred taxation liability has been adjusted to integrate the previous deferred taxation positions of Metrowater and Manukau Water.<br />
Additionally an adjustment was required to reflect the reduction of the tax depreciation rates to zero on buildings with useful lives greater<br />
than 50 years which were inherited at integration date.<br />
• This financial commentary includes the budget for the <strong>2011</strong> year and notes on significant variances. Comparisons are also provided to<br />
last year being a period where <strong>Watercare</strong> was the wholesale provider of water and wastewater services which is reflected in revenue,<br />
costs, assets and liabilities all being significantly lower. The 2012 budget is also provided as a reference point and reflects higher revenue<br />
and costs as <strong>Watercare</strong> only provided retail water and wastewater services for eight months in this financial year, being the period since<br />
integration on 1 November 2010.<br />
Statement of Comprehensive Income<br />
FOR THE YEAR ENDED 30 JUNE <strong>2011</strong><br />
Total Comprehensive income<br />
<strong>2011</strong> <strong>2011</strong> <strong>2011</strong> 2010 2012<br />
actual budget Variance to Budget Actual Budget<br />
$000 $000 $000 $000<br />
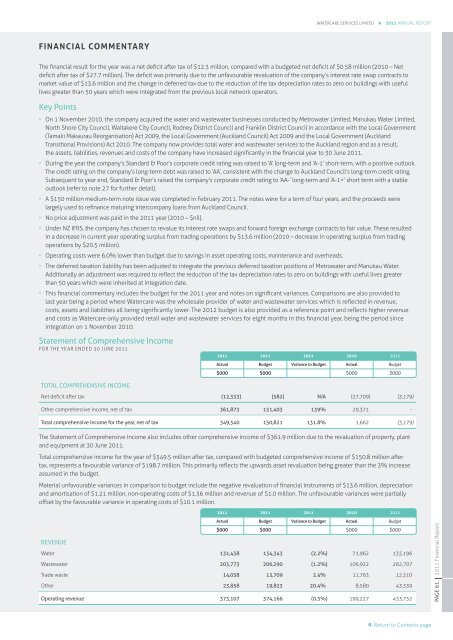
Net deficit after tax (12,333) (582) N/A (27,709) (3,179)<br />
Other comprehensive income, net of tax 361,873 151,403 139% 29,371 -<br />
Total comprehensive income for the year, net of tax 349,540 150,821 131.8% 1,662 (3,179)<br />
The Statement of Comprehensive Income also includes other comprehensive income of $361.9 million due to the revaluation of property, plant<br />
and equipment at 30 June <strong>2011</strong>.<br />
Total comprehensive income for the year of $349.5 million after tax, compared with budgeted comprehensive income of $150.8 million after<br />
tax, represents a favourable variance of $198.7 million. This primarily reflects the upwards asset revaluation being greater than the 3% increase<br />
assumed in the budget.<br />
Material unfavourable variances in comparison to budget include the negative revaluation of financial instruments of $13.6 million, depreciation<br />
and amortisation of $1.21 million, non-operating costs of $1.36 million and revenue of $1.0 million. The unfavourable variances were partially<br />
offset by the favourable variance in operating costs of $10.1 million.<br />
<strong>2011</strong> <strong>2011</strong> <strong>2011</strong> 2010 2012<br />
actual budget Variance to Budget Actual Budget<br />
$000 $000 $000 $000<br />
Revenue<br />
Water 131,438 134,343 (2.2%) 71,962 135,196<br />
Wastewater 203,773 206,290 (1.2%) 106,922 262,707<br />
Trade waste 14,038 13,709 2.4% 11,763 12,510<br />
Other 23,858 19,823 20.4% 8,580 43,339<br />
Operating revenue 373,107 374,166 (0.3%) 199,227 453,752<br />
<strong>2011</strong> Financial <strong>Report</strong><br />
PAGE 61<br />
Return to Contents page