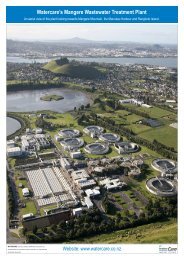
Annual Report 2011 - Watercare
Annual Report 2011 - Watercare
Annual Report 2011 - Watercare

You also want an ePaper? Increase the reach of your titles
YUMPU automatically turns print PDFs into web optimized ePapers that Google loves.
<strong>Annual</strong> <strong>Report</strong> <strong>2011</strong><br />
ANNUAL REPORT <strong>2011</strong><br />
Serving the people<br />
of Auckland
<strong>Watercare</strong> Services Limited<br />
<strong>2011</strong> ANNUAL REPORT<br />
Performance measures<br />
<strong>Watercare</strong> measures its performance against 42 targets in eight focus areas.<br />
Safe and reliable water<br />
Management of water resources to provide a safe and reliable water supply.<br />
Healthy waterways<br />
Management of wastewater discharges to maintain or improve the health<br />
of the environment.<br />
Health, safety and well-being<br />
To be an industry-best workplace.<br />
Customer satisfaction<br />
Providing customers with great service and great value.<br />
Stakeholder relations<br />
To be responsive to stakeholder requirements.<br />
Sustainable environment<br />
To minimise and/or mitigate the adverse impact of the company’s operations<br />
on the environment.<br />
Effective asset management<br />
Managing assets to ensure the use of existing assets is maximised while<br />
optimising the scope, timing and cost of new investments.<br />
Sound financial management<br />
Management of the company to meet business objectives at the lowest cost.<br />
HOW TO READ THE PERFORMANCE RULERS<br />
(Pages 20-57)<br />
<strong>Watercare</strong> uses performance rulers to measure achievements against 42 targets in the eight focus areas shown above.<br />
Achieved<br />
Not achieved<br />
This year’s performance<br />
<strong>2011</strong><br />
Measure<br />
and monitor<br />
demographic<br />
indicators<br />
Accredited<br />
employer with<br />
NZIS<br />
Freedom of<br />
association<br />
promoted<br />
Remuneration<br />
externally<br />
benchmarked<br />
Targeted<br />
employee<br />
development<br />
programmes<br />
identified<br />
Exit interview<br />
results<br />
Salaries assessed<br />
incorporated into<br />
on performance<br />
management<br />
decision-making<br />
Address<br />
demographic<br />
trends<br />
Targeted<br />
employee<br />
development<br />
programmes<br />
in place<br />
Performance and<br />
development<br />
reviews<br />
extended to<br />
all staff<br />
88%<br />
2007 2008 2009 2010<br />
75 85 85 85<br />
% % % %<br />
Previous four years’ results for comparison (if available)<br />
Where possible we show our performance over five years. In some areas, however, we have introduced new performance<br />
measures that reflect <strong>Watercare</strong>’s increased responsibilities and expanded asset base following legislation changes effective<br />
from 1 November 2010.<br />
For ease of reading, <strong>Watercare</strong>’s overall performance against targets in all eight focus areas is summarised on page 3.<br />
PAGE 2<br />
Return to Contents page
<strong>Watercare</strong> Services Limited<br />
<strong>2011</strong> ANNUAL REPORT<br />
Serving the people of Auckland<br />
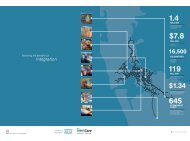
<strong>Watercare</strong> is proud to deliver outstanding and<br />
affordable water services to 1.3 million Aucklanders.<br />
Each day, we collect, treat and supply around 350 million litres of drinking water<br />
from dams, bores, springs and four river sources. Our water infrastructure includes<br />
treatment plants, reservoirs, pump stations and 8,825 kilometres of water pipes.<br />
<strong>Watercare</strong> collects, treats and disposes of wastewater at 20 treatment plants<br />
and operates 7,693km of sewers. The company also works with 1,740 business<br />
customers on the transfer, treatment and disposal of trade waste.<br />
We have been operating water and wastewater infrastructure in the Auckland region<br />
since our establishment in 1991, initially as a wholesaler supplying services to local<br />
network operators that served the public.<br />
From 1 November 2010, following legislative change, <strong>Watercare</strong> became responsible<br />
for retail water and wastewater services as well.<br />
We now have 611 permanent staff – including dedicated customer service teams<br />
at our East Tamaki customer centre – and operate assets valued at $7.8 billion.<br />
This year our total revenue was $373 million.<br />
The company does not operate to make a profit and it is prohibited by statute from<br />
paying a dividend to its shareholder, Auckland Council. Instead, the benefits are<br />
returned directly to Aucklanders as we aim to deliver outstanding and affordable<br />
water services in line with our company vision.<br />
From 1 July <strong>2011</strong>, <strong>Watercare</strong> was able to reduce the price of water to $1.30<br />
(including GST) per 1,000 litres, a region-wide price cut. This is due to the<br />
efficiencies generated by having a single water company.<br />
In Auckland today, seven litres of tap water costs less than 1 cent.<br />
From 1 July 2012, the retail price of wastewater services will also be standardised<br />
across the region and our shareholder has committed to consulting with the public<br />
on charging methods.<br />
CONTENTS<br />
Key to performance measurement IFC<br />
Serving the people of Auckland 1<br />
<strong>Watercare</strong>’s networks 2<br />
Performance summary 3<br />
Sustainability impacts<br />
of company activities 4<br />
Chairman's report 6<br />
Directors’ profiles 9<br />
Chief Executive’s report 10<br />
Executives’ profiles 13<br />
Onehunga gas explosion 14<br />
Governance 15<br />
Environmental Advisory Group 18<br />
Maori Advisory Group 19<br />
Focus 1: Safe and reliable water 20<br />
Focus 2: Healthy waterways 26<br />
Focus 3: Health, safety and well-being 30<br />
Focus 4: Customer satisfaction 36<br />
Focus 5: Stakeholder relations 40<br />
Focus 6: Sustainable environment 44<br />
Focus 7: Effective asset management 50<br />
Focus 8: Sound financial management 54<br />
Verification report 58<br />
Financial report 59<br />
<strong>Report</strong> of the Auditor-General 67<br />
Statement of Service Performance 107<br />
G3 cross-reference table 112<br />
Index 116<br />
Glossary 116<br />
<strong>Watercare</strong> Services Limited<br />
PAGE 1<br />
Return to Contents page
<strong>Watercare</strong> Services Limited<br />
<strong>2011</strong> ANNUAL REPORT<br />
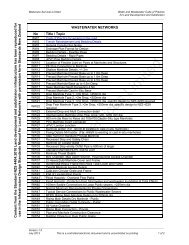
watercare’s networks<br />
Great Barrier Island Inset<br />
Rodney<br />
Hibiscus Coast and Bays<br />
Upper Harbour<br />
Devonport - Takapuna<br />
Kaipatiki<br />
Waiheke<br />
Henderson-Massey<br />
Waitemata<br />
Orakei<br />
Albert-Eden<br />
Whau<br />
Maungakiekie - Tamaki<br />
Puketapapa<br />
Waitakere Ranges<br />
Te Irirangi<br />
Otara- Papatoetoe<br />
Mangere-Otahuhu<br />
Manurewa<br />
Papakura<br />
DAM<br />
Franklin<br />
WASTEWATER TREATMENT PLANT<br />
WATER TREATMENT PLANT<br />
BULK WATER SUPPLY NETWORK<br />
MAIN WASTEWATER COLLECTION NETWORK<br />
7 litres of drinking water<br />
costs less than 1 cent<br />
84 water supply<br />
reservoirs<br />
611<br />
<strong>Watercare</strong> employees<br />
Water and Wastewater <strong>Watercare</strong>’s Networks networks PAGE 2<br />
7,693km<br />
8,825km<br />
425,550<br />
of wastewater sewers<br />
of water pipes<br />
households served<br />
1.3 million Aucklanders 163 billion litres 124 billion litres of<br />
receiving our services<br />
of wastewater treated<br />
water supplied per year<br />
Feedback on this report<br />
Feedback on this report or suggestions for future reports is welcomed either online at www.watercare.co.nz<br />
or by emailing Paul Spackman, Business Planning Advisor, at pspackman@water.co.nz.<br />
Weblinks<br />
Water and wastewater facts Fig. 1<br />
Return to contents Contents page
<strong>Watercare</strong> Services Limited<br />
<strong>2011</strong> ANNUAL REPORT<br />
performance summary<br />
<strong>Watercare</strong> measures and manages its sustainability performance against 42 targets within eight focus areas. The focus areas<br />
are: safe and reliable water; healthy waterways; health, safety and well-being; customer satisfaction; stakeholder relations;<br />
sustainable environment; effective asset management; and sound financial management. The chart below shows <strong>Watercare</strong>’s<br />
performance this year against a target of 100 per cent.<br />
focus 7<br />
focus 8<br />
SCORE<br />
93%<br />
SCORE<br />
99%<br />
Percentage<br />
100<br />
95<br />
90<br />
85<br />
80<br />
75<br />
70<br />
65<br />
60<br />
55<br />
50<br />
45<br />
40<br />
35<br />
30<br />
25<br />
20<br />
15<br />
10<br />
SCORE<br />
96%<br />
98%<br />
SCORE<br />
focus 1<br />
focus 2<br />
key<br />
80%<br />
Company<br />
target<br />
100<br />
90<br />
80<br />
70<br />
60<br />
50<br />
40<br />
30<br />
20<br />
10<br />
SCORE<br />
85%<br />
SCORE<br />
84%<br />
focus 6<br />
focus 6<br />
SCORE<br />
93%<br />
SCORE<br />
92%<br />
focus 3<br />
focus 3<br />
focus 5<br />
focus 5<br />
focus 4<br />
focus 4<br />
Highlights<br />
1 Safe and reliable water 96%<br />
In 2010/11, <strong>Watercare</strong> has:<br />
• Continued to supply quality drinking water to Auckland residents<br />
and businesses<br />
• Integrated 14 rural water treatment plants and associated networks<br />
into the company.<br />
Outlook: Progress the $13 million Pukekohe water supply upgrade work.<br />
2 Healthy waterways 98%<br />
In 2010/11, <strong>Watercare</strong> has:<br />
• Continued to meet high wastewater discharge standards and levels<br />
of service with the metropolitan plants<br />
• Integrated Rosedale and Army Bay as well as 17 rural wastewater<br />
treatment plants and associated networks into the company and has<br />
undertaken to upgrade the rural plants by 2020.<br />
Outlook: Continue planned infrastructure maintenance and renewals<br />
projects to improve the health of regional waterways.<br />
3 Health, safety and well-being 84%<br />
In 2010/11, <strong>Watercare</strong> has:<br />
• Sustained staff and contractor focus on health and safety<br />
• Implemented a number of continuous improvement initiatives.<br />
Outlook: Continue investment in staff development and training.<br />
4 Customer satisfaction 92%<br />
In 2010/11, <strong>Watercare</strong> has:<br />
• Integrated customer service teams<br />
• Improved service levels in all contacts with customers.<br />
Outlook: Ensure continuous improvement in the timeliness of responses<br />
to complaints.<br />
5 Stakeholder relations 93%<br />
In 2010/11, <strong>Watercare</strong> has:<br />
• Developed a new Statement of Corporate Intent in consultation with<br />
Auckland Council<br />
• Continued to work closely with environmental and Maori advisory groups.<br />
Outlook: Work with the shareholder on wastewater tariff communications.<br />
6 Sustainable environment 85%<br />
In 2010/11, <strong>Watercare</strong> has:<br />
• Expanded the focus of reducing the impact of midges and odours to the<br />
communities surrounding the wastewater treatment plants and networks<br />
acquired through integration<br />
• Continued to seek ways to reduce the impact of activities on the<br />
environment.<br />
Outlook: Continue staff sustainability initiatives such as Zero Waste.<br />
7 Effective asset management 93%<br />
In 2010/11, <strong>Watercare</strong> has:<br />
• Completed a Regional Water Demand Management Plan<br />
• Retained focus on efficient use of capital and continuous improvement<br />
in maintenance expenditure.<br />
Outlook: Complete the Asset Management Plan covering the period<br />
1 July 2012 to 30 June 2022.<br />
8 Sound financial management 99%<br />
In 2010/11, <strong>Watercare</strong> has:<br />
• Maintained focus on meeting interest targets and financial ratios<br />
• Continued focus on procurement efficiency and reducing operating<br />
expenditure.<br />
Outlook: Maintain our focus on leveraging efficiencies and gains from the<br />
integrated company.<br />
Performance summary<br />
PAGE 3<br />
Return to Contents contents page
<strong>Watercare</strong> Services Limited<br />
<strong>2011</strong> ANNUAL REPORT<br />
sustainability impacts<br />
of company activities<br />
KEY<br />
Impact on<br />
key areas:<br />
Social<br />
Economic<br />
Environmental<br />
Initiative Sustainability impacts Outcome to date Outlook <strong>2011</strong>/12<br />
Puketutu Island<br />
rehabilitation:<br />
rehabilitate a former quarry<br />
with treated biosolids over<br />
a 35-year period<br />
A long-term, cost-effective solution for<br />
treated biosolids that minimises truck<br />
movements through urban areas and<br />
results in a new regional park<br />
66<br />
Consents and appeals finalised<br />
66<br />
Works ready to commence<br />
66<br />
Application of biosolids to begin<br />
in 2013<br />
66<br />
Initial works to commence<br />
66<br />
Trust being established and parkland<br />
opened for public use<br />
Central interceptor:<br />
construct a central<br />
wastewater and wetweather<br />
interceptor from<br />
central Auckland to the<br />
Mangere Wastewater<br />
Treatment Plant<br />
The project will provide for<br />
population growth, mitigate<br />
risks of pipe failure and reduce<br />
wastewater and stormwater<br />
overflows in central Auckland<br />
66<br />
Concept design completed<br />
66<br />
Consultation and preparation<br />
of consent application continuing<br />
66<br />
Complete resource consent<br />
documentation for submission<br />
by mid-2012<br />
66<br />
Approval required to proceed<br />
Hunua No.4 trunk<br />
watermain project:<br />
installation of<br />
approximately 35km of<br />
watermain from Manukau<br />
to central Auckland<br />
The watermain will provide for<br />
population growth and it will increase<br />
the security of water supply to the<br />
Auckland region<br />
66<br />
Redoubt to Campbell roads (25km)<br />
consented<br />
66<br />
Some local sections completed to<br />
co-ordinate with works by others<br />
66<br />
Obtain consents for remaining<br />
sections<br />
66<br />
Continue consultation with affected<br />
parties<br />
66<br />
Continue collaborating with road and<br />
rail construction programmes<br />
Project Hobson:<br />
replace the 98-year-old<br />
sewer that bisects Hobson<br />
Bay with a 3km-long tunnel<br />
The tunnel provides storage and<br />
further capacity for population growth<br />
and reduces wet-weather overflows<br />
into the bay. The removal of the<br />
sewer has increased recreational<br />
opportunities in the bay<br />
66<br />
All works completed<br />
66<br />
Visible sewer removed<br />
66<br />
Reduced wastewater overflows into<br />
bay and surrounds<br />
66<br />
Increased recreational opportunities<br />
in the bay<br />
Christchurch relief effort:<br />
restoring water and<br />
wastewater services in<br />
Christchurch in the month<br />
following the February<br />
earthquake<br />
<strong>Watercare</strong> engineers, fitters,<br />
instrument technicians and laboratory<br />
staff were deployed to Christchurch<br />
to help restore and test the water<br />
supply, and repair the wastewater<br />
treatment plant<br />
66<br />
Provision of mobile chlorine dosing rig<br />
66<br />
Production, installation and<br />
commissioning of 26 chlorine<br />
dosing rigs<br />
66<br />
Bromley Wastewater Treatment Plant<br />
repair work<br />
66<br />
Laboratory testing<br />
Reliability-Centred<br />
Maintenance (RCM)<br />
programme:<br />
a programme to identify<br />
when to repair or replace<br />
assets<br />
The programme provides a balance<br />
between environmental and service<br />
risk by identifying optimum frequency<br />
for maintenance of assets and<br />
determining when assets can continue<br />
to be used until they need replacing<br />
66<br />
Completed the implementation of RCM<br />
to wholesale parts of the business<br />
66<br />
Update RCM model as required<br />
66<br />
Use RCM model to assist other<br />
maintenance projects<br />
Western dams upgrade:<br />
the provision of<br />
compensation and free<br />
discharge valves<br />
The upgrades will improve the<br />
quality of the water and aquatic life<br />
in the streams below the dams, and<br />
increase <strong>Watercare</strong>’s ability to control<br />
lake levels<br />
66<br />
Work completed on the dams in the<br />
Waitakere Ranges<br />
Pond 2 rehabilitation:<br />
rehabilitate a former<br />
oxidation pond at Mangere<br />
Wastewater Treatment<br />
Plant with treated biosolids<br />
The site will be used as an ecological<br />
reserve. The rehabilitation is a leastcost<br />
solution and its proximity to<br />
the treatment plant minimises truck<br />
movements in urban areas<br />
66<br />
Rehabilitation progressing<br />
66<br />
Submitted landscaping plans for<br />
approval<br />
66<br />
Continue rehabilitation<br />
66<br />
Obtain approval for landscaping<br />
plans from Auckland Council<br />
Master planning:<br />
planning to ensure<br />
facilities and infrastructure<br />
can meet the needs of the<br />
growing region<br />
Master plans provide a comprehensive<br />
review of facilities to ensure future<br />
capacity and regulatory requirements<br />
can be met in a cost-effective manner<br />
66<br />
Huia Water Treatment Plant master plan<br />
complete<br />
66<br />
Mangere Wastewater Treatment Plant<br />
master plan substantially complete<br />
66<br />
Water and wastewater network master<br />
plans are being prepared<br />
66<br />
Prepare plans for the other major<br />
water treatment plants<br />
66<br />
Complete plan for Mangere<br />
Wastewater Treatment Plant<br />
66<br />
Complete plans for the water and<br />
wastewater networks<br />
Sustainability impacts<br />
<strong>Watercare</strong> Harbour<br />
Clean-Up Trust<br />
Online billing<br />
<strong>Watercare</strong> is principal sponsor<br />
of the Trust which works to remove<br />
litter from Waitemata Harbour and<br />
Tamaki Estuary<br />
Development of self service and<br />
online functionality to reduce paper<br />
use while maintaining and enhancing<br />
customer service<br />
66<br />
Trust set up and approved 66<br />
Continue removal of litter<br />
from Waitemata Harbour and<br />
Tamaki Estuary<br />
66<br />
Establishment of new website and<br />
services to streamline customer service<br />
66<br />
Encourage further use by customers<br />
of online service<br />
66<br />
Further develop services to meet<br />
customer needs<br />
PAGE 4<br />
Return to contents Contents page
<strong>Watercare</strong> Services Limited<br />
<strong>2011</strong> ANNUAL REPORT<br />
Upper Huia Dam in the<br />
Waitakere Ranges supplied<br />
8.7 billion litres of water<br />
during the financial year.<br />
Initiative Sustainability impacts Outcome to date Outlook <strong>2011</strong>/12<br />
Energy Focus:<br />
increasing internal power<br />
generation facilities<br />
and minimising energy<br />
consumption<br />
and costs<br />
Biogas and hydro power generation<br />
facilities met 32 per cent of<br />
<strong>Watercare</strong>’s total energy needs in<br />
<strong>2011</strong>. Biogas engines also provide<br />
low-grade waste heat to sustain the<br />
anaerobic digesters which neutralise<br />
the solid waste products and produce<br />
biogas in the process<br />
66<br />
Submitted second annual carbon<br />
abatement report to the Ministry for<br />
the Environment to obtain carbon<br />
credits<br />
66<br />
Optimised biogas engine operating<br />
routines<br />
66<br />
Investigated benefits of increased<br />
use of off-peak energy tariffs<br />
66<br />
Began preparing to participate in<br />
instantaneous reserves market and<br />
upper North Island voltage support<br />
initiatives<br />
66<br />
Assess benefits of biogas storage<br />
in reduced flaring, improved<br />
engine operation and maximised<br />
generation at peak demand<br />
periods<br />
66<br />
Achieve energy and cost-saving<br />
benefits with major energy users<br />
66<br />
Participate in markets to relieve<br />
system stress on the national<br />
grid during Transpower’s planned<br />
reinforcement measures<br />
Water demand<br />
management:<br />
co-ordinate regional<br />
management<br />
Water demand management<br />
promoting efficient and wise use<br />
of water is a key to promoting the<br />
sustainable use of the region’s<br />
water resources<br />
66<br />
Regional Water Demand Management<br />
Plan finalised and delivered to<br />
Auckland Council<br />
66<br />
Adopted target of 15% reduction<br />
in water demand by 2025<br />
66<br />
Continue existing programmes<br />
66<br />
Consider further cost-beneficial<br />
options, e.g. water use in new<br />
buildings<br />
66<br />
Develop and implement plan<br />
with Auckland Council and other<br />
stakeholders<br />
Graduate engineering<br />
programme:<br />
to support gaining of<br />
chartered status and raise<br />
company profile<br />
as employer<br />
The programme enables engineering<br />
graduates to gain widespread<br />
experience and exposure during their<br />
early career years with <strong>Watercare</strong><br />
66<br />
Continued support of graduate<br />
engineering group activities<br />
66<br />
IPENZ mentoring group established<br />
and running within the company<br />
66<br />
Continued professional-development<br />
workshops recognised by IPENZ<br />
66<br />
Continue to encourage graduates<br />
to become chartered engineers<br />
and to participate in IPENZ<br />
Project Improve:<br />
staff generate ideas<br />
through the Continuous<br />
Improvement scheme<br />
The scheme is delivering<br />
improvements to business<br />
practices through the generation<br />
of efficiency, effectiveness, and<br />
health and safety ideas<br />
66<br />
Regular presentations to senior<br />
management on all aspects<br />
of business performance<br />
66<br />
Continue to encourage and<br />
implement ideas from staff<br />
Engaging with<br />
the community<br />
<strong>Watercare</strong> is engaging in open<br />
communication with stakeholders<br />
using a variety of methods<br />
66<br />
Increased the number of schools<br />
participating in Adopt A Stream<br />
66<br />
Significantly increased passenger<br />
numbers on the Rain Forest Express<br />
66<br />
Since integration:<br />
1) Held open board meetings<br />
2) Improved <strong>Watercare</strong> website to<br />
better meet customer needs<br />
3) Established new interfaces for<br />
customer service<br />
66<br />
Continue education programme<br />
66<br />
Continue the Rain Forest<br />
Express service<br />
66<br />
Undertake customer service<br />
survey<br />
66<br />
Together with Auckland Council,<br />
consult with customers regarding<br />
the wastewater tariff<br />
66<br />
Consult regularly with local boards<br />
Midge control:<br />
at the Mangere and<br />
Rosedale wastewater<br />
treatment plants<br />
<strong>Watercare</strong> is minimising the impact<br />
of midges on the local community<br />
by reducing midge populations<br />
and habitats<br />
66<br />
Conducted regular field surveys<br />
of midge species and numbers<br />
66<br />
Proactively controlled midge<br />
breeding grounds<br />
66<br />
Continue midge control<br />
programmes<br />
Odour control:<br />
at the wastewater<br />
treatment plants,<br />
especially metropolitan<br />
plants and the wastewater<br />
networks<br />
<strong>Watercare</strong> is minimising the impact<br />
of odour on local communities<br />
66<br />
Enclosed odorous processes<br />
66<br />
Operated biofilter odour beds<br />
66<br />
Held regular meetings with odour<br />
auditors and local communities<br />
66<br />
Continue to undertake odour<br />
monitoring programmes<br />
66<br />
Continue to respond to odour<br />
complaints<br />
Tree planting:<br />
throughout Auckland<br />
<strong>Watercare</strong> Coastal<br />
Walkway:<br />
13km public walking track<br />
<strong>Watercare</strong> is supporting communityled<br />
tree-planting initiatives<br />
The public track links important<br />
public reserves to the north<br />
(Ambury Farm Park) and south<br />
(Otuataua Stonefields)<br />
66<br />
Continued riparian planting with the<br />
Waikato RiverCare Trust<br />
66<br />
Continued riparian planting on public<br />
and private property in the Waitakere<br />
and Hunua ranges<br />
66<br />
Continued support of Trees for<br />
Survival’s native tree-planting<br />
programmes for local schools<br />
66<br />
Further restoration work undertaken<br />
at Oruarangi Creek mouth<br />
66<br />
Further land purchased to enhance<br />
open space and the coastal area<br />
66<br />
Manage a riparian planting project<br />
for the Waikato RiverCare Trust<br />
66<br />
Continue riparian planting in the<br />
Waitakere and Hunua ranges<br />
66<br />
Continue support of Trees<br />
for Survival<br />
66<br />
Ongoing maintenance of the area<br />
66<br />
Coastal walkways to be integrated<br />
into new Puketutu Island parkland<br />
Sustainability impacts<br />
These tables provide an overview of the sustainability impacts of the company’s major initiatives. Capital projects are<br />
listed in detail in <strong>Watercare</strong>’s Asset Management Plan, available on its website: www.watercare.co.nz.<br />
PAGE 5<br />
Return to Contents contents page
<strong>Watercare</strong> Services Limited<br />
<strong>2011</strong> ANNUAL REPORT<br />
Chairman’s<br />
<strong>Report</strong><br />
“Water is <strong>Watercare</strong>’s business and with the early<br />
knowledge of efficiency gains available through<br />
integration, the company was able to deliver<br />
lower water prices.”<br />
Chairman’s report<br />
PAGE 6<br />
On behalf of all my colleagues, I am pleased<br />
to be able to report a very successful<br />
year of transition for <strong>Watercare</strong> from a<br />
wholesale water provider and wastewater<br />
service deliverer to that of a fully-integrated<br />
wholesale and retail service provider across<br />
the Auckland region.<br />
<strong>Watercare</strong> now supplies over 124 billion litres<br />
of water per year to 425,550 households<br />
and businesses through a network of 84<br />
reservoirs, 90 pump stations and 8,825<br />
kilometres of water pipes. The figures on<br />
wastewater are equally significant – 537<br />
wastewater pumping stations, 7,693<br />
kilometres of sewers and 162,500 manholes.<br />
This is a large business and network.<br />
In any given day, <strong>Watercare</strong> issues 6,000<br />
bills. Capital works in progress total $800<br />
million and the asset base is now valued<br />
at $7.8 billion.<br />
The company and its people have a notable<br />
responsibility in serving Aucklanders and are<br />
committed to working with the shareholder<br />
to do this.<br />
Water is <strong>Watercare</strong>’s business and with the<br />
early knowledge of efficiency gains available<br />
through integration, the company was able<br />
to deliver lower water prices. The announced<br />
retail price of $1.30 per 1,000 litres (including<br />
GST) is approximately 15 per cent lower than<br />
the previous regional average, and in some<br />
cases significantly cheaper. In parts of rural<br />
Rodney, for example, the price paid for water<br />
decreased by more than 60 per cent. The key,<br />
uniting point is that the single region-wide<br />
tariff forms a sustainable base for future<br />
water pricing by <strong>Watercare</strong>.<br />
Our next significant forward pricing challenge<br />
is wastewater. Currently, the charging<br />
methodologies vary significantly from one<br />
former council area to another and in some<br />
parts of the region the revenue is collected<br />
on <strong>Watercare</strong>’s behalf by the Auckland<br />
Council. <strong>Watercare</strong> is responsible for setting<br />
the wastewater charges that will apply from<br />
1 July 2012 and has undertaken work with<br />
councillors representing a population base<br />
of 1.3 million people to establish an<br />
equitable basis for future charging.<br />
Following the challenges of integration it was<br />
necessary to consolidate the new company –<br />
two-and-a-half times its previous size – into<br />
a customer-focused organisation operating<br />
in the all-new world of retail supply and<br />
I endorse the work management has done<br />
in this regard. The Auditor-General issued<br />
a report in August <strong>2011</strong>, Planning to Meet<br />
the Forecast Demand for Drinking Water<br />
in Auckland, which was very positive.<br />
The Auditor-General concluded:<br />
“Overall, we are pleased with the progress that<br />
<strong>Watercare</strong> has made in managing its extended<br />
responsibilities. The transition appears to be<br />
going relatively smoothly for customers, and<br />
<strong>Watercare</strong> seems committed to improving<br />
its service to customers. <strong>Watercare</strong> is making<br />
solid progress in its long-term planning for<br />
managing future demand, asset management,<br />
and funding and pricing. It should complete all<br />
of these plans by 2012.”<br />
Among the major strategic initiatives that<br />
will occur in the coming year are:<br />
• A commitment to achieving an ongoing<br />
water supply improvement programme<br />
for the non-metropolitan areas, where the<br />
assets inherited through integration were<br />
not all of the required standard;<br />
• An upgrade of the capacity of the Waikato<br />
Water Treatment Plant, where piling and<br />
clarifier construction will be undertaken this<br />
summer, with a membrane plant extension<br />
completed in the following year;<br />
• The plan to rehabilitate Puketutu Island,<br />
adjacent to the Mangere Wastewater<br />
Treatment Plant, with treated biosolids.<br />
This project will see the island become<br />
a public open space for the enjoyment<br />
and benefit of all Aucklanders;<br />
• Upgrades of rural wastewater plants that<br />
were inherited through integration; and<br />
• Continued progress on the Hunua<br />
No. 4 watermain project , the construction<br />
and installation of approximately 35<br />
kilometres of watermain from Manukau<br />
to central Auckland which ensures secure<br />
supply to an expanding Auckland population.<br />
It is important that I record my thanks to the<br />
<strong>Watercare</strong> staff, our shareholder, suppliers and<br />
business partners for facilitating stable platforms<br />
for transition, and I reinforce our ongoing<br />
commitment to providing outstanding and<br />
affordable services for the people of Auckland.<br />
I also want to acknowledge the stewardship<br />
and dedication to meet required objectives of<br />
my predecessor Graeme Hawkins who chaired<br />
<strong>Watercare</strong> between December 2002 and his<br />
retirement in December 2010, and also former<br />
Deputy Chairman Ian Parton who stepped into<br />
the role of Interim Chief Executive through the<br />
period of transition.<br />
Finally, my Board were delighted to complete<br />
the appointment of Mark Ford as Chief<br />
Executive of the expanded <strong>Watercare</strong> effective<br />
from January <strong>2011</strong>. Mark’s clarity of vision,<br />
strong leadership and considerable experience<br />
in the sector have enabled <strong>Watercare</strong>’s<br />
momentum and delivery of service objectives<br />
to be demonstrated from an early day.<br />
Ross B Keenan<br />
Chairman<br />
Return to Contents page
<strong>Watercare</strong> Services Limited<br />
<strong>2011</strong> ANNUAL REPORT<br />
Cosseys Dam is one of<br />
five dams in the Hunua<br />
Ranges. Originally built<br />
in 1955, its embankment<br />
was rebuilt between 2001<br />
and 2004 as part of a<br />
major upgrade project.<br />
PAGE 7<br />
Return to contents Contents page
<strong>Watercare</strong> Services Limited<br />
<strong>2011</strong> ANNUAL REPORT<br />
Projects and Programmes<br />
Manager Tim Munro<br />
and Projects Manager<br />
David Shepherd assess<br />
progress on a new<br />
wastewater storage tank<br />
being built in Henderson.<br />
The tank, which will have<br />
a 13-million-litre capacity,<br />
will provide for growth<br />
and reduce the frequency<br />
and volume of wastewater<br />
overflows into the<br />
Waitemata Harbour.<br />
Chairman’s report<br />
PAGE 8<br />
Weblinks<br />
Stories<br />
Story title and reference<br />
Title and reference here<br />
Figures<br />
Figure title and reference<br />
Return to Contents contents page
<strong>Watercare</strong> Services Limited<br />
<strong>2011</strong> ANNUAL REPORT<br />
directors’<br />
profiles<br />
1 2<br />
3<br />
4<br />
5<br />
6<br />
7<br />
8<br />
1 Ross Keenan, 67<br />
BCom, FCIT<br />
Chairman<br />
Ross Keenan joined the <strong>Watercare</strong> board in March<br />
2010 and was appointed Chairman in December<br />
2010. He is an experienced company director, with<br />
corporate governance and executive experience<br />
across a diverse range of companies including<br />
airways, tourism, telecommunications, health and<br />
property development. He has particular knowledge<br />
and experience in the retail and wholesale water<br />
and wastewater services industry and previously<br />
served as the Chairman of Metrowater.<br />
General disclosure of interests:<br />
Chairman: Allied Work Force Group Ltd; Ngai Tahu<br />
Tourism Ltd. Director: Ngai Tahu Seafood Ltd; Ngai<br />
Tahu Holdings Corporation; Touchdown Ltd.<br />
2 David Clarke, 52<br />
BE (Hons), ME, BBS, MBA, MInstD, FNZIM<br />
Deputy Chairman<br />
David Clarke has considerable experience in the<br />
areas of biotechnology, IT, health, food and related<br />
sectors. He has been the inaugural chair for multiple<br />
technology industries and has strong commercial<br />
and governance skills. His background includes<br />
engineering, finance, marketing and sales. He is a<br />
fellow of the New Zealand Institute of Management<br />
and member of the Institute of Directors.<br />
General disclosure of interests:<br />
Chairman: Hawkins Watts Ltd; Optima Corporation<br />
Ltd; TRGG Ltd; NZ Institute of Rural Health; Kordia Ltd;<br />
Skin Institute. Director: Cranleigh Merchant Bankers;<br />
Farm IQ Systems Ltd; Ngai Tahu Tourism Ltd; Hynds<br />
Group Ltd; KODE Biotec Ltd. Trustee: South Auckland<br />
Foundation (Middlemore/CMDHB).<br />
3 Peter S Drummond, 58<br />
MNZM, AFInstD<br />
Peter S Drummond is an experienced director and<br />
chairman, with extensive international business<br />
management and marketing experience. He was<br />
previously Chairman of <strong>Watercare</strong> and brings<br />
extensive knowledge of the wholesale and retail<br />
water services industry. He has also served on the<br />
boards of Vector, MidCentral Health and HortResearch<br />
Ltd as well as a large range of community<br />
organisations such as Variety, the children’s charity.<br />
Peter rejoined the <strong>Watercare</strong> board in March 2010.<br />
General disclosure of interests:<br />
Chairman: United Fire Brigade Association; Appliance<br />
Connection Ltd; <strong>Watercare</strong> Harbour Clean-Up Trust;<br />
Variety Medical Missions South Pacific. Deputy<br />
Chairman, Tourism Events and Economic Development<br />
Ltd (TEED). Director: NARTA New Zealand Ltd; NARTA<br />
International PTY Ltd. International President: Variety<br />
Children’s Charity.<br />
4 Catherine Harland, 49<br />
BA, PGDipBus (Marketing), MBA, JP<br />
Catherine Harland has a background in research,<br />
consultancy and public policy in local and central<br />
government. She was a local government member in<br />
Auckland for 15 years, serving on and chairing major<br />
regional and city committees. Currently, Catherine<br />
is project leader at the New Zealand Institute, an<br />
independent thinktank. Previously, she worked with<br />
AUT University’s Institute of Public Policy and was<br />
engaged in consultancy work with the Auckland<br />
water industry. Catherine is a Justice of the Peace<br />
and served on the Auckland Observatory and<br />
Planetarium Trust Board for 11 years, five of those<br />
as chair.<br />
General disclosure of interests:<br />
Director: McHar Investments Ltd; Interface Partners Ltd.<br />
Trustee: Auckland Restorative Justice Trust; One Tree<br />
Hill Jubilee Educational Trust.<br />
5 Susan Huria, 51<br />
FPRINZ, MInstD<br />
Susan Huria is a specialist in the Maori sector,<br />
working with Maori organisations on constitutional<br />
reviews, board appointments, support and strategic<br />
advice. She has extensive governance, marketing<br />
communications and general management<br />
experience. Susan was an executive at Auckland<br />
International Airport and worked in marketing and<br />
communications for 10 years, before starting her<br />
own management practice, Huria Anders, in 2000.<br />
General disclosure of interests:<br />
Deputy Chair: AgResearch Ltd. Director: Northland<br />
Port Company Ltd, Veterinary Enterprises Group Ltd.<br />
Director and shareholder: Huria Anders Ltd; Susan<br />
Huria (2003) Associates Ltd; Te Ara Tika Properties Ltd.<br />
Director: Vermilion Design Ltd; Airways Corporation of<br />
New Zealand Ltd. Trustee: First Foundation.<br />
6 Tony Lanigan, 63<br />
BE (Hons), PhD, FIPENZ, MICE<br />
Tony Lanigan is a professional civil engineer<br />
(FIPENZ), project-management consultant and<br />
former General Manager of Fletcher Construction.<br />
Tony was Chancellor of Auckland University<br />
of Technology and a director of Infrastructure<br />
Auckland. He is currently Vice Chairman of Habitat<br />
for Humanity in New Zealand and Chair of the<br />
NZ Housing Foundation. He is a director of the<br />
NZ Transport Agency (NZTA).<br />
General disclosure of interests:<br />
Chairman: NZ Housing Foundation. Vice Chairman:<br />
Habitat for Humanity New Zealand. Director: Hargrave<br />
Project Management Ltd; A G Lanigan & Associates<br />
Ltd; NZ Transport Agency (NZTA).<br />
7 Patrick Snedden, 56<br />
BCom, BA<br />
Patrick Snedden has considerable experience<br />
in corporate governance and has previously<br />
chaired both the Auckland District Health Board<br />
and Housing New Zealand Corporation. He also<br />
has extensive commercial experience with Maori<br />
organisations and has a sound understanding<br />
of the role public sector organisations play in<br />
the community.<br />
General disclosure of interests:<br />
Chairman: Tamaki Plan Development Board,<br />
Manaiakalani Education Trust. Director: Snedden<br />
Publishing and Management Consultants Ltd.<br />
8 Jeff Todd, 69<br />
CBE, BCom, FCA, FInstD<br />
Chairman of the Audit and Risk Committee<br />
Jeff Todd is a chartered accountant and company<br />
director and was formerly managing partner for<br />
New Zealand and the Pacific for Price Waterhouse<br />
(now PwC). He is a former chairman of the Southern<br />
Cross Medical Care Society, Southern Cross<br />
Healthcare Trust and The New Zealand Guardian<br />
Trust Company Ltd, and director of the Reserve Bank<br />
of New Zealand and the ANZ Banking Group (NZ) Ltd.<br />
He has a particular interest in corporate governance<br />
and is a fellow of the Institute of Directors.<br />
General disclosure of interests:<br />
Chairman: Dynasty Hotel Group Ltd; Sanford Ltd;<br />
Medical Research Foundation. Director and Deputy<br />
Chairman: National Research Centre for Growth<br />
and Development. Trustee: Goodfellow Foundation;<br />
Post-Graduate Medical Society (School of Medicine,<br />
University of Auckland); Christian Healthcare Trust.<br />
For directors’ meeting attendance,<br />
see Governance on page 17.<br />
Directors’ profiles<br />
PAGE 9<br />
Return to Contents page
<strong>Watercare</strong> Services Limited<br />
<strong>2011</strong> ANNUAL REPORT<br />
Chief executive’s<br />
<strong>Report</strong><br />
“Our challenge involved radical rethinking<br />
to ensure that the customer sits at the heart<br />
of everything we do.”<br />
Significant change occurred in our company<br />
parts of our business to ensure we were<br />
since it took over responsibility for service<br />
from 1 November 2010. That was the date on<br />
equipped to meet our new responsibilities.<br />
delivery from the former network operators.<br />
which we assumed responsibility for directly<br />
serving around 1.3 million Aucklanders.<br />
Before that, <strong>Watercare</strong> was purely a wholesaler<br />
in the water and wastewater utility business.<br />
Our half-dozen customers were local councils<br />
or water retail companies that each operated<br />
As a result, no part of the <strong>Watercare</strong> business<br />
is unchanged. From the way we answer<br />
phones to the thinking we employ when<br />
designing a process improvement or<br />
responding to a complaint, our approach<br />
now puts the customer at the heart of<br />
Wastewater prices increased by 4.5 per<br />
cent from the same date. While no customer<br />
welcomes a bigger bill, the wastewater<br />
increase was significantly lower than the price<br />
rises ranging from 6.9 to 36.9 per cent that<br />
had been forecast by the previous councils.<br />
local networks and onsold our services to<br />
our operations.<br />
For the <strong>2011</strong>/12 financial year we are<br />
Chief Executive’s report<br />
PAGE 10<br />
households and businesses in different parts<br />
of the Auckland region. But legislative change<br />
has resulted in our transformation into an<br />
integrated water utility and we now have full<br />
responsibility for all water supply from sourceto-tap,<br />
and for all wastewater services.<br />
By any measure this makes <strong>Watercare</strong> big<br />
business. Our workforce has increased to<br />
611 permanent staff and our annual revenue<br />
is now $373 million. Our asset base has<br />
increased and is valued at $7.8 billion –<br />
greater than that of many of New Zealand’s<br />
most significant listed companies. Despite the<br />
huge growth in year-on-year revenue and the<br />
significant capital programme we discharged,<br />
I am pleased to report that our total operating<br />
expenses of $156.5 million (excluding<br />
depreciation) were under budget by more<br />
than $10 million at year-end.<br />
The greatest change we have experienced has<br />
been about much more than the throughput<br />
of cash or the addition of some new assets.<br />
It has involved radical rethinking to ensure<br />
that the customer sits at the heart of<br />
everything we do.<br />
Along the way, we have had to challenge<br />
ourselves – and this has sometimes been<br />
difficult. We have made structural and<br />
organisational changes; some staff have left<br />
and others have joined; we have rethought,<br />
refreshed and, where necessary, relocated<br />
We have brought forward significant IT<br />
projects to ensure our retail billing and<br />
customer-management systems are effective<br />
and customer-friendly. We have engaged<br />
with social agencies to ensure that our<br />
approach to handling customers experiencing<br />
hardship is fair. We have taken over a network<br />
of maintenance contractors – the crews<br />
that respond to faults in local water and<br />
wastewater pipes, all of whom have had to<br />
be inducted into the <strong>Watercare</strong> way of working.<br />
Most of all, we are reminded every day of our<br />
direct responsibility to the people of Auckland<br />
who pay for our services.<br />
Outstanding and affordable services<br />
For many years, Aucklanders have paid<br />
directly for the water they use through<br />
meters in homes and businesses. It is a<br />
matter of great pride at <strong>Watercare</strong> that we<br />
have been able to reduce the retail price of<br />
water across Auckland through cutting the<br />
unit rate, and also scrapping the fixed service<br />
charges for water that were previously<br />
payable in some areas.<br />
As the Chairman has noted on page 6,<br />
<strong>Watercare</strong> cut the prices of water for all<br />
Aucklanders effective 1 July <strong>2011</strong>, with<br />
the new tariff set at $1.30 (including GST)<br />
for 1,000 litres. The lower price is thanks<br />
to efficiencies generated by <strong>Watercare</strong><br />
continuing to charge for wastewater services<br />
according to the various methodologies<br />
applied by the old councils – that is to say,<br />
either fixed fees per property or variable<br />
sums linked to the consumption of metered<br />
water. However, from 1 July 2012, <strong>Watercare</strong><br />
is required to introduce a new, single<br />
wastewater tariff and Auckland Council has<br />
proposed to us that it consults with the<br />
public on tariff methodologies that meet<br />
our funding requirements. While <strong>Watercare</strong><br />
is solely responsible for setting the charges<br />
for both water and wastewater, we agree<br />
with our shareholder’s logic on this point.<br />
<strong>Watercare</strong>’s decisions on wastewater pricing<br />
will coincide with a number of council<br />
decisions which also impact on individual<br />
households and businesses, including<br />
the rationalisation of the rates system in<br />
Auckland and a number of other council<br />
funding decisions. One meaningful round<br />
of public consultation – rather than several<br />
– seems to us to be sensible.<br />
Of course price is just one part of our<br />
commitment to customers. Our vision is to<br />
supply outstanding and affordable services to<br />
all Aucklanders, and it is clear that some of the<br />
assets we inherited on 1 November 2010 fell<br />
well short of being outstanding, especially in<br />
non-metropolitan parts of our region. We have<br />
a range of long- and short-term initiatives<br />
Return to Contents page
<strong>Watercare</strong> Services Limited<br />
<strong>2011</strong> ANNUAL REPORT<br />
<strong>Watercare</strong> Chairman<br />
Ross Keenan, Auckland<br />
Mayor Len Brown and<br />
Mark Ford attend an<br />
event to commemorate<br />
the Waitakere Dam’s<br />
100th year of operation<br />
in December 2010.<br />
Water prices reduced by <strong>Watercare</strong>, effective 1 July <strong>2011</strong><br />
Old price<br />
per 1,000 litres<br />
(pre-July <strong>2011</strong>)<br />
<strong>Watercare</strong> price<br />
per 1,000 litres<br />
(post-July <strong>2011</strong>)<br />
Percentage change<br />
reduce the frequency of overflows. If all goes<br />
according to plan, we will apply for resource<br />
consents in mid-2012, with construction<br />
planned for 2016-20.<br />
Rodney District<br />
(rural)<br />
Rodney District<br />
(urban)<br />
$3.50<br />
table<br />
-62.9%<br />
$1.96 -33.7%<br />
North Shore City $1.52 -14.5%<br />
Over the next 10 years, we have an ambitious<br />
capital investment programme totalling more<br />
than $4.7 billion, including $2 billion on<br />
water and wastewater network expansion<br />
and a further $1.4 billion on updating our<br />
existing networks.<br />
Waitakere City $1.74 $1.30<br />
-25.2%<br />
Auckland City<br />
(ex-Metrowater)<br />
Manukau City<br />
(ex-Manukau Water)<br />
to address the shortfalls and, in our current<br />
Asset Management Plan, we have allocated<br />
$150 million over 10 years towards the<br />
improvement of non-metropolitan water<br />
and wastewater plants.<br />
Some of the work is already under way.<br />
At Pukekohe township, in the former Franklin<br />
district south of Auckland, we announced a<br />
$13.1-million project to construct a large,<br />
6.5-kilometre-long watermain that will supply<br />
the community with the same quality of water<br />
supplied to metropolitan Auckland.<br />
The problems we discovered at Pukekohe are<br />
typical of some smaller communities where<br />
significant capital investment has not occurred<br />
due to the relatively small customer base that<br />
was expected to fund the work. At Pukekohe,<br />
there was insufficient water to satisfy peak<br />
demand and there were long-standing<br />
complaints about the water colour and quality.<br />
I’m pleased to report that design work on this<br />
$1.62 -19.7%<br />
$1.31 -0.6%<br />
Franklin District $2.00 -35.0%<br />
project is now in progress, and we expect the<br />
new watermain to be operational by mid-2013.<br />
Progress on projects<br />
Other significant capital works are under way<br />
in the north-west of our region, in the former<br />
Rodney District, where a number of rural<br />
water and wastewater schemes are under<br />
development, and at Kawakawa Bay, on the<br />
east coast to the south of the region, where a<br />
new wastewater treatment plant, planned and<br />
developed under the former Manukau Water<br />
Limited, will become operational this year.<br />
Our largest single capital project, the Central<br />
Interceptor, is still in its earliest planning<br />
stages. This is a 13-kilometre-long tunnel<br />
proposed to collect and carry wastewater<br />
along a route from the Western Springs<br />
area of Central Auckland to Mangere. When<br />
completed, in addition to meeting planned<br />
growth and development, this project will see<br />
the replacement of ageing infrastructure and<br />
In our next Asset Management Plan we have<br />
committed $330 million to Hunua No. 4, a<br />
major new pipeline running the 26 kilometres<br />
from Redoubt Reservoir to Campbell Road.<br />
This is a critical asset with a 100-year lifespan<br />
that will mitigate security of supply risks and<br />
allow for Auckland’s continued population<br />
growth. Other significant projects include:<br />
the Waikato Water Treatment Plant upgrade,<br />
valued at around $90 million; water and<br />
wastewater improvements in the NORSGA<br />
(Northern Strategic Growth Area) around<br />
Hobsonville and in the Kumeu, Huapai<br />
and Riverhead areas; southern area water<br />
improvements; upgrades at Mangere and<br />
Rosedale wastewater treatment plants;<br />
and continued water treatment plant work<br />
at Ardmore and Huia.<br />
I am also pleased to report that the<br />
development of Puketutu Island as a public<br />
open space has come a step closer with the<br />
granting of designation and resource<br />
consents by the Environment Court.<br />
This occurred on 18 July <strong>2011</strong>, shortly after<br />
the end of the financial year, and clears the<br />
way for the rehabilitation of the island’s<br />
quarry with clean fill and treated biosolids<br />
from the adjacent Mangere Wastewater<br />
Treatment Plant, and for the creation of<br />
a new regional park.<br />
Chief Executive’s report<br />
PAGE 11<br />
Return to Contents page
<strong>Watercare</strong> Services Limited<br />
<strong>2011</strong> ANNUAL REPORT<br />
Earlier negotiations between <strong>Watercare</strong>,<br />
the Kelliher Charitable Trust, which owns the<br />
island, and local iwi resulted in an agreement<br />
to develop Puketutu Island as a public open<br />
space. The island’s freehold title will transfer<br />
to new trustees and <strong>Watercare</strong> will lease the<br />
island. Through this process it is proposed<br />
that Auckland Council takes up a renewable<br />
lease to guarantee that Puketutu Island<br />
remains available to the people of Auckland<br />
in perpetuity, with areas opened for public<br />
access progressively.<br />
Meter Reader Vernon Cassidy<br />
of DataCol reads between<br />
300 and 400 water meters<br />
each day.<br />
In addition to creating a magnificent new<br />
public space for the people of Auckland, this<br />
project allows us to rehabilitate the quarry<br />
with biosolids. This is a cost-effective strategy<br />
for the management of Auckland’s biosolids<br />
Chief Executive’s report<br />
PAGE 12<br />
over a 30-year period and dramatically<br />
reduces truck movements through the wider<br />
Mangere area.<br />
Continued community support<br />
On 1 November 2010, a new model of local<br />
government was established in Auckland.<br />
Aucklanders gained a new mayor, new<br />
council and 21 local boards to enable local<br />
representation and decision-making on behalf<br />
of local communities. Auckland Council is our<br />
shareholder and we work co-operatively with<br />
the council, its elected members and staff, in<br />
all areas of our business.<br />
I am especially pleased with the quality<br />
of our relationships with Auckland’s local<br />
boards. The boards reflect the diversity and<br />
wide-ranging interests of the region. Practical<br />
issues such as pipe bursts, overflows and<br />
water quality complaints raised through our<br />
customer contact centre have been escalated<br />
by local board members in a number of cases<br />
and we now have an ongoing programme of<br />
local board engagement. I am committed to<br />
ensuring that, where possible, local boards<br />
are the first to know of network improvements<br />
and other work with the potential to impact<br />
local communities.<br />
We are also keen to engage with them in our<br />
milestone events and we were pleased that<br />
Waitakere Ranges local board chair Denise<br />
Yates and local board member Judy Lawley<br />
were able to join Mayor Len Brown and<br />
several <strong>Watercare</strong> staff and board members<br />
at an event in December 2010 to celebrate<br />
the 100th anniversary of the Waitakere Dam.<br />
Performance improvement<br />
During the 17-plus years I have been<br />
associated with <strong>Watercare</strong>, I have been<br />
especially proud of the culture of health and<br />
safety that has been developed. Industryleading<br />
practices have become part of the<br />
company’s standard operating procedures –<br />
quite simply ‘the way we do things’ – and, by<br />
late May <strong>2011</strong>, we had recorded an 18-month<br />
period without a single lost-time injury. It<br />
was therefore especially shocking on 4 June<br />
<strong>2011</strong> when a serious accident occurred at<br />
an Auckland construction site, causing the<br />
death of one <strong>Watercare</strong> employee and injuring<br />
several other staff members and contractors.<br />
The Onehunga incident is described in more<br />
detail on page 14 and, at the time of writing,<br />
we are assisting the Department of Labour<br />
with their inquiries as well as conducting our<br />
own internal review. Without pre-empting<br />
these processes, I can say that we are<br />
committed to learning all the lessons we can<br />
from the Onehunga incident. We must clearly<br />
understand the cause or causes of the tragic<br />
accident and ensure this never happens again.<br />
The safety of our people, and that of the<br />
general public, is paramount.<br />
The spirit of continual improvement which<br />
underpins our commitment to health and<br />
safety is evident across other areas of<br />
our business. We have maintained and<br />
expanded our long-running Project Improve<br />
programme, where emerging leaders in the<br />
organisation demonstrate initiatives they<br />
have devised to save time, reduce cost or<br />
improve service levels. Among the initiatives<br />
brought forward under this project this year<br />
have been an upgrade of our control systems<br />
and knowledge management – effectively<br />
enabling the entire water and wastewater<br />
networks to be operated remotely, and<br />
reducing reliance on our 24/7 Newmarket<br />
control room – and a programme to swiftly<br />
address performance shortfalls in some of our<br />
newly inherited non-metropolitan plants.<br />
During the year, we also undertook two<br />
major systems upgrades. Hansen was<br />
selected as our retail billing system and<br />
SAP our enterprise asset-management<br />
solution. SAP now supports finance and<br />
management accounting, capital expenditure,<br />
operating expenditure, project management,<br />
purchasing and stores, wholesale asset<br />
maintenance and operations. As a result,<br />
we have more tightly integrated internal<br />
processes and are better able to capture data<br />
and track and report performance.<br />
My own association with <strong>Watercare</strong> dates<br />
back to 1994 when I became the Chief<br />
Executive. I remained here until June 2009<br />
when I resigned to accept the Government’s<br />
invitation to become Executive Chairman of<br />
the Auckland Transition Agency, the body<br />
responsible for planning and managing<br />
local government reorganisation. Upon the<br />
completion of that assignment, I was thrilled<br />
to rejoin <strong>Watercare</strong> as it faced its expanded<br />
responsibilities and I would like to record<br />
my thanks to the board members and<br />
executives who acted as caretakers during<br />
my 20-month absence.<br />
From November 2010, and in the months<br />
that have followed, we have continued to<br />
refine the composition of the executive team<br />
to meet the challenges of the expanded<br />
business. I would like to thank all <strong>Watercare</strong><br />
staff for their continued efforts during<br />
this time and I believe that the teamwork<br />
and goodwill which exists at all levels of<br />
our organisation positions us strongly to<br />
continue to serve the people of Auckland.<br />
K M Ford<br />
Chief Executive<br />
Return to Contents page
<strong>Watercare</strong> Services Limited<br />
<strong>2011</strong> ANNUAL REPORT<br />
executives’<br />
profiles<br />
1 2<br />
3<br />
4<br />
5<br />
6<br />
7<br />
8<br />
9<br />
1 Mark Ford, 61<br />
CNZM, BA<br />
Chief Executive<br />
Mark Ford is the Chief Executive of <strong>Watercare</strong><br />
Services Ltd. He held the role from 1994 to June<br />
2009 and was reappointed following the company’s<br />
expansion to include retail operations. He is an<br />
experienced chief executive, director and chairman<br />
who has worked in the water, forestry, transport<br />
and petroleum industries. From July 2009 until<br />
his recent reappointment to <strong>Watercare</strong> he was<br />
Executive Chairman of the Auckland Transition<br />
Agency, the government agency responsible for<br />
planning and managing the transition to Auckland’s<br />
new governance arrangements. Mark currently<br />
serves as the Chair of Auckland Transport.<br />
2 Raveen Jaduram, 49<br />
ME, BE (Hons), FIPENZ<br />
Chief Operating Officer<br />
Raveen Jaduram was appointed to the role of Chief<br />
Operating Officer in early 2010. He has extensive<br />
experience in the New Zealand water industry<br />
and has previously held management roles at<br />
Manukau Water, Metrowater and <strong>Watercare</strong>. Raveen<br />
is a former president and board member of the<br />
New Zealand Water and Wastes Association, and<br />
New Zealand delegate to the Water Environment<br />
Federation, USA.<br />
3 Brian Monk, 61<br />
BCom, ACA<br />
Chief Financial Officer<br />
Brian Monk is a chartered accountant with 40 years’<br />
experience in corporate financial management. He<br />
was appointed to the role of Chief Financial Officer<br />
in November 2010. Brian has previously held senior<br />
financial management roles with Auckland Regional<br />
Council, Fletcher Energy, Air New Zealand and US<br />
multinational S.C. Johnson & Son.<br />
4 Trish Langridge, 53<br />
MBA, Diploma of Nursing<br />
Chief Services Officer<br />
Trish Langridge is an experienced general manager<br />
who has worked in both the health and local<br />
government sectors. Her responsibilities include<br />
customer services, human resources and property.<br />
Trish developed and implemented the customer<br />
services function of Auckland Council prior to<br />
joining <strong>Watercare</strong> in <strong>2011</strong>.<br />
5 Graham Wood, 54<br />
MIM, BA (Hons), FIE (Aust),<br />
MCIWEM, CPEng (Aust), C Eng (UK)<br />
Chief Infrastructure Officer<br />
Graham Wood is a chartered mechanical engineer<br />
with 20 years’ experience in the water industry<br />
across four continents. He is a former General<br />
Manager of Operations for <strong>Watercare</strong> and is<br />
currently responsible for the company’s major<br />
infrastructure projects, new developments, and<br />
energy and control systems.<br />
6 Rob Fisher, 67<br />
ONZM, LLB, Dip TP<br />
General Counsel<br />
Rob Fisher is a barrister who has specialised<br />
in resource management, public law and local<br />
government law. As a litigator, he appeared<br />
frequently before the Environment Court, the<br />
High Court and the Court of Appeal. In a 40-year<br />
legal career, he has provided strategic advice<br />
and expertise to both private and public bodies,<br />
especially in the consenting of large infrastructure<br />
projects. Rob was the 2010 Barrister of the Year<br />
in the New Zealand Law Awards and was made an<br />
Officer of the New Zealand Order of Merit in the<br />
<strong>2011</strong> Queen’s Birthday Honours.<br />
7 Clive Nelson, 45<br />
MBA<br />
Corporate Strategy and<br />
Communications Manager<br />
Clive Nelson’s responsibilities include corporate<br />
and strategic planning, media relations,<br />
publications, education programmes, and internal<br />
and external communications. He is an experienced<br />
general manager with a background in strategic<br />
planning, communications and media. From July<br />
2009 to November 2010, Clive was seconded to<br />
the Auckland Transition Agency.<br />
8 David Hawkins, 57<br />
MPP, TTC, JP<br />
Corporate Relations Manager<br />
David Hawkins’ responsibilities include<br />
government and community relations. He has<br />
a background in sales and marketing management<br />
for New Zealand and global brands, and has a<br />
strong commitment to local government and<br />
community engagement. David has previously<br />
served as an Auckland Regional Councillor and<br />
is a former Mayor of the Papakura District.<br />
9 David Sellars, 44<br />
BCA, CA<br />
Risk and Assurance Manager<br />
David Sellars is a chartered accountant with<br />
experience in banking and audit functions.<br />
He has previously been responsible for risk<br />
assurance, reporting on the internal control<br />
environment and governance of major projects.<br />
As the Risk and Assurance Manager, David is<br />
responsible for internal audit, risk management<br />
and quality assurance.<br />
Executives’ profiles<br />
Weblink<br />
Organisational structure Fig. 6<br />
PAGE 13<br />
Return to Contents page
<strong>Watercare</strong> Services Limited<br />
<strong>2011</strong> ANNUAL REPORT<br />
Onehunga<br />
gas explosion<br />
Early on Saturday 4 June <strong>2011</strong>, many<br />
New Zealanders woke to the news that there<br />
had been a serious accident at a construction<br />
site in the suburb of Onehunga, Auckland.<br />
<strong>Watercare</strong>’s Network Maintenance Planner<br />
Philomen Gulland, 48, was killed and several<br />
of her colleagues were injured when an<br />
explosion occurred during an inspection<br />
of a 1.9-metre-diameter pipe which had<br />
been drained of water. The fire service later<br />
identified the presence of gas, and the<br />
police, fire service and Department of Labour<br />
launched inquiries. Additionally, <strong>Watercare</strong><br />
commenced its own review.<br />
Four <strong>Watercare</strong> staff members and<br />
contractors required hospital treatment.<br />
One of these, Network Engineer Ian Winson,<br />
47, suffered serious injuries.<br />
Chief Executive Mark Ford described the<br />
accident as “a very dark hour for <strong>Watercare</strong>”,<br />
noting at the time: “These people are like<br />
family to us”.<br />
The accident occurred at a construction site at<br />
the intersection of Mt Smart Road, Victoria Street<br />
and Athens Road, where contractors earlier<br />
that morning had completed the removal of a<br />
section of the Hunua No. 3 watermain that had<br />
been drained and withdrawn from service. A<br />
new section of pipe was to be linked as part of<br />
a project which will ultimately connect a new<br />
watermain, Hunua No. 4, to the existing network.<br />
At the time of the accident, Philomen and her<br />
colleagues were commencing a condition<br />
inspection of a section of the drained pipe.<br />
The project work and the inspection had been<br />
scheduled for Queen’s Birthday Weekend as<br />
this is typically a time of low water demand<br />
in Auckland.<br />
Philomen, a Canadian-born mother-of-two,<br />
was a popular and well-respected <strong>Watercare</strong><br />
staff member. Several hundred friends,<br />
family and colleagues attended a gathering<br />
to farewell Philomen at Auckland’s Waipapa<br />
Marae. In a notice in The New Zealand Herald,<br />
her colleagues recalled her professionalism,<br />
generosity and laughter, and said she would<br />
be sorely missed.<br />
At a committee meeting on 9 June <strong>2011</strong>,<br />
members of Auckland Council observed<br />
a minute’s silence and expressed their<br />
condolences to the families of Philomen and<br />
to the others who were injured, recording<br />
that this was <strong>Watercare</strong>’s first lost-time injury<br />
accident in 18 months.<br />
Construction work has since been completed<br />
and the watermain has been returned to<br />
service with the new connection in place.<br />
<strong>Watercare</strong><br />
at work<br />
<strong>Watercare</strong> team aids Christchurch recovery<br />
<strong>Watercare</strong> sent a 28-strong response and<br />
recovery team to Christchurch following<br />
the devastating earthquake that struck the<br />
city on 22 February <strong>2011</strong>.<br />
Christchurch relies on groundwater. Prior to<br />
the earthquake, the groundwater was not<br />
treated and therefore the city’s water utility<br />
provider did not have disinfection facilities<br />
or expertise in this area. With the threat of<br />
groundwater contamination, the Medical<br />
Officer of Health decided it was necessary<br />
to chlorinate the water to lower the risk to<br />
public health.<br />
In the days that followed the earthquake,<br />
<strong>Watercare</strong> set up its containerised mobile<br />
Onehunga gas explosion<br />
chlorine dosing rig to disinfect water at the<br />
largest pump station. This rig had been built<br />
following the earthquake in September 2010<br />
and, while it was not needed then,<br />
it was quickly pushed into action this time.<br />
<strong>Watercare</strong> also designed and oversaw the<br />
production, installation and commissioning<br />
of 26 chlorine dosing rigs that were used<br />
at the high-risk pump stations.<br />
Operations Manager Wastewater<br />
Mark Bourne says the <strong>Watercare</strong> team set<br />
up a depot in Christchurch and secured a<br />
local contractor to assist with the build of<br />
the units.<br />
“After the units were pressure tested,<br />
we installed and commissioned them before<br />
handing them over to the council.” While the<br />
majority of work was based<br />
around water supply, a team of fitters<br />
and instrument technicians was based<br />
at Bromley Wastewater Treatment Plant<br />
to carry out emergency repair works.<br />
<strong>Watercare</strong> laboratory staff also helped<br />
the council with water-quality testing.<br />
The staff worked on a rotational basis<br />
over the course of four weeks.<br />
PAGE 14<br />
North-Western Water Supply Manager Priyan Perera beside one of the pump stations that was affected by the February earthquake.<br />
Return to Contents page
<strong>Watercare</strong> Services Limited<br />
<strong>2011</strong> ANNUAL REPORT<br />
Governance<br />
The board and management of <strong>Watercare</strong><br />
remain committed to ensuring that the<br />
company applies best-practice governance<br />
policies and procedures.<br />
1. ACCOUNTABILITY<br />
Shareholder<br />
<strong>Watercare</strong> has been the provider of bulk water<br />
and wastewater services to the Auckland<br />
region since 1991. On 1 November 2010,<br />
as a result of Auckland regional governance<br />
reforms, the company took over ownership and<br />
management of all the water and wastewater<br />
assets within the Auckland Council region and<br />
began retailing services directly to the people<br />
of Auckland. The exception was the Papakura<br />
district where retail services continue to be<br />
managed via an existing franchise agreement<br />
with United Water.<br />
People of Auckland<br />
Elect<br />
Auckland Council<br />
Appoint<br />
<strong>Watercare</strong> Board of Directors<br />
Appoint<br />
<strong>Watercare</strong> Chief Executive<br />
Employs<br />
<strong>Watercare</strong> staff<br />
Serves<br />
People of Auckland<br />
Prior to 1 November 2010, <strong>Watercare</strong> was<br />
owned by six city and district councils. With<br />
the disestablishment of those councils and the<br />
creation of a single unitary authority, <strong>Watercare</strong><br />
now has a single shareholder, Auckland<br />
Council. <strong>Watercare</strong> reports quarterly to<br />
Auckland Council through the Accountability<br />
and Performance Committee (the Committee),<br />
a committee of the whole council. The relevant<br />
legislation is set out below.<br />
Responsibilities<br />
The board is appointed by the shareholder<br />
to govern <strong>Watercare</strong> in accordance with the<br />
statutory obligations and in accordance with<br />
the agreed Statement of Corporate Intent<br />
(SCI). The board is ultimately responsible<br />
for all decision-making by the company.<br />
Operational responsibility is delegated<br />
to the Chief Executive by way of a formal<br />
delegated authority framework.<br />
Statement of Corporate Intent<br />
The SCI represents <strong>Watercare</strong>’s public and<br />
legislative expression of accountability to its<br />
shareholder and establishes the agreement<br />
between the board and the shareholder,<br />
setting out the objectives, nature and scope<br />
of activities undertaken and performance<br />
targets by which the company is measured.<br />
<strong>Watercare</strong> delivered the <strong>2011</strong>/12 SCI to the<br />
shareholder on 30 June <strong>2011</strong>, earlier than<br />
required by legislation. This followed a board<br />
meeting on 23 June <strong>2011</strong> at which members<br />
of the public were invited to attend and<br />
speak as the SCI was considered and<br />
adopted. As part of the process, feedback<br />
from Auckland’s local boards and the Maori<br />
Statutory Board was invited. The <strong>2011</strong>/12<br />
SCI is published on <strong>Watercare</strong>’s website<br />
www.watercare.co.nz.<br />
Performance measurement<br />
and reporting<br />
The performance of the company against<br />
the measures in the SCI is reported to the<br />
Committee quarterly. This annual report<br />
includes a Statement of Service Performance<br />
(SSP), which records the performance of<br />
the company against the measures in the<br />
2010/11 SCI. The report is set out on pages<br />
107-111. The company’s annual report<br />
also includes the reporting of performance<br />
against a number of non-mandatory<br />
measures. Performance measures in eight<br />
focus areas are reported on pages 20-57.<br />
2. TRANSPARENCY AND<br />
OPENNESS<br />
Legislative framework<br />
<strong>Watercare</strong> is a limited liability company<br />
registered under the Companies Act 1993<br />
which governs the conduct of companies in<br />
New Zealand. The Local Government Acts of<br />
1974 and 2002 define the roles and duties of<br />
local government organisations in New Zealand<br />
and contain specific provisions for <strong>Watercare</strong>.<br />
The legislative framework enabling and<br />
governing <strong>Watercare</strong>’s operations is largely<br />
found in three Acts and amendments:<br />
1. Local Government (Tamaki Makaurau<br />
Reorganisation) Act 2009<br />
2. Local Government (Auckland Council)<br />
Act 2009<br />
3. Local Government (Auckland Transitional<br />
Provisions) Act 2010.<br />
Under legislation, <strong>Watercare</strong> is currently<br />
a council organisation and will become a<br />
council-controlled organisation (CCO) on<br />
1 July 2012. By law it must remain owned<br />
by Auckland Council until 30 June 2015.<br />
The company’s obligations to deliver water<br />
and wastewater services for Auckland are<br />
established under Part 5 section 57(1)<br />
of the Local Government (Auckland Council)<br />
Act 2009 which stipulates that an Auckland<br />
water organisation:<br />
• Must manage its operations<br />
efficiently with a view to keeping<br />
the overall costs of water supply and<br />
wastewater services to its customers<br />
(collectively) at the minimum levels<br />
consistent with the effective conduct<br />
of its undertakings and the maintenance<br />
of the long-term integrity of its assets<br />
• Must not pay any dividend or<br />
distribute any surplus in any way,<br />
directly or indirectly, to any owner<br />
or shareholder<br />
• Is not required to comply with<br />
section 68(b) of the Local Government<br />
Act 2002 (voiding the requirement<br />
to pay a dividend)<br />
• Must have regard for public safety<br />
(e.g. the safety of children in urban areas)<br />
in relation to its structures.<br />
Also under the legislative framework:<br />
• At least two board meetings a year are<br />
required to be held in public, before<br />
30 June to consider the council’s<br />
comments on the draft SCI and after 1 July<br />
to consider the company’s performance<br />
under the SCI in the previous year<br />
• Elected members and employees of local<br />
authorities are prohibited from being<br />
<strong>Watercare</strong> directors<br />
• The company’s financial statements,<br />
the SCI and specified long-term plans<br />
must be audited by the Auditor-General,<br />
or by an auditor acting on behalf of the<br />
Auditor-General.<br />
Governance<br />
PAGE 15<br />
Return to Contents page
<strong>Watercare</strong> Services Limited<br />
<strong>2011</strong> ANNUAL REPORT<br />
Governance<br />
PAGE 16<br />
Governance (continued)<br />
Board performance<br />
The performance of the board is reviewed<br />
by the shareholder annually, both in relation<br />
to the board as a whole and the contribution<br />
of individual directors.<br />
Board remuneration<br />
Board remuneration is determined by the<br />
shareholder.<br />
Performance of the Chief Executive<br />
The performance of the Chief Executive<br />
is reviewed annually by the board.<br />
Transparency in reporting<br />
<strong>Watercare</strong> remains committed to transparent<br />
reporting. Recognising this, <strong>Watercare</strong> publishes:<br />
• An annual SCI;<br />
• An annual Funding Plan;<br />
• An Asset Management Plan;<br />
• An annual report that records<br />
performance against SCI and nonmandatory<br />
measures, and guidelines<br />
developed under the United Nations’<br />
Global <strong>Report</strong>ing G3 Initiative<br />
(see page 112);<br />
<strong>Watercare</strong> Governance<br />
Planning Cycle*<br />
feedback<br />
Final shareholder<br />
Draft SCI negotiated and revised<br />
S C I<br />
SCI Process<br />
Financial Planning Process<br />
a do p te d<br />
Tariffs set and<br />
Funding Plan<br />
approved<br />
Apr<br />
Mar<br />
t i o n<br />
Feb<br />
May<br />
l t a<br />
• An overview of current water storage<br />
levels and other information; and<br />
• Special reports and project newsletters<br />
for interested parties.<br />
Setting standards of conduct for staff<br />
<strong>Watercare</strong> demands the highest standards<br />
of behaviour from its staff. Policies governing<br />
the conduct of staff are published on the<br />
company’s intranet. The policies also set out<br />
the delegated authority within the company.<br />
<strong>Watercare</strong>’s projects are subject to internal<br />
probity reviews and external probity auditors<br />
are appointed to provide additional assurance<br />
on major projects.<br />
Whistleblowing<br />
The company has a specific policy to receive<br />
and deal with information about any serious<br />
wrongdoing within the company, as required<br />
by the Protected Disclosures Act 2000.<br />
<strong>Watercare</strong>’s policy prescribes how <strong>Watercare</strong><br />
staff and others would report matters of<br />
serious wrongdoing, and provides contacts<br />
to whom such reporting can be addressed.<br />
The policy defines serious wrongdoing and<br />
applies to present and past employees, and<br />
to any individual either seconded to, or<br />
working on a contract basis for, <strong>Watercare</strong>.<br />
f c o n s u<br />
A s s e t M a n a g e m e n t<br />
<strong>Annual</strong> Repo r<br />
r i f<br />
T a<br />
Funding Plan and<br />
tariff-setting<br />
process begins<br />
Asset Management Plan<br />
<strong>Annual</strong> <strong>Report</strong><br />
* From 1 July 2012, <strong>Watercare</strong> will produce a Statement of Intent (SOI) rather than an SCI.<br />
Jun<br />
Jan<br />
Dec<br />
Jul<br />
Aug<br />
Nov<br />
Sep<br />
Oct<br />
t<br />
Shareholder<br />
presentation<br />
P<br />
l a n<br />
of expectation<br />
received<br />
Mayoral letter<br />
Tariff options prepared<br />
S C I<br />
d r a f t<br />
p r e p a r e d<br />
3. INTEGRITY<br />
Corporate governance charter<br />
The charter defines the duties and obligations<br />
of the board and board members covering<br />
fiduciary duty, duty of care, diligence,<br />
legal and statutory duties, and conflicts of<br />
interest. It incorporates the principles of the<br />
New Zealand Institute of Directors’ Code of<br />
Proper Practice for Directors, relevant sections<br />
of the New Zealand Exchange Limited (NZX)<br />
Corporate Governance Best Practice Code and<br />
the Securities Commission’s nine principles<br />
of corporate governance.<br />
Disclosures of interest<br />
A register of directors’ interests is maintained<br />
by <strong>Watercare</strong> and updated as and when<br />
necessary. Directors’ interests are a standard<br />
item of business on the agenda of every<br />
board meeting. These agendas are published<br />
on www.watercare.co.nz. Any disclosure of<br />
interest is recorded in the meeting minutes<br />
and the participant concerned refrains from<br />
taking part in the discussion or voting on any<br />
related resolution. During the year, there were<br />
four occasions when a director disclosed<br />
a potential conflict of interest.<br />
Audit and Risk Committee<br />
The board is responsible for appointing the<br />
members of the Audit and Risk Committee.<br />
The committee’s role is to assist the board<br />
to fulfil its responsibilities in the areas of<br />
financial reporting and to provide assurance<br />
regarding compliance with internal controls,<br />
policies and procedures. Its responsibilities<br />
are established in the Audit and Risk<br />
Committee Charter which is reviewed<br />
annually. The committee has no delegated<br />
authority. In carrying out its duties, the<br />
committee meets regularly with the external<br />
and internal auditors (both with and without<br />
management present) and the management<br />
of the company. At least one member must<br />
have accounting or financial management<br />
expertise. The Chairman of the board may<br />
not be Chairman of the Audit and Risk<br />
Committee. The Chairman of the board is<br />
Ross Keenan. The Chairman of the Audit and<br />
Risk Committee is Jeff Todd. All <strong>Watercare</strong><br />
directors receive the papers of the Audit and<br />
Risk Committee in advance and all are invited<br />
to attend committee meetings.<br />
Regular independent reviews<br />
<strong>Watercare</strong> validates its planning, operations<br />
and reporting with independent consultants<br />
on a regular basis. This year, the Audit and<br />
Risk Committee sought a review by J Hagen<br />
Ltd on the extent to which <strong>Watercare</strong> follows<br />
good practice in its procurement processes<br />
Return to Contents page
<strong>Watercare</strong> Services Limited<br />
<strong>2011</strong> ANNUAL REPORT<br />
and ensures that competitive tendering is<br />
undertaken when appropriate. The review<br />
concluded that policies were appropriate for<br />
<strong>Watercare</strong> and that they reflect good practice.<br />
4. STEWARDSHIP<br />
Indemnity and insurance<br />
<strong>Watercare</strong> has executed a deed of indemnity<br />
with each director which indemnifies the<br />
director in accordance with the company’s<br />
constitution and grants certain rights in<br />
respect of access to documents and the<br />
maintenance of liability insurance cover.<br />
Board meetings<br />
<strong>Watercare</strong>’s board meetings are advertised<br />
in advance and members of the public are<br />
invited via public notices and the company’s<br />
website. The agenda and papers being<br />
presented to the board are made available<br />
in advance of the board meeting through<br />
<strong>Watercare</strong>’s website, where minutes of<br />
previous meetings are also published.<br />
Additionally, two meetings invite public<br />
feedback (one on performance for the<br />
previous year and the other on the SCI for<br />
the following year). During the year, two joint<br />
board and management workshops were held.<br />
Risk management<br />
<strong>Watercare</strong>’s framework for risk identification,<br />
measurement and reporting is well<br />
developed, and meets the requirements<br />
of AS/NZS ISO 31000:2009. There are<br />
regular external reviews of <strong>Watercare</strong>’s<br />
framework to ensure the company meets<br />
and exceeds good practice measures in risk<br />
management. As part of the risk-management<br />
framework, the company has established a<br />
Risk Steering Committee which meets six<br />
times per year to monitor emerging risk and<br />
risk-mitigating actions and strategies. The<br />
committee comprises the Chief Executive,<br />
senior management, the Risk and Assurance<br />
Manager and the Corporate Risk Manager.<br />
Risks that have serious consequences are in<br />
turn directly monitored by the board, with<br />
updates presented to each meeting.<br />
External auditor<br />
The Auditor-General is the auditor<br />
of the company’s financial statements.<br />
The Auditor-General has appointed Jamie<br />
Schmidt, using the staff and resources of<br />
Deloitte, to undertake the external audit work<br />
on behalf of the Auditor-General, in<br />
accordance with the Auditor-General’s Audit<br />
Standards, which incorporate New Zealand<br />
Auditing Standards. Deloitte has no<br />
relationship with the company outside<br />
of the audit and related assurance activities.<br />
This satisfies the independence requirements<br />
of the Auditor-General and the Institute of<br />
Chartered Accountants of New Zealand.<br />
Regulators<br />
<strong>Watercare</strong> is subject to regulation in<br />
planning, health and environmental matters.<br />
The principal regulators include: Auckland<br />
Council, Waikato Regional Council and<br />
Ministry of Health. The company also engages<br />
with these bodies by providing input on the<br />
impacts of existing and proposed policy and<br />
regulation on <strong>Watercare</strong>’s activities.<br />
Advisory groups<br />
<strong>Watercare</strong> has two standing consultative and<br />
advisory committees that have commented on<br />
company plans and projects in 2010/11. They<br />
are the Environmental Advisory Group and<br />
the Maori Advisory Group. The Environmental<br />
Advisory Group comprises experts who advise<br />
on how the company’s activities impact<br />
on the environment. The Maori Advisory<br />
Group advises <strong>Watercare</strong> on how its plans<br />
and operations impact on Maori and on the<br />
relationship between the natural environment<br />
and Maori. The reports of the Environmental<br />
Advisory Group and the Maori Advisory Group<br />
can be found on pages 18 and 19.<br />
Other stakeholders<br />
The company consults extensively with<br />
its shareholder and customers, local<br />
communities, environmental regulators,<br />
special interest groups and advisory groups.<br />
The performance of the company is very<br />
closely monitored in terms of the level<br />
and quality of the service provided to both<br />
customers and the community. The level of<br />
service is reported to the board monthly and<br />
to the shareholder on a quarterly basis.<br />
Official information requests<br />
In 2010/11, <strong>Watercare</strong> received 20 requests<br />
under the Local Government Official<br />
Board Member Appointed Attendance at Board<br />
Information and Meetings Act 1987.<br />
The average response time was six days.<br />
5. LEADERSHIP<br />
Governance communication<br />
As previously noted, <strong>Watercare</strong> board<br />
meetings are held in public. At the two<br />
specified board meetings, members of the<br />
public are given the right to speak in regard<br />
to the SCI. Decisions of a confidential or<br />
commercial nature are held in a confidential<br />
section of each board meeting. All papers<br />
presented at the public meetings and the<br />
minutes are published on the company’s<br />
website.<br />
Complaints disclosure<br />
Any complaints against the company and<br />
the quality of response are recorded. Targets<br />
have been set for the management of<br />
these processes and the levels of service<br />
are reported in the annual report, to the<br />
shareholder quarterly, to the board monthly<br />
and are made public at the board meetings<br />
and published on the company website.<br />
Board membership and composition<br />
The board comprises eight independent,<br />
non-executive directors. Their profiles and<br />
disclosures of interests are published on<br />
page 9. Directors, including the Chairman,<br />
are appointed by the shareholder. Initial<br />
board appointments are normally for a<br />
term of three years in accordance with the<br />
company’s constitution, with directors being<br />
eligible for reappointment at the discretion<br />
of the shareholder.<br />
Graeme Hawkins retired from <strong>Watercare</strong><br />
in December 2010, following eight years<br />
as Chairman. He was replaced by former<br />
Deputy Chairman Ross Keenan.<br />
Attendance at Audit<br />
and Risk Committee<br />
Ross Keenan<br />
(Chairman since Dec 2010)<br />
March 2010 16/17 4/5<br />
David Clarke<br />
(Deputy Chairman)<br />
July 2008 14/17<br />
Patrick Snedden Dec 2002 16/17 3/3<br />
Susan Huria July 2008 16/17<br />
Peter Drummond March 2010 12/17<br />
Jeff Todd<br />
(Chairman Audit and Risk)<br />
May 2007 13/17 5/5<br />
Catherine Harland April <strong>2011</strong> 2/2<br />
Tony Lanigan April <strong>2011</strong> 2/2<br />
Graeme Hawkins<br />
(Former Chairman)<br />
Dec 2002<br />
(retired Dec 2010)<br />
11/11 2/2<br />
Governance<br />
PAGE 17<br />
Return to Contents page
<strong>Watercare</strong> Services Limited<br />
<strong>2011</strong> ANNUAL REPORT<br />
Environmental<br />
advisory group<br />
27 July <strong>2011</strong><br />
This has been an exciting and challenging year for <strong>Watercare</strong>. In addition<br />
to its responsibility for providing bulk water supply and wastewater services,<br />
on 1 November 2010 <strong>Watercare</strong> assumed the responsibility for providing retail<br />
water supply and wastewater services across the Auckland region. This new area<br />
of responsibility brings with it a range of new environmental challenges.<br />
The Environmental Advisory Group (EAG) continues to work closely with <strong>Watercare</strong><br />
to advise and challenge <strong>Watercare</strong> on how it responds to and addresses the<br />
environmental aspects of providing integrated water supply and wastewater<br />
services across the region.<br />
EAG members offer a range of expertise and experience that enable us to provide<br />
an environmental perspective on the key issues that <strong>Watercare</strong> faces in providing<br />
these vital services to the community. Our involvement with community organisations<br />
provides us with insights into how <strong>Watercare</strong>’s projects and activities will be received<br />
within the community.<br />
The areas in which EAG has been actively engaged with <strong>Watercare</strong> over the last<br />
year include:<br />
66<br />
The impact of wastewater overflows on Auckland’s receiving environment<br />
and how these are addressed in the Central Interceptor Project and network<br />
consent process<br />
66<br />
The integration of trade waste policies and programmes across the region<br />
66<br />
Biosolid use, planning and research<br />
66<br />
Responses to freshwater management objectives including the newly adopted<br />
National Environmental Policy on Freshwater Management and its implications<br />
for the region<br />
66<br />
The application of <strong>Watercare</strong>’s Sustainability Policy and strategic priorities<br />
66<br />
Water demand-management strategies<br />
66<br />
The lessons from the Christchurch earthquake and their application to the<br />
Auckland region.<br />
All of these issues will continue to be critical for <strong>Watercare</strong> during the upcoming year,<br />
and EAG will continue to be involved in advising <strong>Watercare</strong> on these issues that have<br />
important implications for the community and the environment.<br />
Paul Walbran<br />
Chairman<br />
Environmental Advisory Group<br />
Environmental Advisory Group<br />
PAGE 18<br />
MEMBERS<br />
Paul Walbran<br />
Water quality,<br />
harbour health<br />
and heritage<br />
Ken Catt<br />
The water cycle<br />
Anne Fenn<br />
Environmental<br />
policy and<br />
implementation<br />
Carol McSweeney<br />
Air quality,<br />
ecosystems<br />
and botany<br />
Dr Peter Maddison<br />
Entomology, flora<br />
and fauna<br />
Judy Bischoff<br />
Water and land<br />
use, energy<br />
Bob Tait<br />
Biosolids<br />
Return to Contents page
<strong>Watercare</strong> Services Limited<br />
<strong>2011</strong> ANNUAL REPORT<br />
Maori advisory<br />
group<br />
26 July <strong>2011</strong><br />
<strong>Watercare</strong> Services, or kaitiaki o te wai, is a very appropriate name for a company<br />
that is responsible for delivering drinking water to the householder’s tap.<br />
Then, all we have to do is push a button or pull a plug and it all disappears<br />
back into the environment from where it came.<br />
My personal involvement in this industry started back in the late sixties when<br />
I worked as an apprentice plumber. It’s hard to believe that we have an industry<br />
that is leading the way in water and wastewater treatment.<br />
This is not a simple network. Tangata whenua, as kaitiaki, and other environmental<br />
guardians have fought hard to ensure that these services are of the highest<br />
standard in order to protect the environment.<br />
The Maori Advisory Group provides essential strategic and policy advice on the<br />
tangata whenua aspects of <strong>Watercare</strong>’s activities so that the company can take into<br />
account Maori perspectives in its strategic directions and policies, and address<br />
potential impacts on related activities and operations.<br />
This year, the Maori Advisory Group has advised <strong>Watercare</strong> on strategic projects<br />
such as Hunua No. 4 and the Central Interceptor, and key issues such as the regional<br />
network discharge consent and the management of biosolids. The Group also held a<br />
special workshop on Managing Water Resources to Supply the Auckland Region and<br />
participated in discussions on the Auckland Regional Water Demand Management Plan.<br />
So kia kaha (be strong), for these are the costs of getting water to the tap and away<br />
again, for our mokopuna’s (grandchildren’s) future well-being and prosperity.<br />
Heikonei ra<br />
William Kapea<br />
Chairman<br />
Maori Advisory Group<br />
MEMBERS<br />
William Kapea<br />
Ngati Whatua<br />
Gary Thompson<br />
Ngati Paoa<br />
Kowhai Olsen<br />
Tainui<br />
Paul Brown<br />
Tainui<br />
Dennis Ngataki<br />
Tainui<br />
Brownie Rauwhero<br />
Tainui<br />
Maori Advisory Group<br />
Pamera Warner<br />
Ngati Whatua<br />
Norma Arlidge<br />
Ngati Whatua<br />
Tim Manukau<br />
Tainui<br />
Carmen Kirkwood<br />
Tainui<br />
PAGE 19<br />
Return to Contents page
<strong>Watercare</strong> Services Limited<br />
<strong>2011</strong> ANNUAL REPORT<br />
safe and reliable water<br />
Management of water resources to provide a safe and<br />
reliable water supply.<br />
Safe and reliable water<br />
PAGE 20<br />
Return to Contents page
<strong>Watercare</strong> Services Limited<br />
<strong>2011</strong> ANNUAL REPORT<br />
Fresh water is a vital but limited resource, essential for the health and well-being of<br />
everyone. Auckland is known for its relatively wet climate and each year the region<br />
receives, on average, 1,220mm of rainfall. Rain collected in the Waitakere and Hunua<br />
ranges is stored in <strong>Watercare</strong>’s 10 water supply dams before being treated at our water<br />
treatment plants and sent to households. Auckland’s water supply is also augmented<br />
by an underground supply in Onehunga and from a water take and treatment plant<br />
on the Waikato River at Tuakau. Smaller ground and river sources also supply outlying<br />
rural communities.<br />
Wairoa Dam in the Hunua Ranges is<br />
Auckland’s fourth-largest water supply<br />
dam. It was built in 1975 and its lake<br />
covers 98 hectares.<br />
<strong>Watercare</strong> provides the community with<br />
access to land in the Hunua and Waitakere<br />
ranges and around the Manukau Harbour for<br />
recreational use. It maintains walking tracks<br />
and allows fishing by permit at Mangatangi<br />
and Mangatawhiri dams. The <strong>Watercare</strong><br />
Coastal Walkway around the Manukau<br />
Harbour is also very popular.<br />
Overall score for<br />
the focus area<br />
96%<br />
100<br />
90<br />
80<br />
70<br />
60<br />
50<br />
40<br />
30<br />
20<br />
10<br />
See page 3<br />
PAGE 21<br />
Safe and reliable water<br />
Return to Contents page
<strong>Watercare</strong> Services Limited<br />
<strong>2011</strong> ANNUAL REPORT<br />
safe and reliable water<br />
1A. Percentage of drinking water treated in <strong>Watercare</strong> plants<br />
that are graded ‘A’ by the Ministry of Health.<br />
10 20 30 40 50 60 70 80 90 100<br />
<strong>2011</strong><br />
92% 7/10<br />
New Performance Measure Target 100% by 2020<br />
The Auckland Regional Public Health Service undertakes an annual risk-based assessment of the drinking water supply system on behalf of the Ministry of Health.<br />
The assessment is a measure of confidence that the system will not become contaminated. All the metropolitan water treatment plants that supply the bulk of drinking<br />
water to the people in Auckland meet the ‘A’ grade standard. In total, ‘A’ grade plants supply 92% of the drinking water to the Auckland area. Of the smaller nonmetropolitan<br />
plants transferred to <strong>Watercare</strong> on 1 November 2010, nine remain ungraded. <strong>Watercare</strong> has set in place a programme to ensure all plants meet the<br />
‘A’ grade standard by 2020, at a capital cost of $100 million for both water treatment plants and the distribution network.<br />
1B. Percentage of drinking water reticulated through the <strong>Watercare</strong> network that is graded ‘a’<br />
by the Ministry of Health.<br />
10 20 30 40 50 60 70 80 90 100<br />
<strong>2011</strong><br />
89% 7/10<br />
New Performance Measure Target 100% by 2020<br />
The same risk-based assessment used for water treatment plants also applies to the pipes and pump stations that make up the water distribution networks. The metropolitan<br />
network is graded ‘a’ under the Ministry of Health’s standards and supplies the bulk of the drinking water to the people in the Auckland area. These networks, plus the ‘a’ graded<br />
non-metropolitan networks, supply 89% of the water to the Auckland area. Of the 16 non-metropolitan networks (inherited on 1 November 2010), 10 are ungraded and three<br />
are ‘b’ graded. <strong>Watercare</strong> has set in place a programme to ensure that all the networks meet the ‘a’ grade standard by 2020.<br />
1C. Percentage performance against Statement of Corporate Intent target:<br />
quality of drinking water.<br />
10 20 30 40 50 60 70 80 90 100<br />
<strong>2011</strong><br />
100% 7/10<br />
New Performance Measure<br />
Target<br />
<strong>Watercare</strong> fully met the Statement of Corporate Intent (SCI) target in respect of the achievement of the Ministry of Health’s Drinking Water Standards for New Zealand<br />
(DWSNZ) at Ministry of Health-graded water treatment plants (see ruler 1A, above). The DWSNZ standards are based on a quality assurance approach, underpinned<br />
by the requirement to develop public health risk-management plans. Information on DWSNZ is available at www.moh.govt.nz\water.<br />
1D. Percentage performance against Statement of Corporate Intent target:<br />
service interruption to customer connection ratio.<br />
10 20 30 40 50 60 70 80 90 100<br />
<strong>2011</strong><br />
100% 7/10<br />
New Performance Measure<br />
Target
<strong>Watercare</strong> Services Limited<br />
<strong>2011</strong> ANNUAL REPORT<br />
Laboratory Technicians<br />
Shanaz Taz (left) and<br />
Monaz Bharucha carry<br />
out nutrient analysis<br />
on water samples<br />
using the Flow<br />
Injection Analyser.<br />
Weblinks<br />
Water and wastewater facts Fig. 1<br />
Grading of water treatment plants and networks Fig. 8<br />
Drinking water quality Fig. 9<br />
Typical analysis of Auckland’s drinking water Fig. 10<br />
Water supply interruptions Fig. 11<br />
Water supply restoration Fig. 12<br />
Water quality complaints Fig. 13<br />
1F. Percentage performance against Statement of Corporate Intent target:<br />
unaccounted-for water loss.<br />
10 20 30 40 50 60 70 80 90 100<br />
<strong>2011</strong><br />
100% 7/10<br />
New Performance Measure 8-month target
<strong>Watercare</strong> Services Limited<br />
<strong>2011</strong> ANNUAL REPORT<br />
PAGE 24<br />
Return to contents Contents page
<strong>Watercare</strong> Services Limited<br />
<strong>2011</strong> ANNUAL REPORT<br />
<strong>Watercare</strong><br />
at work<br />
Improving Pukekohe’s water supply<br />
<strong>Watercare</strong> is rolling out a $13.1 million project to construct<br />
a watermain to supply Pukekohe with water from the Waikato<br />
Water Treatment Plant. Preliminary work has commenced, with<br />
the new watermain expected to be operational by mid-2013.<br />
Announcing the project, <strong>Watercare</strong>’s Chief Executive Mark Ford<br />
said the project will address both water quality and capacity<br />
issues with the existing water supply infrastructure, which was<br />
previously operated by the Franklin District Council.<br />
He said: “At the moment, the water sources and plants in Pukekohe<br />
cannot produce enough water to satisfy peak demand and there<br />
have been long-standing complaints about the water colour<br />
and quality.<br />
“The shortfall between supply and demand is only going to<br />
increase as the population grows. If we do nothing, demand<br />
projections suggest that by 2031 the shortfall alone will be<br />
equivalent to around four million litres per day.”<br />
<strong>Watercare</strong> took over responsibility for retail water services in<br />
the Auckland Council area from November 2010. A review of<br />
water quality complaints across the region shows a high level<br />
of dissatisfaction in the Franklin area.<br />
Programmes Engineer Frank Lin and Project<br />
Engineer Sharon Danks at the site of preliminary<br />
works in Pukekohe.<br />
<strong>Watercare</strong> carried out an options evaluation before deciding<br />
on this project. The options included:<br />
1. Maintaining the status quo<br />
2. Expanding existing sources and upgrading the<br />
treatment plants<br />
3. Upgrading the treatment plants and constructing<br />
a smaller watermain to connect Pukekohe to the<br />
Waikato watermain.<br />
The third option, which was selected, is the most robust,<br />
both financially and in terms of the security of the supply.<br />
“If we do nothing, demand projections<br />
suggest that by 2031 the shortfall alone<br />
will be equivalent to around four million<br />
litres per day.”<br />
Safe and reliable water<br />
PAGE 25<br />
Return to Contents page
<strong>Watercare</strong> Services Limited<br />
<strong>2011</strong> ANNUAL REPORT<br />
Healthy Waterways<br />
Management of wastewater discharges to maintain or improve<br />
the health of the environment.<br />
Healthy waterways<br />
PAGE 26<br />
Return to Contents page
<strong>Watercare</strong> Services Limited<br />
<strong>2011</strong> ANNUAL REPORT<br />
Auckland has two spectacular coastlines with highly valued harbours, estuaries, beaches<br />
and islands. The health of these waterways is important for the development of healthy and<br />
vibrant local communities. <strong>Watercare</strong> owns 20 wastewater treatment plants and an extensive<br />
network of wastewater pipes, and is committed to minimising impacts on the Auckland<br />
environment. The three largest wastewater treatment plants at Mangere, Rosedale and<br />
Army Bay treat the majority of regional wastewater to a very high standard, helping<br />
to protect the quality of our largest waterways, the Waitemata and Manukau harbours,<br />
and their associated freshwater and coastal environments.<br />
Rosedale Wastewater<br />
Treatment Plant on<br />
Auckland’s North Shore<br />
serves over 200,000<br />
people.<br />
Above: Reticulation<br />
Servicemen Mac Taukiri<br />
and Garry Dolan carry<br />
out an inspection on the<br />
wastewater network.<br />
Overall score for<br />
the focus area<br />
98%<br />
100<br />
90<br />
80<br />
70<br />
60<br />
50<br />
40<br />
30<br />
20<br />
10<br />
See page 3<br />
PAGE 27<br />
Healthy waterways<br />
Return to Contents page
<strong>Watercare</strong> Services Limited<br />
<strong>2011</strong> ANNUAL REPORT<br />
Healthy waterways<br />
2A. Percentage of wastewater discharged compliant with consent conditions.<br />
10 20 30 40 50 60 70 80 90 100<br />
<strong>2011</strong><br />
97% 7/10<br />
New Performance Measure<br />
Target 100% by 2020<br />
Compliance with consents at the major urban wastewater treatment plants remained high throughout the year, although overall compliance levels were<br />
influenced by the poor quality of many of the 17 rural wastewater treatment plants transferred to <strong>Watercare</strong> upon integration. More than half these plants had<br />
a history of non-compliance with consent conditions because of process issues, many of which are difficult and costly to resolve. <strong>Watercare</strong> has developed both<br />
a longer-term strategy and more immediate measures, forecast to cost $50 million, to reduce the impacts of these plants on the environment. On a volume basis<br />
and excluding minor and technical breaches, <strong>Watercare</strong> achieved a 97% level of compliance with consent requirements at its wastewater treatment plants.<br />
2B. Percentage performance against Statement of Corporate Intent target:<br />
dry-weather sewer overflows.<br />
10 20 30 40 50 60 70 80 90 100<br />
<strong>2011</strong><br />
100% 7/10<br />
New Performance Measure<br />
Target ≤15 per 100km of pipe length<br />
Under the SCI, <strong>Watercare</strong> reports on the number of wastewater overflows from its network during dry weather as a measure of the ability of the network<br />
to manage current demand. For the 2010/11 year, <strong>Watercare</strong> achieved a result of 1.9 overflows per 100km of wastewater pipe, well within the SCI target of 15.<br />
2C. Percentage performance against Statement of Corporate Intent target:<br />
unplanned sewer interruptions.<br />
10 20 30 40 50 60 70 80 90 100<br />
New Performance Measure<br />
Target
<strong>Watercare</strong> Services Limited<br />
<strong>2011</strong> ANNUAL REPORT<br />
<strong>Watercare</strong><br />
at work<br />
Delivering a cleaner Hobson Bay<br />
<strong>Watercare</strong> successfully completed Project Hobson in<br />
March <strong>2011</strong>, after nearly four years of construction work.<br />
Chief Infrastructure Officer Graham Wood says the project<br />
was about two things: providing for population growth and<br />
improving the local environment.<br />
“What we had was an ageing sewer pipe that crossed Hobson<br />
Bay and connected to a small pump station,” he says.<br />
“One of our concerns was that the sewer pipe would overflow<br />
during heavy rainfall when volumes would increase four-fold.<br />
Our solution was to replace the sewer pipe with a threekilometre-long<br />
wastewater tunnel that would connect to<br />
a high-capacity pump station in the Orakei Domain.”<br />
Work began in June 2007, when <strong>Watercare</strong> established<br />
construction sites in Orakei Domain and Remuera. The Orakei<br />
site was where two activities took place: it was the hub for the<br />
tunnelling operation and the place where the pump station<br />
was built. The Remuera site provided access, via a temporary<br />
road, to shorelines in Parnell and Remuera, where shafts were<br />
excavated to connect the tunnel to the existing wastewater<br />
network. The park was also the base from which the sewer pipe<br />
was demolished.<br />
A view of the wastewater tunnel during construction.<br />
Now commissioned, it transports over 3,000 litres per second<br />
during heavy rainfall.<br />
“The tunnelling operation was launched in April 2008 and<br />
progressed at a rate of around 120 metres a week for seven<br />
months. By the time it arrived in Parnell, over 100,000 tonnes<br />
of earth had been removed.”<br />
One of the major features of the new tunnel and pump station<br />
is their combined storage capacity. This means the flow to the<br />
Mangere Wastewater Treatment Plant can be regulated<br />
during heavy rain, reducing wet-weather overflows.<br />
For the people of Auckland, the most significant part of the<br />
project commenced in June 2010, when contractors began<br />
demolishing the sewer pipe that had crossed Hobson Bay for<br />
nearly 100 years. Within a few months, all signs of the pipe were<br />
gone and the construction sites were reinstated to parklands.<br />
“The tunnelling machine progressed at a rate<br />
of around 120 metres a week for seven months.<br />
By the time it arrived in Parnell, over 100,000<br />
tonnes of earth had been removed.”<br />
Healthy waterways<br />
PAGE 29<br />
Return to Contents page
<strong>Watercare</strong> Services Limited<br />
<strong>2011</strong> ANNUAL REPORT<br />
Health, safety and well-being<br />
To be an industry-best workplace.<br />
Health, safety and well-being<br />
PAGE 30<br />
Return to Contents page
<strong>Watercare</strong> Services Limited<br />
<strong>2011</strong> ANNUAL REPORT<br />
<strong>Watercare</strong> has grown in size as it meets the challenge of serving all the people of Auckland<br />
as an integrated wholesale and retail business. The company’s long-standing commitment<br />
to being an industry-best workplace continues, with an ongoing emphasis on recruiting<br />
and developing the best people in all areas of work. Health and safety remains a major<br />
focus, with an induction process for all new recruits and contractors, and health and safety<br />
systems and programmes that are reviewed by the company’s executive team and by<br />
the board.<br />
Network Operator Ruel Garcia<br />
checks off each step in a detailed<br />
procedure manual prior to giving<br />
the reticulation servicemen<br />
the go-ahead to enter a valve<br />
chamber to shut down the<br />
North Shore No.1 watermain.<br />
Above: Occupational Health<br />
Nurse Carol Roberts takes<br />
Senior Engineer Richard<br />
Millican’s blood pressure as part<br />
of his annual health check.<br />
Overall score for<br />
the focus area<br />
84%<br />
See page 3<br />
100<br />
90<br />
80<br />
70<br />
60<br />
50<br />
40<br />
30<br />
20<br />
10<br />
PAGE 31<br />
Health, safety and well-being<br />
Return to Contents page
<strong>Watercare</strong> Services Limited<br />
<strong>2011</strong> ANNUAL REPORT<br />
health, safety and well-being<br />
3A. Performance against Statement of Corporate Intent measure: lost-time injury frequency rate.<br />
Number of lost-time injuries per year per 1,000,000 hours worked<br />
36 32 28 24 20 16 12 8 4 0<br />
Target ≤5<br />
The lost-time injury frequency rate (LTIFR) measures the number of lost-time injuries per million hours worked and allows for comparisons across<br />
industries. Despite the serious incident in Onehunga on 4 June (page 14), <strong>Watercare</strong> achieved a rate of 3.2 which is well below the SCI target of not<br />
more than 5. The score of 92% is based on <strong>Watercare</strong>’s aspirational aim to reduce LTIFR to zero. This year, the company held 253 health and safety<br />
inductions which were attended by 5,060 internal and external people. Additionally, 513 health and safety inspections were completed, which is 58<br />
more than the target set for the year.<br />
<strong>2011</strong><br />
92% 7/10<br />
2007 2008 2009 2010<br />
95 85 95 90<br />
% % % %<br />
3B. Performance: lost-time severity rate.<br />
Number of days lost x 200,000 hours worked<br />
36 32 28 24 20 16 12 8 4 0<br />
Target ≤4<br />
The severity rate measures the number of days lost from injury per 200,000 hours worked. <strong>Watercare</strong> had an injury severity rate of 9.48 in 2010/11<br />
which increased from 3.75 last year. This increase reflects the severity of injuries resulting from the serious incident which occurred on 4 June <strong>2011</strong>.<br />
<strong>Watercare</strong> has an internal target of no more than 4, although the company seeks to achieve a rate of zero and measures its performance against this.<br />
<strong>2011</strong><br />
76% 7/10<br />
2007 2008 2009 2010<br />
85 60 95 90<br />
% % % %<br />
3C. Performance against Statement of Corporate Intent target:<br />
staff wellness.<br />
3.2 3.0 2.8 2.6 2.4 2.2 2.0 1.8 1.6 1.4<br />
<strong>2011</strong><br />
70% 7/10<br />
Target
<strong>Watercare</strong> Services Limited<br />
<strong>2011</strong> ANNUAL REPORT<br />
3E. Performance: staff training.<br />
Training/study hours per employee<br />
3 6 9 12 15 18 21 24 27 30<br />
<strong>Watercare</strong> invested an average of $819 per employee for educational and development training during 2010/11, providing an average of 20.7 hours<br />
of training per employee. This is above the target of 20 hours. The score of 69% is based on the longer-term aim of achieving 30 hours of training and<br />
study per employee each year.<br />
Target<br />
<strong>2011</strong><br />
69% 7/10<br />
2007 2008 2009 2010<br />
85 85 90 85<br />
% % % %<br />
The Engineering Graduate Group, established in 2007, continues strongly with 21 graduates working towards chartered status and six operations staff<br />
continuing their studies beyond national certificate level and achieving diploma level qualifications.<br />
3F. Performance against Statement of Corporate Intent target: staff appointment ratio.<br />
Ratio of external to internal appointments<br />
3.25 3.00 2.75 2.50 2.25 2.00 1.75 1.50 1.25 1.00<br />
Target
<strong>Watercare</strong> Services Limited<br />
<strong>2011</strong> ANNUAL REPORT<br />
PAGE 34<br />
Laboratory Technician Ling Ling Li<br />
(left) and Senior Laboratory<br />
Technician Robyn Abernethy<br />
prepare samples for trace metals<br />
analysis in the laboratory’s clean<br />
room. This restricted environment<br />
ensures the samples are safe from<br />
contamination – allowing the<br />
technicians to achieve extremely<br />
accurate results with parts per<br />
billion detection limits.<br />
Return to Contents contents page
<strong>Watercare</strong> Services Limited<br />
<strong>2011</strong> ANNUAL REPORT<br />
<strong>Watercare</strong><br />
at work<br />
First-aid training proves vital<br />
Reticulation Servicemen Mac Taukiri and Robert Potter put<br />
their first-aid training to good use when they came to the<br />
assistance of an assault victim in Onehunga in May <strong>2011</strong>.<br />
Mac and Robert were carrying out a trial watermain shutdown<br />
in the early hours of the morning when they heard angry voices<br />
and saw three figures behind their vehicles. Thinking the<br />
vehicles were being broken into, the pair approached the group,<br />
two of whom fled the scene.<br />
Once behind the vehicles they discovered that the third figure,<br />
a man in his 20s, was lying in the gutter.<br />
Mac says he was unconscious: “Our first thought was to<br />
get him out of the water and try to make him warm.”<br />
Thankfully for the victim, the pair put their first-aid training into<br />
action and were soon assisted by an off-duty ambulance officer<br />
who lives across the street and had witnessed the assault.<br />
“It was raining really hard and he was lying in water; so, after<br />
the ambulance officer had wrapped his head, we covered him<br />
in coats and jackets and waited for the police and an ambulance<br />
to show up,” says Robert.<br />
It was all in a night’s work for Mac and Robert who, after seeing<br />
the man safely off to hospital, returned to work recharging the<br />
pipe and completing valve changes as part of the successful trial.<br />
Chief Operating Officer Raveen Jaduram says this is an example<br />
of the company’s focus on community well-being.<br />
“Our whole business is structured to ensure the well-being<br />
of Aucklanders – generally through the provision high-quality<br />
water and wastewater services,” says Raveen. “But it also<br />
permeates into our daily activities – so when two servicemen<br />
are on the job and they see a person in need, they are willing<br />
to help that person. We celebrate such efforts at <strong>Watercare</strong>.”<br />
“Our first thought was to get him out<br />
of the water and try to make him warm.”<br />
Health, safety and well-being<br />
Reticulation Servicemen Robert Potter (left) and Mac Taukiri.<br />
PAGE 35<br />
Return to Contents page
<strong>Watercare</strong> Services Limited<br />
<strong>2011</strong> ANNUAL REPORT<br />
Customer satisfaction<br />
Providing customers with great service and great value.<br />
Customer satisfaction<br />
PAGE 36<br />
Return to Contents page
<strong>Watercare</strong> Services Limited<br />
<strong>2011</strong> ANNUAL REPORT<br />
<strong>Watercare</strong> aims to provide outstanding and affordable services for all Aucklanders and our<br />
contact centre is the first place many people call when they are seeking information about our<br />
services or want to query a bill or report a problem. Our free-calling number is answered 24/7<br />
and we carefully measure and manage the service we offer. Our customer centre team answers<br />
up to 2,000 phone calls, emails and letters per day and we have seen significant improvement in<br />
performance since the retail service began on 1 November 2010. Further initiatives are planned to<br />
maintain this positive trend. <strong>Watercare</strong> benchmarks the size of its bills against average household<br />
incomes, because ensuring our prices are affordable is a key factor in satisfying our customers.<br />
Customer Advisor Jayme<br />
Letoa responds to a<br />
customer enquiry. The<br />
customer centre receives<br />
around 38,000 customer<br />
calls per month.<br />
Above: <strong>Watercare</strong> staff<br />
and family members hand<br />
out water to participants<br />
of Round the Bays in<br />
March <strong>2011</strong>.<br />
Overall score for<br />
the focus area<br />
92%<br />
100<br />
90<br />
80<br />
70<br />
60<br />
50<br />
40<br />
30<br />
20<br />
10<br />
See page 3<br />
PAGE 37<br />
Customer satisfaction<br />
Return to Contents page
<strong>Watercare</strong> Services Limited<br />
<strong>2011</strong> ANNUAL REPORT<br />
customer satisfaction<br />
4A. Percentage performance against target:<br />
customer satisfaction with contact centre.<br />
10 20 30 40 50 60 70 80 90 100<br />
<strong>2011</strong><br />
90% 7/10<br />
New Performance Measure<br />
Target<br />
<strong>Watercare</strong> achieved a 90% performance against the customer service target at its contact centre. Customers who contacted the centre to report faults<br />
were surveyed by independent researchers and gave the service an average score of 7.2 against a target of 8.<br />
4B. Percentage performance against target:<br />
grade of service.<br />
10 20 30 40 50 60 70 80 90 100<br />
<strong>2011</strong><br />
87% 7/10<br />
New Performance Measure<br />
Target<br />
Grade of service is an industry best-practice performance measure, aimed at ensuring calls are answered within 20 seconds. During the eight months from<br />
1 November 2010, the grade of service improved markedly and ended the year just below the target. Overall performance for the year was 87% of the target.<br />
4C. Percentage performance against Statement of Corporate Intent target:<br />
‘closed’ complaints and enquiries.<br />
10 20 30 40 50 60 70 80 90 100<br />
New Performance Measure<br />
Target<br />
<strong>2011</strong><br />
7/10<br />
90%<br />
The SCI target of ‘closed’ complaints and enquiries measures the time taken for an issue to be resolved and feedback given to the customer. A 10-day<br />
target is considered industry best practice. By the end of the eight-month period from 1 November 2010, the target was being achieved.<br />
4D. Percentage performance against Statement of Corporate Intent target:<br />
household affordability.<br />
10 20 30 40 50 60 70 80 90 100<br />
<strong>2011</strong><br />
100% 7/10<br />
New Performance Measure<br />
Target<br />
Under the SCI, <strong>Watercare</strong> undertakes to ensure that household water bills do not exceed 1.5% of the average household income in Auckland. For the eight<br />
months from 1 November 2010, bills represented 0.9% of average household income, which meant the target was met and the score of 100% achieved.<br />
<strong>2011</strong><br />
Overall percentage score: Customer satisfaction<br />
Contact: tlangridge@water.co.nz 92%<br />
Customer satisfaction<br />
PAGE 38<br />
Weblinks<br />
Customer satisfaction Fig. 29<br />
Grade of service Fig. 30<br />
Complaint types and response rates Fig. 31<br />
Household affordability Fig. 32<br />
Return to Contents page
<strong>Watercare</strong> Services Limited<br />
<strong>2011</strong> ANNUAL REPORT<br />
<strong>Watercare</strong><br />
at work<br />
Customer centre fields 300,000th call<br />
<strong>Watercare</strong>’s customer centre passed a major milestone in June<br />
<strong>2011</strong>, fielding its 300,000th call since it was established eight<br />
months earlier.<br />
“We had the basics in place, but could still do more to improve<br />
staff knowledge and skills to ensure we are providing services<br />
to customers more effectively.”<br />
The customer centre was created to manage both inbound and<br />
outbound calls plus customer-related correspondence items<br />
for around 430,000 households.<br />
Setting up the customer centre posed several challenges, not the<br />
least of which was educating new customer advisors on the six<br />
different charging mechanisms and service level agreements in<br />
place in the former local and district council areas – all of which<br />
had to be maintained as part of a seamless customer transition<br />
to <strong>Watercare</strong>.<br />
In its first two months of operation, the customer centre failed to<br />
meet its performance targets as large volumes of calls were received<br />
and systems were refined. However, performance has improved<br />
continuously since January and the centre is now consistently<br />
meeting or exceeding its targets.<br />
Chief Services Officer Trish Langridge attributes the improvement<br />
to initiatives focused on individual staff performance and policy<br />
changes, including the development of templated responses,<br />
the introduction of a single water tariff and the development<br />
of an online knowledge centre.<br />
Trish says that with the integration phase now behind them and<br />
performance tracking at consistently high levels, the customer<br />
centre is working on initiatives that will help deliver the best<br />
possible customer experience.<br />
“These improvement opportunities include participation in<br />
the development of a new hardship strategy to assist those<br />
customers who have difficulty paying for the services they<br />
receive from <strong>Watercare</strong>. This involves the establishment of<br />
an independent trust that will offer budgeting advice and<br />
assistance to these customers,” Trish says.<br />
The customer centre is working on initiatives<br />
that will help deliver the best possible<br />
customer experience.<br />
Customer satisfaction<br />
Customer Advisor Margaret Puni in the new customer centre in East Tamaki.<br />
PAGE 39<br />
Return to Contents page
<strong>Watercare</strong> Services Limited<br />
<strong>2011</strong> ANNUAL REPORT<br />
stakeholder relations<br />
To be responsive to stakeholder requirements.<br />
Stakeholder relations<br />
PAGE 40<br />
Return to Contents page
<strong>Watercare</strong> Services Limited<br />
<strong>2011</strong> ANNUAL REPORT<br />
<strong>Watercare</strong> has valuable, long-standing relationships with the communities that neighbour<br />
the company’s facilities. We engage with local people prior to undertaking project work on<br />
our infrastructure, work closely with our shareholder and local boards, and consult with a<br />
wide range of groups including tangata whenua directly, and with input from our specialist<br />
Maori and Environmental Advisory Groups. This year, nearly 7,000 school children took<br />
part in our Adopt A Stream water education programme, one of the many ways <strong>Watercare</strong><br />
engages with the local community. The Rain Forest Express, our narrow-gauge bush tramway<br />
that runs to the base of the Upper Nihotupu Dam in the Waitakere Ranges, remains popular<br />
with locals and visitors to Auckland.<br />
Auckland Mayor Len Brown and members of the<br />
Waitakere Ranges local board attended an event to<br />
commemorate the Waitakere Dam’s 100th year of<br />
operation in December 2010.<br />
Mayor Brown acknowledged <strong>Watercare</strong>’s ongoing role<br />
in maintaining and operating the dam – the oldest of<br />
five in the Waitakere Ranges. The western dams currently<br />
supply around 25 per cent of Auckland’s water.<br />
Above: Mayor Brown (right) pictured with Charles Brown<br />
who has been the caretaker at the dam since the 1980s.<br />
Overall score for<br />
the focus area<br />
93%<br />
100<br />
90<br />
80<br />
70<br />
60<br />
50<br />
40<br />
30<br />
20<br />
10<br />
See page 3<br />
PAGE 41<br />
Stakeholder relations<br />
Return to Contents page
<strong>Watercare</strong> Services Limited<br />
<strong>2011</strong> ANNUAL REPORT<br />
stakeholder relations<br />
5A. Percentage performance:<br />
engaged shareholder.<br />
<strong>2011</strong><br />
Participate in<br />
the council’s<br />
long-term<br />
planning<br />
processes,<br />
including the<br />
Auckland Plan<br />
Participate in<br />
policy initiatives<br />
Participate<br />
in statutory<br />
submissions<br />
Consult on the<br />
development<br />
of the Asset<br />
Management<br />
Plan<br />
Consult on the<br />
development<br />
of the Funding<br />
Plan<br />
Consult on the<br />
Statement of<br />
Corporate Intent<br />
(SCI)<br />
<strong>Report</strong><br />
performance to<br />
the council on a<br />
quarterly basis<br />
and as required<br />
Engage CCOs<br />
to identify<br />
opportunities for<br />
joint initiatives<br />
Engage local<br />
boards on<br />
<strong>Watercare</strong>’s<br />
projects and<br />
decisions<br />
Iwi Statutory<br />
Board and<br />
council advisory<br />
groups engaged<br />
in projects and<br />
decisions<br />
85%<br />
new Performance Measure<br />
<strong>Watercare</strong> engaged its shareholder, Auckland Council, on the development of key planning documents: contributing to the council’s Auckland Plan and<br />
consulting on <strong>Watercare</strong>’s Asset Management Plan, Funding Plan and Statement of Corporate Intent.<br />
With the appointment of a Principal Advisor Local Boards in May <strong>2011</strong>, the company strengthened its working relationships with the local boards<br />
– keeping them informed of projects and decisions that affect their communities.<br />
The company continues to be an active participant in the development of relevant legislation and policy initiatives. <strong>Watercare</strong> made submissions on the:<br />
- Ministry of Environment’s discussion document Building Competitive Cities<br />
- Marine and Coastal Area Bill<br />
- Proposed Waikato Regional Policy Statement<br />
- Building Act Amendment Bill.<br />
<strong>Watercare</strong> gave Auckland Council advice on water supply and wastewater issues related to proposed plan changes. The company is also an active member<br />
of the Land and Water Forum.<br />
5B. Percentage performance:<br />
engaged communities.<br />
Informed<br />
communities<br />
of projects in<br />
their areas<br />
Engaged<br />
<strong>Watercare</strong>’s<br />
Maori and<br />
environmental<br />
advisory groups<br />
on projects and<br />
decisions<br />
Provided access<br />
to <strong>Watercare</strong><br />
facilities: Rain<br />
Forest Express<br />
and walkways<br />
Delivered an<br />
education<br />
programme:<br />
Adopt A Stream<br />
Engaged the<br />
public in council<br />
feedback on<br />
the SCI<br />
Engaged<br />
with media<br />
Invited the<br />
public to attend<br />
board meetings<br />
and published<br />
papers on the<br />
website<br />
Published<br />
dam level,<br />
consumption<br />
and energy<br />
information<br />
Sponsored<br />
the <strong>Watercare</strong><br />
Harbour<br />
Clean-Up Trust<br />
Engaged tangata<br />
whenua and<br />
developed<br />
relationship<br />
agreements<br />
as appropriate<br />
<strong>2011</strong><br />
95% 7/10<br />
new Performance Measure<br />
Since integration, the number of projects affecting local communities has grown significantly. The company has been engaging with these communities<br />
face to face and through letters, the website and street signage.<br />
<strong>Watercare</strong> runs an education programme – Adopt A Stream – which offers primary and intermediate school children lessons about water quality, the water<br />
cycle, conservation and the environment. In 2010/11, 6,988 pupils participated. <strong>Watercare</strong> also operates the Rain Forest Express, a narrow-gauge railway<br />
built to service the Upper Nihotupu Dam around 1912. The line, which is still used for dam maintenance, has carried more than 150,000 passengers<br />
since it was opened to the public in 1998 and is a popular attraction for tourists and locals.<br />
<strong>Watercare</strong> engaged fully with the media throughout the year. At the time of the Onehunga explosion (see page 14), it held media conferences to ensure<br />
the public received full and timely disclosure of information.<br />
The company continued to sponsor the <strong>Watercare</strong> Harbour Clean-Up Trust. Since the Trust was established in 2002, over 2.5 million litres of litter has<br />
been removed from Auckland’s harbours and waterways.<br />
5C. Percentage performance:<br />
legal compliance.<br />
Compliance risk<br />
assessment<br />
Compliance<br />
monitoring<br />
Compliance<br />
comparative<br />
performance<br />
Compliance<br />
management<br />
plan<br />
Compliance<br />
assurance<br />
No successful<br />
prosecutions<br />
against<br />
<strong>Watercare</strong><br />
All potential legal<br />
issues identified<br />
All legal issues<br />
effectively<br />
managed<br />
All legal issues<br />
managed and<br />
resolved<br />
No known<br />
pending legal<br />
issues<br />
<strong>2011</strong><br />
100% 7/10<br />
Stakeholder relations<br />
PAGE 42<br />
new Performance Measure<br />
<strong>Watercare</strong> has many statutory obligations under a number of Acts and invests a considerable amount of resources in complying with and monitoring statutory<br />
requirements. Technical non-compliance with resource consents relating to the inherited non-metropolitan wastewater treatment plants are reported under<br />
Ruler 2A on page 28. In all other respects, the company achieved compliance with all statutory obligations specified in the relevant Acts during the past year.<br />
<strong>2011</strong><br />
Overall percentage score: Stakeholder relations<br />
Contact: cnelson@water.co.nz 93%<br />
Return to Contents page
<strong>Watercare</strong> Services Limited<br />
<strong>2011</strong> ANNUAL REPORT<br />
<strong>Watercare</strong><br />
at work<br />
Adopt A Stream delivered to nearly 7,000 students<br />
This year, 6,988 students from 43 schools and two kindergartens<br />
participated in <strong>Watercare</strong>’s Adopt A Stream education programme.<br />
<strong>Watercare</strong>’s education programme was created in 2001 in an effort<br />
to provide Auckland schools with a science programme that taught<br />
students the fundamentals of the water cycle and how water<br />
quality and ecology directly affect their lives.<br />
Education Co-ordinator Sally Smith says the programme is<br />
becoming increasingly popular, to the point where she taught<br />
over 1,000 students in May alone:<br />
“There’s been so much demand for the programme recently that<br />
teachers have started to book a year in advance. In fact, my diary<br />
for term one in 2012 is almost full already.”<br />
Sally says that while trying to meet the ever-increasing demand,<br />
she’s also looking at ways the programme can keep improving:<br />
“I’m in the process of developing a new unit on dams and<br />
producing a book titled Water for Life, which I hope we can<br />
roll out in the near future.”<br />
In addition to school visits, the programme comes with 10 practical<br />
lessons, posters and a number of cross-curricular resources. Sally<br />
has also introduced stormwater, drinking water and wastewater<br />
lessons as well as a library display.<br />
Main image: Year 5 pupils at Willow Park Primary School in Hillcrest on Auckland’s North Shore<br />
discovered how water is treated during a hands-on lesson with Education Co-ordinator Sally Smith.<br />
Inset: Many pupils experience the Waitakere Ranges aboard the Rain Forest Express.<br />
A number of schools that participate in the Adopt A Stream<br />
programme also choose to ride <strong>Watercare</strong>’s Rain Forest Express.<br />
The narrow-gauge railway is situated in the Waitakere Ranges,<br />
one of <strong>Watercare</strong>’s two largest catchments for drinking water. The<br />
schools combine the field trip to the Upper Nihotupu Dam, where<br />
the railway is located, with their water-based lessons.<br />
Sally says: “It’s great for the students to be able to visit and learn<br />
about the dams and the environment. It really helps bring their<br />
classroom-based lessons to life.”<br />
Weblinks<br />
Community impact of operations Fig. 33<br />
Public policy participation Fig. 34<br />
Rain Forest Express passengers and trips Fig. 35<br />
Adopt A Stream Fig. 36<br />
Stakeholder relations<br />
PAGE 43<br />
Return to Contents page
<strong>Watercare</strong> Services Limited<br />
<strong>2011</strong> ANNUAL REPORT<br />
sustainable environment<br />
To minimise and/or mitigate the adverse impact of the company’s<br />
operations on the environment.<br />
Sustainable environment<br />
PAGE 44<br />
Return to Contents page
<strong>Watercare</strong> Services Limited<br />
<strong>2011</strong> ANNUAL REPORT<br />
<strong>Watercare</strong> is committed to being a good corporate citizen, providing cost-effective services<br />
that balance the social, cultural, economic and environmental impacts of its decisions.<br />
As <strong>Watercare</strong> is the company responsible for delivering high-quality water and wastewater<br />
services to the people of Auckland, it is recognised that these services contribute<br />
significantly to the health and well-being of our natural environment which includes<br />
our local communities.<br />
<strong>Watercare</strong> is rehabilitating a former oxidation pond,<br />
adjacent to the Mangere Wastewater Treatment Plant,<br />
with treated biosolids. Set to become a public open space,<br />
the rehabilitation includes the planting of several native<br />
species such as pohutukawa, kowhai, cabbage trees and oioi.<br />
These plants have been rapidly colonised by native insects<br />
and birds and a coastal flaxland forest is developing.<br />
Above: Dabchicks in the Manukau Harbour. The harbour<br />
is home to more than 20 per cent of New Zealand’s wading<br />
bird population, with another 60 per cent using the harbour<br />
during migration.<br />
Overall score for<br />
the focus area<br />
85%<br />
100<br />
90<br />
80<br />
70<br />
60<br />
50<br />
40<br />
30<br />
20<br />
10<br />
See page 3<br />
PAGE 45<br />
Sustainable environment<br />
Return to Contents page
<strong>Watercare</strong> Services Limited<br />
<strong>2011</strong> ANNUAL REPORT<br />
Sustainable environment<br />
6A. Percentage performance:<br />
atmospheric CO 2<br />
emissions.<br />
10 20 30 40 50 60 70 80 90 100<br />
<strong>2011</strong><br />
75% 7/10<br />
Target 75% reduction on 1990 levels<br />
2007 2008 2009 2010<br />
85 85 85 85<br />
<strong>Watercare</strong> calculates its greenhouse gas emissions, including carbon dioxide (CO 2<br />
), methane and nitrous oxide that are largely generated from<br />
% % % %<br />
the treatment of wastewater. This year the company achieved a 75% reduction on the greenhouse gas levels emitted in 1990, which is the company’s<br />
historic benchmark for performance in this area. This result appears lower than in previous years because <strong>Watercare</strong> is now running additional wastewater plants.<br />
6B. Percentage performance against target:<br />
internally sourced energy.<br />
10 20 30 40 50 60 70 80 90 100<br />
<strong>2011</strong><br />
7/10 91%<br />
New Performance Measure<br />
Target 35% of energy used<br />
<strong>Watercare</strong> aims to source 35% of all its energy requirements from internal sources, principally biogas reuse at its two largest wastewater plants, Mangere and<br />
Rosedale, and from five hydro-electric generators within the water supply system. This year, <strong>Watercare</strong> sourced 32% of its energy, achieving 91% of its target.<br />
6C. Percentage performance: recycling.<br />
Percentage of potential general waste material recycled<br />
10 20 30 40 50 60 70 80 90 100<br />
Staff volunteer for a zero-waste recycling programme and each year the company measures the amount of general waste that was recycled<br />
rather than going to landfill. This year it was estimated that 70% of company waste with the potential for reuse was separated for recycling.<br />
Target<br />
<strong>2011</strong><br />
70% 7/10<br />
2007 2008 2009 2010<br />
65 75 75 70<br />
% % % %<br />
6D. Percentage performance against target: waste management.<br />
Solid waste diverted from landfills<br />
10 20 30 40 50 60 70 80 90 100<br />
<strong>2011</strong><br />
80% 7/10<br />
New Performance Measure<br />
Target<br />
<strong>Watercare</strong> operates a programme to recover valuable metals and nutrients that could be reused in the future and to divert as much solid waste<br />
as possible to purpose-built rehabilitation projects rather than send this waste to commercial landfills. This programme has been extended to the wastewater<br />
treatment plants transferred to <strong>Watercare</strong> on 1 November 2010. For 2010/11, <strong>Watercare</strong> diverted from landfills 80% of solid waste generated from the<br />
treatment of wastewater. Over time it is planned to lift performance to 100%.<br />
6E. Percentage performance:<br />
species preservation.<br />
Sustainable environment<br />
PAGE 46<br />
Bird-roost<br />
management<br />
plan<br />
Bird populations<br />
monitored<br />
Adequate bird<br />
roost capacity<br />
Macroinvertebrate<br />
monitoring<br />
Trout<br />
management<br />
plan<br />
Flushing flow<br />
release –<br />
southern dams<br />
Fish trap and<br />
haul –<br />
southern dams<br />
Fish trap and<br />
haul –<br />
western dams<br />
Fish passages<br />
over weirs -–<br />
southern dams<br />
Flushing flow<br />
release –<br />
western dams<br />
<strong>2011</strong><br />
100% 7/10<br />
2007 2008 2009 2010<br />
75 80 90 100<br />
% % % %<br />
<strong>Watercare</strong> carefully manages the discharges from its dams to ensure the downstream ecosystems have sufficient water flow. Compensation and<br />
free-discharge valves have been installed on all the dams which allow the release of a continuous flow of water downstream and to simulate floods and reduce<br />
algae build-up in the streams. To ensure that migration paths of native fish species are not interrupted by the dams, <strong>Watercare</strong> operates a trap and haul programme for both<br />
fish and eels. Whitebait (juvenile galaxiid species) and elvers (juvenile eels) are trapped in downstream river systems and transferred to upstream of the dam. Adult migrating<br />
eels, generally between 15 and 40 years old, are caught from within the dams and transferred to suitable locations downstream to complete their breeding cycle in the sea.<br />
Weblinks<br />
Greenhouse gas emissions Fig. 37<br />
Initiatives to reduce greenhouse gas emissions Fig. 38<br />
Source of emissions Fig. 39<br />
<strong>Watercare</strong>’s ecological footprint Fig. 40<br />
Return to Contents page
<strong>Watercare</strong> Services Limited<br />
<strong>2011</strong> ANNUAL REPORT<br />
6F. Percentage performance:<br />
habitat improvement.<br />
<strong>2011</strong><br />
Rural: Trees<br />
For Survival<br />
sponsorship<br />
Freshwater:<br />
downstream<br />
water quality<br />
monitoring –<br />
southern dams<br />
Freshwater:<br />
residual flows<br />
maintained –<br />
southern dams<br />
Freshwater:<br />
downstream<br />
water quality<br />
monitoring –<br />
western dams<br />
Increase in<br />
marine diversity<br />
Coastal: projects<br />
complete<br />
Freshwater:<br />
riparian planting<br />
programme –<br />
southern dams<br />
Urban:<br />
restoration<br />
projects planned<br />
(Meola Creek)<br />
Freshwater:<br />
residual flows<br />
implemented –<br />
western dams<br />
Urban:<br />
restoration<br />
projects<br />
Puketutu Island<br />
90%<br />
2007 2008 2009 2010<br />
75 80 85 90<br />
% % % %<br />
<strong>Watercare</strong> added an additional 5.7ha of bird roosts at the Mangere Wastewater Treatment Plant this year. The plant staff work closely with the Ambury Regional Park<br />
rangers to control pests at the bird roosts, which are home to up to 30 species of birds, including the endangered New Zealand dotterel. <strong>Watercare</strong> has continued to support<br />
the Trees for Survival programme, which helps the Ararimu, Ardmore and Hunua schools to plant trees to help prevent erosion, provide habitats for native birds, improve water<br />
quality and remove carbon from the atmosphere. Future initiatives include habitat restoration on Puketutu Island, adjacent to the Mangere Wastewater Treatment Plant.<br />
6G. Performance: midge complaints at wastewater treatment plants.<br />
Number of midge complaints<br />
45 40 35 30 25 20 15 10 5 0<br />
<strong>Watercare</strong> operates a year-round monitoring and management programme that focuses on controlling midge breeding grounds around its wastewater<br />
treatment plants and on reducing midge breeding grounds in the community, largely through public awareness initiatives. Effective response continues<br />
to be required particularly when warm, wet weather creates conditions in which midges thrive. While the Mangere plant continued to achieve low levels<br />
of midge complaints, results at other plants were significant.<br />
Target<br />
<strong>2011</strong><br />
70% 7/10<br />
2007 2008 2009 2010<br />
70 95 100 100<br />
% % % %<br />
6H. Performance: odour complaints at wastewater treatment plants.<br />
Number of verified odour complaints<br />
90 80 70 60 50 40 30 20 10 0<br />
<strong>2011</strong><br />
90% 7/10<br />
Target 2007 2008 2009 2010<br />
95 75 60 85<br />
Odour control measures continue to be an important focus at the wastewater treatment plants and include the use of covers and odour filter beds % % % %<br />
as well as stationary and mobile deodoriser spraying units. <strong>Watercare</strong> undertakes periodic plant boundary odour surveys that involve an independent<br />
‘odour scout’ to investigate and report any odour detection. For 2010/11, there were three verified odour complaints at Mangere and seven<br />
at non-metropolitan plants. All complaints were responded to in a timely manner and a 90% performance against the target was achieved.<br />
6I. Percentage performance:<br />
compliance of trade waste customers.<br />
10 20 30 40 50 60 70 80 90 100<br />
<strong>2011</strong><br />
99% 7/10<br />
<strong>Watercare</strong> aims to work with its customers to ensure a 100% compliance level with trade waste by-laws. Since 1 November 2010, the number<br />
of trade waste customers has increased from 580 to 1,740. Despite the increase, there was a 99% level of compliance, an improvement on previous<br />
years’ results.<br />
Target<br />
2007 2008 2009 2010<br />
95 95 96 97<br />
% % % %<br />
<strong>2011</strong><br />
Overall percentage score: Sustainable environment<br />
Contact: rjaduram@water.co.nz 85%<br />
Weblinks<br />
Internal energy usage Fig. 41<br />
Recycling of general waste Fig. 42<br />
Biosolids metal levels Fig. 43<br />
Solids disposal Fig. 44<br />
Weight of hazardous substances in waste Fig. 45<br />
Sustainable environment<br />
PAGE 47<br />
Return to Contents page
<strong>Watercare</strong> Services Limited<br />
<strong>2011</strong> ANNUAL REPORT<br />
PAGE 48<br />
Mangere Wastewater<br />
Treatment Plant celebrated<br />
50 years of operation in<br />
November 2010.<br />
The state-of-the-art<br />
land-based facility has<br />
undergone extensive<br />
upgrades in the past<br />
decade to meet the<br />
needs of a growing<br />
population and to improve<br />
environmental outcomes.<br />
Return to contents Contents page
<strong>Watercare</strong> Services Limited<br />
<strong>2011</strong> ANNUAL REPORT<br />
<strong>Watercare</strong><br />
at work<br />
Zero Waste<br />
Employees have reduced the volume of refuse they send to<br />
landfill by two-thirds since <strong>Watercare</strong> introduced its Zero<br />
Waste programme in 2003.<br />
Security Manager Alan Foubister, who chairs the Zero Waste<br />
Committee, says currently the volume of refuse produced by<br />
each staff member each week is only 0.5 kilograms on average<br />
– compared with 1.5 kilograms in 2003.<br />
“Our approach has been one of continuous improvement since<br />
inception,” explains Alan. “Along the way we have made gains<br />
through the introduction of such initiatives as worm farms and<br />
colour-coded recycling and rubbish bins.”<br />
For Alan and the committee, the challenge over the past 10<br />
months has been to roll the programme out across a much<br />
larger organisation.<br />
and wastewater services direct to over one million people in<br />
Auckland,” says Alan.<br />
“From the committee’s perspective, our focus has been to keep<br />
Zero Waste in the spotlight – to make sure the recycling and<br />
worm farm initiatives become routine in the new offices.<br />
“To date, feedback from new staff is that they are keen to<br />
participate in and grow the programme. As with anything, there<br />
is room for improvement, but we’re off to a good start.”<br />
“Our approach has been one of<br />
continuous improvement since inception.”<br />
“In November 2010, <strong>Watercare</strong>’s staff and office base grew<br />
significantly when it became responsible for retailing water<br />
Security Manager Alan Foubister checks the health<br />
of the worm farm at head office in Newmarket.<br />
Weblinks<br />
Protected areas of high ecological value Fig. 46<br />
Significant biodiversity impacts Fig. 47<br />
Midge and odour complaints Fig. 48<br />
Trade waste customers Fig. 49<br />
Trade waste sampling programme Fig. 50<br />
Key trade waste substances Fig. 51<br />
Materials and chemicals Fig. 52<br />
Sustainable environment<br />
PAGE 49<br />
Return to Contents page
<strong>Watercare</strong> Services Limited<br />
<strong>2011</strong> ANNUAL REPORT<br />
effective asset management<br />
Managing assets to ensure the use of existing assets is maximised while<br />
optimising the scope, timing and cost of new investments.<br />
Effective asset management<br />
PAGE 50<br />
Return to Contents page
<strong>Watercare</strong> Services Limited<br />
<strong>2011</strong> ANNUAL REPORT<br />
<strong>Watercare</strong> aims to operate, maintain, replace and develop assets over the long term to meet<br />
required service levels and foreseeable future needs. The key drivers for asset planning<br />
decisions relate to growth, renewal and levels of service. <strong>Watercare</strong> must also give effect<br />
to relevant aspects of Auckland Council’s Long Term Plan. <strong>Watercare</strong> is currently working<br />
to develop a new Asset Management Plan that considers the water and wastewater needs<br />
and priorities for the Auckland region. While the December 2010 plan covered one year as<br />
<strong>Watercare</strong> sought to better understand the assets transferred during integration, the future<br />
plan will cover a 20-year horizon.<br />
Progress is made on a new wastewater<br />
storage tank being built in Henderson.<br />
The tank, which will have a 13-millionlitre<br />
capacity, will provide for growth<br />
and reduce the frequency and volume<br />
of wastewater overflows into the<br />
Waitemata Harbour.<br />
Above: Projects Manager David Shepherd<br />
(left) and Projects and Programmes<br />
Manager Tim Munro (right) assess progress<br />
on the new wastewater storage tank.<br />
Overall score for<br />
the focus area<br />
93%<br />
100<br />
90<br />
80<br />
70<br />
60<br />
50<br />
40<br />
30<br />
20<br />
10<br />
See page 3<br />
PAGE 51<br />
Effective asset management<br />
Return to Contents page
<strong>Watercare</strong> Services Limited<br />
<strong>2011</strong> ANNUAL REPORT<br />
effective asset management<br />
7A. Percentage performance against target:<br />
capital expenditure.<br />
10 20 30 40 50 60 70 80 90 100<br />
<strong>2011</strong><br />
100% 7/10<br />
new Performance Measure<br />
Target<br />
Generally, <strong>Watercare</strong> sets out to achieve its planned level of capital expenditure to ensure the assets are able to meet future requirements. The company<br />
targets a capital expenditure level during the year that is within 20% of the budget. For 2010/11, actual capital expenditure was within 2% of budget.<br />
7B. Percentage performance:<br />
demand management.<br />
<strong>2011</strong><br />
Prepare Regional<br />
Water Demand<br />
Management<br />
Plan<br />
Agree regional<br />
water demandmanagement<br />
target<br />
Achieve progress<br />
targets<br />
Future supply<br />
planning<br />
balances<br />
cost-beneficial<br />
efficiency<br />
options<br />
Water-loss<br />
strategies and<br />
management<br />
approaches<br />
developed<br />
Understand<br />
customer water<br />
use patterns<br />
Work with large<br />
water users to<br />
reduce demand<br />
Promote<br />
water-efficient<br />
devices and<br />
communicate<br />
water-efficient<br />
messages<br />
Work with<br />
Auckland Council<br />
to reduce<br />
water use<br />
Undertake trials<br />
and pilot studies<br />
to improve water<br />
efficiency<br />
75%<br />
new Performance Measure<br />
Future asset requirements are largely driven by demand for water. By developing and implementing demand-management programmes, <strong>Watercare</strong> aims to reduce<br />
or delay future capital expenditure. During the year, the company developed, in conjunction with its stakeholders, a comprehensive Regional Water<br />
Demand Management Plan in which it set a target of 15% reduction in demand by 2025. A copy of this plan is on the company website under ‘Publications’.<br />
7C. Percentage performance: maintenance management systems<br />
(wholesale business only).<br />
All assets<br />
recorded in<br />
asset register<br />
Assets register<br />
computerised<br />
and available<br />
to staff<br />
Asset financial<br />
information<br />
recorded<br />
Key assets<br />
have assigned<br />
maintenance<br />
programmes<br />
Maintenance<br />
programmes<br />
recorded in<br />
asset register<br />
Maintenance<br />
programme<br />
based on<br />
criticality<br />
Maintenance<br />
undertaken<br />
according<br />
to plan<br />
Maintenance<br />
history recorded<br />
for key assets<br />
Consistent<br />
maintenance<br />
practices<br />
company-wide<br />
Maintenance<br />
programme<br />
prioritised<br />
using RCM<br />
<strong>2011</strong><br />
100% 7/10<br />
2007 2008 2009 2010<br />
95 95 100 100<br />
% % % %<br />
<strong>Watercare</strong>’s maintenance management team continues to improve plant performance, extend the life of assets and minimise operating costs. These practices are being<br />
extended to incorporate the assets acquired during the year where appropriate. The above measures apply only to the assets that were part of the wholesale business.<br />
7D. Percentage performance: maintenance optimisation development<br />
(wholesale business only).<br />
Develop<br />
maintenance<br />
philosophy<br />
Develop<br />
action plan<br />
Develop<br />
maintenance<br />
vision and<br />
strategy<br />
Implement<br />
maintenance<br />
vision and<br />
strategy<br />
Establish<br />
workflow<br />
management<br />
Implement<br />
workflow<br />
management<br />
Evaluate<br />
effectiveness<br />
with key<br />
performance<br />
indicators<br />
50% of RCM<br />
strategy<br />
implemented<br />
100% of<br />
RCM strategy<br />
implemented<br />
Computerised<br />
maintenancemanagement<br />
system<br />
<strong>2011</strong><br />
95% 7/10<br />
2007 2008 2009 2010<br />
80 85 90 90<br />
% % % %<br />
As part of the asset-management programme, reliability-centred maintenance (RCM) has been implemented in the wholesale business over some years.<br />
This programme is being used to assist maintenance programmes across the larger entity and the programme is now at 95% of the target level.<br />
Effective asset management<br />
<strong>2011</strong><br />
Overall percentage score: Effective asset management<br />
Contact: gwood@water.co.nz 93%<br />
PAGE 52<br />
Weblinks<br />
Capital expenditure programme Fig. 53<br />
Infrastructure provided for public benefit Fig. 54<br />
Return to Contents page
<strong>Watercare</strong> Services Limited<br />
<strong>2011</strong> ANNUAL REPORT<br />
<strong>Watercare</strong><br />
at work<br />
Ambitious demand-management plan takes shape<br />
<strong>Watercare</strong> is implementing an ambitious water demandmanagement<br />
plan that aims to reduce gross per capita<br />
consumption by 15 per cent by 2025.<br />
Adopted in June <strong>2011</strong>, the plan brings together previous reviews<br />
and demand-management approaches used in Auckland and<br />
other parts of New Zealand, as well as best practice from overseas.<br />
“It involves reinforcing positive messages about water use<br />
as part of our existing Adopt A Stream education programme<br />
– which thousands of pupils participate in each year.<br />
“We plan to work with the Ministry of Education and schools<br />
to help them reduce the volume of water used for things such<br />
as irrigation and toilet flushing, as well as to detect leaks.”<br />
Water Resources Manager Dr Deborah Lind says the total<br />
demand for water in Auckland continues to increase as a result of<br />
population growth.<br />
“While individual consumption has reduced significantly over the<br />
last 30 years, the overall demand for water has increased as our<br />
population has doubled.<br />
“Managing our water demand will not offset the entire impact of<br />
population growth. However, we do expect it will help to defer the<br />
need for new water sources and related infrastructure. This will<br />
assist in reducing our costs and keeping water prices low, while<br />
also reducing impacts on the environment.”<br />
The plan features a ‘tool box’ of initiatives covering the six Es<br />
of water efficiency and demand-management approaches:<br />
engage, educate, encourage, engineer, enact and economic.<br />
Deborah explains that working with schools is one of the<br />
initiatives:<br />
<strong>Watercare</strong> also plans to continue working with Housing<br />
New Zealand, which owns 30,000 homes in Auckland,<br />
to ensure water-efficient appliances are included as part of<br />
refurbishment work, and to ensure leaks are detected and<br />
repaired in a timely manner.<br />
Other approaches include minimising leaks in the network and<br />
water used for operational purposes, and working with Auckland<br />
Council to find ways to reduce its demand for water.<br />
“Managing our water demand will not offset<br />
the entire impact of population growth. However,<br />
we do expect it will help to defer the need for<br />
new water sources and related infrastructure.”<br />
Effective asset management<br />
Data Technician Sarah Muir and Water Resources Manager Dr Deborah Lind<br />
look at rain level data for Lower Nihotupu Dam.<br />
PAGE 53<br />
Return to Contents page
<strong>Watercare</strong> Services Limited<br />
<strong>2011</strong> ANNUAL REPORT<br />
sound financial management<br />
Management of the company to meet business objectives<br />
at the lowest cost.<br />
Sound financial management<br />
PAGE 54<br />
Return to Contents page
<strong>Watercare</strong> Services Limited<br />
<strong>2011</strong> ANNUAL REPORT<br />
By law, <strong>Watercare</strong> is required to manage its operations efficiently with a view to keeping the<br />
overall costs of water supply and wastewater services to its customers at minimum levels.<br />
The company does not operate to make a profit and it is prohibited by statute from paying<br />
a dividend to its owner, Auckland Council. Efficiencies generated through the establishment<br />
of a single water company have seen retail prices fall, and 1,000 litres of mains-connected water<br />
now costs $1.30 anywhere in Auckland. <strong>Watercare</strong> continues to strive for efficiency gains in all<br />
aspects of its business while ensuring reliable services continue to be delivered to customers.<br />
Jayne Cayo from<br />
Solution Dynamics,<br />
<strong>Watercare</strong>’s<br />
mailhouse, checks<br />
the first bill run in<br />
November 2010 .<br />
Above: Customer<br />
Advisor Michael Viliua.<br />
Overall score for<br />
the focus area<br />
99%<br />
100<br />
90<br />
80<br />
70<br />
60<br />
50<br />
40<br />
30<br />
20<br />
10<br />
See page 3<br />
PAGE 55<br />
Sound financial management<br />
Return to Contents page
<strong>Watercare</strong> Services Limited<br />
<strong>2011</strong> ANNUAL REPORT<br />
sound financial management<br />
8A. Performance against Statement of Corporate Intent target: FFO ratio.<br />
Funds generated from operations (FFO) as ratio of interest cost<br />
2.05 2.10 2.15 2.20 2.25 2.30 2.35 2.40 2.45 2.50<br />
The extent to which <strong>Watercare</strong> covers its interest costs is a vital measure of its financial performance. Under the SCI, <strong>Watercare</strong> undertakes to maintain<br />
the ratio of funds generated from the business at a level of at least 2.5 times the cost of interest. The company achieved this target in 2010/11 with<br />
an FFO ratio of 3.3.<br />
Target ≥2.5<br />
<strong>2011</strong><br />
100% 7/10<br />
2007 2008 2009 2010<br />
100 40 100 100<br />
% % % %<br />
8B. Percentage performance:<br />
savings through efficient procurement.<br />
<strong>2011</strong><br />
Establish spend<br />
categories for<br />
benchmarking<br />
and reporting<br />
Develop and<br />
implement a<br />
category<br />
review plan<br />
Develop<br />
procurement<br />
systems for<br />
market review<br />
Implement<br />
process for<br />
reviewing and<br />
monitoring<br />
preferred<br />
suppliers<br />
Achieve savings<br />
of 0.5% of<br />
operating<br />
expenditure<br />
Adopt a<br />
procurement<br />
policy for use<br />
of preferred<br />
suppliers<br />
Achieve<br />
savings of 1%<br />
of operating<br />
expenditure<br />
Achieve savings<br />
of 1.5% of<br />
operating<br />
expenditure<br />
Achieve<br />
savings of 2%<br />
of operating<br />
expenditure<br />
Implement<br />
procurement<br />
planning process<br />
95%<br />
2007 2008 2009 2010<br />
55 65 90 95<br />
% % % %<br />
On integration, 367 supply contracts transferred to <strong>Watercare</strong>. Considerable consolidation of suppliers has been achieved resulting in immediate savings.<br />
Other significant savings were achieved in IT and chemical categories. In total, savings of $3.6 million were realised in 2010/11.<br />
8C. Performance against target:<br />
interest rate percentage.<br />
8.1 7.9 7.7 7.5 7.3 7.1 6.9 6.7 6.5 6.3<br />
Treasury Benchmark = 6.29%<br />
Interest on debt is a significant cost for <strong>Watercare</strong> and is closely monitored. The company sets an annual target to achieve a lower average<br />
interest rate than the Treasury Benchmark rate. For 2010/11, <strong>Watercare</strong> achieved an average interest rate of 5.95% which was less than the<br />
Treasury Benchmark of 6.29%.<br />
<strong>2011</strong><br />
100% 7/10<br />
2007 2008 2009 2010<br />
100 100 90 50<br />
% % % %<br />
8D. Performance: actual operating expense.<br />
Percentage against budget<br />
4 3 2 1 0 -1 -2 -3 -4 -5<br />
<strong>2011</strong><br />
100% 7/10<br />
<strong>Watercare</strong> is required to minimise operating costs and seeks to achieve actual operating expenses of at least 5% below budget. For 2010/11,<br />
the company achieved an actual operating expense that was 6% below budget as a result of labour cost savings, reprioritised maintenance<br />
and lower other costs including professional fees.<br />
Target<br />
2007 2008 2009 2010<br />
85 75 75 95<br />
% % % %<br />
Sound financial management<br />
PAGE 56<br />
<strong>2011</strong><br />
Overall percentage score: Sound financial management<br />
Contact: bmonk@water.co.nz 99%<br />
Weblinks<br />
Major suppliers and contractors Fig. 55<br />
Suppliers by spend and industry Fig. 56<br />
Interest rate performance Fig. 57<br />
Ethics and business integrity Fig. 58<br />
Product information disclosure Fig. 59<br />
Product life cycle, health and safety impact assessment Fig. 60<br />
Financial implications of climate change Fig. 61<br />
Return to Contents page
<strong>Watercare</strong> Services Limited<br />
<strong>2011</strong> ANNUAL REPORT<br />
<strong>Watercare</strong><br />
at work<br />
Significant upgrades to information systems software<br />
Last year marked two important milestones in <strong>Watercare</strong>’s journey<br />
to supporting more effective and secure information systems, with<br />
the successful roll-out of new Hansen and SAP Enterprise Asset<br />
Management Solution software.<br />
The November roll-out of Hansen involved building the technology<br />
and information base for <strong>Watercare</strong> to run its new customer<br />
business. It included transferring all of the local network operators’<br />
(LNO) data to <strong>Watercare</strong>, as Chief Information Officer Jim Swanson<br />
explains: “This data covered everything from the two-million-odd<br />
assets we inherited – pipes, manholes, vehicles – to all customer<br />
billing information.”<br />
SAP supports a number of major business functions for <strong>Watercare</strong>,<br />
including finance and management accounting, CAPEX and OPEX<br />
and project management.<br />
Jim says SAP has many benefits, including a more integrated<br />
process – capturing data once and making it available to all<br />
relevant people and processes, and improved reporting and<br />
tracking of performance:<br />
“This puts us in a strong position for moving forward as it provides<br />
us with systems which can grow with the business to meet our<br />
current and future needs.”<br />
The Hansen project was challenging as the new platform has to<br />
support six different LNO business models, with each LNO having<br />
different billing cycles, tariffs and maintenance service levels.<br />
In June, the new SAP Enterprise Asset Management Solution also<br />
went live, replacing the old Mozaic, Avantis and PRS systems.<br />
“The upgrade was vital as it enabled us to retire superseded<br />
software and eliminate the associated risk of our reliance on an<br />
old, inadequately supported system.”<br />
“This data covered everything from the<br />
two-million-odd assets we inherited – pipes,<br />
manholes, vehicles – to all customer billing<br />
information.”<br />
Sound financial management<br />
Chief Information Officer Jim Swanson (left) discusses the impact of the SAP Enterprise Asset Management<br />
Solution software on the procurement process with Procurement Manager Stuart Bird.<br />
PAGE 57<br />
Return to Contents page
<strong>Watercare</strong> Services Limited<br />
<strong>2011</strong> ANNUAL REPORT<br />
Environmental<br />
Resources<br />
Management<br />
ERM Independent Assurance <strong>Report</strong> to <strong>Watercare</strong> Services Limited<br />
ERM New Zealand Limited (ERM) was engaged by <strong>Watercare</strong> Services Limited (<strong>Watercare</strong>) to provide independent assurance of non-financial data within <strong>Watercare</strong>’s <strong>2011</strong> <strong>Annual</strong><br />
<strong>Report</strong>, to the scope of work outlined below.<br />
Scope of Work<br />
This assurance statement is intended for <strong>Watercare</strong>’s stakeholders. The <strong>2011</strong> <strong>Annual</strong> <strong>Report</strong> covers <strong>Watercare</strong>’s operations for the 12 months from 1 July 2010 to 30 June <strong>2011</strong>,<br />
unless stated otherwise in the text. For example, changes in scope and responsibility following the Auckland water industry amalgamation in November 2010, is such that certain<br />
performance rulers only report data for the 8 month period following the amalgamation. This work was performed in accordance with ERM’s assurance methodology, which is based<br />
on the international standards ISAE 3000, AA1000 Assurance Standard (2008) and ISO 19011. ERM reviewed <strong>Watercare</strong>’s performance reporting for the subject matter specified<br />
below. The criteria used were the AA1000AS (2008) Principles of Inclusivity, Materiality and Responsiveness, against which ERM reviewed <strong>Watercare</strong>’s performance reporting to<br />
provide Type 2, moderate assurance. To achieve this, we interviewed a number of personnel and reviewed relevant documentation at <strong>Watercare</strong>’s operations in Auckland.<br />
The subject matter for this assurance process consisted of adherence to the AA1000AS (2008) Principles, adherence to the Global <strong>Report</strong>ing Initiative (GRI) G3 Application Level A+<br />
requirements and review of the following performance rulers: Safe & Reliable Water Supply; Healthy Waterways; Health, Safety and Wellbeing; Customer Satisfaction; Stakeholder<br />
Relations; Sustainable Environment; Effective Asset Management; and Sound Financial Management.<br />
The scope specifically excluded data relating to <strong>Watercare</strong>’s financial accounts.<br />
ERM’s Independence<br />
<strong>Watercare</strong> was responsible for preparing the <strong>2011</strong> <strong>Annual</strong> <strong>Report</strong>, including the collection and presentation of data and statements within it. The ERM team, led by Peter Rawlings,<br />
Partner, Australia & New Zealand, was responsible for expressing assurance conclusions in line with the scope of work agreed with <strong>Watercare</strong>. During 2010/11, ERM did not work<br />
with <strong>Watercare</strong> on other consulting engagements.<br />
Our Conclusion<br />
On the basis of its scope of work, and in consideration of the limitations of the assurance engagement presented above, ERM concludes that, for the specified subject matter,<br />
<strong>Watercare</strong>’s <strong>2011</strong> <strong>Annual</strong> <strong>Report</strong> appropriately reports non-financial performance, addresses the AA1000 Principles of Completeness, Materiality and Responsiveness and<br />
adheres to the GRI G3 Application Level A+ for the 12 months from 1 July 2010 to 30 June <strong>2011</strong>.<br />
Key Findings<br />
Based on the scope of work, and without affecting our assurance conclusion, ERM identified the following key findings:<br />
• In response to the Auckland water industry amalgamation, <strong>Watercare</strong> has refined its sustainability performance rulers. Quantitative and qualitative rulers are now<br />
presented that reflect the broad integrated role that <strong>Watercare</strong> undertakes and the range of stakeholders that have an interest in its operations.<br />
• Many of <strong>Watercare</strong>’s inherited non-metropolitan assets do not currently meet the same standard and quality of service as its metropolitan sites, however <strong>Watercare</strong> is aware<br />
of the improvements required to bring these inline and has made commitments to invest in these areas.<br />
• <strong>Watercare</strong> continues to actively engage with key stakeholder groups, including its shareholder, the Auckland Council, local Boards, customers, iwi and other interested<br />
parties and respond to their needs. Specific advisory groups focused on iwi and the environment have continued to operate through the amalgamation.<br />
• A range of programmes have been initiated by <strong>Watercare</strong> to tackle material issues across the breadth of sustainability areas such as: reducing water demand of both<br />
its residential customers and larger water users; diverting both operational and process wastes from landfill; increasing skills and capacity within its workforce; and<br />
educating and informing local communities.<br />
• Whilst a large portion of the data reporting mechanisms used to generate <strong>Watercare</strong>’s performance rulers are integrated electronic systems that help to minimise the<br />
potential for data inaccuracies and calculation/transposition errors, there are a number of areas that would benefit from improved data collection protocols.<br />
ERM congratulates <strong>Watercare</strong> on its <strong>2011</strong> <strong>Annual</strong> <strong>Report</strong>.<br />
ERM New Zealand Ltd,<br />
23 September <strong>2011</strong>,<br />
Auckland, New Zealand<br />
Verification report<br />
PAGE 58<br />
ERM New Zealand Limited (ERM) is an independent global provider of environmental, social and corporate responsibility consulting and assurance services. ERM has prepared this<br />
statement for <strong>Watercare</strong> Services Limited in accordance with ERM’s standard terms and the standard practised by members of the environmental consulting profession performing this<br />
type of service at the same time. No other warranty, express or implied, is given by ERM as a result of the provision of this statement. To the extent permitted by law, this statement is<br />
provided for informational purposes only, without the right to rely, and ERM will not be liable for any reliance which may be placed on this statement by a third party.<br />
This statement may not be used by any third party without ERM’s express written permission.<br />
Return to Contents page
financial report<br />
<strong>2011</strong><br />
Fletcher Construction Site<br />
Foreman Dudley Heuvel<br />
(left) and <strong>Watercare</strong> Senior<br />
Engineer Terry Cammell<br />
survey work on the<br />
Mt Eden Reservoir Complex.<br />
CONTENTS<br />
Historical financial summary<br />
and key statistics 60<br />
Financial commentary 61<br />
Responsibility for the financial statements<br />
and statement of service performance 66<br />
<strong>Report</strong> of the Auditor-General 67<br />
Financial statements<br />
Statement of Comprehensive Income 68<br />
Statement of Financial Position 69<br />
Statement of Cash Flows 70<br />
Statement of Changes in Equity 71<br />
Statement of Comprehensive Income<br />
by business unit 72<br />
Statement of Financial Position<br />
by business unit 73<br />
Statement of Cash Flows by business unit 73<br />
Statement of Accounting Policies 74<br />
Notes to the financial statements<br />
1. Revenue 81<br />
2. Price adjustment 81<br />
3. Operating expenses 82<br />
4. Depreciation and amortisation 82<br />
5. Finance costs 82<br />
6. Revaluation of derivative<br />
financial instruments 83<br />
7. Operating cash flows 83<br />
8. Income tax expense 84<br />
9. Deferred tax liability 85<br />
10. Issued capital 85<br />
11. Integration of retail business 86<br />
12. Revaluation reserves 88<br />
13. Property, plant and equipment 89<br />
14. Intangible assets 91<br />
15. Inventories 93<br />
16. Trade and other receivables 93<br />
17. Trade and other payables 93<br />
18. Accrued expenses 94<br />
19. Provisions 94<br />
20. Borrowings 95<br />
21. Financial assets and liabilities 97<br />
22. Related parties 103<br />
23. Commitments 104<br />
24. Contingencies 104<br />
25. Retirement benefit plans 105<br />
26. Remuneration 105<br />
27. Events occurring after balance date 105<br />
Statutory information<br />
Employees remuneration range 106<br />
<strong>2011</strong> Statement of Service Performance<br />
Environmental care 107<br />
Health, safety and wellbeing 107<br />
Stakeholder relationships 108<br />
Customer service commitment 108<br />
Asset management 109<br />
Economic performance 109<br />
Customer services performance 110<br />
Integration of regional water and<br />
wastewater services 111<br />
G3 cross-reference 112<br />
Index 116<br />
Glossary 116<br />
Return to main contents
<strong>Watercare</strong> Services Limited<br />
<strong>2011</strong> ANNUAL REPORT<br />
Historical financial summary and key statistics<br />
As at 30 June <strong>2011</strong><br />
2002 2003 2004 2005* 2006 2007 2008 2009 2010 <strong>2011</strong><br />
$000 $000 $000 $000 $000 $000 $000 $000 $000 $000<br />
FINANCIAL PERFORMANCE<br />
Operating revenue 160,397 163,627 165,240 166,628 167,899 168,983 167,345 184,629 198,116 373,107<br />
Price adjustment - - (15,711) (10,000) - - - - - -<br />
Operating expenses 109,197 137,628 133,470 137,713 144,070 159,196 165,763 170,427 189,002 361,273<br />
Operating surplus before: 51,200 25,999 16,059 18,915 23,829 9,787 1,582 14,202 9,114 11,834<br />
Loss on disposal and provision for<br />
redundant property, plant and<br />
equipment and other restructuring costs - (3,287) (3,102) (3,254) (1,026) (7,719) (4,793) (11,589) (6,140) (6,162)<br />
Contributions towards cost of constructing<br />
property, plant and equipment** - - - - 610 3,790 1,428 259 1,111 -<br />
Revaluation of derivative<br />
financial instruments - - - (2,673) 2,561 3,021 (3,222) (16,599) (20,483) (13,567)<br />
Decommissioning of oxidation ponds (5,442) (2,770) - - - - - - - -<br />
Operating surplus/(deficit) before tax 45,758 19,942 12,957 12,988 25,974 8,879 (5,005) (13,727) (16,398) (7,895)<br />
Current tax 4,814 1,611 2,478 (25) 2,079 (28) - -<br />
Deferred tax 14,540 10,516 8,508 4,303 7,909 3,639 (2,208) (3,363) 11,311 4,438<br />
Net surplus/(deficit) after tax 26,404 7,815 1,971 8,710 15,986 5,268 (2,797) (10,364) (27,709) (12,333)<br />
FINANCIAL POSITION<br />
Non-current assets<br />
Property, plant and equipment 1,338,191 1,569,273 1,571,546 1,585,453 1,959,687 1,977,280 2,025,034 2,357,369 2,413,113 7,688,196<br />
Intangibles*** - - - - 13,539 18,429 18,844 16,375 14,374 30,229<br />
Investments 12,574 14,425 15,714 17,456 - - - - - -<br />
Derivative financial instruments - - - - - - 5,579 12,220 5,284 12,285<br />
Inventories 1,877 2,022 1,921 1,821 2,378 2,797 2,640 2,599 3,237 3,040<br />
1,352,642 1,585,720 1,589,181 1,604,730 1,975,604 1,998,506 2,052,097 2,388,563 2,436,008 7,733,750<br />
Current assets 15,930 18,823 19,823 18,121 33,535 35,491 19,414 114,101 34,782 87,586<br />
Total assets 1,368,572 1,604,543 1,609,004 1,622,851 2,009,139 2,033,997 2,071,511 2,502,664 2,470,790 7,821,336<br />
Non-current liabilities<br />
Borrowings 229,000 229,000 129,000 200,000 200,000 200,000 200,000 350,000 416,500 987,604<br />
Deferred tax liability 20,651 31,167 39,675 256,090 377,656 347,502 342,348 420,666 402,049 848,828<br />
Derivative financial instruments - - - - - - 4,460 27,725 40,298 59,110<br />
Payables, provisions and accruals 21,313 10,864 9,420 972 926 1,194 880 966 1,053 10,492<br />
270,964 271,031 178,095 457,062 578,582 548,696 547,688 799,357 859,900 1,906,034<br />
Current liabilities<br />
Bank overdraft 115 - 458 44 148 132 111 - 446 558<br />
Borrowings 143,894 130,293 241,954 175,713 161,505 174,174 207,349 204,560 109,225 241,295<br />
Payables, provisions, accruals and<br />
derivative financial instruments 32,937 29,590 25,835 29,760 23,149 26,179 41,219 47,796 48,606 92,054<br />
176,946 159,883 268,247 205,517 184,802 200,485 248,679 252,356 158,277 333,907<br />
Total liabilities 447,910 430,914 446,342 662,579 763,384 749,181 796,367 1,051,713 1,018,177 2,239,941<br />
Equity<br />
Issued capital 260,693 260,693 260,693 260,693 260,693 260,693 260,693 260,693 260,693 260,693<br />
Revaluation reserves 629,449 863,754 848,488 575,826 843,712 873,086 862,745 1,043,205 1,071,655 1,429,619<br />
Retained earnings 30,520 49,182 53,481 123,753 141,350 151,037 151,706 147,053 120,265 111,972<br />
Capital reserve - - - - - - - - - 3,779,111<br />
Total equity 920,662 1,173,629 1,162,662 960,272 1,245,755 1,284,816 1,275,144 1,450,951 1,452,613 5,581,395<br />
Total funds employed 1,368,572 1,604,543 1,609,004 1,622,851 2,009,139 2,033,997 2,071,511 2,502,664 2,470,790 7,821,336<br />
CASH FLOW SUMMARY<br />
Net cash flows – operating 65,837 60,131 54,669 65,627 66,777 70,370 59,208 81,297 74,624 176,035<br />
Net cash flows – investing (121,750) (46,349) (66,854) (69,972) (52,673) (83,023) (92,362) (138,387) (126,245) (192,231)<br />
Net cash flows – financing 56,025 (13,601) 11,661 4,759 (14,208) 12,669 33,175 57,411 50,965 16,116<br />
Net change in cash flows 112 181 (524) 414 (104) 16 21 321 (656) (80)<br />
Bank (overdraft)/balance at start of year (227) (115) 66 (458) (44) (148) (132) (111) 210 (446)<br />
Bank (overdraft)/balance at end of year (115) 66 (458) (44) (148) (132) (111) 210 (446) (526)<br />
<strong>2011</strong> Financial <strong>Report</strong><br />
PAGE 60<br />
KEY STATISTICS<br />
Debt to capitalisation (book value) 28% 23% 23% 27% 22% 23% 24% 28% 27% 18%<br />
Debt to capitalisation (historical cost) 55% 53% 53% 48% 47% 48% 50% 58% 58% 23%<br />
Funds flow from operations to interest ratio 4.1 3.9 3.6 3.5 3.7 3.6 2.9 2.9 2.9 3.3<br />
EBITDA total interest ratio 4.3 4.0 3.7 3.5 3.7 3.6 2.9 2.9 2.9 3.3<br />
EBITDA interest expense ratio 7.9 4.2 3.9 3.8 3.8 3.7 3.4 3.9 3.5 3.5<br />
Total liabilities to total assets 33% 27% 28% 41% 38% 37% 38% 42% 41% 29%<br />
Secured liabilities to total assets 2% 2% 2% 2% 0% 0% 0% 0% 0% 0%<br />
Return on average equity 2.9% 0.8% 0.2% 0.8% 1.5% 0.4% (0.2%) (0.8%) (2.0%) (0.4%)<br />
Economic value added/(deducted) ($000) (75,395) (75,237) (109,876) (93,980) (99,499) (123,577) (130,737) (128,769) (134,659) (278,348)<br />
Capital expenditure ($000) 118,080 42,810 66,209 70,651 64,489 86,416 120,174 129,860 123,324 (191,943)<br />
Number of employees 355 352 335 329 343 363 363 381 387 611<br />
* The company adopted NZ IFRS with effect from 1 July 2005 and has restated the comparative information for the year ended 30 June 2005 in accordance with NZ IFRS.<br />
** Contributions towards cost of constructing property, plant and equipment is $3,945, which is included in operating revenue for <strong>2011</strong>.<br />
*** Intangibles have been disclosed separately from the June 2006 financial year onwards.<br />
Return to Contents page
<strong>Watercare</strong> Services Limited<br />
<strong>2011</strong> ANNUAL REPORT<br />
FINANCIAL COMMENTARY<br />
The financial result for the year was a net deficit after tax of $12.3 million, compared with a budgeted net deficit of $0.58 million (2010 – Net<br />
deficit after tax of $27.7 million). The deficit was primarily due to the unfavourable revaluation of the company’s interest rate swap contracts to<br />
market value of $13.6 million and the change in deferred tax due to the reduction of the tax depreciation rates to zero on buildings with useful<br />
lives greater than 50 years which were integrated from the previous local network operators.<br />
Key Points<br />
• On 1 November 2010, the company acquired the water and wastewater businesses conducted by Metrowater Limited, Manukau Water Limited,<br />
North Shore City Council, Waitakere City Council, Rodney District Council and Franklin District Council in accordance with the Local Government<br />
(Tamaki Makaurau Reorganisation) Act 2009, the Local Government (Auckland Council) Act 2009 and the Local Government (Auckland<br />
Transitional Provisions) Act 2010. The company now provides total water and wastewater services to the Auckland region and as a result,<br />
the assets, liabilities, revenues and costs of the company have increased significantly in the financial year to 30 June <strong>2011</strong>.<br />
• During the year the company’s Standard & Poor’s corporate credit rating was raised to ‘A’ long-term and ‘A-1’ short-term, with a positive outlook.<br />
The credit rating on the company’s long-term debt was raised to ‘AA’, consistent with the change to Auckland Council’s long-term credit rating.<br />
Subsequent to year end, Standard & Poor’s raised the company’s corporate credit rating to ‘AA-‘ long-term and ‘A-1+’ short term with a stable<br />
outlook (refer to note 27 for further detail).<br />
• A $150 million medium-term note issue was completed in February <strong>2011</strong>. The notes were for a term of four years, and the proceeds were<br />
largely used to refinance maturing intercompany loans from Auckland Council.<br />
• No price adjustment was paid in the <strong>2011</strong> year (2010 – $nil).<br />
• Under NZ IFRS, the company has chosen to revalue its interest rate swaps and forward foreign exchange contracts to fair value. These resulted<br />
in a decrease in current year operating surplus from trading operations by $13.6 million (2010 – decrease in operating surplus from trading<br />
operations by $20.5 million).<br />
• Operating costs were 6.0% lower than budget due to savings in asset operating costs, maintenance and overheads.<br />
• The deferred taxation liability has been adjusted to integrate the previous deferred taxation positions of Metrowater and Manukau Water.<br />
Additionally an adjustment was required to reflect the reduction of the tax depreciation rates to zero on buildings with useful lives greater<br />
than 50 years which were inherited at integration date.<br />
• This financial commentary includes the budget for the <strong>2011</strong> year and notes on significant variances. Comparisons are also provided to<br />
last year being a period where <strong>Watercare</strong> was the wholesale provider of water and wastewater services which is reflected in revenue,<br />
costs, assets and liabilities all being significantly lower. The 2012 budget is also provided as a reference point and reflects higher revenue<br />
and costs as <strong>Watercare</strong> only provided retail water and wastewater services for eight months in this financial year, being the period since<br />
integration on 1 November 2010.<br />
Statement of Comprehensive Income<br />
FOR THE YEAR ENDED 30 JUNE <strong>2011</strong><br />
Total Comprehensive income<br />
<strong>2011</strong> <strong>2011</strong> <strong>2011</strong> 2010 2012<br />
actual budget Variance to Budget Actual Budget<br />
$000 $000 $000 $000<br />
Net deficit after tax (12,333) (582) N/A (27,709) (3,179)<br />
Other comprehensive income, net of tax 361,873 151,403 139% 29,371 -<br />
Total comprehensive income for the year, net of tax 349,540 150,821 131.8% 1,662 (3,179)<br />
The Statement of Comprehensive Income also includes other comprehensive income of $361.9 million due to the revaluation of property, plant<br />
and equipment at 30 June <strong>2011</strong>.<br />
Total comprehensive income for the year of $349.5 million after tax, compared with budgeted comprehensive income of $150.8 million after<br />
tax, represents a favourable variance of $198.7 million. This primarily reflects the upwards asset revaluation being greater than the 3% increase<br />
assumed in the budget.<br />
Material unfavourable variances in comparison to budget include the negative revaluation of financial instruments of $13.6 million, depreciation<br />
and amortisation of $1.21 million, non-operating costs of $1.36 million and revenue of $1.0 million. The unfavourable variances were partially<br />
offset by the favourable variance in operating costs of $10.1 million.<br />
<strong>2011</strong> <strong>2011</strong> <strong>2011</strong> 2010 2012<br />
actual budget Variance to Budget Actual Budget<br />
$000 $000 $000 $000<br />
Revenue<br />
Water 131,438 134,343 (2.2%) 71,962 135,196<br />
Wastewater 203,773 206,290 (1.2%) 106,922 262,707<br />
Trade waste 14,038 13,709 2.4% 11,763 12,510<br />
Other 23,858 19,823 20.4% 8,580 43,339<br />
Operating revenue 373,107 374,166 (0.3%) 199,227 453,752<br />
<strong>2011</strong> Financial <strong>Report</strong><br />
PAGE 61<br />
Return to Contents page
<strong>Watercare</strong> Services Limited<br />
<strong>2011</strong> ANNUAL REPORT<br />
FINANCIAL COMMENTARY (continued)<br />
Water revenue was $131.44 million for the year, 2.2% lower than the budget of $134.34 million due to lower than expected water sales volumes.<br />
Wastewater revenue was $203.77 million for the year, 1.2% lower than the budget of $206.29 million due to lower than expected volumes.<br />
Trade waste revenue was $14.0 million for the year and was higher than the budget by 2.4% due to higher than expected production for<br />
some customers.<br />
Other revenue was $23.8 million for the year and was 20.4% above budget due to higher miscellaneous revenue.<br />
<strong>2011</strong> <strong>2011</strong> <strong>2011</strong> 2010 2012<br />
actual budget Variance to Budget Actual Budget<br />
$000 $000 $000 $000<br />
Price adjustment<br />
Water - - - - -<br />
Wastewater - - - - -<br />
Trade waste - - - - -<br />
- - - - -<br />
Price adjustments are unbudgeted discretionary payments. The Directors determine the amount, and the distribution between customer groups,<br />
after having regard to the financial position of the company and future expenditure requirements. The Directors decided that no price adjustment<br />
would be made for <strong>2011</strong> (2010 – $Nil).<br />
<strong>2011</strong> <strong>2011</strong> <strong>2011</strong> 2010 2012<br />
actual budget Variance to Budget Actual Budget<br />
$000 $000 $000 $000<br />
Operating expenses<br />
Water<br />
Asset operating costs 19,577 21,909 10.6% 13,019 24,878<br />
Maintenance 18,361 21,987 16.5% 7,660 19,846<br />
Other expenses 25,591 23,769 (7.7%) 17,628 27,372<br />
63,529 67,665 6.1% 38,307 72,095<br />
Wastewater<br />
Asset operating costs 36,493 38,882 6.1% 22,467 41,110<br />
Maintenance 20,651 21,314 3.1% 11,615 24,349<br />
Other expenses 35,867 38,782 7.5% 16,345 44,659<br />
93,011 98,977 6.0% 50,427 110,118<br />
Total<br />
Asset operating costs 56,070 60,791 7.8% 35,486 65,987<br />
Maintenance 39,012 43,301 9.9% 19,275 44,195<br />
Other expenses 61,458 62,551 1.7% 33,973 72,031<br />
156,540 166,642 6.1% 88,734 182,213<br />
Asset operating costs for the year were 7.8% below budget. The main driver for the favourable variance was due to the savings in chemical and<br />
energy costs due to lower flows in the summer months. Savings in other asset costs were due to biosolids production volume being down and<br />
lower information systems operating costs than budgeted following integration.<br />
Maintenance costs were 9.9% lower than budget. The favourable variance was primarily due to deferral of the primary sedimentation tank at the<br />
Rosedale Wastewater Treatment Plant and savings across the water treatment plants and network maintenance programme.<br />
<strong>2011</strong> Financial <strong>Report</strong><br />
Other expenses for the year were 1.7% lower than budget due primarily to professional services and net labour costs being lower than budget.<br />
Professional services savings were achieved across the company due primarily to reprioritisation of spend in this area and staff focus on<br />
integration. The savings in net labour was mainly due to lower headcount than budgeted especially in the infrastructure and information systems<br />
groups. Other overhead savings were also achieved in training and travel due to staff focus on the integration of the retail business.<br />
PAGE 62<br />
Return to Contents page
<strong>Watercare</strong> Services Limited<br />
<strong>2011</strong> ANNUAL REPORT<br />
FINANCIAL COMMENTARY (continued)<br />
<strong>2011</strong> <strong>2011</strong> <strong>2011</strong> 2010 2012<br />
actual budget Variance to Budget Actual Budget<br />
$000 $000 $000 $000<br />
Depreciation and Amortisation<br />
Water 71,106 54,510 (30.4%) 34,680 82,730<br />
Wastewater 72,520 87,906 17.5% 34,075 100,950<br />
143,626 142,416 (0.8%) 68,755 183,680<br />
Depreciation for <strong>2011</strong> was 0.8% over budget primarily due to the acceleration of depreciation on various water assets due for replacement.<br />
The budget for water depreciation was understated and wastewater depreciation overstated due to incorrect budget assumptions being used<br />
for the useful lives of the retail assets integrated from the local network operators on 1 November 2010.<br />
<strong>2011</strong> <strong>2011</strong> <strong>2011</strong> 2010 2012<br />
actual budget Variance to Budget Actual Budget<br />
$000 $000 $000 $000<br />
Finance costs<br />
Water<br />
Paid and payable 27,899 31,045 10.1% 10,846 39,161<br />
Capitalised on asset construction (1,998) (4,143) 51.8% (1,060) (3,022)<br />
25,901 26,902 3.7% 9,786 36,139<br />
Wastewater<br />
Paid and payable 37,922 39,512 4.0% 26,502 49,841<br />
Capitalised on asset construction (2,716) (5,274) 48.5% (4,775) (3,846)<br />
35,206 34,238 (2.8%) 21,727 45,995<br />
Total<br />
Paid and payable 65,821 70,557 6.7% 37,348 89,002<br />
Capitalised on asset construction (4,714) (9,417) 49.9% (5,835) (6,868)<br />
61,107 61,140 0.1% 31,513 82,134<br />
Total finance costs of $61.1 million were 0.1% below budget. The lower interest costs were due to lower interest rates and lower debt due to<br />
lower capital expenditure than budgeted. This was partially offset by the amount of interest capitalised to assets under construction being lower<br />
than budget by $4.7 million due to less qualifying projects being integrated from the local network operators than was assumed.<br />
<strong>2011</strong> <strong>2011</strong> <strong>2011</strong> 2010 2012<br />
actual budget Variance to Budget Actual Budget<br />
$000 $000 $000 $000<br />
Tax<br />
Current tax - - - - -<br />
Deferred tax 4,438 (250) N/A 11,311 (1,236)<br />
4,438 (250) N/A 11,311 (1,236)<br />
The deferred tax balance reflects the change in deferred tax due to the reduction of the tax depreciation rates to zero on buildings with useful<br />
lives greater than 50 years which were integrated from the local network operators on 1 November 2010. No tax was payable on the trading<br />
result for the year.<br />
PAGE 63<br />
<strong>2011</strong> Financial <strong>Report</strong><br />
Return to Contents page
<strong>Watercare</strong> Services Limited<br />
<strong>2011</strong> ANNUAL REPORT<br />
FINANCIAL COMMENTARY (continued)<br />
Statement of Financial Position<br />
AS AT 30 JUNE <strong>2011</strong><br />
The company is in a strong financial position with net equity of $5.58 billion at year-end. The net equity increased by $4.13 billion from<br />
30 June 2010 primarily due to the capital contribution on 1 November 2010 of $3.78 billion resulting from the integration of the net assets<br />
and liabilities of the previous local network operators.<br />
<strong>2011</strong> <strong>2011</strong> <strong>2011</strong> 2010 2012<br />
actual budget Variance to Budget Actual Budget<br />
$000 $000 $000 $000<br />
Property, plant and equipment<br />
Water 3,188,117 3,139,907 1.5% 1,366,844 3,234,411<br />
Wastewater 4,500,079 4,285,998 5.0% 1,046,269 4,519,687<br />
7,688,196 7,425,554 3.5% 2,413,113 7,754,098<br />
Water Wastewater Total<br />
$000 $000 $000<br />
The analysis by business group for the movements in property, plant and equipment for <strong>2011</strong> is:<br />
Net additions, integration and other movements 1,698,148 3,211,411 4,909,559<br />
Asset revaluation (before tax) 190,988 311,612 502,600<br />
Depreciation (67,863) (69,213) (137,076)<br />
1,821,273 3,453,810 5,275,083<br />
The increase for property, plant and equipment during the year was primarily due to the integration on 1 November 2010 of the property,<br />
plant and equipment of the local network operators. Additionally, all of the property, plant and equipment was revalued at 30 June <strong>2011</strong>.<br />
Significant capital expenditure projects in the year included work on the new Hunua Number 4 trunk watermain and the South Western<br />
interceptor extension.<br />
<strong>2011</strong> <strong>2011</strong> <strong>2011</strong> 2010 2012<br />
actual budget Variance to Budget Actual Budget<br />
$000 $000 $000 $000<br />
Intangible assets<br />
Water 14,207 16,634 (14.6%) 6,552 7,614<br />
Wastewater 16,022 18,759 (14.6%) 7,822 8,586<br />
30,229 35,393 (14.6%) 14,374 16,200<br />
The increase in intangible assets during the year reflects both the assets integrated from the local network operators and the completion of the<br />
new information systems required for the company to operate in the retail environment from 1 November 2010.<br />
<strong>2011</strong> <strong>2011</strong> <strong>2011</strong> 2010 2012<br />
actual budget Variance to Budget Actual Budget<br />
$000 $000 $000 $000<br />
Borrowings<br />
1,228,899 1,270,717 3.3% 525,725 1,295,314<br />
Borrowings at year-end were 3.3% lower than budget, primarily due to lower than budgeted capital expenditure and lower opening debt than<br />
was assumed for the budget. Borrowings include commercial paper of $124.1 million, $11.5 million drawn under a revolving credit facility, related<br />
party loans of $543.2 million, medium term notes of $450 million and a bank loan of $100 million.<br />
<strong>2011</strong> Financial <strong>Report</strong><br />
PAGE 64<br />
Return to Contents page
<strong>Watercare</strong> Services Limited<br />
<strong>2011</strong> ANNUAL REPORT<br />
FINANCIAL COMMENTARY (continued)<br />
<strong>2011</strong> <strong>2011</strong> <strong>2011</strong> 2010 2012<br />
actual budget Variance to Budget Actual Budget<br />
$000 $000 $000 $000<br />
Deferred tax liability<br />
848,828 775,362 9.5% 402,049 849,704<br />
The deferred tax liability primarily comprises temporary differences between the revalued property, plant and equipment and the values<br />
recognised for tax purposes plus differences in the company’s depreciation rates and those permitted by the Inland Revenue Department.<br />
At 30 June <strong>2011</strong>, deferred taxation was higher than budget, principally due to the revaluation of property, plant and equipment for accounting<br />
purposes being greater than budgeted. The increase in deferred tax liability compared to last year primarily reflects the integration of the deferred<br />
tax balances of Metrowater and Manukau Water of $301.6 million on 1 November 2010 and the tax effect of the revaluation of the property, plant<br />
and equipment for accounting purposes of $140.7 million.<br />
Statement of Cash Flows<br />
FOR THE YEAR ENDED 30 JUNE <strong>2011</strong><br />
No price adjustment was paid to customers during the financial year to 30 June <strong>2011</strong>. As such, all of the company’s cash flow from operations<br />
was available for either capital expenditure or debt repayment. Borrowings increased as a result of the shortfall between operating cash flows<br />
and capital expenditure.<br />
<strong>2011</strong> <strong>2011</strong> <strong>2011</strong> 2010 2012<br />
actual budget Variance to Budget Actual Budget<br />
$000 $000 $000 $000<br />
Net cash flows from operating activities<br />
176,035 169,468 3.9% 74,624 182,237<br />
Net operating cash flows at $176.04 million were 3.9% higher than budget for <strong>2011</strong>, predominantly due to lower operating costs than expected.<br />
<strong>2011</strong> <strong>2011</strong> <strong>2011</strong> 2010 2012<br />
actual budget Variance to Budget Actual Budget<br />
$000 $000 $000 $000<br />
Net cash flows from investing activities<br />
(192,231) (220,859) 13.0% (126,245) (240,907)<br />
The net cash flows from investing activities were 13% lower than budget due to delays in some capital expenditure projects.<br />
<strong>2011</strong> <strong>2011</strong> <strong>2011</strong> 2010 2012<br />
actual budget Variance to Budget Actual Budget<br />
$000 $000 $000 $000<br />
Net cash flows from financing activities<br />
16,116 51,391 (68.6%) 50,965 58,670<br />
The net cash flows from financing activities show a net increase in borrowings in <strong>2011</strong> from the prior year. The increase in debt resulted from the<br />
higher level of capital expenditure relative to the operating cash flows.<br />
The audited financial statements are set out on pages 68 to 105.<br />
PAGE 65<br />
<strong>2011</strong> Financial <strong>Report</strong><br />
Return to Contents page
<strong>Watercare</strong> Services Limited<br />
<strong>2011</strong> ANNUAL REPORT<br />
RESPONSIBILITY FOR THE FINANCIAL STATEMENTS<br />
AND STATEMENT OF SERVICE PERFORMANCE<br />
Financial Statements<br />
We have ensured that the financial statements fairly reflect the financial position of the company as at 30 June <strong>2011</strong> and its financial performance<br />
and cash flows for the year ended on that date.<br />
We have ensured that the accounting policies used by the company accord with New Zealand Equivalents to International Financial <strong>Report</strong>ing<br />
Standards. This includes the early adoption of accounting standards issued by the New Zealand Institute of Chartered Accountants, to the extent that<br />
they do not conflict with an existing accounting standard and the information is available.<br />
We believe proper accounting records have been kept, enabling the financial position of the company to be determined and that the financial<br />
statements fully comply with the Financial <strong>Report</strong>ing Act 1993.<br />
We consider adequate steps have been taken to safeguard the assets of the company and to prevent and detect fraud and other irregularities.<br />
Statement of Service Performance<br />
We are responsible for establishing a Statement of Corporate Intent, which sets targets and other measures by which the company’s performance can<br />
be judged in relation to its objectives.<br />
We consider the results reported in the statement of service performance fairly reflect the achievements for the year ended 30 June <strong>2011</strong>.<br />
We have pleasure in presenting the financial statements and the statement of service performance for <strong>Watercare</strong> Services Limited for the year ended<br />
30 June <strong>2011</strong>, which were approved and authorised for release on 22 September <strong>2011</strong>.<br />
For and on behalf of management:<br />
K M Ford<br />
Chief Executive<br />
B T Monk<br />
Chief Financial Officer<br />
For the Board:<br />
R B Keenan<br />
Chairman<br />
D J Clarke<br />
deputy Chairman<br />
P S Drummond C J Harland S M Huria<br />
Director Director Director<br />
<strong>2011</strong> Financial <strong>Report</strong><br />
A G Lanigan P N Snedden J G Todd<br />
Director Director Director<br />
PAGE 66<br />
Return to Contents page
<strong>Watercare</strong> Services Limited<br />
<strong>2011</strong> ANNUAL REPORT<br />
INDEPENDENT AUDITOR’S REPORT<br />
To the readers of <strong>Watercare</strong> Services Limited and group’s Financial Statements and<br />
Statement of Service Performance for the year ended 30 June <strong>2011</strong><br />
The Auditor-General is the auditor of <strong>Watercare</strong> Services Limited<br />
(the company) and group. The Auditor-General has appointed me,<br />
Jamie Schmidt, using the staff and resources of Deloitte, to carry out<br />
the audit of the financial statements and statement of service<br />
performance of the company and group on her behalf.<br />
We have audited:<br />
• the financial statements of the company and group on pages 68 to<br />
105, that comprise the statement of financial position as at 30 June<br />
<strong>2011</strong>, the statement of comprehensive income, statement of changes<br />
in equity and statement of cash flows for the year ended on that date<br />
and the notes to the financial statements that include accounting<br />
policies and other explanatory information; and<br />
• the statement of service performance of the company and group<br />
on pages 107 to 111.<br />
Opinion on the financial statements and the statement<br />
of service performance<br />
In our opinion,<br />
• the financial statements of the company and group on pages 68 to 105:<br />
--<br />
comply with generally accepted accounting practice in New Zealand;<br />
--<br />
give a true and fair view of the company and group’s:<br />
--<br />
financial position as at 30 June <strong>2011</strong>; and<br />
--<br />
financial performance and cash flows for the year ended<br />
on that date; and<br />
• the statement of service performance of the company and group<br />
on pages 107 to 111:<br />
--<br />
complies with generally accepted accounting practice in<br />
New Zealand; and<br />
--<br />
gives a true and fair view of the company’s service performance<br />
achievements measured against the performance targets adopted<br />
for the year ended 30 June <strong>2011</strong>.<br />
Opinion on other legal requirements<br />
In accordance with the Financial <strong>Report</strong>ing Act 1993 we report that, in our<br />
opinion, proper accounting records have been kept by the company and<br />
group as far as appears from an examination of those records.<br />
Our audit was completed on 22 September <strong>2011</strong>. This is the date at which<br />
our opinion is expressed.<br />
The basis of our opinion is explained below. In addition, we outline the<br />
responsibilities of the Board of Directors and our responsibilities, and<br />
explain our independence.<br />
Basis of opinion<br />
We carried out our audit in accordance with the Auditor-General’s<br />
Auditing Standards, which incorporate the International Standards<br />
on Auditing (New Zealand). Those standards require that we comply<br />
with ethical requirements and plan and carry out our audit to obtain<br />
reasonable assurance about whether the financial statements and<br />
statement of service performance are free from material misstatement.<br />
Material misstatements are differences or omissions of amounts and<br />
disclosures that would affect a reader’s overall understanding of the<br />
financial statements and statement of service performance. If we had<br />
found material misstatements that were not corrected, we would have<br />
referred to them in our opinion.<br />
An audit involves carrying out procedures to obtain audit evidence<br />
about the amounts and disclosures in the financial statements and<br />
statement of service performance. The procedures selected depend<br />
on our judgement, including our assessment of risks of material<br />
misstatement of the financial statements and statement of service<br />
performance whether due to fraud or error.<br />
In making those risk assessments, we consider internal control relevant<br />
to the preparation of the company and group’s financial statements and<br />
statement of service performance that give a true and fair view of the<br />
matters to which they relate.<br />
We consider internal control in order to design audit procedures that are<br />
appropriate in the circumstances but not for the purpose of expressing an<br />
opinion on the effectiveness of the company and group’s internal control.<br />
An audit also involves evaluating:<br />
• the appropriateness of accounting policies used and whether they<br />
have been consistently applied;<br />
• the reasonableness of the significant accounting estimates and<br />
judgements made by the Board of Directors;<br />
• the adequacy of all disclosures in the financial statements and<br />
statement of service performance; and<br />
• the overall presentation of the financial statements and statement<br />
of service performance.<br />
We did not examine every transaction, nor do we guarantee complete<br />
accuracy of the financial statements and statement of service<br />
performance. In accordance with the Financial <strong>Report</strong>ing Act 1993,<br />
we report that we have obtained all the information and explanations<br />
we have required. We believe we have obtained sufficient and<br />
appropriate audit evidence to provide a basis for our audit opinion.<br />
Responsibilities of the Board of Directors<br />
The Board of Directors is responsible for preparing financial statements<br />
and a statement of service performance that:<br />
• comply with generally accepted accounting practice in New Zealand;<br />
• give a true and fair view of the company and group’s financial<br />
position, financial performance and cash flows; and<br />
• give a true and fair view of the company and group’s service<br />
performance.<br />
The Board of Directors is also responsible for such internal control<br />
as it determines is necessary to enable the preparation of financial<br />
statements and a statement of service performance that are free from<br />
material misstatement, whether due to fraud or error.<br />
The Board of Directors’ responsibilities arise from the Local Government<br />
(Auckland Transitional Provisions) Act 2010 and the Financial <strong>Report</strong>ing<br />
Act 1993.<br />
Responsibilities of the Auditor<br />
We are responsible for expressing an independent opinion on the<br />
financial statements and statement of service performance and<br />
reporting that opinion to you based on our audit. Our responsibility<br />
arises from section 15 of the Public Audit Act 2001 and section 22<br />
of the Local Government (Auckland Transitional Provisions) Act 2010.<br />
Independence<br />
When carrying out the audit, we followed the independence requirements<br />
of the Auditor-General, which incorporate the independence<br />
requirements of the New Zealand Institute of Chartered Accountants.<br />
Other than the audit and IT assurance and control work, which are<br />
compatible with those independence requirements, we have no<br />
relationship with or interests in the company or any of its subsidiaries.<br />
Jamie Schmidt<br />
Deloitte<br />
On behalf of the Auditor-General<br />
Auckland, New Zealand<br />
<strong>2011</strong> Financial <strong>Report</strong><br />
PAGE 67<br />
Return to Contents page
<strong>Watercare</strong> Services Limited<br />
<strong>2011</strong> ANNUAL REPORT<br />
STATEMENT OF COMPREHENSIVE INCOME<br />
FOR THE YEAR ENDED 30 JUNE <strong>2011</strong><br />
group and Company Company<br />
<strong>2011</strong> 2010<br />
Notes $000 $000<br />
Revenue Note 1, page 81 373,107 199,227<br />
Total revenue 373,107 199,227<br />
Operating expenses<br />
Asset operating costs (56,070) (35,486)<br />
Maintenance costs (39,012) (19,275)<br />
Employee benefit expenses (27,659) (14,635)<br />
Other expenses (33,799) (19,338)<br />
Total operating expenses Note 3, page 82 (156,540) (88,734)<br />
Depreciation and amortisation Note 4, page 82 (143,626) (68,755)<br />
Finance costs Note 5, page 82 (61,107) (31,513)<br />
Total expenses (361,273) (189,002)<br />
Operating surplus from trading operations 11,834 10,225<br />
Loss on disposal and provision for redundant property, plant and equipment and other restructuring costs (6,162) (6,140)<br />
Revaluation of derivative financial instruments Note 6, page 83 (13,567) (20,483)<br />
Operating deficit before tax (7,895) (16,398)<br />
Income tax expense<br />
Deferred tax Note 8, page 84 (4,438) (11,311)<br />
Income tax expense (4,438) (11,311)<br />
Net deficit for the year (12,333) (27,709)<br />
Other comprehensive income net of tax<br />
Gain on revaluation of property, plant and equipment and adjustments Note 12, page 88 361,873 -<br />
Impairment of property, plant and equipment Note 12, page 88 - (390)<br />
Deferred tax relating to future reduction in tax rate Note 12, page 88 - 29,761<br />
Other comprehensive income for the year, net of tax 361,873 29,371<br />
Total comprehensive income for the year, net of tax 349,540 1,662<br />
The financial statements should be read in conjunction with the accounting policies and notes on pages 74 to 105.<br />
<strong>2011</strong> Financial <strong>Report</strong><br />
PAGE 68<br />
Return to Contents page
<strong>Watercare</strong> Services Limited<br />
<strong>2011</strong> ANNUAL REPORT<br />
STATEMENT OF FINANCIAL POSITION<br />
AS AT 30 JUNE <strong>2011</strong><br />
group and Company Company<br />
<strong>2011</strong> 2010<br />
Notes $000 $000<br />
ASSETS<br />
Current<br />
Cash and cash equivalents 32 -<br />
Short-term deposits - 10,000<br />
Trade and other receivables Note 16, page 93 79,508 19,047<br />
Prepaid expenses 3,401 3,306<br />
Inventories Note 15, page 93 4,092 2,267<br />
Derivative financial instruments Note 21, page 97 553 162<br />
total current assets 87,586 34,782<br />
Non-current<br />
Inventories Note 15, page 93 3,040 3,237<br />
Derivative financial instruments Note 21, page 97 12,285 5,284<br />
Intangible assets Note 14, page 91 30,229 14,374<br />
Property, plant and equipment Note 13, page 89 7,688,196 2,413,113<br />
total non-current assets 7,733,750 2,436,008<br />
Total assets 7,821,336 2,470,790<br />
EQUITY & LIABILITIES<br />
Current<br />
Bank overdraft 558 446<br />
Trade and other payables Note 17, page 93 16,157 8,299<br />
Accrued expenses Note 18, page 94 67,927 33,017<br />
Provisions Note 19, page 94 4,796 6,264<br />
Borrowings Note 20, page 95 241,295 109,225<br />
Derivative financial instruments Note 21, page 97 3,174 1,026<br />
total current liabilities 333,907 158,277<br />
Non-current<br />
Accrued expenses Note 18, page 94 9,100 -<br />
Provisions Note 19, page 94 1,392 1,053<br />
Borrowings Note 20, page 95 987,604 416,500<br />
Derivative financial instruments Note 21, page 97 59,110 40,298<br />
Deferred tax liability Note 9, page 85 848,828 402,049<br />
total non-current liabilities 1,906,034 859,900<br />
Total liabilities 2,239,941 1,018,177<br />
EQUITY ATTRIBUTABLE TO OWNERS OF THE PARENT<br />
retained earnings 111,972 120,265<br />
Revaluation reserves Note 12, page 88 1,429,619 1,071,655<br />
Capital reserve Note 11, page 86 3,779,111 -<br />
Issued capital Note 10, page 85 260,693 260,693<br />
Total equity 5,581,395 1,452,613<br />
Total equity and liabilities 7,821,336 2,470,790<br />
The financial statements should be read in conjunction with the accounting policies and notes on pages 74 to 105.<br />
PAGE 69<br />
<strong>2011</strong> Financial <strong>Report</strong><br />
Return to Contents page
<strong>Watercare</strong> Services Limited<br />
<strong>2011</strong> ANNUAL REPORT<br />
STATEMENT OF CASH FLOWS<br />
FOR THE YEAR ENDED 30 JUNE <strong>2011</strong><br />
group and Company Company<br />
<strong>2011</strong> 2010<br />
Notes $000 $000<br />
OPERATING ACTIVITIES<br />
Cash was provided from:<br />
Receipts from customers 384,722 196,377<br />
Dividends received 34 49<br />
Interest received 1,041 583<br />
385,797 197,009<br />
Cash was applied to:<br />
Employees and suppliers (153,203) (89,830)<br />
Finance costs paid (56,559) (32,555)<br />
(209,762) (122,385)<br />
Net cash flows – operating activities Note 7, page 83 176,035 74,624<br />
INVESTING ACTIVITIES<br />
Cash was provided from:<br />
Contributions to fund property, plant and equipment - 1,111<br />
Cash acquired from Manukau Water Limited Note 11, page 86 11,953 -<br />
Sale of property, plant and equipment 70 25<br />
12,023 1,136<br />
Cash was applied to:<br />
Purchase and construction of property, plant and equipment (193,935) (121,546)<br />
Interest capitalised on construction of property, plant and equipment Note 5, page 82 (4,714) (5,835)<br />
Bank overdraft acquired from Metrowater Limited Note 11, page 86 (5,605) -<br />
(204,254) (127,381)<br />
Net cash flows – investing activities (192,231) (126,245)<br />
FINANCING ACTIVITIES<br />
Cash was provided from:<br />
Short-term deposits 15,000 85,000<br />
Proceeds from medium-term notes issue 150,000 50,000<br />
Commercial paper issued (net) 24,916 44,665<br />
Revolving credit facility (net) - 21,300<br />
189,916 200,965<br />
Cash was applied to:<br />
Revolving credit facility (net) (5,000) -<br />
Repay medium-term notes issue - (150,000)<br />
Repay loan from Auckland Council – related party Note 22, page 103 (168,800) -<br />
(173,800) (150,000)<br />
Net cash flows – financing activities 16,116 50,965<br />
Net change in cash flows (80) (656)<br />
Bank (overdraft)/balance at beginning of year (446) 210<br />
<strong>2011</strong> Financial <strong>Report</strong><br />
PAGE 70<br />
Net bank overdraft at the end of the year (526) (446)<br />
Net bank overdraft at the end of the year comprises of:<br />
Cash and cash equivalents 32 -<br />
Bank overdraft (558) (446)<br />
(526) (446)<br />
The financial statements should be read in conjunction with the accounting policies and notes on pages 74 to 105.<br />
Return to Contents page
<strong>Watercare</strong> Services Limited<br />
<strong>2011</strong> ANNUAL REPORT<br />
STATEMENT OF CHANGES IN EQUITY<br />
FOR THE YEAR ENDED 30 JUNE <strong>2011</strong><br />
issued Revaluation Retained Capital<br />
capital reserves earnings reserve Total<br />
Notes $000 $000 $000 $000 $000<br />
Group and company <strong>2011</strong><br />
Balance at 1 July 2010 260,693 1,071,655 120,265 - 1,452,613<br />
Comprehensive income<br />
Net deficit for the year - - (12,333) - (12,333)<br />
Other comprehensive income<br />
Gain on revaluation of property,<br />
plant and equipment Note 12, page 88 - 361,873 - - 361,873<br />
Transfer to retained earnings on disposal of<br />
property, plant and equipment Note 12, page 88 - (3,909) 3,909 - -<br />
Total comprehensive income for the year, net of tax - 357,964 (8,424) - 349,540<br />
Transactions with owners<br />
Capital reserve on business integration - - - 3,779,111 3,779,111<br />
Metrowater Community Trust acquired on integration - - 131 - 131<br />
Total transactions with owners Note 11, page 86 - - 131 3,779,111 3,779,242<br />
Balance at 30 June <strong>2011</strong> 260,693 1,429,619 111,972 3,779,111 5,581,395<br />
issued Revaluation Retained Capital<br />
capital reserves earnings reserve Total<br />
Notes $000 $000 $000 $000 $000<br />
Company 2010<br />
Balance at 1 July 2009 260,693 1,043,205 147,053 - 1,450,951<br />
Comprehensive income<br />
Net deficit for the year - - (27,709) - (27,709)<br />
Other comprehensive income<br />
Tax rate adjustment (30% to 28%) Note 12, page 88 - 29,761 - - 29,761<br />
Impairment of property, plant and equipment Note 12, page 88 - (390) - - (390)<br />
Transfer to retained earnings on disposal of<br />
property, plant and equipment Note 12, page 88 - (921) 921 - -<br />
Total comprehensive income for the year, net of tax - 28,450 (26,788) - 1,662<br />
Balance at 30 June 2010 260,693 1,071,655 120,265 - 1,452,613<br />
The financial statements should be read in conjunction with the accounting policies and notes on pages 74 to 105.<br />
PAGE 71<br />
<strong>2011</strong> Financial <strong>Report</strong><br />
Return to Contents page
<strong>Watercare</strong> Services Limited<br />
<strong>2011</strong> ANNUAL REPORT<br />
STATEMENT OF COMPREHENSIVE INCOME BY BUSINESS UNIT<br />
FOR THE YEAR ENDED 30 JUNE <strong>2011</strong><br />
group and Company<br />
company<br />
Water Wastewater Total Water Wastewater Total<br />
<strong>2011</strong> <strong>2011</strong> <strong>2011</strong> 2010 2010 2010<br />
$000 $000 $000 $000 $000 $000<br />
Revenue<br />
Water and wastewater 131,438 203,773 335,211 71,962 106,922 178,884<br />
Trade waste - 14,038 14,038 - 11,763 11,763<br />
Other revenue 9,066 14,792 23,858 3,992 4,588 8,580<br />
Total revenue 140,504 232,603 373,107 75,954 123,273 199,227<br />
Operating expenses<br />
Asset operating costs (19,577) (36,493) (56,070) (13,019) (22,467) (35,486)<br />
Maintenance costs (18,361) (20,651) (39,012) (7,660) (11,615) (19,275)<br />
Employee benefit expenses (12,386) (15,273) (27,659) (7,352) (7,283) (14,635)<br />
Other expenses (13,205) (20,594) (33,799) (10,276) (9,062) (19,338)<br />
Total operating expenses (63,529) (93,011) (156,540) (38,307) (50,427) (88,734)<br />
Depreciation and amortisation (71,106) (72,520) (143,626) (34,680) (34,075) (68,755)<br />
Finance costs (25,901) (35,206) (61,107) (9,786) (21,727) (31,513)<br />
Total expenses (160,536) (200,737) (361,273) (82,773) (106,229) (189,002)<br />
Operating (deficit)/surplus from trading operations (20,032) 31,866 11,834 (6,819) 17,044 10,225<br />
Loss on disposal and provision for redundant property,<br />
plant and equipment and other restructuring costs (3,215) (2,947) (6,162) (4,100) (2,040) (6,140)<br />
Revaluation of derivative financial instruments (5,191) (8,376) (13,567) (6,805) (13,678) (20,483)<br />
Operating (deficit)/surplus before tax (28,438) 20,543 (7,895) (17,724) 1,326 (16,398)<br />
Income tax expense<br />
Deferred tax (1,686) (2,752) (4,438) (3,362) (7,949) (11,311)<br />
Income tax expense (1,686) (2,752) (4,438) (3,362) (7,949) (11,311)<br />
Net (deficit)/surplus for the year (30,124) 17,791 (12,333) (21,086) (6,623) (27,709)<br />
Other comprehensive income net of tax<br />
Gain on revaluation and impairment of property,<br />
plant and equipment and adjustments 137,512 224,361 361,873 - - -<br />
Impairment of property, plant and equipment - - - - (390) (390)<br />
Deferred tax relating to future reduction in tax rate - - - 18,633 11,128 29,761<br />
Other comprehensive income for the year, net of tax 137,512 224,361 361,873 18,633 10,738 29,371<br />
Total comprehensive income for the year, net of tax 107,388 242,152 349,540 (2,453) 4,115 1,662<br />
The financial statements should be read in conjunction with the accounting policies and notes on pages 74 to 105.<br />
<strong>2011</strong> Financial <strong>Report</strong><br />
PAGE 72<br />
Return to Contents page
<strong>Watercare</strong> Services Limited<br />
<strong>2011</strong> ANNUAL REPORT<br />
STATEMENT OF FINANCIAL POSITION BY BUSINESS UNIT<br />
AS AT 30 JUNE <strong>2011</strong><br />
group and Company<br />
company<br />
Water Wastewater Total Water Wastewater Total<br />
<strong>2011</strong> <strong>2011</strong> <strong>2011</strong> 2010 2010 2010<br />
$000 $000 $000 $000 $000 $000<br />
ASSETS<br />
Current<br />
Short-term deposits - - - 5,000 5,000 10,000<br />
Other current assets 40,722 46,864 87,586 10,810 13,972 24,782<br />
Total current assets 40,722 46,864 87,586 15,810 18,972 34,782<br />
Non-current<br />
Inventories 635 2,405 3,040 173 3,064 3,237<br />
Derivative financial instruments 5,429 6,856 12,285 1,849 3,435 5,284<br />
Intangibles 14,207 16,022 30,229 6,552 7,822 14,374<br />
Property, plant and equipment 3,188,117 4,500,079 7,688,196 1,366,844 1,046,269 2,413,113<br />
Total non-current assets 3,208,388 4,525,362 7,733,750 1,375,418 1,060,590 2,436,008<br />
Total assets 3,249,110 4,572,226 7,821,336 1,391,228 1,079,562 2,470,790<br />
LIABILITIES<br />
Current<br />
Current liabilities 143,791 190,116 333,907 65,086 93,191 158,277<br />
Total current liabilities 143,791 190,116 333,907 65,086 93,191 158,277<br />
Non-current<br />
Accrued expenses 4,368 4,732 9,100 - - -<br />
Provisions 524 868 1,392 533 520 1,053<br />
Borrowings 436,205 551,399 987,604 133,280 283,220 416,500<br />
Derivative financial instruments 26,126 32,984 59,110 14,104 26,194 40,298<br />
Deferred tax liability 319,452 529,376 848,828 236,508 165,541 402,049<br />
Total non-current liabilities 786,675 1,119,359 1,906,034 384,425 475,475 859,900<br />
Total liabilities 930,466 1,309,475 2,239,941 449,511 568,666 1,018,177<br />
Equity attributable to owners of the parent 2,318,644 3,262,751 5,581,395 941,717 510,896 1,452,613<br />
Total equity and liabilities 3,249,110 4,572,226 7,821,336 1,391,228 1,079,562 2,470,790<br />
STATEMENT OF CASH FLOWS BY BUSINESS UNIT<br />
FOR THE YEAR ENDED 30 JUNE <strong>2011</strong><br />
group and Company<br />
company<br />
Water Wastewater Total Water Wastewater Total<br />
<strong>2011</strong> <strong>2011</strong> <strong>2011</strong> 2010 2010 2010<br />
$000 $000 $000 $000 $000 $000<br />
Net cash flows – operating activities 59,305 116,730 176,035 35,278 39,346 74,624<br />
Net cash flows – investing activities (79,978) (112,253) (192,231) (66,748) (59,497) (126,245)<br />
Net cash flows – financing activities 7,118 8,998 16,116 31,070 19,895 50,965<br />
Net change in cash flows (13,555) 13,475 (80) (400) (256) (656)<br />
The financial statements should be read in conjunction with the accounting policies and notes on pages 74 to 105.<br />
PAGE 73<br />
<strong>2011</strong> Financial <strong>Report</strong><br />
Return to Contents page
<strong>Watercare</strong> Services Limited<br />
<strong>2011</strong> ANNUAL REPORT<br />
STATEMENT OF ACCOUNTING POLICIES<br />
FOR THE YEAR ENDED 30 JUNE <strong>2011</strong><br />
<strong>Report</strong>ing Entity<br />
The financial statements are for <strong>Watercare</strong> Services Limited, a council organisation wholly owned by Auckland Council, as defined in the Local<br />
Government Act 2002 incorporated and domiciled in New Zealand. The consolidated financial statements of the group are for the economic<br />
entity of <strong>Watercare</strong> Services Limited and, from 1 November 2010, Metrowater Community Trust (100% owned) and Auckland City Water<br />
Limited (100% owned non-trading company). The Metrowater Community Trust was formed in February 2001 to assist low income families and<br />
individuals who cannot afford to pay their water and wastewater bills and individuals who have special needs in relation to water use. Separate<br />
financial statements of the parent are not presented in these financial statements as the subsidiary financial statements are immaterial to the<br />
consolidated group, as detailed in note 11, page 87. As the consolidated group commenced on 1 November 2010 there are no<br />
group comparatives.<br />
On 1 November 2010, as the result of the Auckland Council reorganisation, <strong>Watercare</strong> Services Limited integrated the water and wastewater<br />
businesses of Metrowater Limited, Manukau Water Limited, North Shore City Council, Waitakere City Council, Rodney District Council, Papakura<br />
District Council and Franklin District Council, in accordance with the Local Government (Tamaki Makaurau Reorganisation) Act 2009, the Local<br />
Government (Auckland Council) Act 2009 and the Local Government (Auckland Transitional Provisions) Act 2010.<br />
Under this new structure <strong>Watercare</strong> Services Limited provides total water and wastewater services to the Auckland region (except Papakura)<br />
and as a result, the assets, liabilities, revenues and costs of the group have increased significantly.<br />
The group’s registered office and principal place of business is at 2 Nuffield Street, Newmarket, Auckland 1023.<br />
Statement of Compliance<br />
<strong>Watercare</strong> Services Limited is a public benefit entity (PBE) as defined under the New Zealand Equivalents to International Financial <strong>Report</strong>ing<br />
Standards (NZ IFRS). The financial statements and accounting policies comply with the specific recognition, measurement and disclosure<br />
requirements of NZ IFRS in relation to PBEs and New Zealand Generally Accepted Accounting Practice (NZGAAP).<br />
Statutory Base<br />
<strong>Watercare</strong> Services Limited is a group registered under the Companies Act 1993 and is a reporting entity as defined by the Financial <strong>Report</strong>ing<br />
Act 1993. The financial statements have been prepared in accordance with the requirements of the Financial <strong>Report</strong>ing Act 1993, the Local<br />
Government Acts 1974 and 2002, Local Government (Auckland Transitional Provisions) Act 2010 and the Companies Act 1993.<br />
Measurement Base<br />
The financial statements have been prepared on the historical cost basis, modified by the revaluation of land and buildings, certain infrastructural<br />
assets and derivative instruments as described in specific accounting policies below.<br />
Functional and Presentation Currency<br />
The financial statements are prepared in New Zealand dollars and all values are rounded to the nearest thousand, unless otherwise stated.<br />
Key Management Decisions<br />
The key areas where management has exercised its judgment in the preparation of these financial statements are as explained below:<br />
There are a number of assumptions and estimates used when performing depreciated replacement cost valuations of infrastructure assets.<br />
For example, estimates are made by determining the remaining useful life over which an asset will be depreciated, replacement costs for<br />
assets and capitalised interest. In respect of estimated useful lives, if the estimated useful lives are not accurate this would lead to the annual<br />
depreciation charge being either higher or lower in the statement of comprehensive income. To minimise the estimation risk of asset useful<br />
lives the group continually assesses the condition of infrastructural assets and their remaining useful lives. Physical inspections and condition<br />
assessments are used by the group to ensure that the condition of major assets is understood and the carrying value of an asset reflects its actual<br />
condition. See note 13, page 89 for additional information.<br />
Significant Accounting Policies<br />
The following specific accounting policies that materially affect the measurement of comprehensive income, financial position and cash flows<br />
have been applied consistently to all periods presented in these financial statements.<br />
<strong>2011</strong> Financial <strong>Report</strong><br />
1. Business Unit <strong>Report</strong>ing<br />
Business unit comprehensive income, financial position and cash flows are presented in the financial statements for water and wastewater<br />
services, reflecting the group’s legislative requirements. Revenues and expenses are apportioned to each unit on a direct basis plus an allocation<br />
of non-specific and overhead costs proportional to each unit’s staffing levels. All operations are carried out within New Zealand. There are no<br />
material transactions between the two business units.<br />
2. Basis of Consolidation<br />
The purchase method is used to prepare the consolidated financial statements, which involves adding together like items of assets, liabilities,<br />
equity, income and expenses on a line-by-line basis. All significant intragroup balances, transactions, revenues and expenses are eliminated on<br />
consolidation. The Metrowater Community Trust and Auckland City Water Limited are consolidated from the acquisition date, 1 November 2010.<br />
PAGE 74<br />
Return to Contents page
<strong>Watercare</strong> Services Limited<br />
<strong>2011</strong> ANNUAL REPORT<br />
STATEMENT OF ACCOUNTING POLICIES (continued)<br />
FOR THE YEAR ENDED 30 JUNE <strong>2011</strong><br />
3. Integration of Retail Business<br />
The group has adopted the public benefit entity exemption from NZ IFRS 3 available for local authority reorganisations where no consideration<br />
has been transferred. The group therefore, is not required to measure assets and liabilities at their fair value at acquisition date and no<br />
consideration was paid for the net assets acquired. At 1 November 2010 the net assets acquired were recorded at the accounting book value of<br />
the previous local network operators (deemed cost) in the company’s financial statements and where necessary, adjustments were made to the<br />
carrying value of the assets and liabilities being recognised in the company’s opening balance sheet to achieve consistency in the accounting<br />
policies. The contribution value of the net assets has been recorded separately in the capital reserve. See note 11, page 86 for<br />
additional information.<br />
4. Goods and Services Tax (GST)<br />
The statement of comprehensive income and the statement of financial position are stated excluding GST, with the exception of receivables<br />
and payables, which include GST. The net amount of GST recoverable from or payable to the Inland Revenue Department is included as part<br />
of receivables or payables in the statement of financial position.<br />
5. Operating Revenue<br />
The group measures revenue at the fair value of the amounts received or receivable, net of returns, trade allowances, duties and taxes paid.<br />
It accounts for revenue for the major activities as follows:<br />
Water and wastewater revenue<br />
Water revenue comprises the amounts received and receivable, including estimated amounts of unread meters at balance date for water supplied<br />
to customers in the ordinary course of business. Wastewater revenue is a combination of fixed charge and a percentage of water used. Both are<br />
shown net of prompt payment discounts and leak remissions.<br />
Provision of services<br />
Sales of services are recognised at fair value of the amounts received or receivable as the services are rendered or to reflect the percentage<br />
completion of the related services where rendered over time.<br />
Interest income<br />
Interest income is recognised using the effective interest method.<br />
Dividend income<br />
Dividend income is recognised on the date when the group’s right to receive payment is established.<br />
Development contributions, financial contributions and infrastructure growth charge<br />
Development contributions, financial contributions and infrastructure growth charges received towards the construction of property,<br />
plant and equipment are recognised at the time an application is approved and invoiced.<br />
6. Grant Expenditure<br />
The company provides funding to its subsidiary (Metrowater Community Trust) in the form of grants, which is treated as expenditure in the<br />
company’s books and as income in the Trust’s books. On consolidation this expenditure is offset by the income in the Trust’s books whilst the<br />
actual expenditure is recognised in the group accounts when the Trust incurs the expenditure.<br />
7. Finance Costs<br />
Finance costs directly attributable to the acquisition, construction or production of a qualifying asset that necessarily takes a substantial period<br />
of time to get ready for its intended use or sale are capitalised as part of the cost of that asset. All other finance costs are expensed in the period<br />
they occur. Finance costs consist of interest and other costs that are incurred in connection with the borrowing of funds.<br />
8. Business Integration Costs<br />
Costs associated with planning the integration of the water and the wastewater businesses in the Auckland region are expensed in the period<br />
in which they are incurred, except for related capital projects.<br />
9. Leases<br />
The group leases certain property, plant and equipment where the lessor effectively retains substantially all the risks and benefits of ownership.<br />
Amounts payable under the terms of these leases are recognised as an expense spread evenly over the term of the lease.<br />
10. Research and Development<br />
Research costs are expensed as incurred. Development expenditure on individual projects is capitalised and recognised as an asset when it meets<br />
the definition and criteria for capitalisation as an asset and it is probable that the group will receive future economic benefits from the asset.<br />
Assets which have finite lives are stated at cost less accumulated amortisation and are amortised on a straight-line basis over their useful lives.<br />
PAGE 75<br />
<strong>2011</strong> Financial <strong>Report</strong><br />
Return to Contents page
<strong>Watercare</strong> Services Limited<br />
<strong>2011</strong> ANNUAL REPORT<br />
STATEMENT OF ACCOUNTING POLICIES (continued)<br />
FOR THE YEAR ENDED 30 JUNE <strong>2011</strong><br />
11. Property, Plant and Equipment<br />
Classes of assets<br />
Property, plant and equipment is allocated to classes, being:<br />
• Land (including improvements)<br />
• Buildings<br />
• Pipelines<br />
• Tanks, tunnels, roads and reservoirs<br />
• Dams<br />
• Machinery<br />
• Motor vehicles<br />
• Office equipment<br />
• Work in progress<br />
Initial recognition<br />
The cost of purchased property, plant and equipment is the initial purchase price plus directly attributable costs of bringing the assets to the<br />
location and condition necessary for their intended use.<br />
Constructed assets are initially recorded as work in progress at the cost of construction (including materials and direct labour), finance costs and<br />
other direct costs until the asset is ready for productive use. Finance costs incurred during the course of construction that are attributable to a<br />
project are capitalised, using the finance rate applicable to the funding. When the asset is ready for productive use the ongoing operating and<br />
finance costs are recorded as expenses.<br />
Subsequent recognition<br />
Land and buildings are carried at fair values that reflect current market values, which is the amount that would be expected from an orderly sale,<br />
determined by an independent registered valuer at least every three years.<br />
Pipelines, tanks, tunnels, roads, reservoirs, dams and machinery are also carried at fair value, which is deemed to be depreciated replacement<br />
cost because the assets are of a specialised nature. The depreciated replacement costs are determined on the basis of an independent valuation<br />
prepared by external valuers at least every three years. The revaluation process involves assessing the current replacement cost and remaining<br />
useful lives of the specialised property, plant and equipment.<br />
Any property, plant and equipment that has been acquired after the most recent valuation is carried at cost less accumulated depreciation and<br />
impairment until the next revaluation.<br />
Motor vehicles and office equipment are carried at cost less accumulated depreciation. Work in progress is carried at cost.<br />
The changes in the value of each class of property, plant and equipment as a result of the revaluations are recorded in other comprehensive<br />
income and accumulated in a revaluation reserve. The group maintains a revaluation reserve for each class of assets. Where cumulative decreases<br />
exceed cumulative increases in the value of a class of assets, the net amount is recognised as an expense in determining the surplus or deficit for<br />
the year. Any revaluation increase is credited to the asset class revaluation reserve, except to the extent that it reverses a revaluation decrease for<br />
the same asset previously charged as an expense in determining the surplus or deficit for the year. Any accumulated depreciation at the date of<br />
the revaluation is transferred to the gross carrying amount of the asset and the asset cost is restated to the revalued amount.<br />
<strong>2011</strong> Financial <strong>Report</strong><br />
Impairment<br />
Asset carrying values are reviewed for impairment whenever events or changes in circumstances indicate the carrying amount may not be<br />
recoverable. An impairment loss is recognised if the estimated recoverable amount of an asset is less than its carrying amount. The recoverable<br />
amount is the higher of an asset’s fair value less costs to sell and value in use. For revalued assets, value in use is the depreciated replacement<br />
cost for an asset, where the future economic benefits of the asset are not primarily dependent on the asset’s ability to generate net cash inflows,<br />
and where the entity would, if deprived of the asset, replace its remaining future economic benefits. The value in use for cash-generating assets<br />
is the present value of expected future cash flows. If an asset’s carrying amount exceeds its recoverable amount, the asset is impaired and the<br />
carrying amount is written down to the recoverable amount.<br />
For revalued assets, the impairment loss is recognised in other comprehensive income to the extent that the impairment loss does not exceed the<br />
amount in the revaluation surplus for that same class of asset. The reversal of an impairment loss on a revalued asset is credited to the revaluation<br />
reserve. However, to the extent that an impairment loss on the same class of asset was previously recognised within surplus or deficit, a reversal<br />
of that impairment loss is also recognised within surplus or deficit. For assets not carried at a revalued amount the total impairment loss and the<br />
reversal of an impairment loss (for assets other than goodwill) is recognised in the surplus or deficit.<br />
PAGE 76<br />
Return to Contents page
<strong>Watercare</strong> Services Limited<br />
<strong>2011</strong> ANNUAL REPORT<br />
STATEMENT OF ACCOUNTING POLICIES (continued)<br />
FOR THE YEAR ENDED 30 JUNE <strong>2011</strong><br />
11. Property, Plant and Equipment (continued)<br />
Depreciation<br />
Depreciation is provided on a straight-line basis on all property, plant and equipment, other than freehold land, at rates calculated to allocate<br />
their cost or revalued amounts over their estimated useful lives. Assets are depreciated to a nil residual value.<br />
Asset class<br />
Range of useful<br />
lives in years for <strong>2011</strong><br />
average useful life in years<br />
<strong>2011</strong> 2010<br />
Buildings 20 to 114 65 67<br />
Pipelines 2 to 389 113 79<br />
Tanks, tunnels, roads and reservoirs 5 to 105 79 85<br />
Dams 5 to 298 189 189<br />
Machinery 2 to 174 44 40<br />
Motor vehicles 1 to 8 4 5<br />
Office equipment 1 to 20 5 8<br />
12. Intangible assets<br />
Computer software assets and network models are recorded at cost less accumulated amortisation and accumulated impairment losses.<br />
Amortisation is charged on a straight-line basis over their useful lives.<br />
Easements are recognised at cost, being the costs directly attributable in bringing the asset to its intended use. Easements have an indefinite<br />
useful life and are not amortised, but are instead tested for impairment annually.<br />
Resource Management Act consents are recorded at cost less accumulated amortisation and accumulated impairment losses. Amortisation<br />
is charged on a straight line basis.<br />
Intangible assets carrying values are reviewed at the end of each year to determine whether there is any indication that those assets have<br />
suffered an impairment loss. If any impairment loss has occurred, the carrying value of the asset is adjusted and the loss recognised in<br />
determining the surplus or deficit for the year.<br />
Asset class<br />
Range of useful<br />
lives in years for <strong>2011</strong><br />
average useful life in years<br />
<strong>2011</strong> 2010<br />
Network models 4 to 12 4 6<br />
Computer software 1 to 10 7 7<br />
Resource consents 9 to 100 33 33<br />
13. Income Tax<br />
Current tax<br />
Current tax is calculated by reference to the amount of income taxes payable or recoverable in respect of the taxable profit or loss for the year.<br />
Current tax for current and prior years is recognised as a liability (or asset) to the extent it is unpaid (or refundable).<br />
Deferred tax<br />
Deferred tax is accounted for using the comprehensive balance sheet liability method in respect of temporary differences arising from differences<br />
between the carrying amounts of assets and liabilities in the financial statements and the corresponding tax base of those items.<br />
In principle, deferred tax liabilities are recognised for all temporary differences. Deferred tax assets are recognised to the extent that it is probable<br />
that sufficient taxable amounts will be available against which deductible temporary differences or unused tax losses and tax offsets can be utilised.<br />
Current and deferred tax assets and liabilities are measured at the tax rates that are expected to apply to year(s) when the asset and liability giving<br />
rise to them are realised or settled, based on tax rates (and tax laws) that have been enacted or substantively enacted by the reporting date.<br />
14. Inventories<br />
Inventories comprise consumables, spare parts and treated water.<br />
Consumables are recorded at the lower of cost (determined on a weighted average basis) and net realisable value.<br />
Spare parts are recorded at cost less an adjustment for the reduction in economic benefits due to obsolescence. The cost of spare parts is<br />
recorded as an expense when used for repairs and maintenance on existing plant and equipment, or recorded as part of the cost of the new asset<br />
if used in the construction of new property, plant and equipment.<br />
Treated water in the network and reservoirs is recorded at the lower of cost and net realisable value.<br />
PAGE 77<br />
<strong>2011</strong> Financial <strong>Report</strong><br />
Return to Contents page
<strong>Watercare</strong> Services Limited<br />
<strong>2011</strong> ANNUAL REPORT<br />
STATEMENT OF ACCOUNTING POLICIES (continued)<br />
FOR THE YEAR ENDED 30 JUNE <strong>2011</strong><br />
15. Provisions<br />
The group provides for the cost of employees’ entitlements to annual leave, sick leave and gratuities under the terms of their employment<br />
contracts. These amounts are expected to be settled within one year and are therefore recorded in current provisions.<br />
The group provides for the liability for employees’ long service leave under the terms of their employment contracts. The liability is calculated<br />
as the present value of the expected future payments after allowing for wage and salary increases, the rate of staff turnover and term of service<br />
with the group. Long service leave is recorded in current and non-current provisions. The amount recorded in non-current provisions represents<br />
the portion which is due for payment beyond one year from the reporting date.<br />
Other provisions are recognised when the group has a present obligation as a result of a past event and it is probable that there is a future<br />
outflow of resources and the amount of the provision can be reliably measured.<br />
The amount recorded as a provision is the best estimate of the consideration required to settle the obligation at the end of each year.<br />
16. Contract Retentions<br />
Certain construction contracts entitle the group to retain specified amounts to ensure the performance of contract obligations. These retentions<br />
are recorded as a liability, and either used to remedy contract performance or paid to the contractor at the end of the retention period.<br />
17. Foreign Currencies<br />
The cost of assets purchased with foreign currencies is calculated using the exchange rate on the date of purchase. Any difference between<br />
this cost and the amount later required to settle the transaction is recognised as a foreign exchange gain or loss.<br />
Operating expenses in foreign currencies are converted at the rate of exchange on the date of the transaction.<br />
18. Financial Instruments<br />
A financial instrument is any contract that gives rise to a financial asset of one entity and a financial liability or equity instrument in another.<br />
As such, the group recognises all its financial instruments as soon as it becomes a party to the contractual provisions of the financial instrument.<br />
At each reporting date the group includes in its statement of financial position a range of financial assets that include cash and short-term<br />
deposits, trade and other receivables, and derivative instruments. Similarly it also reflects in its statement of financial position a number of<br />
financial liabilities that include bank overdrafts, trade and other payables, borrowings and derivative instruments.<br />
A derivative is a financial instrument or other contract that satisfies all of the following characteristics: its value changes in response to the change<br />
in a specified variable such as an interest rate, financial instrument price, commodity price, foreign exchange rate, index of prices or rates, credit<br />
rating or credit index; it requires no initial investment or an initial investment that is smaller than would be required for other types of similar<br />
contracts and it will be settled at some future date.<br />
Sourcing fair values<br />
For financial instruments that are traded in active markets, quoted market prices are used as a measure of fair value. Where quoted market prices<br />
do not exist, fair values are estimated using present value or other market-accepted valuation techniques, using methods and assumptions that<br />
are based on market conditions and risks existing at balance date.<br />
Recognition and measurement of financial assets<br />
Financial assets are initially measured at fair value and for the purpose of subsequent measurement, the group has categorised financial assets<br />
into the following categories. Each category determines the process of subsequent measurement and how the resulting surplus or deficit should<br />
be reflected in the statement of comprehensive income. The group does not currently have financial assets in the held to maturity and availablefor-sale<br />
categories.<br />
<strong>2011</strong> Financial <strong>Report</strong><br />
Loans and receivables<br />
The group’s cash and cash equivalents and trade and other receivables fall into this category of financial instruments. These are initially recorded<br />
at their fair value plus transaction costs because they have fixed or determinable payments that are not quoted in an active market. Fair value is<br />
estimated as the present value of future cash flows.<br />
After initial recognition, they are recorded at amortised cost using the effective interest method, less provision for impairment. The amount of<br />
impairment loss is the difference between the assets’ carrying amount and the present value of estimated future cash flows, discounted at the<br />
original effective interest rate. The amount of the impairment loss is recognised in determining the surplus or deficit for the year.<br />
The collection of trade receivables is reviewed on an ongoing basis and debts known to be uncollectible are written off. When there is objective<br />
evidence that the group will not be able to collect all amounts due according to the original terms of the receivables, a provision is made for<br />
doubtful receivables to recognise an impairment in the carrying value of receivables at balance date. This amount provided is recorded in<br />
determining surplus or deficit.<br />
PAGE 78<br />
Return to Contents page
<strong>Watercare</strong> Services Limited<br />
<strong>2011</strong> ANNUAL REPORT<br />
STATEMENT OF ACCOUNTING POLICIES (continued)<br />
FOR THE YEAR ENDED 30 JUNE <strong>2011</strong><br />
18. Financial Instruments (continued)<br />
Financial assets at fair value through profit or loss<br />
All derivative financial instruments fall into this category, except for those designated as, and effective as, hedging instruments, for which the<br />
hedge accounting requirements apply. The group does not apply hedge accounting.<br />
Financial assets carried at fair value through profit or loss are initially recorded at fair value.<br />
Financial assets can be classified as at fair value through profit or loss only if they are either classified as held for trading or upon initial<br />
recognition they are designated as at fair value through profit and loss. The group does not currently have any financial assets held for trading<br />
or designated upon initial recognition as at fair value through profit or loss.<br />
Recognition and measurement of financial liabilities<br />
Financial liabilities are initially recorded at their fair value plus transaction costs.<br />
Financial liabilities are recorded subsequently at amortised cost using the effective interest method, except for financial liabilities held for trading<br />
or designated at fair value through profit or loss. Those liabilities are recorded subsequently at fair value with gains or losses recognised in<br />
surplus or deficit.<br />
Trade and other payables represent liabilities for goods and services provided to the group prior to the end of the financial year which are unpaid.<br />
The amounts are unsecured and are usually paid within 30 days of recognition.<br />
The group does not currently have any financial liabilities held for trading or designated at fair value through profit or loss.<br />
Borrowings are recorded at fair value, net of transaction costs.<br />
Borrowings are subsequently measured at amortised cost using the effective interest method, with interest expense recognised on an effective<br />
interest basis. Fees and expenses for establishing new borrowings are amortised over the term of those borrowings using the effective interest<br />
method. Accrued interest is presented separately within accruals.<br />
Borrowings are classified as current liabilities unless the group has an unconditional right to defer settlement of the liability for at least 12 months<br />
after the reporting date.<br />
Derivative financial instruments<br />
Derivative instruments are used by the group to manage its exposures to interest rate and foreign currency risks.<br />
Derivative financial instruments are recorded at fair value in the statement of financial position and fair value changes are accounted for through<br />
surplus or deficit.<br />
Derecognition of financial instruments<br />
Financial assets are derecognised only when the contractual rights to the cash flows from the financial asset have expired, or when the financial<br />
asset and all substantial risks and rewards associated with it have been transferred.<br />
Financial liabilities are derecognised when they have either been extinguished, discharged, cancelled or have expired.<br />
19. Statement of Cash Flows<br />
For the purpose of the statement of cash flows, cash and cash equivalents include cash on hand net of outstanding bank overdrafts. The following<br />
terms are used in the statement of cash flows;<br />
• “Operating activities” are amounts received for the supply of services by the group, and payments made to employees and suppliers<br />
necessary to support those services including finance costs. Operating activities also include any transactions or events that are not<br />
investing or financing activities;<br />
• “Investing activities” are amounts paid or received for the acquisition, and disposal of property, plant and equipment and other investments not<br />
included in cash equivalents; and<br />
• “Financing activities” are the receipt and repayment of the principal on borrowings, and contributions from, and distributions to, shareholders.<br />
20. Insurance<br />
Any uninsured loss is recorded in determining the surplus or deficit for the year in which the loss is incurred. Insurance recoveries are recorded<br />
only when there is virtual certainty of receipt.<br />
PAGE 79<br />
<strong>2011</strong> Financial <strong>Report</strong><br />
Return to Contents page
<strong>Watercare</strong> Services Limited<br />
<strong>2011</strong> ANNUAL REPORT<br />
STATEMENT OF ACCOUNTING POLICIES (continued)<br />
FOR THE YEAR ENDED 30 JUNE <strong>2011</strong><br />
21. Comparatives<br />
Certain comparatives have been restated to ensure consistency with current year presentation as below:<br />
• 2010 comparatives in the statement of cash flows and in note 7, page 83 on operating cash flows have been restated to exclude GST to be<br />
consistent with the group’s parent Auckland Council.<br />
• Financial and developer contributions are not separately disclosed in the statement of comprehensive income and are instead included within<br />
total revenue and disclosed in note 1, page 81.<br />
• Items in other comprehensive income and items in revaluation reserve in note 12, page 88 are disclosed net of deferred tax and the related<br />
deferred tax is disclosed in note 9, page 85.<br />
• In the statement of financial position by business unit the split showing the categories within property, plant and equipment for comparatives<br />
is removed to be consistent with the categories presented in the group statement of financial position.<br />
22. Accounting Standards and Interpretation<br />
The group’s policy is to adopt accounting standards before they become mandatory. However, the following new accounting standard has been<br />
reviewed by the group for early adoption and has not been adopted for the current financial year:<br />
• NZ IFRS 9, Financial Instruments (effective for reporting periods beginning on or after 1 January 2013) – as NZ IFRS 9 is expected to be subject<br />
to significant amendments in future years the group has delayed adoption of this standard until the impact of future amendments is known.<br />
The impact of NZ IFRS 9 in its current state would require the group to make changes in accounting policies and disclosures relating to the<br />
groups assets or liabilities.<br />
The financial statements comply with the following new accounting standards or updated standards. The impact on the financial statements<br />
is detailed below:<br />
• FRS 44 relocates New Zealand specific disclosures from other standards to one place and revises several disclosures and Harmonisation<br />
Amendments list the amendments made to NZ IFRS to harmonise with IFRS and Australian Accounting Standards effective for accounting<br />
periods beginning on or after 1 July <strong>2011</strong> with early application permitted. As a result of early adoption, the group has elected to reduce its<br />
disclosure where appropriate.<br />
Application of the following new standards and interpretations will not have any impact on the financial statements of the group because they<br />
are not relevant to the group’s current activities or are not required.<br />
• Amendments to NZ IFRIC 14 – This interpretation is not relevant to the group as it does not offer any defined benefit superannuation plans.<br />
The group’s employees participate in the KiwiSaver scheme which is a defined contribution plan.<br />
• Amendment to NZ IAS 26 Accounting and reporting by retirement benefit plans – This amendment is not relevant to the group as it does not<br />
constitute a retirement benefit plan.<br />
• Amendment to NZ IAS 12 Income Tax – Deferred tax: Recovery of underlying assets – This amendment is not relevant to the group as it does<br />
not own any investment properties.<br />
• <strong>Annual</strong> improvements to NZ IFRS 2010 – The annual improvements made by the IASB for 2010 to various standards have been incorporated<br />
in reporting disclosures. There was no measurement impact.<br />
• Amendments to NZ IFRS 7 – Financial instruments disclosures – This amendment is not relevant to the group as there have not been any<br />
transfers of financial assets in the current year.<br />
• Amendments to NZ IFRS 27 – Separate financial statements – not applicable to public benefit entities.<br />
• Amendments to NZ IAS 28 – Investments in associates and joint ventures – not applicable to public benefit entities.<br />
• Amendments to NZ IFRS 8 – Operating segments – there is no disclosure or measurement impact.<br />
• Amendments to NZ IFRS 10 – Consolidated financial statements – not applicable to public benefit entities.<br />
• Amendments to NZ IFRS 11 – Joint arrangements – not applicable to public benefit entities.<br />
• Amendments to NZ IFRS 12 – Disclosure of interests in other entities – not applicable to public benefit entities.<br />
• Amendments to NZ IFRS 13 – Fair value measurement – not applicable to public benefit entities.<br />
• Amendments to NZ IFRS 1 – First time adoption of NZ IFRS – not applicable as the group is not first time adopter.<br />
• Amendments to NZ IAS 1 – Presentation of items of other comprehensive income (amendments to NZ IAS 1) – not applicable to public<br />
benefit entities.<br />
• Amendments to NZ IAS 19 – Employee benefits – not applicable to public benefit entities.<br />
<strong>2011</strong> Financial <strong>Report</strong><br />
Changes in Accounting Policies<br />
The group will adopt the public benefit entity exemption under NZ IAS 16 and not disclose property, plant and equipment on a historical cost<br />
basis in these financial statements. There are no other changes to accounting policies.<br />
PAGE 80<br />
Return to Contents page
<strong>Watercare</strong> Services Limited<br />
<strong>2011</strong> ANNUAL REPORT<br />
Notes to the financial statements<br />
for the year ended 30 June <strong>2011</strong><br />
1. Revenue<br />
The water and wastewater operating revenue represents the amounts invoiced to customers and the accrual of unbilled water and wastewater<br />
revenue. This revenue excludes any price adjustment.<br />
group and Company<br />
Company<br />
<strong>2011</strong> 2010<br />
$000 $000<br />
Revenue from sale of goods<br />
Retail and bulk water 131,438 71,962<br />
Revenue from rendering of services<br />
Wastewater revenue 203,773 106,922<br />
Trade waste revenue 14,038 11,763<br />
Total revenue water and wastewater 349,249 190,647<br />
Water and wastewater revenue is shown net of leak remissions and prompt payment discount (PPD).<br />
Below is a breakdown of leak remission and PPD:<br />
Water and wastewater revenue 346,358 178,884<br />
Leak remission – water (689) -<br />
Leak remission – wastewater (994) -<br />
Prompt payment discount – water (4,031) -<br />
Prompt payment discount – wastewater (5,433) -<br />
Water and wastewater revenue net of remissions and PPD 335,211 178,884<br />
Trade waste revenue 14,038 11,763<br />
Total revenue water and wastewater 349,249 190,647<br />
Other revenue<br />
Infrastructure growth charge 7,374 -<br />
Developer and financial contributions 3,945 1,111<br />
New meters and service connections 2,690 -<br />
Other revenue 9,011 6,652<br />
Dividend income 34 49<br />
Interest income 804 768<br />
Total other revenue 23,858 8,580<br />
Total revenue 373,107 199,227<br />
2. Price Adjustment<br />
Section 57(1)(a) of the Local Government (Auckland Council) Act 2009 states that the company: “must manage its operations efficiently with a<br />
view to keeping the overall costs of water supply and wastewater services to its customers (collectively) at the minimum levels consistent with<br />
the effective conduct of its undertakings and the maintenance of the long term integrity of its assets”.<br />
Pursuant to this section, the group decided that no price adjustment would be paid for the year ended 30 June <strong>2011</strong> (2010: nil).<br />
PAGE 81<br />
<strong>2011</strong> Financial <strong>Report</strong><br />
Return to Contents page
<strong>Watercare</strong> Services Limited<br />
<strong>2011</strong> ANNUAL REPORT<br />
Notes to the financial statements (continued)<br />
for the year ended 30 June <strong>2011</strong><br />
3. Operating Expenses<br />
group and Company Company<br />
<strong>2011</strong> 2010<br />
Notes $000 $000<br />
Operating expenses include:<br />
Auditors’ remuneration - annual audit fees 470 180<br />
- audit fee relating to integration of retail business 140 -<br />
- other assurance services provided 208 108<br />
Directors’ fees Note 26, page 105 560 310<br />
Environmentally significant costs - chemicals 9,329 9,813<br />
- energy 13,544 9,442<br />
Cost of consumables and spare parts consumed 3,184 8,928<br />
Increase in provision for obsolescence of inventory 251 29<br />
Operating leases and rent 3,010 2,628<br />
Increase in provision for doubtful debts 1,313 -<br />
Bad debts written off 30 2<br />
Salaries and wages - paid to employees 46,480 33,166<br />
- capitalised on construction of property, plant and equipment (20,598) (19,429)<br />
- expensed in determining surplus or deficit for the year 25,882 13,737<br />
Auditors’ remuneration for other assurance services included the review of financial and information systems. Prior year other assurance services<br />
included the review of the activities associated with the integration of Auckland water retailers and company financial and information systems.<br />
4. Depreciation and Amortisation<br />
group and Company Company<br />
<strong>2011</strong> 2010<br />
$000 $000<br />
Buildings 2,720 2,296<br />
Pipelines 85,941 24,265<br />
Tanks, tunnels, roads and reservoirs 12,984 10,740<br />
Dams 1,910 1,749<br />
Machinery 31,740 24,415<br />
Motor vehicles 334 491<br />
Office equipment 1,447 1,288<br />
Network models 1,109 614<br />
Computer software 4,693 2,383<br />
Resource consents 748 514<br />
Total depreciation and amortisation 143,626 68,755<br />
5. Finance Costs<br />
group and Company Company<br />
<strong>2011</strong> 2010<br />
$000 $000<br />
Interest on bank overdraft and borrowings, paid and payable 65,821 37,348<br />
<strong>2011</strong> Financial <strong>Report</strong><br />
Capitalised interest on construction of property, plant and equipment (<strong>2011</strong>: 6.79%, 2010: 7.09%) (4,714) (5,835)<br />
Net finance costs 61,107 31,513<br />
PAGE 82<br />
Return to Contents page
<strong>Watercare</strong> Services Limited<br />
<strong>2011</strong> ANNUAL REPORT<br />
Notes to the financial statements (continued)<br />
for the year ended 30 June <strong>2011</strong><br />
6. Revaluation of Derivative Financial Instruments<br />
group and Company Company<br />
<strong>2011</strong> 2010<br />
$000 $000<br />
Interest rate swaps contracts loss 12,593 21,289<br />
Forward foreign exchange contracts loss/(gain) 974 (806)<br />
Net revaluation loss 13,567 20,483<br />
7. Operating Cash Flows<br />
group and Company Company<br />
<strong>2011</strong> 2010<br />
$000 $000<br />
Reconciliation of net deficit after tax to net cash flows from operating activities<br />
Net deficit for the year (12,333) (27,709)<br />
Non-cash and non-operating items:<br />
Depreciation and amortisation 143,626 68,755<br />
Redundant assets written off and gain or loss on disposal 2,556 2,704<br />
Contributions towards cost of constructing property, plant and equipment (3,945) (1,111)<br />
Deferred tax 4,438 11,311<br />
Movements in working capital:<br />
(Increase)/decrease in assets:<br />
Inventories (1,556) (745)<br />
Trade and other receivables 16,060 (1,194)<br />
Derivative financial instruments – asset (7,393) 8,369<br />
Prepaid expenses 258 (823)<br />
Increase/(decrease) in liabilities:<br />
Trade and other payables 15,860 165<br />
Derivative financial instruments – liability 20,960 12,114<br />
Payables relating to investing activities 574 1,597<br />
Provisions (3,070) 195<br />
Other accrued expenses - 996<br />
Net cash flows from operating activities 176,035 74,624<br />
Comparative figures for the 2010 year have been adjusted to exclude GST to be consistent with the current year figures.<br />
PAGE 83<br />
<strong>2011</strong> Financial <strong>Report</strong><br />
Return to Contents page
<strong>Watercare</strong> Services Limited<br />
<strong>2011</strong> ANNUAL REPORT<br />
Notes to the financial statements (continued)<br />
for the year ended 30 June <strong>2011</strong><br />
8. Income Tax Expense<br />
group and Company Company<br />
<strong>2011</strong> 2010<br />
$000 $000<br />
Operating deficit before tax (7,895) (16,398)<br />
Income tax calculated at current rate of 30% (2,368) (4,919)<br />
Dividend income exempt from taxation (2) -<br />
Non-deductible expenses 377 255<br />
Imputation credits on dividends received (14) (21)<br />
Prior year and other adjustments (551) 736<br />
Tax effect of non-deductible items and prior period adjustments (190) 970<br />
Tax depreciation on buildings acquired on integration being non-deductible from 1 July <strong>2011</strong> 6,064 -<br />
Tax depreciation on buildings being non-deductible from 1 July <strong>2011</strong> - 14,037<br />
Deferred tax as a result of reducing the corporate tax rate from 30% to 28% from 1 July <strong>2011</strong> 932 1,223<br />
Tax effect of non-recurring items 6,996 15,260<br />
Income tax expense 4,438 11,311<br />
Represented by:<br />
Deferred tax 4,438 11,311<br />
Income tax expense 4,438 11,311<br />
Imputation credits<br />
Balance at beginning of year 30,082 30,061<br />
Imputation credits attached to dividends received 14 21<br />
Total imputation credits 30,096 30,082<br />
The imputation credit account is a memorandum account and does not form part of the statement of financial position.<br />
<strong>2011</strong> Financial <strong>Report</strong><br />
PAGE 84<br />
Return to Contents page
<strong>Watercare</strong> Services Limited<br />
<strong>2011</strong> ANNUAL REPORT<br />
Notes to the financial statements (continued)<br />
for the year ended 30 June <strong>2011</strong><br />
9. Deferred Tax Liability<br />
group and Company Company<br />
<strong>2011</strong> 2010<br />
$000 $000<br />
Balance at I July 2010 402,049 420,666<br />
Deferred tax arising on integration recorded in capital reserve 301,613 -<br />
Deferred tax recognised in other comprehensive income – resulting from the revaluation of property, plant and equipment 140,728 (167)<br />
Deferred tax recognised in other comprehensive income, resulting from transfer<br />
to retained earnings relating to disposal of property, plant and equipment 1,520 394<br />
Deferred tax recognised in other comprehensive income, resulting from transfer<br />
from revaluation reserve relating to disposal of property, plant and equipment (1,520) (394)<br />
Deferred tax recognised in the deficit for the year (2,558) (3,949)<br />
Tax depreciation on buildings acquired on integration being non-deductible from 1 July <strong>2011</strong> 6,064 -<br />
Tax depreciation on buildings being non-deductible from 1 July <strong>2011</strong> recognised in the deficit for the year - 14,037<br />
Deferred tax on property, plant and equipment due to asset revaluation as a result of the reduction of the corporate<br />
tax rate from 30% to 28% from 1 July <strong>2011</strong> recognised in other comprehensive income - (29,761)<br />
Deferred tax on tax losses and property, plant and equipment as a result of the reduction of the corporate<br />
tax rate from 30% to 28% from 1 July <strong>2011</strong> recognised in the deficit for the year 932 1,223<br />
Balance at 30 June <strong>2011</strong> 848,828 402,049<br />
The balance relates to:<br />
Depreciation temporary differences 967,457 423,395<br />
Provisions and accrued expenses temporary differences (15,652) (12,405)<br />
Tax losses (102,977) (8,941)<br />
Total deferred tax liability 848,828 402,049<br />
The group’s subsidiary, Metrowater Community Trust, is exempt from tax, and the group’s other subsidiary Auckland City Water Limited<br />
is a non-trading company.<br />
The depreciation temporary differences for property, plant and equipment arise because the carrying value of property, plant and equipment<br />
is higher for accounting purposes than for taxation purposes, for example due to:<br />
• The revaluation of certain assets; and<br />
• The group’s depreciation rates being lower than those permitted by tax legislation.<br />
The provisions and accrued expenses temporary differences principally relate to the mark-to-market revaluation of financial instruments.<br />
These expenses have been recognised for accounting purposes but cannot be deducted for tax purposes until the amounts become payable.<br />
Under Section 83 of the Local Government (Auckland Transitional Provisions) Act 2010 the company integrated the closing tax position of<br />
Metrowater Limited and Manukau Water Limited. Additionally, the closing accounting book value for all assets inherited from the Councils was<br />
legislated to be the opening tax book value of the company at 1 November 2010.<br />
10. Issued Capital<br />
The total number of authorised and issued shares is 260,693,164 (2010: 260,693,164) ordinary shares of $1 each. All ordinary issued shares<br />
are fully paid and carry equal voting rights to:<br />
• one vote on a poll at a meeting of the company on any resolution; and<br />
• an equal share in the distribution of the surplus assets of the company.<br />
Under Section 57(1)(b) of the Local Government (Auckland Council) Act 2009 the company must not pay any dividend or distribute any surplus<br />
in any way, directly or indirectly to its shareholder.<br />
The capital management policy of the group is detailed in note 21, page 102.<br />
PAGE 85<br />
<strong>2011</strong> Financial <strong>Report</strong><br />
Return to Contents page
<strong>Watercare</strong> Services Limited<br />
<strong>2011</strong> ANNUAL REPORT<br />
Notes to the financial statements (continued)<br />
for the year ended 30 June <strong>2011</strong><br />
11. Integration of Retail Business<br />
On 1 November 2010 the retail water and wastewater businesses in the Auckland region were integrated as below into the company as part<br />
of the Auckland local body reorganisation:<br />
Business integrated<br />
Metrowater Limited<br />
Manukau Water Limited<br />
North Shore City Council<br />
Waitakere City Council<br />
Rodney District Council<br />
Franklin District Council<br />
Papakura District Council<br />
Auckland City Council<br />
Principal activity<br />
retail water and wastewater services<br />
retail water and wastewater services<br />
retail water and wastewater services<br />
retail water and wastewater services<br />
retail water and wastewater services<br />
retail water and wastewater services<br />
retail water and wastewater services<br />
retail water and wastewater services<br />
Subsidiaries acquired<br />
Metrowater Community Trust<br />
Auckland City Water Limited<br />
Principal activity<br />
assists water users (low income or special water usage needs)<br />
Non-trading company<br />
Businesses integrated<br />
Manukau North Waitakere Rodney Franklin Auckland Papakura Auckland<br />
Metrowater Water Shore City City District District City District Regional Adjustlimited<br />
Limited Council Council Council Council Council Council Council ments Total<br />
$000 $000 $000 $000 $000 $000 $000 $000 $000 $000 $000<br />
Current assets<br />
Cash and bank balances - 11,953 - - - - - - - - 11,953<br />
Trade and other receivables 32,604 32,946 9,485 9,409 7,251 729 - - - - 92,424<br />
Inventories - - 72 - - - - - - - 72<br />
Non-current assets<br />
Property, plant and equipment 1,386,590 1,019,143 1,204,462 482,515 323,940 154,985 70,418 84,111 - 8,799 4,734,963<br />
Intangible assets 4,541 2,368 459 - - - - - - - 7,368<br />
Current liabilities<br />
Bank overdraft (5,605) - - - - - - - - - (5,605)<br />
Trade and other payables (17,636) (11,869) (1,293) (1,382) (305) (61) - (9,534) - - (42,080)<br />
Retentions (660) (495) (2,494) (213) (247) (263) - - - - (4,372)<br />
Employee benefit liabilities (776) (351) (524) (208) (64) (18) - - - - (1,941)<br />
Non-current liabilities<br />
Borrowings (215,000) (134,368) (95,489) (145,428) (63,015) (21,977) (22,436) (8,297) (6,048) - (712,058)<br />
Deferred tax liability (279,537) (19,612) - - - - - - - (2,464) (301,613)<br />
Net assets integrated 904,521 899,715 1,114,678 344,693 267,560 133,395 47,982 66,280 (6,048) 6,335 3,779,111<br />
Capital reserve (904,521) (899,715) (1,114,678) (344,693) (267,560) (133,395) (47,982) (66,280) 6,048 (6,335) (3,779,111)<br />
<strong>2011</strong> Financial <strong>Report</strong><br />
PAGE 86<br />
Return to Contents page
<strong>Watercare</strong> Services Limited<br />
<strong>2011</strong> ANNUAL REPORT<br />
Notes to the financial statements (continued)<br />
for the year ended 30 June <strong>2011</strong><br />
11. Integration of Retail Business (continued)<br />
Adjustments for accounting policy differences:<br />
The net assets of the integrated companies were transferred into the financial statements of the company at net book value and subsequently<br />
adjusted for differences in accounting policies as explained below. See accounting policy 3 on integration of retail business.<br />
The company’s policy is to capitalise finance costs incurred during the course of construction that are attributable to a project using the finance<br />
rate applicable to the funding. To achieve consistency between the company’s policy and the integrated businesses, finance costs attributable<br />
to the integrated property, plant and equipment were estimated using the depreciated replacement cost method and capitalised as at<br />
1 November 2010. This resulted in an increase of $8.8 million to property, plant and equipment with an increase to deferred tax liability<br />
of $2.5 million and a net increase of $6.3 million to capital reserve as shown under adjustments above.<br />
There were no other adjustments made to achieve consistency in accounting policies.<br />
Summary of assets and liabilities acquired<br />
The group acquired two subsidiaries, Metrowater Community Trust and Auckland City Water Limited (non-trading company) under the Local<br />
Government (Tamaki Makaurau Reorganisation) Act 2009, the Local Government (Auckland Council) Act 2009 and the Local Government<br />
(Auckland Transitional Provisions) Act 2010. The net assets acquired from the subsidiaries as at 1 November 2010 are as below:<br />
Metrowater Auckland City<br />
community Trust Water Limited total<br />
$’000 $’000 $’000<br />
Subsidiaries acquired<br />
Current assets<br />
Cash and bank balances 51 - 51<br />
Trade and other receivables 90 - 90<br />
Current Liabilities<br />
Trade and other payables (10) - (10)<br />
Net assets acquired 131 - 131<br />
The group disclosures in these financial statements represent the consolidated numbers of <strong>Watercare</strong> Services Limited (company) and its<br />
subsidiary Metrowater Community Trust. The net assets of Metrowater Community Trust at balance date are immaterial to the consolidated<br />
financial position of the group and comprise of a cash balance of $32,084 and accrued expenses of $15,206.<br />
PAGE 87<br />
<strong>2011</strong> Financial <strong>Report</strong><br />
Return to Contents page
<strong>Watercare</strong> Services Limited<br />
<strong>2011</strong> ANNUAL REPORT<br />
Notes to the financial statements (continued)<br />
for the year ended 30 June <strong>2011</strong><br />
12. Revaluation Reserves<br />
group and Company Company<br />
<strong>2011</strong> 2010<br />
$000 $000<br />
Balances at beginning of year 1,071,655 1,043,205<br />
Asset impairment – net of tax - (390)<br />
Tax rate adjustment (30% to 28%) - 29,761<br />
Revaluation – net of deferred tax 361,873 -<br />
Transferred to retained earnings on disposal of property, plant and equipment – net of tax (3,909) (921)<br />
Total revaluation reserves 1,429,619 1,071,655<br />
Comprising:<br />
Land 48,517 47,163<br />
Buildings 31,953 33,319<br />
Pipelines 844,715 569,176<br />
Tanks, tunnels, roads and reservoirs 281,705 266,364<br />
Dams 79,171 69,940<br />
Machinery 143,558 85,693<br />
Total revaluation reserves 1,429,619 1,071,655<br />
Analysis:<br />
Land<br />
Balances at beginning of year 47,163 47,163<br />
Revaluation 1,354 -<br />
Total land revaluation reserves 48,517 47,163<br />
Buildings<br />
Balances at beginning of year 33,319 32,341<br />
Tax rate adjustment (30% to 28%) - 967<br />
Revaluation (1,080) -<br />
Transferred to retained earnings on disposal of property, plant and equipment – net of tax (286) 11<br />
Total buildings revaluation reserves 31,953 33,319<br />
Pipelines<br />
Balances at beginning of year 569,176 553,167<br />
Asset impairment - (557)<br />
Tax rate adjustment (30% to 28%) - 16,540<br />
Revaluation 277,625 -<br />
Deferred tax on asset impairment - 167<br />
Transferred to retained earnings on disposal of property, plant and equipment – net of tax (2,086) (141)<br />
Total pipelines revaluation reserves 844,715 569,176<br />
Tanks, tunnels, roads and reservoirs<br />
Balances at beginning of year 266,364 258,630<br />
Tax rate adjustment (30% to 28%) - 7,735<br />
Revaluation 13,556 -<br />
Transferred to retained earnings on disposal of property, plant and equipment – net of tax 1,785 (1)<br />
Total tanks, tunnels, roads and reservoirs revaluation reserves 281,705 266,364<br />
Dams<br />
Balances at beginning of year 69,940 67,941<br />
Tax rate adjustment (30% to 28%) - 2,032<br />
Revaluation 9,235 -<br />
Reclassification - (33)<br />
Transferred to retained earnings on disposal of property, plant and equipment – net of tax (4) -<br />
Total dams revaluation reserves 79,171 69,940<br />
<strong>2011</strong> Financial <strong>Report</strong><br />
PAGE 88<br />
Machinery<br />
Balances at beginning of year 85,693 83,963<br />
Tax rate adjustment (30% to 28%) - 2,487<br />
Revaluation 61,183 -<br />
Reclassification - 33<br />
Transferred to retained earnings on disposal of property, plant and equipment – net of tax (3,318) (790)<br />
Total machinery revaluation reserves 143,558 85,693<br />
The revaluation reserve arises on the revaluation of property, plant and equipment. Where revalued property, plant and equipment are sold,<br />
the portion of the revaluation reserve that relates to that asset, and is effectively realised, is transferred directly to retained earnings.<br />
Return to Contents page
<strong>Watercare</strong> Services Limited<br />
<strong>2011</strong> ANNUAL REPORT<br />
Notes to the financial statements (continued)<br />
for the year ended 30 June <strong>2011</strong><br />
13. Property, Plant and Equipment<br />
Property, plant and equipment – movement in gross carrying value<br />
company 1 November group and<br />
2010 2010 Company <strong>2011</strong><br />
opening value Integration Additions Disposals Depreciation Revaluation Reclassification Closing value<br />
$000 $000 $000 $000 $000 $000 $000 $000<br />
Land 75,162 41,133 83 (288) - 1,880 1,369 119,339<br />
Buildings 99,367 17,145 3,016 (71) - (6,396) 291 113,352<br />
Pipelines 887,353 4,253,327 61,123 (2,889) - 279,026 14 5,477,954<br />
Tanks, tunnels, roads and reservoirs 625,932 48,359 9,266 (1,189) - (3,760) 1,464 680,072<br />
Dams 190,850 1,880 8,505 - - 9,240 - 210,475<br />
Machinery 439,819 307,895 26,936 (1,485) - 23,853 (1,634) 795,384<br />
Motor vehicles 4,358 272 45 (493) - - - 4,182<br />
Office equipment 9,965 1,519 3,365 (313) - - (1,532) 13,004<br />
2,332,806 4,671,530 112,339 (6,728) - 303,843 (28) 7,413,762<br />
Work in progress 160,441 63,432 64,415 - - - - 288,288<br />
Gross carrying value 2,493,247 4,734,962 176,754 (6,728) - 303,843 (28) 7,702,050<br />
Property, plant and equipment – movement in accumulated depreciation<br />
company 1 November group and<br />
2010 2010 Company <strong>2011</strong><br />
opening value Integration Additions Disposals Depreciation Revaluation Reclassification Closing value<br />
$000 $000 $000 $000 $000 $000 $000 $000<br />
Buildings (2,303) - - 71 (2,720) 4,896 (43) (99)<br />
Pipelines (24,955) - - 1,614 (85,941) 106,563 3 (2,716)<br />
Tanks, tunnels, roads and reservoirs (10,779) - - 1,189 (12,984) 22,585 (67) (56)<br />
Dams (1,749) - - - (1,910) 3,588 - (71)<br />
Machinery (29,762) - - 921 (31,740) 61,125 (1,079) (535)<br />
Motor vehicles (3,572) - - 492 (334) - - (3,414)<br />
Office equipment (7,014) - - 312 (1,447) - 1,186 (6,963)<br />
Accumulated depreciation (80,134) - - 4,599 (137,076) 198,757 - (13,854)<br />
Property, plant and equipment – movement in net book values including revaluation<br />
company 1 November group and<br />
2010 2010 Company <strong>2011</strong><br />
opening value Integration Additions Disposals Depreciation Revaluation Reclassification Closing value<br />
$000 $000 $000 $000 $000 $000 $000 $000<br />
Land 75,162 41,133 83 (288) - 1,880 1,369 119,339<br />
Buildings 97,064 17,145 3,016 - (2,720) (1,500) 248 113,253<br />
Pipelines 862,398 4,253,327 61,123 (1,275) (85,941) 385,589 17 5,475,238<br />
Tanks, tunnels, roads and reservoirs 615,153 48,359 9,266 - (12,984) 18,825 1,397 680,016<br />
Dams 189,101 1,880 8,505 - (1,910) 12,828 - 210,404<br />
Machinery 410,057 307,895 26,936 (564) (31,740) 84,978 (2,713) 794,849<br />
Motor vehicles 786 272 45 (1) (334) - - 768<br />
Office equipment 2,951 1,519 3,365 (1) (1,447) - (346) 6,041<br />
2,252,672 4,671,530 112,339 (2,129) (137,076) 502,600 (28) 7,399,908<br />
Work in progress 160,441 63,432 64,415 - - - - 288,288<br />
Net book value 2,413,113 4,734,962 176,754 (2,129) (137,076) 502,600 (28) 7,688,196<br />
The reclassification of assets between categories results from the ongoing project to improve asset data quality. The predominant reason for<br />
reclassification is to split broadly categorised assets into their component assets.<br />
It is not practical to reclassify the prior year comparatives, due to the size of the asset register.<br />
<strong>2011</strong> Financial <strong>Report</strong><br />
PAGE 89<br />
Return to Contents page
<strong>Watercare</strong> Services Limited<br />
<strong>2011</strong> ANNUAL REPORT<br />
Notes to the financial statements (continued)<br />
for the year ended 30 June <strong>2011</strong><br />
13. Property, Plant and Equipment (continued)<br />
Comparatives<br />
Property, plant and equipment – movement in gross carrying value<br />
company<br />
company<br />
2009 2010<br />
opening value Additions Disposals Depreciation Impairment Reclassification Closing value<br />
$000 $000 $000 $000 $000 $000 $000<br />
Land 75,162 - - - - - 75,162<br />
Buildings 88,724 10,643 - - - - 99,367<br />
Pipelines 851,540 36,612 (242) - (557) - 887,353<br />
Tanks, tunnels, roads and reservoirs 545,031 80,901 - - - - 625,932<br />
Dams 190,908 124 (1) - - (181) 190,850<br />
Machinery 404,362 37,348 (2,072) - - 181 439,819<br />
Motor vehicles 3,730 767 (139) - - - 4,358<br />
Office equipment 10,705 776 (1,516) - - - 9,965<br />
2,170,162 167,171 (3,970) - (557) - 2,332,806<br />
Work in progress 204,288 (43,847) - - - - 160,441<br />
Gross carrying value 2,374,450 123,324 (3,970) - (557) - 2,493,247<br />
Property, plant and equipment – movement in accumulated depreciation<br />
company<br />
company<br />
2009 2010<br />
opening value Additions Disposals Depreciation Impairment Reclassification Closing value<br />
$000 $000 $000 $000 $000 $000 $000<br />
Land - - - - - - -<br />
Buildings (7) - - (2,296) - - (2,303)<br />
Pipelines (697) - 7 (24,265) - - (24,955)<br />
Tanks, tunnels, roads and reservoirs (39) - - (10,740) - - (10,779)<br />
Dams - - - (1,749) - - (1,749)<br />
Machinery (5,883) - 536 (24,415) - - (29,762)<br />
Motor vehicles (3,216) - 135 (491) - - (3,572)<br />
Office equipment (7,239) - 1,513 (1,288) - - (7,014)<br />
Accumulated depreciation (17,081) - 2,191 (65,244) - - (80,134)<br />
Property, plant and equipment – movement in net book values including revaluation<br />
company<br />
company<br />
2009 2010<br />
opening value Additions Disposals Depreciation Impairment Reclassification Closing value<br />
$000 $000 $000 $000 $000 $000 $000<br />
Land 75,162 - - - - - 75,162<br />
Buildings 88,717 10,643 - (2,296) - - 97,064<br />
Pipelines 850,843 36,612 (235) (24,265) (557) - 862,398<br />
Tanks, tunnels, roads and reservoirs 544,992 80,901 - (10,740) - - 615,153<br />
Dams 190,908 124 (1) (1,749) - (181) 189,101<br />
<strong>2011</strong> Financial <strong>Report</strong><br />
PAGE 90<br />
Machinery 398,479 37,348 (1,536) (24,415) - 181 410,057<br />
Motor vehicles 514 767 (4) (491) - - 786<br />
Office equipment 3,466 776 (3) (1,288) - - 2,951<br />
2,153,081 167,171 (1,779) (65,244) (557) - 2,252,672<br />
Work in progress 204,288 (43,847) - - - - 160,441<br />
Net book value 2,357,369 123,324 (1,779) (65,244) (557) - 2,413,113<br />
Return to Contents page
<strong>Watercare</strong> Services Limited<br />
<strong>2011</strong> ANNUAL REPORT<br />
Notes to the financial statements (continued)<br />
for the year ended 30 June <strong>2011</strong><br />
13. Property, Plant and Equipment (continued)<br />
All assets subject to valuation are independently valued at least every three years. The most recent valuation was completed at 30 June<br />
<strong>2011</strong>. ANA Group completed the valuation in association with Beca Valuations Limited (Beca) who completed a peer review of the work. The<br />
assumptions used in determining the depreciated replacement cost of pipelines, tanks, roads, tunnels, reservoirs, dams and machinery were that:<br />
• construction costs based on recent contract-based construction work and the unit rates reflect the costs of replacing assets;<br />
• the useful lives of assets are calculated as the lesser of their physical life or the point where the asset is to be replaced for economic reasons;<br />
• the capital price goods index (CPGI) has been used where indexation is appropriate. At the time of valuation the CPGI was available to the<br />
March <strong>2011</strong> quarter; and<br />
• capitalised interest has been applied to qualifying asset types in accordance with the estimated construction period and applicable cost of debt.<br />
Beca completed the valuation of land and buildings. The land valuation was based on relevant market prices and buildings were valued using the<br />
depreciated replacement cost.<br />
The Local Government Acts 1974 and 2002 restrict the business activities of the group and effectively prevent selling of key assets. Many of the<br />
assets are specialised in nature, reflecting the activities of the group. As there is no active market for such assets and the income from them is<br />
not determined by the market, property, plant and equipment, other than land, buildings, motor vehicles and office equipment, are revalued to<br />
depreciated replacement cost, which reflects their deemed fair values.<br />
Each year, other than in the years in which the assets are revalued, the group assesses whether there has been any material change in the value of<br />
property, plant and equipment. The movement in asset values between June 2009 and June 2010 was assessed using indices deemed suitable<br />
by AECOM and Darroch registered valuers. The increase in asset value of 1.1% was not considered material by management and accordingly the<br />
assets were not revalued at 30 June 2010.<br />
group and Company<br />
Company<br />
<strong>2011</strong> 2010<br />
$000 $000<br />
Work in progress relates to the following projects:<br />
Water treatment plants 17,884 12,587<br />
Wastewater treatment plant 43,857 9,175<br />
Wastewater pump stations and sewers 116,519 42,440<br />
Watermains, pump stations and reservoirs 73,837 60,630<br />
Dams and raw water transmission pipelines 8,205 21,032<br />
Other 27,986 14,577<br />
Total work in progress 288,288 160,441<br />
14. Intangible Assets<br />
Intangibles – movement in gross carrying value<br />
company 1 November group and Company<br />
2010 2010 <strong>2011</strong><br />
opening value Integration Additions Disposals Amortisation Reclassifications Closing value<br />
$000 $000 $000 $000 $000 $000 $000<br />
Network models 3,301 3,346 - (673) - - 5,974<br />
Computer software 13,960 258 14,994 (784) - 28 28,456<br />
Resource consents 14,619 3,764 17 - - - 18,400<br />
Easements 484 - - - - - 484<br />
Gross carrying value 32,364 7,368 15,011 (1,457) - 28 53,314<br />
Intangibles – movement in accumulated amortisation<br />
company 1 November group and Company<br />
2010 2010 <strong>2011</strong><br />
opening value Integration Additions Disposals Amortisation Reclassifications Closing value<br />
$000 $000 $000 $000 $000 $000 $000<br />
Network models (2,137) - - 885 (1,109) - (2,361)<br />
Computer software (11,761) - - 570 (4,693) - (15,884)<br />
Resource consents (4,092) - - - (748) - (4,840)<br />
Easements - - - - - - -<br />
Accumulated amortisation (17,990) - - 1,455 (6,550) - (23,085)<br />
<strong>2011</strong> Financial <strong>Report</strong><br />
PAGE 91<br />
Return to Contents page
<strong>Watercare</strong> Services Limited<br />
<strong>2011</strong> ANNUAL REPORT<br />
Notes to the financial statements (continued)<br />
for the year ended 30 June <strong>2011</strong><br />
14. Intangible Assets (continued)<br />
Intangibles – movement in net book values<br />
company 1 November group and Company<br />
2010 2010 <strong>2011</strong><br />
opening value Integration Additions Disposals Amortisation Reclassifications Closing value<br />
$000 $000 $000 $000 $000 $000 $000<br />
Network models 1,164 3,346 - 212 (1,109) - 3,613<br />
Computer software 2,199 258 14,994 (214) (4,693) 28 12,572<br />
Resource consents 10,527 3,764 17 - (748) - 13,560<br />
Easements 484 - - - - - 484<br />
Net book value 14,374 7,368 15,011 (2) (6,550) 28 30,229<br />
Intangible Assets – Comparatives<br />
Intangibles – movement in gross carrying value<br />
company<br />
company<br />
2009 2010<br />
opening value Additions Disposals Amortisation Closing value<br />
$000 $000 $000 $000 $000<br />
Network models 3,101 301 (101) - 3,301<br />
Computer software 14,522 1,041 (1,603) - 13,960<br />
Resource consents 14,379 240 - - 14,619<br />
Easements 484 - - - 484<br />
Gross carrying value 32,486 1,582 (1,704) - 32,364<br />
Intangibles – movement in accumulated amortisation<br />
company<br />
company<br />
2009 2010<br />
opening value Additions Disposals Amortisation Closing value<br />
$000 $000 $000 $000 $000<br />
Network models (1,523) - - (614) (2,137)<br />
Computer software (10,977) - 1,599 (2,383) (11,761)<br />
Resource consents (3,611) - 33 (514) (4,092)<br />
Easements - - - - -<br />
Accumulated amortisation (16,111) - 1,632 (3,511) (17,990)<br />
Intangibles – movement in net book values<br />
company<br />
company<br />
2009 2010<br />
opening value Additions Disposals Amortisation Closing value<br />
$000 $000 $000 $000 $000<br />
Network models 1,578 301 (101) (614) 1,164<br />
Computer software 3,544 1,041 (3) (2,383) 2,199<br />
Resource consents 10,768 240 33 (514) 10,527<br />
Easements 484 - - - 484<br />
Net book value 16,375 1,582 (72) (3,511) 14,374<br />
<strong>2011</strong> Financial <strong>Report</strong><br />
PAGE 92<br />
Return to Contents page
<strong>Watercare</strong> Services Limited<br />
<strong>2011</strong> ANNUAL REPORT<br />
Notes to the financial statements (continued)<br />
for the year ended 30 June <strong>2011</strong><br />
15. Inventories<br />
group and Company Company<br />
<strong>2011</strong> 2010<br />
$000 $000<br />
Spare parts at cost 4,530 5,649<br />
Consumables at cost 2,011 1,392<br />
Treated water at cost 710 214<br />
Work in progress 838 -<br />
Project stock 1,045 -<br />
Provision for obsolescence (2,002) (1,751)<br />
Total inventory 7,132 5,504<br />
Represented as:<br />
Current inventory 4,092 2,267<br />
Non-current inventory 3,040 3,237<br />
Total inventory 7,132 5,504<br />
16. Trade and Other Receivables<br />
Current<br />
group and Company Company<br />
<strong>2011</strong> 2010<br />
$000 $000<br />
Trade receivables – related parties 2,985 16,223<br />
Trade receivables – other 38,124 2,824<br />
Provision for doubtful debts (3,128) -<br />
37,981 19,047<br />
Other receivables 1,380 -<br />
Unbilled revenue accrual 40,147 -<br />
Total trade and other receivables 79,508 19,047<br />
17. Trade and Other Payables<br />
group and Company Company<br />
<strong>2011</strong> 2010<br />
$000 $000<br />
Current<br />
Contract retentions 11,045 4,591<br />
Trade creditors – other 3,794 3,162<br />
Trade creditors – related parties 1,201 546<br />
Other payables 117 -<br />
Total trade and other payables 16,157 8,299<br />
PAGE 93<br />
<strong>2011</strong> Financial <strong>Report</strong><br />
Return to Contents page
<strong>Watercare</strong> Services Limited<br />
<strong>2011</strong> ANNUAL REPORT<br />
Notes to the financial statements (continued)<br />
for the year ended 30 June <strong>2011</strong><br />
18. Accrued Expenses<br />
group and Company<br />
Company<br />
<strong>2011</strong> 2010<br />
$000 $000<br />
Current<br />
Capital work in progress accruals 21,146 20,880<br />
Interest payable 11,013 4,865<br />
Income received in advance 4,896 -<br />
Operating costs accruals 30,872 7,272<br />
Total current accrued expenses 67,927 33,017<br />
Non-current<br />
Income received in advance 9,100 -<br />
Total non-current accrued expenses 9,100 -<br />
Total accrued expenses 77,027 33,017<br />
Income received in advance includes $9.4 million relating to the amount received in accordance with the franchise fee agreement between the<br />
network operator United Water International Pty Limited (United Water) and Papakura District Council (integrated into the company on<br />
1 November 2010). The franchise agreement grants the operator, the right to use the fixed utility systems owned by the group for the provision<br />
of water and wastewater services within the Papakura district. Under the franchise agreement United Water is responsible for upgrading and<br />
maintaining the network so that at the end of the contract period, the network shall be in a better overall condition than the condition at the time<br />
the contract was commenced. The $13,000,000 fee received at the commencement of the agreement covers the right to use the assets for a<br />
50-year period and is recognised as revenue evenly over the term of the agreement.<br />
19. Provisions<br />
group and Company<br />
<strong>2011</strong> 2010<br />
$000 $000<br />
Current<br />
Employee entitlements 3,790 2,498<br />
Decommissioning costs 847 3,276<br />
Other provisions 159 490<br />
Total current provisions 4,796 6,264<br />
Non-current<br />
Employee entitlements 1,392 1,053<br />
Total non-current provisions 1,392 1,053<br />
Total provisions 6,188 7,317<br />
Company<br />
employee Decommissioning Other<br />
entitlements costs provisions Total<br />
$000 $000 $000 $000<br />
Balance at 1 July 2010 3,551 3,276 490 7,317<br />
Additions during the year 5,300 847 159 6,306<br />
Reductions resulting from payments (3,669) (3,276) (490) (7,435)<br />
Balance at 30 June <strong>2011</strong> 5,182 847 159 6,188<br />
<strong>2011</strong> Financial <strong>Report</strong><br />
PAGE 94<br />
Return to Contents page
<strong>Watercare</strong> Services Limited<br />
<strong>2011</strong> ANNUAL REPORT<br />
Notes to the financial statements (continued)<br />
for the year ended 30 June <strong>2011</strong><br />
20. Borrowings<br />
group and Company Company<br />
<strong>2011</strong> 2010<br />
$000 $000<br />
Current<br />
Related party term loan (unsecured) 67,154 10,000<br />
Medium-term notes (unsecured) 50,000 -<br />
Commercial paper (unsecured) 124,141 99,225<br />
Total current borrowings 241,295 109,225<br />
Non-current<br />
Related party term loan (unsecured) 476,104 -<br />
Medium-term notes (unsecured) 400,000 300,000<br />
Term loan (unsecured) 100,000 100,000<br />
Bank loan (unsecured) 11,500 16,500<br />
Total non-current borrowings 987,604 416,500<br />
Repayment schedule:<br />
Related party term loan (unsecured)<br />
Less than one year 67,154 10,000<br />
One to two years 89,798 -<br />
Two to three years 79,128 -<br />
Three to four years 136,275 -<br />
Beyond four years 170,903 -<br />
Medium-term notes<br />
Less than one year 50,000 -<br />
One to two years - 50,000<br />
Two to three years 220,000 -<br />
Three to four years 150,000 220,000<br />
Beyond four years 30,000 30,000<br />
Term loan<br />
One to two years - 100,000<br />
Beyond four years 100,000 -<br />
Bank loan<br />
One to two years 11,500 16,500<br />
Commercial paper<br />
Current 124,141 99,225<br />
Two to three years - -<br />
Total borrowings 1,228,899 525,725<br />
PAGE 95<br />
<strong>2011</strong> Financial <strong>Report</strong><br />
Return to Contents page
<strong>Watercare</strong> Services Limited<br />
<strong>2011</strong> ANNUAL REPORT<br />
Notes to the financial statements (continued)<br />
for the year ended 30 June <strong>2011</strong><br />
20. Borrowings (continued)<br />
group and Company Company<br />
<strong>2011</strong> 2010<br />
% %<br />
Interest rates at balance date:<br />
Related party term loan<br />
Average 5.13 4.80<br />
Average including interest rate swaps 5.78 4.80<br />
Medium-term notes<br />
Average 6.23 6.51<br />
Average including interest rate swaps 5.98 7.89<br />
Term loan<br />
Average 3.51 3.76<br />
Average including interest rate swaps 6.85 6.78<br />
Bank loan<br />
Average 3.61 4.27<br />
Average including interest rate swaps 3.61 4.27<br />
Commercial paper<br />
Average 2.76 3.09<br />
Average including interest rate swaps 6.08 4.88<br />
Total debt<br />
Average 5.15 5.24<br />
Average including interest rate swaps 5.95 6.93<br />
Lenders under the bank loans and holders of medium-term notes and short-term commercial paper, receive the benefit of the negative pledge<br />
undertaking from the group. This undertaking limits the extent to which the group can give security to lenders and requires the group to ensure<br />
that the following financial ratios are achieved at all times;<br />
• Total liabilities do not exceed 60 per cent of total tangible assets<br />
• Total liabilities plus total contingent liabilities do not exceed 65 per cent of total tangible assets<br />
• Shareholders’ funds are not less than $500 million<br />
• Earnings before interest, tax, depreciation and amortisation is greater than 1.75 times interest expense<br />
• Total tangible assets of the group are to be greater than 90 per cent of total tangible assets of the borrowing group<br />
The group complied with these financial covenant ratios during the years ended 30 June <strong>2011</strong> and 30 June 2010.<br />
The group has an agreement with Auckland Council under which Auckland Council guarantees repayment of certain of the group’s borrowings<br />
and obligations under interest rate swap agreements.<br />
The group has the following undrawn committed facilities available:<br />
group and Company Company<br />
<strong>2011</strong> 2010<br />
$000 $000<br />
Bank overdraft facilities, expires on cancellation 4,542 554<br />
Term loan facility, expires October 2016 50,000 -<br />
Revolving advances, expires May 2013 (2010: expires December <strong>2011</strong>) 63,500 8,500<br />
Commercial paper standby facility expires July 2012 (2010: expires December <strong>2011</strong>) 200,000 150,000<br />
<strong>2011</strong> Financial <strong>Report</strong><br />
PAGE 96<br />
Total undrawn committed facilities 318,042 159,054<br />
Commercial paper held by the group is represented by multiple issues that spread interest rate and maturity risk. As each issue matures the group<br />
replaces it with a new issue, if required. The provider of the commercial paper standby facility acts as a lender of last resort, should the group be<br />
unable to issue new commercial paper when it matures. The group’s treasury risk management policy requires standby facilities to be maintained<br />
to meet 50% of outstanding commercial paper and other uncommitted short-term debt repayable within 60 days (2010: the group’s treasury risk<br />
management policy required standby facilities to be maintained to meet 50% of commercial paper maturing within the next 60 days). The group<br />
complied with its treasury risk management policy during the years ended 30 June <strong>2011</strong> and 30 June 2010.<br />
Return to Contents page
<strong>Watercare</strong> Services Limited<br />
<strong>2011</strong> ANNUAL REPORT<br />
Notes to the financial statements (continued)<br />
for the year ended 30 June <strong>2011</strong><br />
21. Financial Assets and Liabilities<br />
Categories of financial assets and liabilities<br />
The carrying amounts presented in the statement of financial position relate to the following categories of assets and liabilities:<br />
group and Company<br />
company<br />
<strong>2011</strong> 2010<br />
carrying amount Fair value Carrying amount Fair value<br />
$000 $000 $000 $000<br />
FINANCIAL ASSETS – CURRENT<br />
Loans and receivables<br />
Cash and cash equivalents 32 32 - -<br />
Trade and other receivables 79,508 79,508 19,047 19,047<br />
Short-term deposits - - 10,000 10,000<br />
Fair value through profit or loss<br />
Derivative financial instruments 553 553 162 162<br />
FINANCIAL ASSETS – NON CURRENT<br />
Fair value through profit or loss<br />
Derivative financial instruments 12,285 12,285 5,284 5,284<br />
92,378 92,378 34,493 34,493<br />
FINANCIAL LIABILITIES – CURRENT<br />
Amortised cost<br />
Trade and other payables 16,157 16,157 8,299 8,299<br />
Accrued expenses* 63,031 63,031 33,017 33,017<br />
Bank overdraft (unsecured) 558 558 446 446<br />
Medium-term notes (unsecured) 50,000 51,244 - -<br />
Related party term loan (unsecured) 67,154 67,770 10,000 10,000<br />
Commercial paper (unsecured) 124,141 124,450 99,225 99,554<br />
Fair value through profit or loss<br />
Derivative financial instruments 3,174 3,174 1,026 1,026<br />
FINANCIAL LIABILITIES – NON CURRENT<br />
Amortised cost<br />
Medium-term notes (unsecured) 400,000 423,156 300,000 314,191<br />
Term loan (unsecured) 100,000 100,369 100,000 100,381<br />
Bank loan (unsecured) 11,500 11,500 16,500 16,500<br />
Related party term loan (unsecured) 476,104 481,084 - -<br />
Fair value through profit or loss<br />
Derivative financial instruments 59,110 59,110 40,298 40,298<br />
* Excludes income received in advance of $13,995,878 (2010: nil) as it is not categorised as a financial liability.<br />
1,370,929 1,401,603 608,811 623,712<br />
The calculation of fair values for each category of financial assets and financial liabilities is explained below. The methods and valuation<br />
techniques used for the purpose of measuring fair value are unchanged compared to the previous reporting period. No reclassification of financial<br />
assets was made during the years ended 30 June <strong>2011</strong> or 30 June 2010.<br />
PAGE 97<br />
<strong>2011</strong> Financial <strong>Report</strong><br />
Return to Contents page
<strong>Watercare</strong> Services Limited<br />
<strong>2011</strong> ANNUAL REPORT<br />
Notes to the financial statements (continued)<br />
for the year ended 30 June <strong>2011</strong><br />
21. Financial Assets and Liabilities (continued)<br />
Loans and receivables<br />
Due to their relatively short-term nature, the carrying amount of trade receivables is considered a reasonable approximation of fair value.<br />
Amortised cost<br />
Due to their relatively short-term nature, the carrying amount of trade payables is considered a reasonable approximation of fair value.<br />
The fair value of loans and borrowings is calculated based on the present value of contractual principal and interest cash flows, discounted<br />
at the market rate of interest in the reporting period.<br />
Fair value through profit and loss<br />
Interest rate swaps are measured at the present value of future cash flows estimated and discounted based on the applicable yield curves<br />
derived from quoted interest rates and the forward foreign exchange contracts are measured using observable market forward exchange rates.<br />
Fair value hierarchy<br />
The fair value hierarchy groups financial assets and liabilities into three levels as explained below based on the significance of inputs used<br />
in measuring the fair value of the financial assets and liabilities.<br />
Level 1: Quoted prices (unadjusted) in active markets for identical assets or liabilities;<br />
Level 2: Inputs other than quoted prices included within level 1 that are observable for the asset or liability, either directly (i.e. as prices)<br />
or indirectly (i.e. derived from prices); and<br />
Level 3: Inputs for the asset or liability that are not based on observable market data (unobservable inputs).<br />
The level in which the financial asset or liability is classified is determined based on the lowest level of significant input to the fair<br />
value measurement.<br />
The only financial assets and financial liabilities that are measured at fair value in the statement of financial position are derivative financial<br />
instruments. The valuation for derivative financial instruments is based on level 2 fair value hierarchy. The derivative financial instruments that<br />
the group holds at balance date comprise of interest rate swaps and forward foreign exchange contracts.<br />
Fair values at balance date have been assessed using a range of market interest rates between 2.68% and 5.35% (2010: 3.13% and 5.34 %),<br />
derived from the interest rate swap curve.<br />
There have been no transfers between levels 1, 2 and 3 during the year ended 30 June <strong>2011</strong>.<br />
Financial instrument risks<br />
Risk management objectives and policies<br />
The group’s management monitors and manages the financial risks relating to the operations of the group through internal risk reports which<br />
analyse exposures by degree and magnitude of risks. The main types of risks are market risk, credit risk and liquidity risk.<br />
The group seeks to manage the effects of these risks by using derivative financial instruments to minimise these risk exposures. The use of<br />
financial derivatives is governed by the group’s policies approved by the Board of Directors, which provide written principles on interest rate risk,<br />
credit risk, the use of derivative and non-derivative financial instruments, and the investment of excess liquidity. Compliance with policies and<br />
exposure limits is reviewed by the Board of Directors on a regular basis.<br />
Market risk<br />
The group is exposed to market risk through its use of financial instruments and specifically to interest rate, foreign currency and certain other<br />
price risks. The group manages its market risk by regularly assessing the impact of changes in the market interest rates and foreign currency rates<br />
on the group’s portfolio.<br />
<strong>2011</strong> Financial <strong>Report</strong><br />
Interest rate risk<br />
Interest rate risk is the risk that the fair value or future cash flows of a financial instrument will fluctuate because of changes in market interest<br />
rates. The group is exposed to interest rate risk when it borrows funds at floating interest rates. The risk is managed by the group through<br />
monitoring market interest rates and reviewing the impact of these on interest rate exposure.<br />
The group has a mixture of borrowings with both fixed rates and floating rates of interest. It is group policy to ensure that a proportion of interest<br />
rate exposure is maintained on a fixed-rate basis. To achieve this, the group enters into contracts that allow some of its floating interest rate<br />
exposure to be swapped from floating to fixed, and vice versa. The contracts are called interest rate swaps and interest rate options.<br />
The group’s exposure to market interest rates relates primarily to the group’s debt obligations which are disclosed in note 20, page 95.<br />
The group regularly analyses its interest rate exposure. Within this analysis, consideration is given to potential renewals of existing positions,<br />
alternative financing, alternative protective positions and the mix of fixed and variable interest rates.<br />
PAGE 98<br />
Return to Contents page
<strong>Watercare</strong> Services Limited<br />
<strong>2011</strong> ANNUAL REPORT<br />
Notes to the financial statements (continued)<br />
for the year ended 30 June <strong>2011</strong><br />
21. Financial Assets and Liabilities (continued)<br />
The notional principal, contract amounts of agreements and fixed interest rates in place, at balance date, to manage interest rate risk were<br />
as follows:<br />
group and Company<br />
company<br />
<strong>2011</strong> 2010<br />
fixed interest rate Notional amount Fixed interest rate Notional amount<br />
$000 $000<br />
Interest rate swaps<br />
Receivable maturities (fixed to floating):<br />
Within one year 6.86% 50,000 - -<br />
One to two years - - 6.86% 50,000<br />
Two to three years 5.26% 170,000 - -<br />
Three to four years 5.74% 150,000 5.26% 170,000<br />
Four to five years 5.10% 30,000 - -<br />
Beyond five years - - 5.10% 30,000<br />
Payable maturities (floating to fixed):<br />
Within one year 5.48% 125,000 6.54% *55,000<br />
One to two years - - 5.48% 125,000<br />
Two to three years - - - -<br />
Three to four years 6.25% 15,000 - -<br />
Four to five years 5.17% 110,000 6.25% 15,000<br />
Beyond five years 6.30% 720,000 6.35% 660,000<br />
* Includes a ‘knock out’ interest rate swap of $25,000,000.<br />
As interest rates change, these derivative financial instruments are revalued to fair value and the change in fair value is recorded in surplus<br />
or deficit.<br />
Interest rate sensitivity<br />
The following sensitivity analysis is based on the interest rate risk exposures in existence at balance date.<br />
At balance date, if interest rates had moved, as illustrated in the table below, with all other variables held constant, post-tax deficit and equity<br />
would have been affected as follows:<br />
group and Company<br />
company<br />
<strong>2011</strong> 2010<br />
Post-tax deficit equity Post-tax deficit equity<br />
higher/(lower) higher/(lower) higher/(lower) higher/(lower)<br />
$000 $000 $000 $000<br />
Judgments of reasonably possible movements:<br />
Interest paid<br />
1% (100 basis points) higher for the year (1,656) (1,656) (501) (501)<br />
1% (100 basis points) lower for the year 1,656 1,656 501 501<br />
Revaluation of derivative financial instruments<br />
1% (100 basis points) higher at year-end 21,548 21,548 20,080 20,080<br />
1% (100 basis points) lower at year-end (23,596) (23,596) (22,095) (22,095)<br />
PAGE 99<br />
<strong>2011</strong> Financial <strong>Report</strong><br />
Return to Contents page
<strong>Watercare</strong> Services Limited<br />
<strong>2011</strong> ANNUAL REPORT<br />
Notes to the financial statements (continued)<br />
for the year ended 30 June <strong>2011</strong><br />
21. Financial Assets and Liabilities (continued)<br />
Foreign currency risk<br />
Foreign currency risk is the risk that the fair value of future cash flows of a financial instrument will fluctuate because of changes in foreign<br />
exchange rates. Most of the group’s transactions are carried out in New Zealand dollars.<br />
From time to time the group is exposed to foreign currency risk on transactions denominated in foreign currencies. This is predominantly for the<br />
purchase of equipment, parts and chemicals in foreign currency. Where amounts exceed $100,000 the group manages this risk with forward<br />
foreign exchange contracts or options.<br />
The group has forward foreign exchange contracts at balance date as follows:<br />
average foreign Contract Carrying amount<br />
exchange rate currency value and fair value<br />
FC 000 NZ$000 NZ$000<br />
Group and company <strong>2011</strong><br />
USD<br />
Less than 3 months 0.737 274 372 (41)<br />
3 months and beyond 0.721 3,575 4,961 (542)<br />
EUR<br />
3 months and beyond 0.515 150 292 (19)<br />
GBP<br />
Less than 3 months 0.452 88 194 (23)<br />
AUD<br />
Less than 3 months 0.734 3,113 4,241 (216)<br />
3 months and beyond 0.758 420 554 (23)<br />
Total forward foreign exchange contracts 10,614 (864)<br />
average foreign Contract Carrying amount<br />
exchange rate currency value and fair value<br />
FC 000 NZ$000 NZ$000<br />
Company 2010<br />
USD<br />
Less than 3 months 0.719 1,740 2,420 96<br />
3 months and beyond 0.713 1,000 1,403 66<br />
AUD<br />
Less than 3 months 0.789 90 114 (48)<br />
3 months and beyond 0.801 140 175 (4)<br />
Total forward foreign exchange contracts 4,112 110<br />
<strong>2011</strong> Financial <strong>Report</strong><br />
PAGE 100<br />
Return to Contents page
<strong>Watercare</strong> Services Limited<br />
<strong>2011</strong> ANNUAL REPORT<br />
Notes to the financial statements (continued)<br />
for the year ended 30 June <strong>2011</strong><br />
21. Financial Assets and Liabilities (continued)<br />
Foreign currency sensitivity<br />
The following sensitivity analysis is based on the foreign currency risk exposures in existence at year-end. At 30 June, had the New Zealand dollar<br />
exchange rate changed, as illustrated in the table below, with all other variables held constant, post-tax surplus and equity would have been<br />
affected as follows:<br />
group and Company<br />
company<br />
<strong>2011</strong> 2010<br />
Post-tax deficit equity Post-tax deficit equity<br />
higher/(lower) higher/(lower) higher/(lower) higher/(lower)<br />
$000 $000 $000 $000<br />
Sensitivity to reasonable movements<br />
Change in United States dollar exchange rate<br />
10% increase (309) (309) (256) (256)<br />
10% decrease 380 380 313 313<br />
Change in Euro Monetary Union euro exchange rate<br />
10% increase (18) (18) - -<br />
10% decrease 22 22 - -<br />
Change in United Kingdom pound exchange rate<br />
10% increase (11) (11) - -<br />
10% decrease 13 13 - -<br />
Change in Australian dollar exchange rate<br />
10% increase (289) (289) (18) (18)<br />
10% decrease 353 353 22 22<br />
Credit risk<br />
Credit risk is the risk that a counterparty will default on its contractual obligations resulting in financial loss to the group. Financial instruments<br />
which potentially subject the group to credit risk principally consist of cash and cash equivalents, derivative assets held for risk management,<br />
and trade and other receivables.<br />
The group’s cash and cash equivalents are placed with major trading banks with a minimum AA- credit rating assigned by international creditrating<br />
agencies. Debtors and other receivables arise from the group’s statutory functions. Therefore, there are no procedures in place to monitor<br />
the credit quality of debtors and other receivables with reference to credit evaluations or external credit rating. However, there is no concentration<br />
of credit risk with respect to receivables as the company has a large number of customers. The ageing of the trade receivables at balance date<br />
was as follows:<br />
group and Company<br />
company<br />
<strong>2011</strong> 2010<br />
Carrying amount Provision for Net carrying Carrying amount Provision for Net carrying<br />
doubtful debts amount doubtful debts amount<br />
$000 $000 $000 $000 $000 $000<br />
Not past due 18,415 - 18,415 18,852 - 18,852<br />
Past due one to thirty days 7,229 (302) 6,927 145 - 145<br />
Past due thirty to sixty days 3,337 (124) 3,213 35 - 35<br />
Past due more than sixty days 12,128 (2,702) 9,426 15 - 15<br />
Total 41,109 (3,128) 37,981 19,047 - 19,047<br />
group and Company Company<br />
<strong>2011</strong> 2010<br />
$000 $000<br />
Movement in the provision of doubtful debts<br />
Balance at 1 July 2010 - -<br />
Acquisition through integration on 1 November 2010 1,845 -<br />
Additions during the year 1,313 -<br />
Bad debts written off (30) -<br />
Balance at 30 June <strong>2011</strong> 3,128 -<br />
<strong>2011</strong> Financial <strong>Report</strong><br />
PAGE 101<br />
Return to Contents page
<strong>Watercare</strong> Services Limited<br />
<strong>2011</strong> ANNUAL REPORT<br />
Notes to the financial statements (continued)<br />
for the year ended 30 June <strong>2011</strong><br />
21. Financial Assets and Liabilities (continued)<br />
Liquidity risk<br />
Liquidity risk is the risk arising from the group not being able to meet its financial obligations.<br />
Ultimate responsibility for liquidity risk management rests with the board of directors, which has an appropriate liquidity risk management<br />
framework for the management of the group’s short, medium and long-term funding and liquidity management requirements. The group manages<br />
liquidity risk by maintaining adequate reserves and banking facilities, monitoring forecast and actual cash flows and by matching this with the<br />
maturity profiles of financial liabilities.<br />
The group’s objective is to maintain a balance between continuity of funding and flexibility through the use of the medium-term notes, term<br />
loans, overdraft, revolving credit facility and commercial paper. The liquidity risk associated with the short-term commercial paper debt is<br />
mitigated by a standby facility of $200 million.<br />
The tables below detail the gross undiscounted cash flows of the financial liabilities on the basis of their earliest possible contractual maturity<br />
(including interest payments where applicable). Cash flows for financial liabilities without fixed amount or timing restrictions are based on the<br />
conditions existing at balance date.<br />
Gross contractual maturity analysis<br />
Group and Company <strong>2011</strong><br />
Current<br />
Non-current<br />
gross nominal<br />
carrying<br />
0-6 months 7-12 months 1-2 years 2-3 years More than 3 years cash outflow amount<br />
$000 $000 $000 $000 $000 $000 $000<br />
Financial liabilities<br />
Bank overdraft 558 - - - - 558 558<br />
Trade and other payables 16,157 - - - - 16,157 16,157<br />
Accrued expenses* 63,031 - - - - 63,031 63,031<br />
Forward exchange contracts 494 212 158 - - 864 864<br />
Interest rate swaps 10,009 7,948 10,550 9,379 29,347 67,233 61,420<br />
Borrowings 246,618 53,542 157,902 351,628 649,018 1,458,708 1,228,899<br />
Total 336,867 61,702 168,610 361,007 678,365 1,606,551 1,370,929<br />
* Excludes income received in advance of $13,995,878 (2010: nil) as it is not categorised as a financial liability.<br />
Current<br />
Non-current<br />
gross nominal<br />
carrying<br />
0-6 months 7-12 months 1-2 years 2-3 years More than 3 years cash outflow amount<br />
$000 $000 $000 $000 $000 $000 $000<br />
Company 2010<br />
Financial liabilities<br />
Bank overdraft 446 - - - - 446 446<br />
Trade and other payables 8,299 - - - - 8,299 8,299<br />
Accrued expenses 33,017 - - - - 33,017 33,017<br />
Forward exchange contracts 51 - - - - 51 51<br />
Interest rate swaps 4,021 3,614 7,963 7,473 17,310 40,381 41,273<br />
Borrowings 17,526 17,468 286,324 18,119 270,220 609,657 526,171<br />
Total 63,360 21,082 294,287 25,592 287,530 691,851 609,257<br />
The group monitors rolling forecasts of liquidity reserves on the basis of expected cash flow. At balance date the group had $318 million of<br />
unused credit facilities (commercial paper, overdraft facility and revolving credit facility) available for its immediate use (2010: $158.3 million).<br />
<strong>2011</strong> Financial <strong>Report</strong><br />
PAGE 102<br />
Capital management<br />
The capital structure of the group consists of equity attributable to the owners of the parent, comprising issued capital, reserves and retained<br />
earnings as disclosed on page 71 and debt including borrowings and covenants compliance as disclosed in note 20, page 95.<br />
The group’s policy is to maintain a strong capital base so as to maintain investor, creditor and market confidence and to sustain future<br />
development of the business. The objective of the group is to maintain an optimal capital structure to reduce the cost of capital. In ensuring that<br />
the group has sufficient solvency to satisfy all its operational needs, it closely monitors the ratio between the funds that it receives from operation<br />
and its finance costs.<br />
The group continues to focus on the maintenance of the long-term integrity of its assets whilst keeping the overall costs at minimum levels.<br />
There has been no change in the group’s overall strategy for capital management during the years ended 30 June <strong>2011</strong> and 30 June 2010.<br />
Return to Contents page
<strong>Watercare</strong> Services Limited<br />
<strong>2011</strong> ANNUAL REPORT<br />
Notes to the financial statements (continued)<br />
for the year ended 30 June <strong>2011</strong><br />
22. Related Parties<br />
% Shares % Shares<br />
<strong>2011</strong> 2010<br />
Shareholders<br />
Auckland Council 100% 260,693,164 - -<br />
Auckland City Council - - 41.6% 108,551,635<br />
Manukau City Council - - 25.1% 65,481,895<br />
Waitakere City Council - - 16.7% 43,400,849<br />
North Shore City Council - - 11.5% 29,988,909<br />
Papakura District Council - - 3.7% 9,667,225<br />
Rodney District Council - - 1.4% 3,602,651<br />
100% 260,693,164 100% 260,693,164<br />
Other related parties<br />
Metrowater Limited and Manukau Water Limited (subsidiaries of Auckland City Council and Manukau City Council respectively) were related<br />
parties until integration with the company on 1 November 2010. Metrowater Community Trust (formerly a Metrowater Limited subsidiary) and<br />
Auckland City Water Limited (dormant company) were related parties until 1 November 2010 after which they became subsidiaries of the<br />
company. Details of the integration of retail business are disclosed in note 11, page 86.<br />
Transactions with related parties<br />
On 1 November 2010, with the integration of local network operators, the group acquired debt as detailed in note 11, page 86 which it owes<br />
to its parent Auckland Council on the terms set out in note 20, page 95 and also has interest rate swap arrangements with Auckland Council<br />
(with a notional value of $155 million) with a fair value of $5.1 million as at balance date as included in note 21, page 97. In the prior year related<br />
party debt funding was limited to a loan from Manukau Water Limited totalling $10 million. The balances outstanding and transactions relating<br />
to the borrowings from Auckland Council during the year are as follows:<br />
group and Company<br />
Company<br />
<strong>2011</strong> 2010<br />
$000 $000<br />
Loan from Auckland Council 543,258 -<br />
Interest payable on loan from Auckland Council 6,036 -<br />
Interest paid on loan from Auckland Council 15,688 -<br />
Loan repaid to Auckland Council 168,800 -<br />
Interest receivable on interest rate swaps with Auckland Council 305 -<br />
Loan from Manukau Water Limited - 10,000<br />
Until integration on 1 November 2010 the group supplied bulk water and wastewater services predominantly to related parties in the Auckland<br />
region. After integration of the local network operators as detailed in note 11, page 86, the group provides retail water and wastewater services to<br />
its parent, Auckland Council and its controlled, jointly controlled and significantly influenced entities as well as to key management personnel of<br />
the company and its parent. These sales take place in the normal course of business. The group also enters into sales and purchases transactions<br />
with related parties in the normal course of business such as the payment of rates. These are not collectively significant.<br />
group and Company<br />
Company<br />
<strong>2011</strong> 2010<br />
$000 $000<br />
Sales to related parties 136,058 173,610<br />
Trade receivables – related parties 2,985 -<br />
Purchases from related parties 2,915 2,242<br />
Trade payables – related parties 1,201 546<br />
Payables accruals 7,894 -<br />
PAGE 103<br />
<strong>2011</strong> Financial <strong>Report</strong><br />
Return to Contents page
<strong>Watercare</strong> Services Limited<br />
<strong>2011</strong> ANNUAL REPORT<br />
Notes to the financial statements (continued)<br />
for the year ended 30 June <strong>2011</strong><br />
23. Commitments<br />
group and Company Company<br />
<strong>2011</strong> 2010<br />
$000 $000<br />
Capital expenditure<br />
The capital expenditure committed to, but not recognised in, these financial statements at balance date was:<br />
Buildings 488 97<br />
Pipelines 63,463 10,722<br />
Tanks, tunnels, roads and reservoirs 4,295 5,654<br />
Other 35,018 19,602<br />
Total capital expenditure commitments 103,264 36,075<br />
Anticipated payment schedule:<br />
Less than one year 79,636 25,121<br />
One to two years 22,713 3,651<br />
Two to five years 915 7,303<br />
Total capital expenditure commitments 103,264 36,075<br />
The commitments relate to the following projects:<br />
Hobson Bay sewer replacement - 5,527<br />
Wastewater treatment plant 4,109 15,793<br />
Water treatment plants 10,253 1,712<br />
Bulk supply meters 6,797 -<br />
Expansion of the Waikato water treatment plant 11,156 -<br />
South Western interceptor 13,019 -<br />
Stage 1 Northern Waitakere wastewater 6,985 -<br />
Other projects 50,945 13,043<br />
Total capital expenditure commitments 103,264 36,075<br />
Operating leases<br />
Anticipated payments under non-cancellable operating leases:<br />
Less than one year 3,159 2,411<br />
One to two years 3,003 2,357<br />
Two to five years 6,361 6,299<br />
Beyond five years 49,288 49,859<br />
Total lease commitments 61,811 60,926<br />
The major lease commitment is a long-term lease of the land forming the water catchments areas, which expires in July 2092. The annual rental of<br />
$510,000 has been included in these commitments at face value. Other leases include Newmarket office, parks, reservoirs and office equipment.<br />
<strong>2011</strong> Financial <strong>Report</strong><br />
24. Contingencies<br />
The Bank of New Zealand has issued performance bonds of $400,000 for <strong>2011</strong> (2010: $400,000). The performance bonds are to support the<br />
group’s obligations to Auckland Regional Council (now Auckland Council) for risks of environmental damage arising from the upgrade and<br />
operations of the Mangere Wastewater Treatment Plant.<br />
In the normal course of its business the group is exposed to claims, legal proceedings and arbitrations that may in some cases result in costs to<br />
the group. The directors believe that these have been adequately provided for by the group within note 19, page 94 of these financial statements<br />
and no additional material contingent liabilities requiring disclosure have been identified.<br />
PAGE 104<br />
Return to Contents page
<strong>Watercare</strong> Services Limited<br />
<strong>2011</strong> ANNUAL REPORT<br />
Notes to the financial statements (continued)<br />
for the year ended 30 June <strong>2011</strong><br />
25. Retirement Benefit Plans<br />
The employees of the group can elect to join the KiwiSaver scheme. KiwiSaver is a work-based savings scheme run through a selection of private<br />
providers. The obligation of the group is to contribute a specified percentage of payroll costs to the KiwiSaver scheme in line with employee<br />
contributions and the only obligation of the group to the KiwiSaver scheme is to make the specified contributions.<br />
The total defined contribution expense recognised in the statement of comprehensive income for <strong>2011</strong> was $566,483 (2010: $342,369).<br />
26. Remuneration<br />
The directors and key management personnel are included in this compensation.<br />
group and Company Company<br />
<strong>2011</strong> 2010<br />
$000 $000<br />
Compensation of directors and key management personnel<br />
Employees’ salaries and wages and directors’ fees 4,046 2,952<br />
Post-employment benefits 67 -<br />
Other long-term employee benefits 8 20<br />
Termination benefits 45 260<br />
Total compensation for directors and key executives 4,166 3,232<br />
<strong>2011</strong> 2010<br />
appointed $000 $000<br />
Directors’ remuneration<br />
Graeme Hawkins (retired December 2010) december 2002 96 75<br />
David Clarke (Deputy Chairman) July 2008 72 38<br />
Peter Drummond march 2010 65 16<br />
Susan Huria July 2008 66 38<br />
Terry Kayes (retired January 2010) January 2007 - 19<br />
Ross Keenan (Chairman) march 2010 100 18<br />
Dr Ian Parton (resigned December 2009) march 2001 - 24<br />
Patrick Snedden december 2002 66 38<br />
Jeff Todd May 2007 77 44<br />
Tony Lanigan may <strong>2011</strong> 9 -<br />
Catherine Harland may <strong>2011</strong> 9 -<br />
Total 560 310<br />
Directors’ fees paid during the year includes additional fees of $165,451 which were paid to directors as a result of the increased workload<br />
and commitment leading up to the integration. Of this amount, $94,312 was a back payment relating to the year ended 30 June 2010.<br />
27. Events Occurring after Balance Date<br />
On 19 September <strong>2011</strong>, Standard & Poor’s announced that it had upgraded its corporate credit ratings on <strong>Watercare</strong> Services Limited.<br />
The long-term rating was raised to ‘AA-’ from ‘A’ and the short-term rating was raised to ‘A-1+’ from ‘A-1’. The outlook is stable. The credit<br />
ratings on <strong>Watercare</strong> debt guaranteed by Auckland Council are unchanged at ‘AA’ long-term and ‘A-1+’ short-term.<br />
No adjustments are required to these financial statements in respect of this event.<br />
No other significant events have occurred since balance date requiring disclosure in these financial statements.<br />
PAGE 105<br />
<strong>2011</strong> Financial <strong>Report</strong><br />
Return to Contents page
<strong>Watercare</strong> Services Limited<br />
<strong>2011</strong> ANNUAL REPORT<br />
Statutory Information<br />
for the year ended 30 June <strong>2011</strong><br />
Employees Remuneration Range<br />
The table below shows the number of employees and former employees of the group, who in their capacity as employees, received remuneration<br />
and other benefits during the year of at least $100,000.<br />
group and Company<br />
Number of employees<br />
remuneration<br />
including<br />
redundancy and<br />
Employee remuneration range remuneration restructuring * Total<br />
<strong>2011</strong><br />
$100,000 – $110,000 27 _ 27<br />
$110,001 – $120,000 14 _ 14<br />
$120,001 – $130,000 19 _ 19<br />
$130,001 – $140,000 10 1 11<br />
$140,001 – $150,000 1 _ 1<br />
$150,001 – $160,000 1 _ 1<br />
$160,001 – $170,000 2 _ 2<br />
$170,001 – $180,000 3 _ 3<br />
$180,001 – $190,000 1 _ 1<br />
$190,001 – $200,000 3 _ 3<br />
$200,001 – $210,000 1 _ 1<br />
$210,001 – $220,000 2 _ 2<br />
$220,001 – $230,000 1 _ 1<br />
$230,001 – $240,000 2 _ 2<br />
$240,001 – $250,000 _ _ _<br />
$250,001 – $260,000 _ _ _<br />
$260,001 – $270,000 1 _ 1<br />
$270,001 – $280,000 _ _ _<br />
$280,001 – $290,000 _ _ _<br />
$290,001 – $300,000 _ _ _<br />
$300,001 – $310,000 _ _ _<br />
$310,001 – $320,000 1 _ 1<br />
$320,001 – $330,000 _ 1 1<br />
$330,001 – $340,000 _ _ _<br />
$340,001 – $350,000 _ _ _<br />
$350,001 – $360,000 _ 1 1<br />
$360,001 – $370,000 _ 1 1<br />
$370,001 – $380,000 _ _ _<br />
$380,001 – $390,000 1 _ 1<br />
$390,001 – $400,000 1 _ 1<br />
$400,001 – $410,000 _ _ _<br />
$410,001 – $420,000 1 _ 1<br />
$420,001 – $570,000 _ _ _<br />
$570,001 – $580,000 _ _ _<br />
<strong>2011</strong> Financial <strong>Report</strong><br />
* Includes $395,889 in respect of redundancy and annual leave payments.<br />
PAGE 106<br />
Return to Contents page
<strong>Watercare</strong> Services Limited<br />
<strong>2011</strong> ANNUAL REPORT<br />
<strong>2011</strong> STATEMENT OF SERVICE PERFORMANCE<br />
Environmental care<br />
(a) To promote conservation of the region’s water resources.<br />
(i) To develop and initiate the implementation of a regional water efficiency and conservation plan for the integrated company by 30 June <strong>2011</strong>.<br />
The Auckland Regional Water Demand Management Plan, which includes initiatives and actions to help reduce water demand, was completed<br />
and sent to the Auckland Council on 30 June <strong>2011</strong>. The plan was developed in consultation with a range of stakeholders including the<br />
Auckland Council and the Environmental Advisory Group and is aimed at reducing or delaying the need to access new water sources and<br />
future capital expenditure. <strong>Watercare</strong> has adopted the Three Waters strategic demand target of achieving a 15% reduction on the 2004 level<br />
of water demand by 2025. Implementation of the plan involves working closely with a range of stakeholders.<br />
(ii) To maintain regional unaccounted for water losses at less than 17.7 billion litres. (Applicable from 1 November 2010)<br />
A proportion of the water supplied by <strong>Watercare</strong> is not invoiced (non-revenue water) because it is used as part of the production process<br />
(such as flushing), for fire fighting, meter inaccuracy and unauthorised usage. Some of these volumes are calculated based on the best<br />
information available and other industry-accepted parameters. The balance of non-revenue water is unaccounted for water losses and was<br />
estimated at 11.4 billion litres against a seasonally-adjusted eight-month target of 12.1 billion litres for the post-integration period. Part of<br />
the forward programme is to improve the accuracy of the measurement of non-revenue water volumes.<br />
(b) To promote to industry cleaner discharges.<br />
(i) To achieve a ‘Bb’ grade as set out in the 2003 NZWWA guidelines for the safe application of biosolids to land.<br />
Biosolids metals testing for the 2010/11 year showed that 97% of tests confirmed the Bb grade or better for biosolids. During the year<br />
there was a spike in zinc levels at the Mangere wastewater treatment plant. As biosolids are blended as part of the disposal process, overall<br />
biosolids for the year were Bb grade. In general the predominant source of zinc to the wastewater system is stormwater, which contains<br />
galvanised roofing and road (wear on tyres and brakes) runoff and enters via the combined sewer/stormwater system that exists in parts<br />
of Auckland. The period of recorded elevated zinc levels may be the result of the cleaning of the stormwater system or the result of illegal<br />
dumping from industrial sites. Inquiries were ongoing to identify the cause.<br />
(c) To minimise the impact of carbon on the environment.<br />
(i) To achieve a 75% CO 2<br />
equivalent reduction from 1990 levels over the next three years.<br />
The estimated levels of greenhouse gas emissions have been reduced dramatically since 1990. This has been achieved by the removal of<br />
oxidation ponds at Mangere and their reduced usage at Rosedale, the removal of sludge lagoons and the collection of methane for electricity<br />
generation at both these wastewater treatment plants. For Mangere alone, the reduction has been 86%. By comparison with the levels at<br />
these two largest plants, emission levels elsewhere in the company are minor, but the company continues to implement policies to reduce<br />
these levels. Based on accepted IPCC extrapolation factors, estimates for significant 1990 emissions across the integrated company indicate<br />
that the 75% target was achieved for 2010/11.<br />
(d) To use energy efficiently and where appropriate recover energy from operational activities.<br />
(i) To target 35% of energy needs sourced internally for each of the next three years.<br />
This year, <strong>Watercare</strong> sourced 32% of its energy internally, principally from biogas reuse at its two largest wastewater plants, Mangere and<br />
Rosedale, and from five hydro-electric generators within the water supply system.<br />
Health, safety and well-being<br />
(a) To promote staff productivity and wellbeing.<br />
(i) To attain a lost-time injury frequency rate (LTIFR) of less than or equal to 5.<br />
<strong>Watercare</strong> staff achieved a LTIFR rate of 3.22, which was well within the target range. Prior to a serious incident at Onehunga, Auckland,<br />
on 4 June <strong>2011</strong> <strong>Watercare</strong> had operated for 18 months without a lost-time injury.<br />
(ii) To target an unplanned absenteeism rate of less than 2.5%.<br />
<strong>Watercare</strong> achieved an unplanned absenteeism rate, including sick leave, of 2% (equivalent to 4.5 days per employee), which was within<br />
the target range.<br />
(b) To provide comprehensive training and development programmes.<br />
(i) To target over 20 training hours per employee.<br />
Employees received 20.7 hours of training each on average. This result was slightly higher than the performance target and reflects the<br />
company-wide focus on integration.<br />
(ii) To target a ratio of less than 2.25:1 of external to internal appointments.<br />
The ratio of external to internal appointments was 1.2:1, being 12 external appointments for every 10 internal appointments. This ratio<br />
was influenced by the integration of the company under Part 2 of the Local Government (Auckland Transitional Provisions) Act 2010.<br />
Staff transferred from the local network operators (LNOs) were considered internal appointments.<br />
(c) To provide employees with safe working conditions.<br />
(i) To maintain the tertiary-level ACC workplace management practices accreditation.<br />
ACC tertiary-level accreditation was maintained following an audit in December 2010.<br />
<strong>2011</strong> Financial <strong>Report</strong><br />
PAGE 107<br />
Return to Contents page
<strong>Watercare</strong> Services Limited<br />
<strong>2011</strong> ANNUAL REPORT<br />
<strong>2011</strong> STATEMENT OF SERVICE PERFORMANCE (continued)<br />
Stakeholder relationships<br />
(a) To engage with stakeholders in a transparent and collaborative manner including the company’s Maori and environmental<br />
advisory groups.<br />
(i) To consult with all appropriate stakeholders in regard to key infrastructure projects.<br />
Regular communication occurs between <strong>Watercare</strong> and its stakeholders in relation to key infrastructure projects. Following integration<br />
<strong>Watercare</strong> has worked closely with departments of council and has communicated with local boards.<br />
The company retains its independent Maori and Environmental Advisory Groups and also engages with the local community liaison groups on<br />
relevant issues. There were five formal meetings with each advisory group, one of which was a combined meeting, and another workshop for<br />
each group.<br />
(ii) To consult with relevant stakeholders in the development of the Regional Asset Management Plan, including major projects.<br />
LNOs and key stakeholders were consulted during the development of the <strong>2011</strong>/12 Asset Management Plan (AMP), which was also reviewed<br />
by the Auckland Council’s CCO monitoring group. Following integration, Auckland Council became the key stakeholder, and all information<br />
and meetings were open to the public. For instance, the northern strategic growth area (NorSGA) and the Kumeu, Huapai and Riverhead<br />
(KHR) developments followed a process of consultation by the two local councils and two LNOs with local residents and <strong>Watercare</strong>. Following<br />
integration, <strong>Watercare</strong> has continued with direct consultation with the Auckland Council, local residents and the Local Boards. The <strong>2011</strong>/12<br />
AMP was initially developed in consultation with the local councils and LNOs and discussed with the Auckland Council CCO Strategy and<br />
Review Sub-Committee on 21 April. Feedback was included in the <strong>2011</strong>/12 SCI.<br />
(iii) To obtain annual feedback from the company’s advisory groups on the consultation process.<br />
The advisory groups meet on a quarterly basis during the year. Feedback from the groups is included in the <strong>2011</strong> <strong>Annual</strong> <strong>Report</strong>.<br />
(b) To provide leadership within the water industry and participate in public policy initiatives and statutory submissions.<br />
(i) To report on the number of policy initiatives and key submissions made per annum.<br />
Updates on policy submissions and progress are reported to the directors each month and to the shareholder each quarter.<br />
(c) To promote appropriate educational and recreational initiatives.<br />
(i) To continue with the Rain Forest Express, the ‘Adopt a Stream’ and other educational programmes as appropriate.<br />
Both <strong>Watercare</strong> community programmes continue to be very popular. The number of pupils who took part in the Adopt A Stream programme<br />
was 6,988 for the year end 30 June <strong>2011</strong>. Patronage on the Rain Forest Express was strong for the year and was approximately 11% higher<br />
than the previous year.<br />
(d) To maintain sound governance and contribute to the development of a productive working relationship with the<br />
Shareholder Representative Group (SRG).<br />
(i) To hold briefings with the SRG at least once every six months and to undertake Council briefings as requested.<br />
<strong>Watercare</strong> briefed the SRG, Auckland City Council, Waitakere City Council and North Shore City Council prior to their disestablishment.<br />
Following integration, <strong>Watercare</strong> has held briefings with the Auckland Council.<br />
Customer service commitment<br />
(a) To supply high quality and reliable drinking water.<br />
(i) To maintain the public health grading of water treatment and networks of ‘Aa’.<br />
Water quality has been maintained based on the 2009/10 grading assessment carried out by the Auckland District Health Board on behalf<br />
of the Ministry of Health 1 .<br />
Metropolitan: The metropolitan treatment plants and distribution network supplying the majority of the Auckland population were ‘Aa’ graded<br />
in 2009/10.<br />
Rural: Upon integration, only two of the 14 non-metropolitan water treatment plants and networks were graded ‘Aa’ when transferred to<br />
<strong>Watercare</strong>. Nine plants and related networks were ungraded. A series of short-term actions were undertaken to address the bacteriological<br />
and protozoa compliance requirements, and plant condition and reliability issues. A long-term strategy to achieve ‘Aa’ grading of all plants<br />
by 2020 is being implemented, with the majority of plants targeted by 2015. The strategy involves replacing the water source and water<br />
treatment plants as necessary, at a total estimated cost of $100 million. A priority was replacing the water supply to Pukekohe by a 6.5km<br />
pipeline from the Waikato River at a cost of $13 million. This was initially approved in February <strong>2011</strong> and is due for completion in 2013.<br />
<strong>2011</strong> Financial <strong>Report</strong><br />
(ii) To ensure that demand can be met in a drought with a 1% probability of occurrence with 15% residual capacity in its reservoirs.<br />
The drought standard is being achieved in the integrated network. The Waikato Water Treatment Plant upgrade that is currently underway<br />
will ensure <strong>Watercare</strong> continues to meet the required drought standard as the population of Auckland increases. This excludes Rodney and<br />
Franklin districts which are being addressed as part of the rural plant upgrades<br />
PAGE 108<br />
1 The 2010/11 grading assessment had not been received by completion of the <strong>Annual</strong> <strong>Report</strong>.<br />
Return to Contents page
<strong>Watercare</strong> Services Limited<br />
<strong>2011</strong> ANNUAL REPORT<br />
<strong>2011</strong> STATEMENT OF SERVICE PERFORMANCE (continued)<br />
(b) To provide for the safe transportation, treatment and disposal of bulk wastewater.<br />
(i) To target no more than 15 dry-weather sewer overflows per 100km of wastewater pipe length per annum.<br />
There were 1.9 recorded dry weather sewer overflows per 100km of wastewater pipe length. Dry weather overflows exclude overflows<br />
caused by stormwater entering the network, and are normally caused by chokes or breaks in the system.<br />
(c) To be responsive to customer needs and to deliver a service meeting contractual standards.<br />
(i) To achieve 100% compliance with the customer contracts.<br />
This measure refers to the contracts with the six local network operators (LNOs) prior to integration. Full compliance was met with the LNO<br />
contracts. The United Water contract for the Papakura area is the only contract to carry on beyond integration and this continues to be<br />
complied with.<br />
Asset management<br />
(a) To develop and implement effective and efficient capital investment and maintenance programmes.<br />
(i) To ensure that capital projects have robust business cases and are delivered to plan.<br />
All <strong>Watercare</strong> capital projects are supported by robust business cases and are managed to ensure delivery to plan in a timely and costeffective<br />
manner. Project progress is reported regularly to the executive and the board. Upon project completion, post-completion reports are<br />
compiled for all projects and are reviewed to identify opportunities for improvement. Since April <strong>2011</strong>, projects over $10 million are reviewed<br />
by the board.<br />
(ii) To continue with the implementation of the reliability centred maintenance (RCM) system on strategic assets.<br />
An RCM-based maintenance programme has been implemented for the Mangere Wastewater Treatment Plant, for the water and wastewater<br />
networks and for water treatment and head works assets. RCM models will be updated as needed. RCM has been used to assist with the<br />
development of the maintenance budgets.<br />
(b) To maintain a focus on integrated planning with customers to secure long-term wastewater solutions and manage regional<br />
wet weather overflows.<br />
(i) To facilitate a process to agree regional environmental objectives, including the setting of wastewater overflow performance targets for<br />
each of the region’s key receiving water environments, within three years.<br />
<strong>Watercare</strong> is continuing to work with the Auckland Council’s planning and stormwater teams to progress these issues. With the replacement<br />
of the LNOs, <strong>Watercare</strong> now deals directly with Auckland Council on the setting of targets and these are formally adopted through the SCI/SOI<br />
process. Progress on the SCI/SOI performance targets are reported to the Council quarterly. The process of developing the 2012-2014 SOI is<br />
due to begin in October <strong>2011</strong><br />
(ii) To progress planning associated with the Central Interceptor.<br />
<strong>Watercare</strong> has presented to the Auckland Council Accountability and Performance Committee and to cluster groups of the local boards<br />
on wastewater issues including the Central Interceptor. Planning for the Central Interceptor project continues and a project manager for<br />
<strong>Watercare</strong> has been appointed. The focus on preparing material for the consenting phase continues.<br />
Economic performance<br />
(a) To ensure that financial strategies are consistent with achieving economic efficiency, intergenerational equity and an<br />
optimal cost of capital.<br />
(i) To meet the requirements of the Auckland City Council guarantee of <strong>Watercare</strong>’s debt.<br />
All requirements of the guarantee were met.<br />
(ii) To achieve a minimum funds flow from operations (FFO) to interest cover of 2.5 times before any price adjustments.<br />
<strong>Watercare</strong> exceeded this target. The FFO ratio at 30 June <strong>2011</strong> was 3.32. The higher-than-target ratio resulted from a combination of<br />
higher-than-budgeted funds from operations, due largely to lower operating costs, and a lower-than-budgeted gross interest expense<br />
caused by lower borrowings and a lower cost of funds. Funds from operations as the numerator in the ratio is Net Profit after<br />
Tax + Deferred Tax + Loss on disposal and provision for redundant property, plant and equipment and other restructuring<br />
costs + Depreciation + Interest Expensed in the Statement of Performance – Interest Income. Interest in the denominator is<br />
Gross Interest (i.e. includes capitalised interest) – Interest Income.<br />
PAGE 109<br />
<strong>2011</strong> Financial <strong>Report</strong><br />
Return to Contents page
<strong>Watercare</strong> Services Limited<br />
<strong>2011</strong> ANNUAL REPORT<br />
<strong>2011</strong> STATEMENT OF SERVICE PERFORMANCE (continued)<br />
(b) To ensure that the regime for the pricing of water and wastewater services is enduring, transparent and reliable.<br />
(i) The pricing methodology enables the revenue to be set to recover all costs and provide for an adequate level of debt servicing.<br />
Achieved. For the purposes of this performance measure, costs excludes revaluation of derivative financial instruments and deferred tax.<br />
The revenue achieved in 2010/11 was $5.7 million higher than costs. Pricing methodology for water and wastewater utilised by <strong>Watercare</strong><br />
from 1 November 2010 was exactly as per the existing pricing methodologies that the previous Councils/ Local Network Operators had<br />
established effective from 1 July 2010.<br />
(ii) The pricing methodology established cannot be changed without <strong>Watercare</strong> providing the LNOs with three-year advance notification<br />
of a change.<br />
Not applicable to the integrated company because the LNOs were integrated into <strong>Watercare</strong>, except for the Papakura district which is<br />
managed under a franchise agreement with United Water.<br />
(c) To promote continuous improvement in sustainable business performance.<br />
(i) To continue to use the Project Improve initiative as the vehicle to deliver continuous improvement in business performance.<br />
Project Improve was developed in 2002 as a framework for the identification, capture and sharing of improvement ideas. It continues<br />
to be used by the company.<br />
(d) To ensure efficiency in operational expenditure is maintained.<br />
(i) To meet operational efficiency targets (excluding depreciation and interest) established in the December 2009 AMP as follows:<br />
<strong>2011</strong> – $94.09 million.<br />
Not applicable to the integrated company because the 2009 AMP was prepared for the wholesale company.<br />
(ii) To report operational and capital expenditure relative to budget for water and wastewater.<br />
Achieved. This information is reported to the executive and the board on a monthly basis and has previously been reported to the<br />
shareholder on a quarterly basis.<br />
Operational expenditure for the year end was 6.1% under budget while capital expenditure was 1.6% under budget. The budget<br />
represented expected expenditures for the organisation for the four months prior to integration and the eight months after integration and<br />
was set at a time when there was considerable uncertainty as to the full financial effects of the integration on the organisation. There was,<br />
therefore, an expectation that variances to budget could be at a higher level than is normally the case.<br />
Customer services performance (for the eight-month period from 1 November 2010 to 30 June <strong>2011</strong><br />
(a) To maintain delivery of cost-effective services.<br />
(i) To maintain the average household bill at less than 1.5% of the average household income.<br />
The average monthly household water and wastewater bill from <strong>Watercare</strong> was $57.03 for the eight months from 1 November 2010.<br />
Based on Statistics NZ average monthly household income in Auckland of $6,366, the bill represents 0.9% of the average household income.<br />
(b) To maintain delivery of high quality water and wastewater services.<br />
(i) To achieve less than five water quality complaints per 1,000 customer connections.<br />
Water quality complaints for the year were 5.6 per 1,000 customers.<br />
A disproportionate number of complaints originated in the Franklin area where <strong>Watercare</strong> is commencing a $13 million water supply project.<br />
(c) To maintain good customer relationships.<br />
(i) To ensure 95% of all enquiries are responded to in a meaningful way within 10 working days.<br />
Result was 88.9% of all enquiries for eight months from 1 November 2010. The enquiries responded to within 10 working days steadily<br />
increased from 49.3% in November 2010 to 98.8% in June <strong>2011</strong>. The increase was the result of improvements in the quality and<br />
effectiveness of correspondence processes. These included coordinating more direct responses from subject matter experts. The result for<br />
all enquiries and complaints closed within 10 working days over the same period was 85.8%.<br />
(ii) To ensure greater than 95% of customers receive three days’ notice of planned shut-downs.<br />
The result was 99% of customers for the integrated business.<br />
<strong>2011</strong> Financial <strong>Report</strong><br />
PAGE 110<br />
(iii) To achieve an average call centre operator connect time of
<strong>Watercare</strong> Services Limited<br />
<strong>2011</strong> ANNUAL REPORT<br />
<strong>2011</strong> STATEMENT OF SERVICE PERFORMANCE (continued)<br />
(d) To maintain service capacity.<br />
(i) To maintain a water interruption frequency of
<strong>Watercare</strong> Services Limited<br />
<strong>2011</strong> ANNUAL REPORT<br />
G3 Cross-Reference Table<br />
KEY:<br />
Fully reported<br />
Partially reported<br />
Not reported<br />
<strong>Watercare</strong>’s <strong>Annual</strong> <strong>Report</strong> <strong>2011</strong> has been prepared in accordance with the G3 framework of the Global <strong>Report</strong>ing<br />
Initiative (GRI) Sustainability <strong>Report</strong>ing Guidelines. This framework exists to assist organisations to report their<br />
economic, environmental and social performance in a consistent and comparable manner. The following pages show<br />
how <strong>Watercare</strong> reports its performance against the G3 indicators. Against each indicator, <strong>Watercare</strong> has fully reported,<br />
partially reported or not reported. The key (left) explains the symbols used. The GRI disclosures for strategy and<br />
analysis, organisational profile, report parameters in governance and management approach (parts I and II)<br />
are excluded from the G3 cross-reference table but are covered in pages 1 to 57 of this report.<br />
The GRI aims, objectives and guidelines can be found on their website www.globalreporting.org.<br />
ECONOMIC INDICATORS<br />
ASPECT: ECONOMIC PERFORMANCE REFERENCE RULER<br />
EC1<br />
Direct economic value generated and distributed, including revenues, operating costs, employee compensation,<br />
donations and other community investments, retained earnings, and payments to capital providers and governments.<br />
Page 59-106<br />
EC2 Financial implications and other risks and opportunities for the organisation’s activities due to climate change. Figure 61<br />
EC3 Coverage of the organisation’s defined benefit plan obligations. Figure 24 3E<br />
EC4 Significant financial assistance received from government. Self funded<br />
ASPECT: MARKET PRESENCE REFERENCE RULER<br />
EC5 Range of ratios of standard entry level wage compared to local minimum wage at significant locations of operation. Figure 24 3E<br />
EC6 Policy, practices, and proportion of spending on locally-based suppliers at significant locations of operation. Figure 55; 56<br />
EC7<br />
Procedures for local hiring and proportion of senior management hired from the local community at significant locations<br />
of operation.<br />
Merit based<br />
ASPECT: indirect economic impacts REFERENCE RULER<br />
EC8<br />
Development and impact of infrastructure investments and services provided primarily for public benefit through<br />
commercial, in-kind, or pro bono engagement.<br />
Figure 54<br />
EC9 Understanding and describing significant indirect economic impacts, including the extent of impacts. Pages 15-17 5A<br />
ENVIRONMENTAL INDICATORS<br />
ASPECT: MATERIALS REFERENCE RULER<br />
EN1 Materials used by weight or volume. Figure 52<br />
EN2 Percentage of materials used that are recycled input materials. Figure 52<br />
ASPECT: ENERGY REFERENCE RULER<br />
EN3 Direct energy consumption by primary energy source. Figure 42<br />
EN4 Indirect energy consumption by primary source. Being revised<br />
EN5 Energy saved due to conservation and efficiency improvements. Being revised<br />
EN6<br />
Initiatives to provide energy-efficient or renewable energy based products and services, and reductions in energy<br />
requirements as a result of these initiatives.<br />
Figure 42<br />
6B<br />
EN7 Initiatives to reduce indirect energy consumption and reductions achieved. 6B<br />
ASPECT: WATER REFERENCE RULER<br />
EN8 Total water withdrawal by source. Figure 1<br />
EN9 Water sources significantly affected by withdrawal of water. Page 27<br />
EN10 Percentage and total volume of water recycled and reused. Figure 1<br />
ASPECT: BIODIVERSITY REFERENCE RULER<br />
<strong>2011</strong> Financial <strong>Report</strong><br />
EN11<br />
EN12<br />
Location and size of land owned, leased, managed in, or adjacent to, protected areas and areas of high biodiversity value<br />
outside protected areas.<br />
Description of significant impacts of activities, products, and services on biodiversity in protected areas and areas of<br />
high biodiversity value outside protected areas.<br />
Figure 46<br />
Figure 47<br />
EN13 Habitats protected or restored. Figure 46 6F<br />
EN14 Strategies, current actions and future plans for managing impacts on biodiversity. Figure 46 6F<br />
6F<br />
6E<br />
PAGE 112<br />
EN15<br />
Number of IUCN Red List species and national conservation list species with habitats in areas affected by operations,<br />
by level of extinction risk.<br />
Under review<br />
Return to Contents page
<strong>Watercare</strong> Services Limited<br />
<strong>2011</strong> ANNUAL REPORT<br />
G3 Cross-Reference Table (continued)<br />
ENVIRONMENTAL INDICATORS (CONTINUED)<br />
ASPECT: emissions, effluents and waste REFERENCE RULER<br />
EN16 Total direct and indirect greenhouse gas emissions by weight. Figure 37 6A<br />
EN17 Other relevant indirect greenhouse gas emissions by weight. Figure 37 6A<br />
EN18 Initiatives to reduce greenhouse gas emissions and reductions achieved. Figure 38 6A<br />
EN19 Emissions of ozone-depleting substances by weight. Figure 37<br />
EN20 NOx, SOx, and other significant air emissions by type and weight. Figure 38 6A<br />
EN21 Total water discharge by quality and destination. Figure 15 2C<br />
EN22 Total weight of waste by type and disposal method. Figure 42-45 6C; 6D<br />
EN23 Total number and volume of significant spills. Figure 17 2B<br />
EN24<br />
EN25<br />
Weight of transported, imported, exported, or treated waste deemed hazardous under the terms of the Basel Convention<br />
Annex I, II, III, and VIII, and percentage of transported waste shipped internationally.<br />
Identity, size, protected status, and biodiversity value of water bodies and related habitats significantly affected by the<br />
reporting organisation’s discharges of water and runoff.<br />
No international<br />
transport<br />
Page 26-29;<br />
44-47<br />
Figure 15; 46; 47<br />
ASPECT: products and services REFERENCE RULER<br />
EN26 Initiatives to mitigate environmental impacts of products and services, and extent of impact mitigation. Page 4-5<br />
EN27 Percentage of products sold and their packaging materials that are reclaimed by category. Not applicable<br />
ASPECT: compliance REFERENCE RULER<br />
EN28<br />
Monetary value of significant fines and total number of non-monetary sanctions for non-compliance with environmental<br />
laws and regulations.<br />
Table 14<br />
5C<br />
ASPECT: TRANSPORT REFERENCE RULER<br />
EN29<br />
Significant environmental impacts of transporting products and other goods and materials used for the organisation’s<br />
operations, and transporting members of the workforce.<br />
Not significant<br />
ASPECT: OVERALL REFERENCE RULER<br />
EN30 Total environmental protection expenditures and investments by type. Page 59-105<br />
Figure 7; 61<br />
LABOUR PRACTICES AND DECENT WORK INDICATORS<br />
ASPECT: emPLOYMENT REFERENCE RULER<br />
LA1 Total workforce by employment type, employment contract, and region. Figure 28<br />
LA2 Total number and rate of employee turnover by age group, gender and region. Figure 23; 25 3D; 3F<br />
LA3 Benefits provided to full-time employees that are not provided to temporary or part-time employees, by major operations. Figure 28<br />
ASPECT: LABOUR/MANAGEMENT RELATIONS REFERENCE RULER<br />
LA4 Percentage of employees covered by collective bargaining agreements. Figure 28<br />
LA5<br />
Minimum notice period(s) regarding significant operational changes, including whether it is specified in collective<br />
agreements.<br />
Figure 28<br />
ASPECT: OCCUPATIONAL HEALTH AND SAFETY REFERENCE RULER<br />
LA6<br />
Percentage of total workforce represented in formal joint management-worker health and safety committees that help<br />
monitor and advise on occupational health and safety programmes.<br />
Figure 21<br />
LA7 Rates of injury, occupational diseases, lost days, and absenteeism, and number of work-related fatalities by region. Figure 20; 22 3A; 3B; 3C<br />
LA8<br />
Education, training, counselling, prevention, and risk-control programmes in place to assist workforce members, their<br />
families, or community members regarding serious diseases.<br />
Figure 21<br />
3E<br />
LA9 Health and safety topics covered in formal agreements with trade unions. Figure 21<br />
<strong>2011</strong> Financial <strong>Report</strong><br />
PAGE 113<br />
Return to Contents page
<strong>Watercare</strong> Services Limited<br />
<strong>2011</strong> ANNUAL REPORT<br />
G3 Cross-Reference Table (continued)<br />
LABOUR PRACTICES AND DECENT WORK INDICATORS (CONTINUED)<br />
ASPECT: TRAINING AND EDUCATION REFERENCE RULER<br />
LA10 Average hours of training per year per employee by employee category. Figure 24 3E<br />
LA11<br />
Programmes for skills management and lifelong learning that support the continued employability of employees and assist<br />
them in managing career endings.<br />
Figure 28<br />
3C<br />
LA12 Percentage of employees receiving regular performance and career development reviews. Figure 28<br />
ASPECT: diversity and equal opportunity REFERENCE RULER<br />
LA13<br />
Composition of governance bodies and breakdown of employees per category according to gender, age group, minority<br />
group membership, and other indicators of diversity.<br />
Figure 26<br />
3G<br />
LA14 Ratio of basic salary of men to women by employee category. Figure 26<br />
HUMAN RIGHTS INDICATORS<br />
ASPECT: INVESTMENT AND PROCUREMENT PRACTICES REFERENCE RULER<br />
HR1<br />
Percentage and total number of significant investment agreements that include human rights clauses or that have<br />
undergone human rights screening.<br />
Not applicable<br />
HR2 Percentage of significant suppliers and contractors that have undergone screening on human rights and actions taken. Not applicable<br />
HR3<br />
Total hours of employee training on policies and procedures concerning aspects of human rights that are relevant to<br />
operations, including the percentage of employees trained.<br />
Not applicable<br />
ASPECT: NON-DISCRIMINATION REFERENCE RULER<br />
HR4 Total number of incidents of discrimination and actions taken. None recorded<br />
ASPECT: FREEDOM OF ASSOCIATION AND COLLECTIVE BARGAINING REFERENCE RULER<br />
HR5<br />
Operations identified in which the right to exercise freedom of association and collective bargaining may be at significant<br />
risk, and actions taken to support these rights.<br />
Not material<br />
ASPECT: CHILD LABOUR REFERENCE RULER<br />
HR6<br />
Operations identified as having significant risk for incidents of child labour, and measures taken to contribute to the<br />
elimination of child labour.<br />
Not applicable<br />
ASPECT: FORCED AND COMPULSORY LABOUR REFERENCE RULER<br />
HR7<br />
Operations identified as having significant risk for incidents of forced or compulsory labour, and measures to contribute to<br />
the elimination of forced or compulsory labour.<br />
Not applicable<br />
ASPECT: security practices REFERENCE RULER<br />
HR8<br />
Percentage of security personnel trained in the organisation’s policies or procedures concerning aspects of human rights<br />
that are relevant to operations.<br />
Not applicable<br />
ASPECT: INDIGENOUS RIGHTS REFERENCE RULER<br />
HR9 Total number of incidents of violations involving rights of indigenous people and actions taken. Page 19<br />
Figure 33<br />
SOCIETY INDICATORS<br />
ASPECT: COMMUNITY REFERENCE RULER<br />
SO1<br />
Nature, scope and effectiveness of any programmes and practices that assess and manage the impacts of operations on<br />
communities, including entering, operating, and exiting.<br />
Figure 33<br />
5B<br />
ASPECT: CORRUPTION REFERENCE RULER<br />
SO2 Percentage and total number of business units analysed for risks related to corruption. Page 15-17<br />
Figure 58<br />
SO3 Percentage of employees trained in organisation’s anti-corruption policies and procedures. Page 15-17<br />
Figure 59<br />
SO4 Actions taken in response to incidents of corruption. Page 15-17<br />
Figure 60<br />
ASPECT: PUBLIC POLICY REFERENCE RULER<br />
<strong>2011</strong> Financial <strong>Report</strong><br />
SO5 Public policy positions and participation in public policy development and lobbying. Figure 34<br />
SO6 Total value of financial and in-kind contributions to political parties, politicians, and related institutions by country. Figure 34<br />
ASPECT: ANTI-COMPETITIVE BEHAVIOUR REFERENCE RULER<br />
SO7 Total number of legal actions for anti-competitive behavior, anti-trust, and monopoly practices and their outcomes. Figure 14 5C<br />
ASPECT: COMPLIANCE REFERENCE RULER<br />
PAGE 114<br />
SO8<br />
Monetary value of significant fines and total number of non-monetary sanctions for non-compliance with laws and<br />
regulations.<br />
Figure 14<br />
5C<br />
Return to Contents page
<strong>Watercare</strong> Services Limited<br />
<strong>2011</strong> ANNUAL REPORT<br />
G3 Cross-Reference Table (continued)<br />
PRODUCT RESPONSIBILITY PERFORMANCE INDICATORS<br />
ASPECT: CUSTOMER HEALTH AND SAFETY REFERENCE RULER<br />
PR1<br />
Life cycle stages in which health and safety impacts of products and services are assessed for improvement,<br />
and percentage of significant products and services categories subject to such procedures.<br />
Fundamental to<br />
organisation<br />
PR2<br />
Total number of incidents of non-compliance with regulations and voluntary codes concerning health and safety impacts<br />
of products and services during their life cycle, by type of outcomes.<br />
Figure 14<br />
1A-1C<br />
ASPECT: PRODUCT AND SERVICE LABELLING REFERENCE RULER<br />
PR3<br />
Type of product and service information required by procedures, and percentage of significant products and services<br />
subject to such information requirements.<br />
Figure 59<br />
1A-1C<br />
PR4<br />
Total number of incidents of non-compliance with regulations and voluntary codes concerning product and service<br />
information and labelling, by type of outcomes.<br />
Figure 14<br />
1A-1D; 6I<br />
PR5 Practices related to customer satisfaction, including results of surveys measuring customer satisfaction. Figure 26-31 4A-4C<br />
ASPECT: MARKETING COMMUNICATIONS REFERENCE RULER<br />
PR6<br />
Programmes for adherence to laws, standards, and voluntary codes related to marketing communications, including<br />
advertising, promotion, and sponsorship.<br />
Page 42<br />
5C<br />
PR7<br />
Total number of incidents of non-compliance with regulations and voluntary codes concerning marketing communications,<br />
including advertising, promotion, and sponsorship by type of outcomes.<br />
None reported<br />
ASPECT: CUSTOMER PRIVACY REFERENCE RULER<br />
PR8 Total number of substantiated complaints regarding breaches of customer privacy and losses of customer data. Figure 14<br />
ASPECT: COMPLIANCE REFERENCE RULER<br />
PR9<br />
Monetary value of significant fines for non-compliance with laws and regulations concerning the provision and use<br />
of products and services.<br />
Figure 14<br />
<strong>Report</strong> Application Levels<br />
Under the G3 framework, annual reports are graded at three different levels<br />
(C, B and A) according to the extent to which the framework has been applied.<br />
<strong>Watercare</strong>’s report has been self-declared and third-party checked.<br />
C C+ B B+ A A+<br />
MANDATORY Self-declared <br />
OPTIONAL<br />
Third-party checked<br />
GRI checked<br />
<br />
PAGE 115<br />
<strong>2011</strong> Financial <strong>Report</strong><br />
Return to Contents page
<strong>Watercare</strong> Services Limited<br />
<strong>2011</strong> ANNUAL REPORT<br />
index<br />
Adopt A Stream ............................5, 42, 43, 53, 108<br />
Asset Management Plan (AMP) .........11, 16, 42, 108<br />
Auckland Council ..1, 6, 10, 12, 15, 17, 42, 61, 74, 102<br />
Audit and Risk Committee ..................................18<br />
Biogas. . . . . . . . . . . . . . . . . . . . . . . . . . . . . . . . . . . . . . . . . . . . . . . . . . . . 5, 46, 106<br />
Capital expenditure ..................52, 63-65, 103, 109<br />
Companies Act 1993, The ..............................15, 74<br />
Customer satisfaction ........................................38<br />
Drinking Water Standards for New Zealand .........22<br />
Emissions ..........................................................46<br />
Employment equity and diversity .......................33<br />
Environmental Advisory Group .........17, 18, 42, 107<br />
Funding Plan ................................................16, 42<br />
Graduate Engineering Programme. . . . . . . . . . . . . . . . . . . 5, 33<br />
Greenhouse gas emissions ..........................46, 106<br />
Habitat improvement .........................................47<br />
Hansen .............................................................57<br />
Hunua No. 4 Watermain .......................4, 11, 14, 64<br />
Legal compliance ..............................................42<br />
Local Government (Auckland Council)<br />
Act 2009 .................................................15, 61, 87<br />
Local Government (Auckland Transitional<br />
Provisions) Act 2010 ................................15, 61, 87<br />
Local Government (Tamaki Makaurau<br />
Reorganisation) Act 2009 .........................15, 61, 87<br />
Lost-time injuries .......................................32, 106<br />
Maori Advisory Group ....................................17, 19<br />
Midge ............................................................5, 47<br />
Odour ............................................................5, 47<br />
Overflows .......................................11, 28, 29, 108<br />
Procurement .....................................................56<br />
Project Hobson ..............................................4, 29<br />
Project Improve .......................................5, 12, 109<br />
Pukekohe water supply ....................11, 23, 25, 107<br />
Puketutu Island ...................................4, 11, 12, 47<br />
Rain Forest Express ...........................5, 42, 43, 107<br />
Recycling .....................................................46, 49<br />
Reliability Centred Maintenance ..............4, 52, 108<br />
SAP Enterprise Asset<br />
Management Solution. . . . . . . . . . . . . . . . . . . . . . . . . . . . . . . . . . . 12, 57<br />
Species preservation .........................................46<br />
Staff training .....................................................33<br />
Staff turnover ...............................................32, 78<br />
Staff wellness ....................................................32<br />
Statement of Corporate Intent .......15, 16, 17, 42, 66<br />
Statement of Service Performance .......15, 105-110<br />
Trade waste ..........................................1, 18, 47, 61<br />
Trees for Survival ...........................................5, 47<br />
Water demand management ....5, 18, 19, 52, 53, 106<br />
Water quality ..............................23, 25, 43, 47,107<br />
<strong>Watercare</strong> Coastal Walkway .................................5<br />
<strong>Watercare</strong> Harbour Clean-Up Trust ..................4, 42<br />
Zero Waste ...................................................46, 49<br />
glossary<br />
Adopt A Stream<br />
<strong>Annual</strong> Water Quality <strong>Report</strong><br />
Asset Management Plan<br />
Biogas<br />
Biosolids<br />
Regional Demand<br />
Management Plan<br />
ERP<br />
G3<br />
Greenhouse gases<br />
Hansen<br />
NZIS<br />
Reliability Centred<br />
Maintenance (RCM)<br />
SAP<br />
Statement of Corporate<br />
Intent (SCI)<br />
Statement of Service<br />
Performance (SSP)<br />
Trade waste<br />
Unaccounted-for water loss<br />
Wastewater<br />
<strong>Watercare</strong>’s free education programme.<br />
A report that outlines <strong>Watercare</strong>’s water quality performance for the financial year.<br />
A document that defines <strong>Watercare</strong>’s best engineering judgement of the revenue and capital investment<br />
required to maintain the integrity of its asset base over a 20-year period.<br />
A by-product of the wastewater process that is comprised of approximately 65 per cent methane.<br />
A treated solid by-product of the wastewater treatment process.<br />
A plan that outlines how <strong>Watercare</strong> intends to achieve a 15% reduction in gross per capita water consumption by 2025.<br />
Enterprise resource planning (ERP) is a company-wide information system which consolidates information<br />
from various functions/departments. See SAP below.<br />
Version three of the Global <strong>Report</strong>ing Initiative guidelines for sustainability reporting.<br />
Gases that trap heat in the atmosphere. Examples of greenhouse gases are methane, perflurocarbons and nitrous oxide.<br />
A technology and information platform on which <strong>Watercare</strong> runs its customer business.<br />
New Zealand Immigration Service<br />
A framework which identifies the optimum time to maintain or replace assets based on operational performance,<br />
cost, health and safety and the environment.<br />
Systems, Applications and Products (SAP) is a company which offers enterprise resource planning solutions to companies<br />
to integrate information from various functions of that company under one system. See ERP above.<br />
The SCI represents <strong>Watercare</strong>’s public and legislative expression of accountability to its shareholder and<br />
establishes the agreement between the board and its shareholder.<br />
The SSP is a retrospective record of the performance of the company against the measures in its SCI.<br />
Any discharge into a sewer in the course of an industry or trade process.<br />
Water that is lost before it reaches the customer. Losses can be real losses (through leaks)<br />
or apparent losses (for example, through theft or metering inaccuracies).<br />
Liquid and solid matter discharged into the sewer network from domestic, commercial or industrial locations.<br />
PAGE 116<br />
Zero Waste<br />
<strong>Watercare</strong>’s project to minimise or eliminate wastewater throughout the company.<br />
Return to Contents page
<strong>Watercare</strong> Services Limited<br />
<strong>2011</strong> ANNUAL REPORT<br />
Return to contents page
<strong>Watercare</strong> Services Limited<br />
<strong>2011</strong> ANNUAL REPORT<br />
i<br />
For more information about <strong>Watercare</strong><br />
please visit our website www.watercare.co.nz<br />
WATERCARE SERVICES LIMITED<br />
REGISTRATION NUMBER: AK/519049<br />
PAGE 118<br />
<strong>Watercare</strong> has been certified as meeting ISO 14001 and ISO 9001<br />
for the company’s bulk water, wastewater and trade waste operations.<br />
Laboratory Services is certified as meeting ISO 17025 standard for<br />
the majority of its testing procedures.<br />
This report uses paper from sustainable plantation forests and is pH<br />
neutral. The paper stock is Elemental Chlorine Free (ECF) and has been<br />
awarded the Nordic Environmental Label. The ink used is vegetable<br />
based and mineral oil free.<br />
REGISTERED OFFICE:<br />
2 Nuffield Street, Newmarket<br />
Auckland, Private Bag 92 521<br />
Wellesley Street, Auckland 1141<br />
Telephone: +64 9 539 7300<br />
Facsimile: +64 9 539 7334<br />
Email: communications@water.co.nz<br />
Website: www.watercare.co.nz<br />
<strong>Watercare</strong> is a<br />
council organisation<br />
of Auckland Council.<br />
Return to Contents page