Posterior Subtenon Injection of Triamcinalone Acetonide for Cystoid ...
Posterior Subtenon Injection of Triamcinalone Acetonide for Cystoid ...
Posterior Subtenon Injection of Triamcinalone Acetonide for Cystoid ...

You also want an ePaper? Increase the reach of your titles
YUMPU automatically turns print PDFs into web optimized ePapers that Google loves.
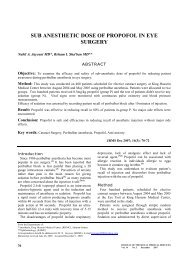
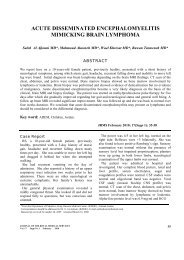
Visual acuity change by visit<br />
Visual acuity (LogMAR)<br />
1.4<br />
1.2<br />
1<br />
0.8<br />
0.6<br />
0.4<br />
0.2<br />
0<br />
Baseline<br />
1<br />
2<br />
3<br />
4<br />
5<br />
6<br />
7<br />
8<br />
9<br />
10<br />
11<br />
12<br />
13<br />
14<br />
15<br />
16<br />
17<br />
18<br />
19<br />
20<br />
21<br />
22<br />
23<br />
24<br />
Time<br />
PSTI<br />
(Weeks)<br />
Control<br />
Fig. 1. Dynamics <strong>of</strong> mean visual acuity in the PSTI and control eyes throughout the study period<br />
A<br />
B<br />
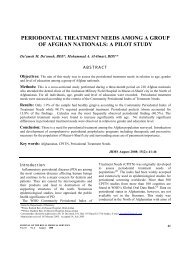
Fig. 2. Fluorescein angiogram <strong>of</strong> right eye, be<strong>for</strong>e injection (A) the LogMAR acuity 1.0 and 6 months after injection the<br />
LogMAR acuity 0.9. There is a mild reduction <strong>of</strong> dye leakage after 6 months <strong>of</strong> injection (arrow)<br />
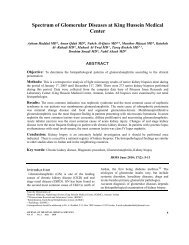
IOP changes by visit<br />
16<br />
IOP (mmHg)<br />
15.5<br />
15<br />
14.5<br />
14<br />
13.5<br />
13<br />
Baseline<br />
1<br />
2<br />
3<br />
4<br />
5<br />
6<br />
7<br />
8<br />
9<br />
10<br />
PSTI<br />
11<br />
12<br />
13<br />
Control<br />
14<br />
15<br />
16<br />
17<br />
18<br />
19<br />
20<br />
21<br />
22<br />
23<br />
24<br />
Time (Weeks)<br />
Fig. 3. Mean intraocular pressure in the PSTI and control eyes throughout the study period.<br />
from the baseline measurement was noted. Between<br />
groups, analysis reveals a statistically significant<br />
difference in mean logMAR visual acuity from the<br />
first week <strong>of</strong> observation. At the end <strong>of</strong> the second<br />
month <strong>of</strong> observation the difference reached a<br />
plateau-like maximum. During the next four months<br />
a gradual decrease in visual acuity <strong>of</strong> PSTI group<br />
was noted and this could be related to steroid effect<br />
withdrawal. Accordingly, at week 24 (end <strong>of</strong><br />
observation), the difference in LogMAR acuity<br />
between the two groups diminished, but it was still<br />
significant (p