

GNUPlot Manual
GNUPlot Manual
GNUPlot Manual

Create successful ePaper yourself
Turn your PDF publications into a flip-book with our unique Google optimized e-Paper software.
140 gnuplot 4.0 36 SET-SHOW<br />
The options are shown above in their command-line syntax. When entered as resources in ".Xdefaults",<br />
they require a different syntax.<br />
Example:<br />
gnuplot*gray: on<br />
gnuplot also provides a command line option (-pointsize ) and a resource, gnuplot*pointsize:<br />
, to control the size of points plotted with the points plotting style. The value v is a real number<br />
(greater than 0 and less than or equal to ten) used as a scaling factor for point sizes. For example,<br />
-pointsize 2 uses points twice the default size, and -pointsize 0.5 uses points half the normal size.<br />
The -noevents switch disables all mouse and key event processing (except for q and for<br />
closing the window). This is useful for programs which use the x11 driver independent of the gnuplot<br />
main program.<br />
36.59.78.3 Monochrome options For monochrome displays, gnuplot does not honor foreground<br />
or background colors. The default is black-on-white. -rv or gnuplot*reverseVideo: on requests<br />
white-on-black.<br />
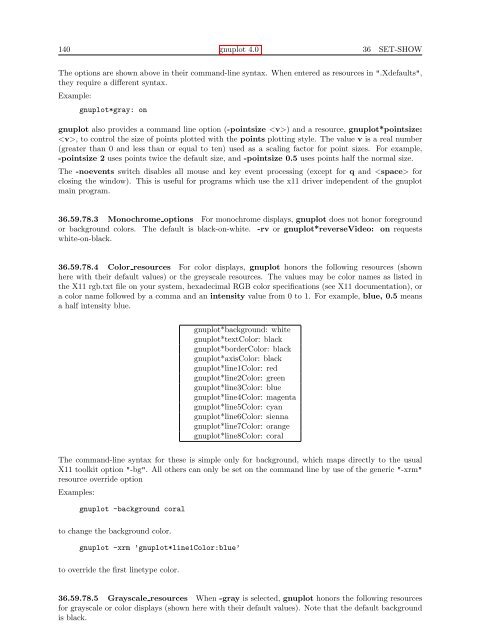
36.59.78.4 Color resources For color displays, gnuplot honors the following resources (shown<br />
here with their default values) or the greyscale resources. The values may be color names as listed in<br />
the X11 rgb.txt file on your system, hexadecimal RGB color specifications (see X11 documentation), or<br />
a color name followed by a comma and an intensity value from 0 to 1. For example, blue, 0.5 means<br />
a half intensity blue.<br />
gnuplot*background: white<br />
gnuplot*textColor: black<br />
gnuplot*borderColor: black<br />
gnuplot*axisColor: black<br />
gnuplot*line1Color: red<br />
gnuplot*line2Color: green<br />
gnuplot*line3Color: blue<br />
gnuplot*line4Color: magenta<br />
gnuplot*line5Color: cyan<br />
gnuplot*line6Color: sienna<br />
gnuplot*line7Color: orange<br />
gnuplot*line8Color: coral<br />
The command-line syntax for these is simple only for background, which maps directly to the usual<br />
X11 toolkit option "-bg". All others can only be set on the command line by use of the generic "-xrm"<br />
resource override option<br />
Examples:<br />
gnuplot -background coral<br />
to change the background color.<br />
gnuplot -xrm ’gnuplot*line1Color:blue’<br />
to override the first linetype color.<br />
36.59.78.5 Grayscale resources When -gray is selected, gnuplot honors the following resources<br />
for grayscale or color displays (shown here with their default values). Note that the default background<br />
is black.


