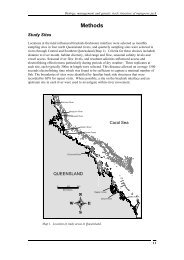
Soil Nutrient Testing: How to Get Meaningful Results
Soil Nutrient Testing: How to Get Meaningful Results
Soil Nutrient Testing: How to Get Meaningful Results

Create successful ePaper yourself
Turn your PDF publications into a flip-book with our unique Google optimized e-Paper software.
<strong>Soil</strong> <strong>Nutrient</strong> <strong>Testing</strong>: <strong>How</strong> <strong>to</strong> <strong>Get</strong> <strong>Meaningful</strong> <strong>Results</strong><br />
Dr Donald S. Loch<br />
Department of Primary Industries and Fisheries, Redlands Research Station,<br />
Cleveland<br />
Introduction<br />
The term “soil testing” refers <strong>to</strong> the full range of chemical, physical and biological<br />
tests that may be carried out on a submitted sample of soil, though in the present<br />
context only nutritional aspects will be considered. <strong>Soil</strong> testing has a long his<strong>to</strong>ry in<br />
Australian agriculture, and has contributed significantly <strong>to</strong> the development of modern<br />
scientifically-based production systems. More recently, it has become an important,<br />
but all <strong>to</strong>o often a misused, <strong>to</strong>ol for turf producers and turf managers. The present<br />
paper explains the principles on which good soil testing is based, how the results<br />
should be interpreted, and what can realistically be expected of a soil test in turf<br />
situations.<br />
Why Test <strong>Soil</strong>?<br />
<strong>Soil</strong> testing may be carried out for various purposes. Its main uses include:<br />
• Assessment of land capability for various forms of agriculture,<br />
• Identifying and quantifying soil constraints (e.g. salinity),<br />
• Moni<strong>to</strong>ring of soil fertility levels.<br />
• Providing guidelines as <strong>to</strong> the type and amount of fertiliser <strong>to</strong> be applied for<br />
optimum plant growth on the particular site and<br />
• As a diagnostic <strong>to</strong>ol <strong>to</strong> help identify reasons for poor plant performance.<br />
In the present context, the ultimate aim is <strong>to</strong> reduce the guesswork involved in<br />
managing a specific area of turf. <strong>How</strong>ever, the results and recommendations may be<br />
worthless, or even misleading, if sampling and/or analysis of submitted samples are<br />
not carried out properly or if subsequent interpretation of the data is flawed.<br />
Basic Requirements<br />
There are three basic steps that must be followed if meaningful results are <strong>to</strong> be<br />
obtained from soil testing. These are:<br />
1. To take a representative sample of soil for analysis,<br />
2. To analyse the soil using the accepted procedures that have been calibrated<br />
against fertiliser experiments in that particular region and<br />
3. To interpret the results using criteria derived from those calibration<br />
experiments.<br />
Each of these steps may be under the control of a different person or entity. For<br />
example, the sample may be taken by the farmer/turf manager or by a consultant<br />
agronomist; it is then sent <strong>to</strong> an analytical labora<strong>to</strong>ry; and finally the soil test results<br />
are interpreted by an agronomist <strong>to</strong> develop recommendations for the farmer or turf<br />
manager.<br />
13
Taking a Representative Sample<br />
Sampling is possibly the most neglected step in soil testing, and the greatest source<br />
of error in the whole process. To appreciate just how crucial it is <strong>to</strong> ensure that a<br />
representative sample is submitted for analysis, consider the fact that a hectare of<br />
soil <strong>to</strong> a depth of 10 cm weighs roughly 1500 <strong>to</strong>nnes, while the sample submitted for<br />
testing typically amounts <strong>to</strong> about 0.5 kg (or about 0.00003% of the surface soil on 1<br />
ha – just 1 part in 3 million). If such a tiny fraction is <strong>to</strong> be representative of the target<br />
area, then your sampling needs <strong>to</strong> be spot on. Otherwise, the test results will be of<br />
little or no value.<br />
<strong>How</strong> do we take a representative sample when the actual soil can vary tremendously<br />
across what might look like a uniform area <strong>to</strong>pographically? First, take a minimum of<br />
10-15 soil cores across the defined area in a random pattern, each <strong>to</strong> the required<br />
depth (usually 0-10 cm). These should then be bulked, making up a composite<br />
sample from that area. Any parts of the area that are obviously different (e.g. a gully,<br />
a low moist depression, an area where the growth is visibly different, or a raised area<br />
with shallow soil) should each be sampled separately. These sampling areas should<br />
be clearly defined and recorded for re-sampling <strong>to</strong> establish trends in future years.<br />
Bulking areas that are obviously different <strong>to</strong> save money may simply generate results<br />
that are worthless.<br />
<strong>Soil</strong> samples are usually drawn from the surface 0-10 cm, but it needs <strong>to</strong> be kept in<br />
mind that this may not always be the best approach. For example, in the case of a<br />
shallow soil with two distinct layers in the surface 0-10 cm, more meaningful results<br />
would be obtained if each layer were sampled separately rather than taking a twolayer<br />
composite sample. In other cases, we may want <strong>to</strong> know something more about<br />
what is happening (e.g. salinity levels, pH) at greater depths in the soil, in which case<br />
those deeper layers should be sampled separately.<br />
<strong>Soil</strong> Analysis<br />
Which Tests?<br />
Analytical labora<strong>to</strong>ries can provide a wide range of soil tests, each aimed at providing<br />
different information about the submitted sample; but which ones are right for your<br />
situation? Always seek advice from an independent agronomist if you need help in<br />
deciding which test (or tests) <strong>to</strong> ask the labora<strong>to</strong>ry <strong>to</strong> carry out. In some cases, it may<br />
be sufficient <strong>to</strong> have very basic tests done, starting with pH. In other cases,<br />
comprehensive analyses covering the full range of major and trace elements,<br />
exchangeable cations and soil organic matter levels will be more appropriate. For<br />
economy and convenience, labora<strong>to</strong>ries prefer <strong>to</strong> test groups of elements extracted<br />
by the same method (e.g. trace elements, cations) rather than <strong>to</strong> offer tests for each<br />
individual element.<br />
Essential <strong>Nutrient</strong>s<br />
In addition <strong>to</strong> carbon, hydrogen and oxygen which form the basis of all organic<br />
compounds, healthy turfgrass requires sufficient amounts of 14 essential nutrient<br />
elements. These essential elements are divided in<strong>to</strong> macronutrients (required in<br />
larger quantities because of their structural roles in the plant) and micronutrients<br />
(required in smaller quantities because they tend <strong>to</strong> be involved in regula<strong>to</strong>ry roles in<br />
the plant). Nitrogen (N), phosphorus (P) and potassium (K) are the primary<br />
macronutrients, and the ones most often in short supply in soils. The elements N, P<br />
and K are therefore the most likely <strong>to</strong> require replenishment in the form of applied<br />
fertiliser. Deficiencies of the secondary macronutrients—calcium (Ca), magnesium<br />
14
(Mg) and sulphur (S)—are less commonly encountered. The micronutrients required<br />
are iron (Fe), manganese (Mn), zinc (Zn), copper (Cu), molybdenum (Mo), boron (B),<br />
chlorine (Cl) and nickel (Ni); but in practice the main micronutrient deficiencies that<br />
concern us with turfgrasses are iron and manganese.<br />
Any of the above essential elements may also be present in excessive amounts,<br />
which can result in <strong>to</strong>xic effects (e.g. B and Mn). Other elements or groups of<br />
elements (e.g. sodium, bicarbonate) may also contribute <strong>to</strong> the <strong>to</strong>xic effects seen, for<br />
example, in saline or sodic soils. Sodium (Na) has been demonstrated <strong>to</strong> be an<br />
essential element for some plants with a special pho<strong>to</strong>synthetic pathway, but in<br />
practice problems result from excessive amounts of Na, not deficiences.<br />
Analytical Methods<br />
The analytical methods used by the soil test labora<strong>to</strong>ry must be applicable <strong>to</strong> your<br />
region for soil testing <strong>to</strong> meet your specific needs. To determine available (and <strong>to</strong>tal)<br />
levels of specific nutrients present, a prescribed amount of extractant is added <strong>to</strong> a<br />
fixed amount of soil and shaken for the prescribed time before filtering <strong>to</strong> recover the<br />
extractant (now with dissolved nutrients) for testing. Different extractants, times and<br />
analytical procedures are used for different nutrients or groups of nutrients.<br />
For availability purposes, the prescribed extractants are designed <strong>to</strong> remove (extract)<br />
a portion of a soil nutrient that has been correlated with a measure of plant growth<br />
(e.g. dry matter production) in regional field trials. Because of their importance, much<br />
of this work has focussed on determining available P and K levels. In the past,<br />
calibration of any new or alternative analytical procedures against actual fertiliser trial<br />
data was carried out by government researchers and labora<strong>to</strong>ries, mainly on<br />
pastures and major cultivated crops. In the absence of comparable turf-specific<br />
calibration trials, this work remains the basis of soil testing for turf use.<br />
Differences in soil type and climatic conditions will influence the availability of<br />
different nutrients and also the suitability of different extractants. Depending on the<br />
area where the soil was sampled and the correlations carried out in previous field<br />
trials, different labora<strong>to</strong>ries will use different extractants <strong>to</strong> recover nutrients in<br />
solution for subsequent analysis. Even in large countries like the USA or Australia,<br />
the extractants prescribed as the basis for testing soils from different geographical<br />
areas will vary. Analytical services are being increasingly commercialised and<br />
globalised, even <strong>to</strong> the extent that soil samples may be tested by labora<strong>to</strong>ries in<br />
another country. With this trend there is an accompanying and increasing risk that<br />
the extractants used may not be the ones previously calibrated through field trials in<br />
the region where the samples were drawn. As a result, the data obtained (no matter<br />
how glossy or slick their presentation) may simply prove unreliable and the<br />
recommendations worthless.<br />
<strong>How</strong>ever, this is not really a new problem—just an old one that has recently gotten<br />
worse. In his landmark book ‘<strong>Soil</strong> and Plant Analysis’ published in 1942, Dr C.S.<br />
Piper (one of the pioneers of soil science in Australia) wrote that while some methods<br />
‘have frequently yielded valuable data in the particular problems for which they were<br />
first proposed, they have <strong>to</strong>o often been adopted by other workers for entirely<br />
different soil types or used under entirely different conditions. It is not, therefore,<br />
surprising that under such conditions they often gave erroneous and conflicting<br />
values.’<br />
15
Exchangeable Cations<br />
<strong>Soil</strong> nutrients are mainly held on the electrically charged surfaces of soil particles.<br />
These are in dynamic equilibrium 1 with the residues of each nutrient, which are found<br />
in solution with soil water. The cations are those that form positively charged ions,<br />
enabling them <strong>to</strong> be held on the surfaces of clay and fine organic matter particles,<br />
and even within the crystalline framework of some clay minerals. In this way, the<br />
more closely held proportions form a reservoir of nutrients within the soil, and the<br />
movement of cations <strong>to</strong> and from aqueous solution is called cation exchange.<br />
The capacity of a soil <strong>to</strong> hold the major cations Ca, Mg, Na, and K (and in very acid<br />
soils hydrogen (H), aluminium (Al), and Mn) in this way is referred <strong>to</strong> as the Cation<br />
Exchange Capacity (CEC). It gives a measure of the general fertility of the soil, and<br />
is important because cations held on the exchange complex are protected from being<br />
leached out of the root zone by heavy rainfall or irrigation.<br />
Water Extraction<br />
The electrical conductivity of a saturated paste extract (EC e ) is the standard measure<br />
of soil salinity, and its sodium absorption ratio as an indica<strong>to</strong>r of the potential risk<br />
posed by excess sodium <strong>to</strong> soil structure and permeability. The Saturated Paste<br />
Extract (SPE) test involves bringing the soil sample just <strong>to</strong> the point of saturation with<br />
water, allowing it <strong>to</strong> equilibrate for at least two hours, and then extracting the soil<br />
solution by vacuum through a filter paper. Essentially, water is used as an extractant<br />
<strong>to</strong> remove ions in the soil solution and readily soluble salts not held on exchangeable<br />
sites in the soil because, in a saline soil, it is the salts in these two fractions that<br />
affect plant roots.<br />
Australian labora<strong>to</strong>ries use a dilute-water extraction technique (normally a 1:5<br />
soil:water dilution) as an alternative <strong>to</strong> the SPE method because this is easier <strong>to</strong><br />
carry out and the volume of water used can be more precisely defined. <strong>How</strong>ever,<br />
these are indirect measurements requiring a mathematical conversion fac<strong>to</strong>r (based<br />
on soil texture and chloride content) <strong>to</strong> calculate EC e , so there could be some loss of<br />
accuracy if soil texture is not determined very precisely.<br />
Some labora<strong>to</strong>ries have promoted SPE measurements of ionic concentrations as a<br />
measure of the “immediate” or short-term fertility of the soil. Typically, less than 1%<br />
of <strong>to</strong>tal plant-available nutrients are present in the soil solution for plant uptake at any<br />
one time, and nutrients removed from the soil solution by plant roots are then<br />
replaced by nutrients held on cation exchange sites and in slowly soluble fractions.<br />
Stronger extractants (acids, bicarbonates, or chelating agents) are required before<br />
nutrients available from these additional sources can be assessed accurately.<br />
<strong>Nutrient</strong>s extracted by SPE and related water-based procedures are poorly<br />
correlated with soil fertility levels and these data can result in very misleading<br />
fertiliser recommendations.<br />
Accredited Labora<strong>to</strong>ries<br />
Whilst it is important <strong>to</strong> ensure that the chosen labora<strong>to</strong>ry uses prescribed<br />
methodology, it is also important <strong>to</strong> know that soil testing is carried out accurately<br />
and that the data generated are reliable. To this end, the Australian <strong>Soil</strong> and Plant<br />
Analysis Council (ASPAC) conducts proficiency testing programs among its member<br />
labora<strong>to</strong>ries <strong>to</strong> ensure that ASPAC accredited labora<strong>to</strong>ries meet measurable quality<br />
standards.<br />
1 A state in which the different components of the system are in balance, that is input equals<br />
output.<br />
16
Interpretation of <strong>Soil</strong> Test Data<br />
Turfgrass managers want <strong>to</strong> know what fertilisers they need <strong>to</strong> apply, when <strong>to</strong> apply<br />
them and how much <strong>to</strong> apply. Except for N, recommendations on these aspects are<br />
based on the interpretation of analytical data, while making adjustments for climatic<br />
conditions, site his<strong>to</strong>ry, turf species, and level of management required. The turf<br />
manager also needs <strong>to</strong> be aware of any visual indications that might counteract some<br />
recommendations made “blind” off-site. For example, a strong clover (or other<br />
legume) component is good indica<strong>to</strong>r of high soil P levels, because these species<br />
typically require more P for growth than a grass does. In surface soils with<br />
established turf, S will mostly be tied up in organic material, but there might be little<br />
or no response <strong>to</strong> S fertilisation even on soils low in S because deeper plant roots<br />
may be tapping sufficient S below the usual 0-10 cm sampling zone.<br />
<strong>Soil</strong> Analysis Reports<br />
On completion of their analysis of your soil sample, the labora<strong>to</strong>ry will issue a <strong>Soil</strong><br />
Analysis Report (see the example in Figure 1), showing the results of each test and<br />
the units of measurement in each case. The presentation and format will vary, but it<br />
should also list the methods used <strong>to</strong> derive each of the results shown, because<br />
independent interpretation is impossible without knowing how the individual tests<br />
were done. Even so, if the methods differ from those routinely used in the region and<br />
have not been calibrated against fertiliser response trials in that region, independent<br />
interpretation is probably impossible anyway.<br />
When seeking <strong>to</strong> compare different sites or establish trends in soil fertility over time, it<br />
is important <strong>to</strong> compare like with like; and here the methods of analysis are all<br />
important. For example, pH determined by adding only water <strong>to</strong> soil will typically be<br />
higher than if pH of the same soil were determined by adding a solution of calcium<br />
chloride. Likewise, data for Organic Carbon (Organic C) are not comparable with<br />
Organic Matter data, which are derived from Organic C measurements using a<br />
conversion fac<strong>to</strong>r. Similarly, different methods of deriving Organic C will give<br />
somewhat different results, and are not directly comparable.<br />
While the figures on a soil analysis report may appear <strong>to</strong> be very precise, these relate<br />
<strong>to</strong> the sample of soil as submitted. Interpretation, on the other hand, is aimed at<br />
understanding trends in, and developing recommendations for, the area from which<br />
the sample was taken. The reported data should therefore be treated as indicative or<br />
ballpark figures rather than as absolutely precise numbers. In this context, small<br />
changes in a soil parameter from one sampling date <strong>to</strong> the next do not necessarily<br />
indicate a developing trend or a need <strong>to</strong> change current management practices. This<br />
is where an experienced turf agronomist and local knowledge can help by ensuring<br />
that the data are interpreted realistically.<br />
Sufficiency Levels of Available <strong>Nutrient</strong>s<br />
<strong>Soil</strong> test results for extractable (plant-available) nutrients should be assessed against<br />
pre-determined sufficiency levels for each nutrient. The results are ranked in<strong>to</strong><br />
categories of very low, low, medium, high and very high—indicative of the soil’s<br />
ability <strong>to</strong> supply nutrients <strong>to</strong> plants (see Table 1). Another way of looking at these<br />
categories is that they are indicative of the amount of fertiliser required in each<br />
category <strong>to</strong> meet plant needs and <strong>to</strong> raise soil nutrient status <strong>to</strong> the desired level of<br />
sufficiency, hence the use of sufficiency level ratings <strong>to</strong> develop fertiliser<br />
recommendations.<br />
17
Figure 1.<br />
Example of a soil analysis report.<br />
18
Table 1. Examples of critical nutrient ranges used for interpreting soil tests and<br />
developing fertiliser recommendations in Queensland.<br />
Element<br />
(units)<br />
Analytical<br />
Method<br />
Very<br />
Low<br />
<strong>Nutrient</strong> Level:<br />
Low Medium High Very<br />
High<br />
P (ppm) Colwell 40<br />
Exch. K<br />
(meq%)<br />
Exch. K (ppm)<br />
Ammonium<br />
acetate<br />
Ammonium<br />
acetate<br />
400<br />
Cu (ppm) DTPA 15<br />
Zn (ppm) DTPA 15<br />
(pH
Nitrogen is the main element required <strong>to</strong> promote grass growth, but it is also the most<br />
mobile and easily leached nutrient and its concentration in the soil can vary<br />
considerably over time and from place <strong>to</strong> place. Unlike the other macronutrients, N<br />
recommendations are better based on regional fertiliser trials conducted over a<br />
number of years rather than on soil test levels. The recommended rate, however,<br />
may need some adjustment based on fac<strong>to</strong>rs such as soil organic matter levels, turf<br />
use, the required colour and quality, and the geographical region where it is being<br />
grown. A nitrogen maintenance trial on five major turfgrass species is currently under<br />
way at Redlands Research Station.<br />
Maintaining “Ideal” Cation Ratios<br />
The term “base saturation” describes the degree <strong>to</strong> which the available exchange<br />
sites in the soil are occupied by the basic cations (i.e. Ca, Mg, K, Na). Some<br />
labora<strong>to</strong>ries and agronomists have promoted the idea of maintaining an “ideal”<br />
balance of cations on the exchange complex, which is referred <strong>to</strong> as the Base<br />
Saturation Ratio approach. This concept was first proposed by Dr Firman Bear in<br />
the 1940s and later continued by Dr William Albrecht, based on their work with fertile<br />
soils in north-eastern USA. In the so-called Albrecht Method, nutrients are applied in<br />
sufficient quantities <strong>to</strong> maintain, or bring the soil back in<strong>to</strong>, an “ideal” balance of<br />
cations, though the preferred ranges specified for the percentage of each cation do<br />
vary between proponents of the Albrecht Method (Table 2).<br />
Table 2. “Ideal” cation percentages on the exchange complex as proposed by<br />
various sources (1945-present).<br />
Cation Bear et al. (1945) Graham (1959) Baker &<br />
Amacher (1981)<br />
Ninemire Labs.<br />
Ca ++ 65 65-85 60-80 68-72<br />
Mg ++ 10 6-12 10-20 13-16<br />
K + 5 2-5 2-5 3-5<br />
Na + 2.0 meq% of Ca and Mg will generally have<br />
sufficient levels of these two elements for plant growth. Typical examples of Albrechtbased<br />
recommendations are: a) <strong>to</strong> fertilise <strong>to</strong> bring a particular cation up <strong>to</strong> a certain<br />
percentage on the CEC sites, b) <strong>to</strong> raise the percent base saturation of that cation <strong>to</strong><br />
some designated value, or c) <strong>to</strong> adjust <strong>to</strong> a particular ratio between cations.<br />
20
Over the years, numerous scientists have questioned the usefulness and validity of<br />
the Albrecht approach. For example, wide variations in percent CEC saturation for<br />
each cation (other than sodium) and the ratios between cations have been reported,<br />
and these differences do not correlate well with plant response. There is little<br />
evidence for "ideal" cation ratios or for a percent base saturation level (e.g. 65-85%<br />
for Ca) as being "ideal"; and in low exchange capacity soils, raising the base<br />
saturation percentage for Ca in<strong>to</strong> this range can lead <strong>to</strong> an excessively high soil pH.<br />
Furthermore, the continued inclusion by some labora<strong>to</strong>ries of hydrogen (H + ) ions<br />
among the exchangeable cations in such calculations is erroneous, particularly as<br />
the existence of this fraction has long been discredited as an artifact of the analytical<br />
process. As summed up by Haby et al. (1990) in their review of soil testing<br />
methodology in the USA:<br />
"Numerous experiments over the past 40[-60] years ... have<br />
demonstrated that the use of the [Albrecht] approach alone for making<br />
fertilizer recommendations is both scientifically and economically<br />
questionable".<br />
Plant Tissue Analysis<br />
<strong>Soil</strong> and plant analysis meet different needs for the turf manager. When properly<br />
used they complement one another in terms of the information provided. Plant tissue<br />
analysis gives a much more direct measure of what the plant is using; the procedures<br />
are universally applicable (in contrast <strong>to</strong> soil testing methodology); and regular plant<br />
tissue testing enables plant nutrient status <strong>to</strong> be moni<strong>to</strong>red.<br />
<strong>How</strong>ever, the interpretation of plant analysis data for turfgrasses is not always<br />
straight forward. At present, the biggest problem with being able <strong>to</strong> use plant tissue<br />
analysis routinely is that reliable interpretive data are lacking for most of the warmseason<br />
turf species and cultivars we use in Australia. The relevant criteria still need<br />
<strong>to</strong> be developed through future experiments.<br />
Concluding Remarks<br />
In conclusion, I would re-emphasise (as stated at the beginning of this paper) that<br />
there are three basic steps that must be followed <strong>to</strong> get meaningful results from soil<br />
testing:<br />
1. Take a representative sample of soil for analysis;<br />
2. Analyse the soil using the accepted procedures that have been calibrated<br />
against fertiliser experiments in that particular region; and<br />
3. Interpret the results using criteria derived from those calibration experiments.<br />
With respect <strong>to</strong> these three steps, soil testing is a package deal: you cannot leave out<br />
or compromise any one of these three steps if you hope <strong>to</strong> apply meaningful<br />
information <strong>to</strong> the turf you grow or manage.<br />
21
References and Further Reading<br />
Baker, Dale E., and Amacher, M.C. (1981). The development and interpretation of a<br />
diagnostic soil-testing program. Pennsylvania State University Agricultural<br />
Experiment Station Bulletin 826. State College, PA.<br />
Baker, Dennis E., and Eldershaw, V.J. (1993). Interpreting soil analyses – for agricultural<br />
land use in Queensland. DPI Project Report Series QO93014. Department of Primary<br />
Industries, Brisbane, Qld.<br />
Bruce, R.C., and Rayment, G.E. (1982). Analytical methods and interpretations used by<br />
the Agricultural Chemistry Branch for soil and land use surveys. DPI Bulletin<br />
QB82004. Department of Primary Industries, Brisbane, Qld.<br />
Carrow, R.N., S<strong>to</strong>well, L., Gelernter, W., Davis, S., Duncan, R.R., and Skorulski, J.<br />
(2003). Clarifying soil testing: I. Saturated paste and dilute extracts. Golf Course<br />
Management 71(9):81-85.<br />
Carrow, R.N., Wadding<strong>to</strong>n, D.V., and Rieke, P.E. (2001). Turfgrass <strong>Soil</strong> Fertility and<br />
Chemical Problems: Assessment and Management, Ann Arbor Press, Chelsea, MI.<br />
Graham E.R. (1959) An explanation of theory and methods of soil testing. Missouri<br />
Agricultural Research Station Bulletin 734.<br />
Haby, V.A., Russelle, M.P., and Skogley, E.O. (1990). <strong>Testing</strong> soils for potassium,<br />
calcium and magnesium. In R.L. Westerman (ed.). <strong>Soil</strong> <strong>Testing</strong> and Plant Analysis,<br />
3rd Edition. <strong>Soil</strong> Science Society of America Book Series No. 3. SSSA, Madison, WI.<br />
Piper, C.S. (1942). <strong>Soil</strong> and Plant Analysis. University of Adelaide, South Australia.<br />
Peverill, K.I., Sparrow, L.A., and Reuter, D.J. (Eds.) (1999). <strong>Soil</strong> Analysis: An<br />
Interpretation Manual, CSIRO Publishing, Collingwood, Vic<strong>to</strong>ria.<br />
Rayment, G.E., and Higginson, F.R. (1992). Australian Labora<strong>to</strong>ry Handbook of <strong>Soil</strong> and<br />
Water Chemical Methods. Australian <strong>Soil</strong> and Land Survey Handbooks Vol. 3. Inkata<br />
Press, Sydney, NSW.<br />
Reuter, D.J., Robinson, J.B., and Dutkiewicz, C. (Eds.) (1997). Plant Analysis: An<br />
Interpretation Manual (Second Edition), CSIRO Publishing, Collingwood, Vic<strong>to</strong>ria.<br />
22