Review of 2006 Ten-Year Site Plans - Public Service Commission
Review of 2006 Ten-Year Site Plans - Public Service Commission
Review of 2006 Ten-Year Site Plans - Public Service Commission

You also want an ePaper? Increase the reach of your titles
YUMPU automatically turns print PDFs into web optimized ePapers that Google loves.
<strong>Review</strong> <strong>of</strong> 2007 <strong>Ten</strong>-<strong>Year</strong> <strong>Site</strong> <strong>Plans</strong><br />
for Florida’s Electric Utilities<br />
Florida <strong>Public</strong> <strong>Service</strong> <strong>Commission</strong><br />
Tallahassee, Florida<br />
December 2007
TABLE OF CONTENTS<br />
List <strong>of</strong> Tables .................................................................................................................................iii<br />
List <strong>of</strong> Figures................................................................................................................................ iv<br />
List <strong>of</strong> Utilites Filing a <strong>Ten</strong>-<strong>Year</strong> <strong>Site</strong> Plan ....................................................................................v<br />
List <strong>of</strong> Acronyms ........................................................................................................................... vi<br />
1. Executive Summary................................................................................................................... 1<br />
2. Introduction................................................................................................................................ 5<br />
Statutory Authority .............................................................................................................5<br />
Purpose................................................................................................................................ 5<br />
Resource Additions............................................................................................................. 6<br />
3. Fuel Diversity............................................................................................................................. 8<br />
Balanced Fuel Supply ......................................................................................................... 8<br />
Outlook ............................................................................................................................. 12<br />
Conclusion ........................................................................................................................ 15<br />
4. Generation................................................................................................................................ 16<br />
Load and Energy Forecast ................................................................................................ 16<br />
Demand-Side Management............................................................................................... 17<br />
Renewable Energy ............................................................................................................ 22<br />
Proposed generating units requiring certification............................................................. 28<br />
5. Transmission <strong>Plans</strong> .................................................................................................................. 29<br />
Reliability Standards......................................................................................................... 29<br />
FRCC Transmission Planning Process ............................................................................. 30<br />
2007-2016 Long Range Transmission Study.................................................................... 31<br />
Florida-Southern Interface Transfer Capability Study ..................................................... 31<br />
Proposed Transmission Lines Requiring Certification..................................................... 32<br />
6. Fuel Supply, Price, and Transportaion..................................................................................... 33<br />
Natural Gas Price Forecasts.............................................................................................. 34<br />
Coal Price Forecasts.......................................................................................................... 36<br />
Residual Oil Prices and Distillate Oil Prices .................................................................... 37<br />
Nuclear Fuel Prices........................................................................................................... 38<br />
7. State, Regional, and Local Agency Comments ....................................................................... 39<br />
<strong>Review</strong> <strong>of</strong> 2007 <strong>Ten</strong>-<strong>Year</strong> <strong>Site</strong> <strong>Plans</strong><br />
ii
LIST OF TABLES<br />
Table 1. State <strong>of</strong> Florida: Proposed Capacity Additions........................................................................7<br />
Table 2. Summary <strong>of</strong> Proposed Coal Plants in 2007 TYSP.................................................................13<br />
Table 3. Total Retail Energy Sales: Historical Forecast Accuracy .....................................................16<br />
Table 4. Projected Growth Rates <strong>of</strong> DSM Savings...............................................................................18<br />
Table 5. State <strong>of</strong> Florida: Renewable Energy Sources Providing Firm Capacity ..............................23<br />
Table 6. State <strong>of</strong> Florida: Self-<strong>Service</strong> and Non-Firm Renewable Energy Sources...........................24<br />
Table 7. Contribution <strong>of</strong> Renewable Energy to Net Energy for Load .................................................25<br />
Table 8. PV Interconnection Summary .................................................................................................25<br />
Table 9. Future Renewable Projects ......................................................................................................26<br />
Table 10. Proposed Generating Units Requiring Certification...............................................................28<br />
Table 11. Florida-Southern Interface Transfer Capability......................................................................31<br />
Table 12. Proposed Transmission Lines Requiring Certification ..........................................................32<br />
<strong>Review</strong> <strong>of</strong> 2007 <strong>Ten</strong>-<strong>Year</strong> <strong>Site</strong> <strong>Plans</strong><br />
iii
LIST OF FIGURES<br />
Figure 1. State <strong>of</strong> Florida: Electric Utility Capacity Mix.......................................................................7<br />
Figure 2. State <strong>of</strong> Florida: Energy Generation by Fuel Type (GWh) ...................................................9<br />
Figure 3. State <strong>of</strong> Florida: Energy Generation by Fuel Type (Percent <strong>of</strong> Total)..................................9<br />
Figure 4. Average Residential Electric Bill: 1980 to Present ..............................................................10<br />
Figure 5. Projected Peninsular Florida Generation by Natural Gas .....................................................14<br />
Figure 6. State <strong>of</strong> Florida: DSM Net Energy for Load Savings ..........................................................19<br />
Figure 7. State <strong>of</strong> Florida: DSM Summer Peak Demand Savings......................................................19<br />
Figure 8. State <strong>of</strong> Florida: DSM Winter Peak Demand Savings.........................................................19<br />
Figure 9. State <strong>of</strong> Florida: Energy Consumption per Residential Customer ......................................20<br />
Figure 10. Conservation Expenses for IOUs...........................................................................................21<br />
Figure 11. Firm Capacity Renewable Energy Sources by Fuel Type (507.2 MW)..............................22<br />
Figure 12. Non-Firm Renewable Energy Sources by Fuel Type (615.8 MW) .....................................22<br />
Figure 13. Firm Capacity Renewable Energy Sources by Utility ..........................................................22<br />
Figure 14. Non-Firm Renewable Energy Sources by Utility .................................................................22<br />
Figure 15. Reporting Utilities: 2007 Weighted Average Fuel Price Forecast .......................................33<br />
Figure 16. Natural Gas Consumption in the U.S. by Place <strong>of</strong> Origin ....................................................34<br />
<strong>Review</strong> <strong>of</strong> 2007 <strong>Ten</strong>-<strong>Year</strong> <strong>Site</strong> <strong>Plans</strong><br />
iv
LIST OF UTILITIES FILING A TEN-YEAR SITE PLAN<br />
FPL<br />
GULF<br />
PEF<br />
TECO<br />
FMPA<br />
JEA<br />
LAK<br />
OUC<br />
TAL<br />
SEC<br />
Florida Power & Light Company<br />
Gulf Power Company<br />
Progress Energy Florida<br />
Tampa Electric Company<br />
Florida Municipal Power Agency<br />
JEA (formerly Jacksonville Electric Authority)<br />
City <strong>of</strong> Lakeland<br />
Orlando Utilities <strong>Commission</strong><br />
City <strong>of</strong> Tallahassee<br />
Seminole Electric Cooperative<br />
<strong>Review</strong> <strong>of</strong> 2007 <strong>Ten</strong>-<strong>Year</strong> <strong>Site</strong> <strong>Plans</strong><br />
v
LIST OF ACRONYMS<br />
CC<br />
<strong>Commission</strong><br />
CPVRR<br />
CT<br />
DEP<br />
DOE<br />
DSM<br />
ECCR<br />
EIA<br />
ERO<br />
EUE<br />
FEECA<br />
FRCC<br />
IGCC<br />
LNG<br />
LOLP<br />
MMBtu<br />
MSW<br />
MW<br />
NEL<br />
NERC<br />
PC<br />
PPSA<br />
RFP<br />
RTO<br />
TLSA<br />
Combined Cycle generating unit<br />
Florida <strong>Public</strong> <strong>Service</strong> <strong>Commission</strong><br />
Cumulative Present Value Revenue Requirements<br />
Combustion Turbine generating unit<br />
Florida Department <strong>of</strong> Environmental Protection<br />
United States Department <strong>of</strong> Energy<br />
Demand-Side Management<br />
Energy Conservation Cost Recovery Clause<br />
Energy Information Administration<br />
Electric Reliability Organization<br />
Expected Unserved Energy<br />
Florida Energy Efficiency and Conservation Act<br />
Florida Reliability Coordinating Council<br />
Integrated Coal Gasification Combined Cycle generating unit<br />
Liquefied Natural Gas<br />
Loss <strong>of</strong> Load Probability<br />
Million British Thermal Units<br />
Municipal Solid Waste<br />
Megawatt<br />
Net Energy for Load<br />
North American Electric Reliability Corporation<br />
Pulverized Coal generating unit<br />
Power Plant Siting Act<br />
Request for Proposals<br />
Regional Transmission Organization<br />
Transmission Line Siting Act<br />
<strong>Review</strong> <strong>of</strong> 2007 <strong>Ten</strong>-<strong>Year</strong> <strong>Site</strong> <strong>Plans</strong><br />
vi
1. EXECUTIVE SUMMARY<br />
Suitability<br />
Over the past few years, the Legislature and the <strong>Commission</strong> have stressed the importance <strong>of</strong><br />
utilities maintaining a balanced fuel supply. Florida’s utilities responded to these concerns through the<br />
inclusion <strong>of</strong> one nuclear and several coal-fired power plants in their 2007 <strong>Ten</strong>-<strong>Year</strong> <strong>Site</strong> <strong>Plans</strong> which<br />
were filed on April 2, 2007. Subsequent to the filing <strong>of</strong> the 2007 <strong>Ten</strong>-<strong>Year</strong> <strong>Site</strong> <strong>Plans</strong>, the uncertainty<br />
associated with future natural gas and coal prices and emerging energy policy at the state and federal<br />
levels concerning the impact <strong>of</strong> greenhouse gas emissions have resulted in several coal-fired plants no<br />
longer being considered as part <strong>of</strong> the current planning process. The affected utilities and associated<br />
power plants are listed below: 1<br />
• Florida Power and Light (FPL): Florida Glades Power Park (1980 MW)<br />
• Florida Municipal Power Agency (FMPA), JEA (formerly Jacksonville Electric<br />
Authority), Reedy Creek Improvement District (RCI), 2 and City <strong>of</strong> Tallahassee<br />
(TAL): Taylor Energy Center (768 MW)<br />
• Tampa Electric Company (TECO): Polk Unit 6 (630 MW)<br />
• Orlando Utilities <strong>Commission</strong> (OUC): Stanton Unit B (250 MW)<br />
Additional details regarding the potential replacement <strong>of</strong> these coal plants are discussed in<br />
Chapter 3 <strong>of</strong> this report.<br />
Pursuant to Section 186.801, Florida Statutes, the <strong>Commission</strong> has reviewed the utilities’ 2007<br />
<strong>Ten</strong>-<strong>Year</strong> <strong>Site</strong> <strong>Plans</strong> and finds them to be suitable because the plans were responsive to the energy<br />
policies in place at the time <strong>of</strong> filing. The <strong>Commission</strong> does expect, however, that the utilities’ 2008<br />
<strong>Ten</strong>-<strong>Year</strong> <strong>Site</strong> <strong>Plans</strong> will address alternatives to these coal-fired power plants, including a thorough<br />
review <strong>of</strong> additional demand-side conservation and supply-side generation needed to maintain an<br />
adequate, reliable, economical, and environmentally-sound supply <strong>of</strong> electricity for the citizens <strong>of</strong><br />
Florida.<br />
Areas <strong>of</strong> Concern<br />
Fuel Diversity<br />
Maintaining a balanced fuel supply adds value in terms <strong>of</strong> supply reliability and price stability.<br />
Fuel diversity is not always a cost-savings measure, but rather a risk mitigation strategy. Maintaining<br />
a balanced mix <strong>of</strong> fuel sources enhances reliability <strong>of</strong> supply and allows utilities to mitigate the effects<br />
<strong>of</strong> volatile price fluctuations. For example, the actual cost <strong>of</strong> natural gas for FPL more than doubled<br />
between 2002 and <strong>2006</strong>. Florida’s utilities responded to these concerns by proposing several coalfired<br />
plants in their 2007 <strong>Ten</strong>-<strong>Year</strong> <strong>Site</strong> <strong>Plans</strong>.<br />
1 In addition to the plants listed which are no longer being planned for construction as coal-fired units, Seminole Unit 3 (750 MW) was denied certification by<br />
the Department <strong>of</strong> Environmental Protection. Seminole has appealed this decision and a final decision has not been reached.<br />
2 Reedy Creek Improvement District does not file a <strong>Ten</strong>-<strong>Year</strong> <strong>Site</strong> Plan.<br />
<strong>Review</strong> <strong>of</strong> 2007 <strong>Ten</strong>-<strong>Year</strong> <strong>Site</strong> <strong>Plans</strong> 1
Proposed solid fuel plants identified in the utilities’ 2007 <strong>Ten</strong>-<strong>Year</strong> <strong>Site</strong> <strong>Plans</strong> have<br />
encountered resistance on many fronts. Fuel cost uncertainties, high capital costs, and uncertainties<br />
regarding potential expenses related to future carbon emission regulations have all been cited as<br />
concerns. Consequently, the generation additions identified in many <strong>of</strong> the utilities’ 2007 <strong>Ten</strong>-<br />
<strong>Year</strong> <strong>Site</strong> <strong>Plans</strong> are no longer indicative <strong>of</strong> Florida’s future capacity additions. As a result, more<br />
than 4,000 MW <strong>of</strong> proposed capacity additions identified in the 2007 <strong>Ten</strong>-<strong>Year</strong> <strong>Site</strong> <strong>Plans</strong> need to be<br />
replaced. If, for example, natural gas becomes the de facto replacement fuel <strong>of</strong> choice, this option will<br />
result in natural gas generation producing more than 50 percent <strong>of</strong> Florida’s energy as early as 2013.<br />
Recent issues and events influencing the level <strong>of</strong> fuel diversity in Florida are summarized as<br />
follows:<br />
• A first step toward attaining fuel diversity is the pursuit <strong>of</strong> non-generating alternatives to new<br />
construction, such as energy conservation and demand-side management (DSM). During<br />
2007, the <strong>Commission</strong> approved 12 new DSM programs for electric utilities, as well as<br />
modifications to 9 existing electric utility DSM programs. These actions should increase<br />
customer participation and reduce peak demand by approximately 66 MW over the planning<br />
horizon.<br />
• Customer choices to reduce energy consumption will help electric utilities defer the need for<br />
future generating units and transmission lines. Using existing resources as long as possible<br />
and taking full advantage <strong>of</strong> DSM and energy conservation measures is important as fossil<br />
fuels, plant sites, and transmission corridors become increasingly scarce in the state.<br />
• Renewable generation is another key component <strong>of</strong> a diversified generation mix. In March<br />
2007, the <strong>Commission</strong> finalized rules requiring utilities to continuously <strong>of</strong>fer to purchase<br />
capacity and energy from renewable generators. On May 22, 2007, the <strong>Commission</strong> approved<br />
standard <strong>of</strong>fer contracts resulting in the continuous <strong>of</strong>fering <strong>of</strong> approximately 2,400 MW for<br />
Florida’s four largest investor-owned utilities (IOUs). However, three <strong>of</strong> the four standard<br />
<strong>of</strong>fer contracts filed were protested and a hearing is currently scheduled for early 2008.<br />
• Since January 1, 2007, the <strong>Commission</strong> has approved two negotiated purchased power<br />
contracts with renewable generators totaling approximately 120 MW. Three IOUs have also<br />
issued requests for proposals <strong>of</strong> capacity or energy that would come from renewable sources.<br />
• FPL has recently announced that it is pursuing a wind project, up to approximately 20 MW,<br />
in St. Lucie County and as much as 300 MW <strong>of</strong> solar powered generating capacity. However,<br />
the company has not provided estimates <strong>of</strong> in-service dates or cost-effectiveness analyses for<br />
these facilities.<br />
<strong>Review</strong> <strong>of</strong> 2007 <strong>Ten</strong>-<strong>Year</strong> <strong>Site</strong> <strong>Plans</strong> 2
• The <strong>Commission</strong> held workshops in January, April, and July 2007, assessing the availability,<br />
development, and facilitation <strong>of</strong> additional renewable energy in Florida. The <strong>Commission</strong><br />
conducted a rule development workshop on net metering and interconnection standards for<br />
renewable generators in August 2007, followed by a staff workshop in October 2007. On<br />
December 18, 2007, the <strong>Commission</strong> proposed a net metering and interconnection rule that<br />
would apply to all renewable generation technologies up to 2 MW in size, expedite the<br />
interconnection <strong>of</strong> customer-owned renewable generation, and allow customers to <strong>of</strong>fset their<br />
consumption through net metering. Comments on the proposed rule must be filed by January<br />
25, 2008.<br />
• In 2007, three determination <strong>of</strong> need petitions, totaling over 3,300 MW <strong>of</strong> planned coal-fired<br />
generation, were filed with the <strong>Commission</strong>. Two petitions were withdrawn 3 by the utilities<br />
and one was denied by the <strong>Commission</strong> because the utility failed to demonstrate that the<br />
proposed project was the most cost-effective alternative available. In addition, the 750 MW<br />
coal-fired Seminole Unit 3 was denied final certification by the Department <strong>of</strong> Environmental<br />
Protection (DEP) on August 15, 2007. This decision has been appealed by SEC.<br />
• On May 24, <strong>2006</strong>, the <strong>Commission</strong> approved the need for OUC to construct a 249 MW IGCC<br />
plant slated to be in service by 2010. On November 15, 2007, the OUC announced that it was<br />
canceling the unit in favor <strong>of</strong> a natural gas-fired combined cycle unit, again because <strong>of</strong><br />
economic and environmental uncertainty.<br />
• Both FPL and PEF have announced plans to expand the capacity at each <strong>of</strong> their existing<br />
nuclear plants. The <strong>Commission</strong> approved the need for the uprate for the PEF unit on<br />
February 8, 2007. On December 10, 2007, the <strong>Commission</strong> approved the need for the uprates<br />
<strong>of</strong> the FPL units. Combined, the uprates <strong>of</strong> the PEF and FPL units will add approximately 600<br />
MW <strong>of</strong> additional nuclear capacity for the years 2009 through 2013.<br />
• PEF’s <strong>Ten</strong>-<strong>Year</strong> <strong>Site</strong> Plan includes plans to construct a new 1,125 MW nuclear plant by 2016.<br />
On October 16, 2007, FPL filed a petition for determination <strong>of</strong> need for two new nuclear units,<br />
up to 1,500 MW each, for the years 2018 and 2020. PEF is expected to file a petition for need<br />
determination in early 2008. If constructed and placed into service, these units would further<br />
diversify Florida’s generation mix.<br />
• Because <strong>of</strong> the long lead times associated with new nuclear generation and the removal <strong>of</strong><br />
several coal-fired generating plants from the current planning process utilities are likely to add<br />
natural gas-fired power plants in the near future. Therefore, utilities should continue to<br />
evaluate diversity within a fuel type, such as liquefied natural gas (LNG) and gas storage, as<br />
options to traditional sources and delivery methods for natural gas.<br />
3 The Taylor Energy Center and the Polk Unit 6 projects were withdrawn from the certification process.<br />
<strong>Review</strong> <strong>of</strong> 2007 <strong>Ten</strong>-<strong>Year</strong> <strong>Site</strong> <strong>Plans</strong> 3
Outlook<br />
Florida’s utilities must continue to explore alternatives to natural gas energy generation.<br />
Greater emphasis must be placed on increasing public knowledge and awareness <strong>of</strong> energy<br />
conservation. Utilities must continue to develop and employ all cost-effective DSM measures. Ongoing<br />
efforts to further develop and employ renewable energy generation by both utilities and<br />
customers should provide Florida’s utilities with added non-traditional energy generation. The<br />
construction <strong>of</strong> new nuclear generation will not only increase fuel diversity but provide energy<br />
without the emission <strong>of</strong> greenhouse gases. Advancements toward “clean coal” technology and the<br />
resolution <strong>of</strong> greenhouse gas emission standards are needed to address the uncertainties currently<br />
associated with the addition <strong>of</strong> coal generated energy.<br />
Forecasts <strong>of</strong> the state’s growing total energy demand continue to surpass current conservation,<br />
DSM, and renewable energy programs <strong>of</strong>fered by Florida’s utilities. Meeting this increasing demand<br />
will require the addition <strong>of</strong> traditional generation capacity to satisfy reliability requirements. The<br />
recent denial and withdrawal <strong>of</strong> several coal-fired units from the utilities’ plans may result in the<br />
addition <strong>of</strong> natural gas-fired generation over the next several years. Therefore, utilities should<br />
continue to evaluate all options <strong>of</strong> natural gas supply and delivery, such as liquefied natural gas<br />
(LNG), natural gas storage, and possibly additional pipelines, to meet the increasing demand for<br />
natural gas.<br />
<strong>Review</strong> <strong>of</strong> 2007 <strong>Ten</strong>-<strong>Year</strong> <strong>Site</strong> <strong>Plans</strong> 4
2. INTRODUCTION<br />
STATUTORY AUTHORITY<br />
Section 186.801, Florida Statutes, requires that all major generating electric utilities in Florida<br />
submit a <strong>Ten</strong>-<strong>Year</strong> <strong>Site</strong> Plan to the Florida <strong>Public</strong> <strong>Service</strong> <strong>Commission</strong> (<strong>Commission</strong>) for review.<br />
Section 377.703(3)(e), Florida Statutes, requires the <strong>Commission</strong> to analyze and provide natural gas<br />
and electricity forecasts to the Florida Department <strong>of</strong> Environmental Protection (DEP).<br />
Each utility’s <strong>Ten</strong>-<strong>Year</strong> <strong>Site</strong> Plan contains projections <strong>of</strong> the utility's electric power needs, fuel<br />
requirements, and the general location <strong>of</strong> proposed power plant sites and major transmission facilities.<br />
In accordance with the statute, the <strong>Commission</strong> performs a preliminary study <strong>of</strong> each <strong>Ten</strong>-<strong>Year</strong> <strong>Site</strong><br />
Plan and is required to determine whether it is suitable or unsuitable. The results <strong>of</strong> the<br />
<strong>Commission</strong>’s study are contained in this report, <strong>Review</strong> <strong>of</strong> 2007 <strong>Ten</strong>-<strong>Year</strong> <strong>Site</strong> <strong>Plans</strong>, which is<br />
forwarded to the DEP for use in subsequent power plant siting proceedings.<br />
To fulfill the requirements <strong>of</strong> Section 186.801, Florida Statutes, the <strong>Commission</strong> has adopted<br />
Rules 25-22.070 through 25-22.072, Florida Administrative Code. Electric utilities must file an<br />
annual <strong>Ten</strong>-<strong>Year</strong> <strong>Site</strong> Plan by April 1. Utilities whose existing generating capacity is below 250<br />
megawatts (MW) are exempt from this requirement unless the utility plans to build a new unit larger<br />
than 75 MW within the ten-year planning period. Investor-owned utilities (IOUs) filing 2007 <strong>Ten</strong>-<br />
<strong>Year</strong> <strong>Site</strong> <strong>Plans</strong> include Florida Power and Light (FPL), Tampa Electric Company (TECO), Gulf<br />
Power Company (GULF), and Progress Energy Florida (PEF). Municipal utilities filing 2007 <strong>Ten</strong>-<br />
<strong>Year</strong> <strong>Site</strong> <strong>Plans</strong> include Florida Municipal Power Agency (FMPA), Orlando Utilities <strong>Commission</strong><br />
(OUC), City <strong>of</strong> Lakeland (LAK), City <strong>of</strong> Tallahassee (TAL), and JEA (formerly Jacksonville Electric<br />
Authority). Seminole Electric Cooperative (SEC) also filed a 2007 <strong>Ten</strong>-<strong>Year</strong> <strong>Site</strong> Plan. Gainesville<br />
Regional Utilities (GRU) did not file a 2007 <strong>Ten</strong>-<strong>Year</strong> <strong>Site</strong> Plan.<br />
PURPOSE<br />
The <strong>Commission</strong> has broad-based authority over the reliability <strong>of</strong> Florida’s electric system<br />
pursuant to Chapter 366, Florida Statutes, known as the "Grid Bill." The Grid Bill gives the<br />
<strong>Commission</strong> jurisdiction over the “planning, development, and maintenance <strong>of</strong> a coordinated electric<br />
power grid throughout Florida to assure an adequate and reliable source <strong>of</strong> energy for operational and<br />
emergency purposes in Florida.” This <strong>Review</strong> <strong>of</strong> 2007 <strong>Ten</strong>-<strong>Year</strong> <strong>Site</strong> <strong>Plans</strong> serves as a foundation for<br />
exercising the <strong>Commission</strong>’s authority under the Grid Bill.<br />
A <strong>Ten</strong>-<strong>Year</strong> <strong>Site</strong> Plan gives state, regional, and local agencies advance notice <strong>of</strong> proposed<br />
power plants and transmission facilities. The <strong>Commission</strong> receives comments from the<br />
aforementioned agencies regarding various issues <strong>of</strong> concern. These comments are summarized in<br />
Chapter 7. Because a utility’s <strong>Ten</strong>-<strong>Year</strong> <strong>Site</strong> Plan is a planning document containing tentative data, it<br />
may not contain sufficient information to allow regional planning councils, water management<br />
districts, and other review agencies to evaluate site-specific issues within their jurisdictions. Each<br />
utility must provide detailed data, based on in-depth environmental assessments, during certification<br />
proceedings under the Power Plant Siting Act (PPSA), Sections 403.501 - 403.518, Florida Statutes,<br />
or the Transmission Line Siting Act (TLSA), Sections 403.52 - 406.5365, Florida Statutes.<br />
<strong>Review</strong> <strong>of</strong> 2007 <strong>Ten</strong>-<strong>Year</strong> <strong>Site</strong> <strong>Plans</strong> 5
Since the <strong>Ten</strong>-<strong>Year</strong> <strong>Site</strong> Plan is not a binding plan <strong>of</strong> action on electric utilities, the<br />
<strong>Commission</strong>’s classification <strong>of</strong> a <strong>Ten</strong>-<strong>Year</strong> <strong>Site</strong> Plan as suitable or unsuitable has no formal effect on<br />
the utility. Such a classification does not constitute a finding or determination in docketed matters<br />
before the <strong>Commission</strong>. The <strong>Commission</strong> may address any concerns raised by a utility’s <strong>Ten</strong>-<strong>Year</strong><br />
<strong>Site</strong> Plan at a public hearing.<br />
Information Sources<br />
On April 2, 2007, ten utilities filed <strong>Ten</strong>-<strong>Year</strong> <strong>Site</strong> <strong>Plans</strong>. The <strong>Commission</strong> held a public<br />
workshop on August 15, 2007, to facilitate discussion <strong>of</strong> the plans.<br />
In addition to the individual utility filings, the <strong>Commission</strong> also relies on supplemental data<br />
requests made to the reporting utilities, as well as other sources. The Florida Reliability Coordinating<br />
Council (FRCC) annually publishes several documents that assess the adequacy and reliability <strong>of</strong><br />
Peninsular Florida’s 4 generating units and transmission system. The <strong>Commission</strong> used these FRCC<br />
documents to supplement its <strong>Review</strong> <strong>of</strong> 2007 <strong>Ten</strong>-<strong>Year</strong> <strong>Site</strong> <strong>Plans</strong>:<br />
• The 2007 Regional Load and Resource Plan contains aggregate data on demand and energy,<br />
capacity and reserves, and proposed new generating unit and transmission line additions for<br />
Peninsular Florida as well as statewide. The FRCC submitted this study in July 2007.<br />
• The 2007 Reliability Assessment is an aggregate study <strong>of</strong> generating unit availability, forced<br />
outage rates, load forecast methodologies, and gas pipeline availability. The FRCC submitted<br />
this study on August 15, 2007.<br />
• The Long Range Transmission Reliability Study is an assessment <strong>of</strong> the adequacy <strong>of</strong><br />
Peninsular Florida’s bulk power and transmission system. The study includes both short-term<br />
(1-5 years) detailed analysis and long-term (6-10 years) evaluation <strong>of</strong> developing trends that<br />
would require transmission additions or other corrective action. The FRCC submitted an<br />
executive summary <strong>of</strong> this study on August 15, 2007.<br />
RESOURCE ADDITIONS<br />
Table 1 reflects the aggregate capacity additions, by generating unit type, over the ten-year<br />
planning period <strong>of</strong> 2007-2016, based on the <strong>Ten</strong>-<strong>Year</strong> <strong>Site</strong> <strong>Plans</strong> filed on April 2, 2007. At the time <strong>of</strong><br />
filing, the state’s electric utilities planned to add a net capacity <strong>of</strong> 16,338 MW over the next ten years.<br />
As stated earlier in this report, the construction <strong>of</strong> several planned coal-fired units have been canceled.<br />
The types and magnitude <strong>of</strong> replacement capacity will need to be addressed in the 2008 <strong>Ten</strong>-<strong>Year</strong> <strong>Site</strong><br />
<strong>Plans</strong>. As in past years, the majority <strong>of</strong> new capacity planned in the 2007 <strong>Ten</strong>-<strong>Year</strong> <strong>Site</strong> <strong>Plans</strong> had<br />
been slated to come from gas-fired combined cycle units. While coal and coal-gasification generating<br />
units were projected to contribute a larger amount to the state’s proposed capacity additions than was<br />
projected in the past, approximately twice as much new gas-fired capacity as solid fuel capacity was<br />
being planned during the planning horizon. With the removal <strong>of</strong> coal as a boiler fuel, the state’s<br />
dependency on natural gas-fired generation is likely to increase to an even higher percentage.<br />
4 Peninsular Florida refers to the FRCC region which includes all utilities with the exception <strong>of</strong> Gulf Power Company.<br />
<strong>Review</strong> <strong>of</strong> 2007 <strong>Ten</strong>-<strong>Year</strong> <strong>Site</strong> <strong>Plans</strong> 6
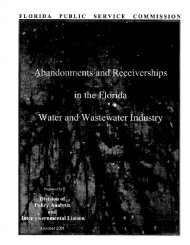
Figure 1 illustrates the present and future aggregate capacity mix. The capacity values in<br />
Figure 1 incorporate all proposed additions, changes, and retirements from Table 1. Negative values<br />
in the table reflect the retirement <strong>of</strong> fossil steam units, the expiration <strong>of</strong> firm capacity interchange<br />
contracts, and the expiration <strong>of</strong> firm capacity contracts with independent power producers, qualifying<br />
facilities, and renewable energy providers. If new contracts are signed in the future to replace those<br />
that expire, these resources will once again be included in the state’s capacity mix. The subsequent<br />
effects <strong>of</strong> these additions as well as recent changes are discussed throughout the text <strong>of</strong> this report.<br />
Table 1. State <strong>of</strong> Florida: Proposed Capacity Additions As Reported on April 2, 2007 5,6<br />
Unit Type<br />
Winter Capacity<br />
Additions (MW)<br />
Combined Cycle 12,973<br />
Coal (subsequently canceled) 3,676<br />
Integrated Coal Gasification (subsequently canceled) 905<br />
Oil & Gas Fossil Steam -674<br />
Combustion Turbine & Diesel 1,738<br />
Nuclear 1,305<br />
Firm Purchases - IPP -2,445<br />
Firm Purchases - Interchange -356<br />
Firm Purchases - QF -680<br />
Firm Purchases - Renewables -104<br />
NET CAPACITY ADDITIONS 16,338<br />
Figure 1. State <strong>of</strong> Florida: Electric Utility Capacity Mix As Reported on April 2, 2007 5<br />
Winter Capacity (MW)<br />
0 5,000 10,000 15,000 20,000 25,000 30,000 35,000<br />
Combined Cycle<br />
Coal<br />
Integrated Coal Gasification<br />
Oil & Gas Fossil Steam<br />
Combustion Turbine & Diesel<br />
Nuclear<br />
Firm Purchases - IPP<br />
Firm Purchases - Interchange<br />
Firm Purchases - QF<br />
Renewables<br />
260<br />
1,165<br />
1,700<br />
1,627<br />
1,271<br />
1,607<br />
927<br />
510<br />
406<br />
4,000<br />
5,305<br />
4,145<br />
11,656<br />
10 ,13 9<br />
9,465<br />
7,867<br />
9,605<br />
15,333<br />
16,332<br />
29,305<br />
Present 2007 Future 2016<br />
5 Values for Coal and Integrated Coal Gasification are as filed on April 2, 2007, and thus contain many proposed generators which are no longer being<br />
constructed. Projections, considering the replacement <strong>of</strong> these generators, are discussed in Chapter 3.<br />
6 Negative values reflect the retirement <strong>of</strong> fossil steam units and the expiration <strong>of</strong> firm capacity purchase contracts with other utilities and with independent<br />
power producers (IPPs), qualifying facilities (QFs), and renewable generators. As the term <strong>of</strong> existing contracts for purchased power from IPPs, QFs, and<br />
renewable generators expire, new contracts will most likely be signed. Hence, the actual contribution <strong>of</strong> these types <strong>of</strong> generators in the future to the state’s<br />
capacity mix is likely to be significantly greater than shown in Table 1 and Figure 1.<br />
<strong>Review</strong> <strong>of</strong> 2007 <strong>Ten</strong>-<strong>Year</strong> <strong>Site</strong> <strong>Plans</strong> 7
3. FUEL DIVERSITY<br />
BALANCED FUEL SUPPLY<br />
Maintaining a balanced fuel supply is valuable in terms <strong>of</strong> supply reliability and price stability.<br />
The first step toward attaining fuel diversity is pursuing non-generating alternatives to new<br />
construction through cost-effective energy conservation and Demand Side Management (DSM)<br />
programs. DSM programs have reduced enough peak demand to avoid the construction <strong>of</strong><br />
approximately ten 500 MW generating plants since the enactment <strong>of</strong> the Florida Energy Efficiency<br />
and Conservation Act (FEECA) in 1980.<br />
Renewable energy provides another important alternative to traditional generating sources.<br />
The <strong>Commission</strong> continues to explore methods to encourage the development <strong>of</strong> renewable<br />
generation. Furthermore, recent nationwide initiatives and heightened societal awareness should<br />
increase the development <strong>of</strong> renewable energy facilities. Both DSM and renewable energy are<br />
discussed in greater depth in Chapter 4.<br />
With the adoption <strong>of</strong> FEECA, coupled with state and federal efforts to strengthen building<br />
codes and appliance efficiency standards, much has been accomplished to reduce the growth rates <strong>of</strong><br />
electrical demand and consumption in Florida. However, in spite <strong>of</strong> these efforts, the state’s growing<br />
total energy demand continues to surpass current conservation, DSM, and renewable energy programs<br />
<strong>of</strong>fered by Florida’s utilities. This increasing demand results in a need for the addition <strong>of</strong> generation<br />
capacity to satisfy reliability requirements, subsequently leading to a greater dependence on liquid and<br />
natural gas fuels for energy generation.<br />
Florida’s increased dependence on natural gas has caused the state to be more vulnerable to<br />
supply disruptions due to severe storms and hurricanes. Such supply disruptions have caused severe<br />
price increases and power disruptions. Having a diverse fuel mix can mitigate the impacts <strong>of</strong> such<br />
events. Fuel diversity also serves as a risk mitigation strategy by providing a dampening effect on fuel<br />
price volatility caused by daily market conditions, thus allowing utilities to shield ratepayers from<br />
volatile price fluctuations.<br />
Prior to the late 1970s, Florida’s utilities used oil as the primary fuel source for generating<br />
electricity. Following the dramatic increase in oil prices in the 1970s, Florida’s utilities made a<br />
concerted effort to add generating units that used solid fuels. One early response was the purchase <strong>of</strong><br />
economical “coal-by-wire” from the Southern Company, which had a temporary surplus <strong>of</strong> coal-fired<br />
generation resources already constructed. The <strong>Commission</strong> supported the utilities’ efforts to maintain<br />
fuel diversity with regulatory programs such as the Oil Backout Cost Recovery Factor, which gave<br />
utilities an incentive to recover costs <strong>of</strong> converting from oil-based generation, and the Energy Broker,<br />
a computerized system which matched buyers and sellers <strong>of</strong> economy energy to minimize the real<br />
time fuel costs <strong>of</strong> the participating utilities.<br />
Prior to Congressional repeal <strong>of</strong> the Power Plant and Industrial Fuel Use Act in 1987, natural<br />
gas demand had declined substantially because <strong>of</strong> restrictions on usage as a boiler utility fuel. These<br />
restrictions contributed to a significant oversupply <strong>of</strong> gas, resulting in falling prices. Shortly after the<br />
repeal, a new era <strong>of</strong> highly efficient, flexible, environmentally preferred combustion turbine (CT) and<br />
<strong>Review</strong> <strong>of</strong> 2007 <strong>Ten</strong>-<strong>Year</strong> <strong>Site</strong> <strong>Plans</strong> 8
combined cycle (CC) units entered the market. The addition <strong>of</strong> these technologies by Florida’s<br />
utilities fostered an increase in the use <strong>of</strong> natural gas to produce electricity.<br />
Due to the state’s continued increase in the demand for electricity and the relatively low<br />
natural gas prices during the 1990s, Florida’s utilities continued to add gas-fired generating units to<br />
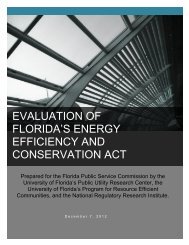
satisfy economic and reliability needs. Figure 2 illustrates Florida’s energy demand increase and<br />
subsequent generation additions. As shown in Figure 3, these additions have resulted in an increase <strong>of</strong><br />
natural gas generation from roughly 17.5 percent <strong>of</strong> the state’s electricity in 2000 to 38 percent in<br />
<strong>2006</strong>. Based on the 2007 <strong>Ten</strong>-<strong>Year</strong> <strong>Site</strong> <strong>Plans</strong>, the use <strong>of</strong> natural gas to satisfy demand is projected to<br />
increase to 45 percent <strong>of</strong> the state’s energy production by 2016.<br />
Figure 2. State <strong>of</strong> Florida: Energy Generation by Fuel Type (GWh)<br />
350000<br />
Energy (Gigawatt-Hours)<br />
300000<br />
250000<br />
200000<br />
150000<br />
100000<br />
50000<br />
0<br />
25,353<br />
12,250<br />
38,973<br />
32,790<br />
30,840<br />
16,164<br />
102,567<br />
31,429<br />
32,763<br />
25,546<br />
32,555<br />
70,859<br />
3,786<br />
24,573<br />
21,687<br />
44,335<br />
76,050<br />
146,423<br />
16,721<br />
62,785<br />
92,821<br />
19,936<br />
14,671 17,366<br />
36,878<br />
1980 1990 2000 <strong>2006</strong> 2016<br />
Natural Gas Coal Nuclear Oil Interchange, NUG, Other<br />
Figure 3. State <strong>of</strong> Florida: Energy Generation by Fuel Type (Percent <strong>of</strong> Total)<br />
100%<br />
3.8%<br />
16.8% 14.7% 13.4%<br />
7.8%<br />
3.8%<br />
Energy (% <strong>of</strong> Total)<br />
80%<br />
60%<br />
40%<br />
44.6% 16.2%<br />
14.3%<br />
16.8%<br />
41.3%<br />
15.7%<br />
15.6%<br />
36.4%<br />
6.6%<br />
12.9%<br />
29.0%<br />
12.0%<br />
31.5%<br />
20%<br />
20.0%<br />
38.0%<br />
45.0%<br />
0%<br />
14.8%<br />
11.4%<br />
17.6%<br />
1980 1990 2000 <strong>2006</strong> 2016<br />
Natural Gas Coal Nuclear Oil Interchange, NUG, Other<br />
<strong>Review</strong> <strong>of</strong> 2007 <strong>Ten</strong>-<strong>Year</strong> <strong>Site</strong> <strong>Plans</strong> 9
As shown in Figure 4, between 1980 and 2000, moderate fuel prices as well as a balanced<br />
planning approach used by Florida’s utilities resulted in relatively stable average electricity prices for<br />
Florida’s ratepayers with real (inflation-adjusted) prices actually declining.<br />
Figure 4. Average Residential Electric Bill: 1980 to Present<br />
120.00<br />
100.00<br />
$ per 1000 KWh<br />
80.00<br />
60.00<br />
40.00<br />
20.00<br />
0.00<br />
1980 1982 1984 1986 1988 1990 1992 1994 1996 1998 2000 2002 2004 <strong>2006</strong><br />
Nominal<br />
Real<br />
Starting in 2001, natural gas prices began to increase nationwide despite electric utility<br />
forecasts <strong>of</strong> flat prices with moderate growth rates. For example, the actual cost <strong>of</strong> natural gas for FPL<br />
more than doubled between 2002 and <strong>2006</strong>, rising from approximately $4.06 per MMBtu in 2002 to<br />
$8.81 per MMBtu in <strong>2006</strong>. In 2005, hurricanes and tropical storms in the Gulf <strong>of</strong> Mexico caused<br />
short-term spikes as high as $12 per MMBtu due to gas supply disruptions. The effects <strong>of</strong> higher,<br />
volatile gas prices can be dramatic on customer bills. Between 2003 and 2005, Florida’s IOUs<br />
experienced record fuel cost under-recoveries compared to forecasts. Under-recoveries <strong>of</strong> fuel costs<br />
totaled approximately $670 million in 2003, $353 million in 2004, and $1.564 billion in 2005. The<br />
three years <strong>of</strong> higher than predicted fuel costs alone are approximately the same as the capital cost <strong>of</strong> a<br />
new coal-fired plant. The increase in natural gas prices, coupled with Florida’s growing dependence<br />
on natural gas generation, has reversed the trend <strong>of</strong> stable electricity prices as the average electric bill<br />
has increased in recent years, a trend illustrated in Figure 4 above.<br />
Several uncertainties influence a utility’s decision to build a coal-fired power plant: capital<br />
costs, fuel price differentials, competitive fuel transportation, environmental compliance costs, and<br />
licensing requirements. These areas illustrate the complexity involved in the generation planning<br />
process. A key factor in a utility’s decision to build a new coal-fired plant is the number <strong>of</strong> years<br />
required for the plant to become cost-effective. Coal-fired plants have higher capital costs relative to<br />
natural gas plants. As the price difference between coal and natural gas increases, as has occurred in<br />
recent years, the amount <strong>of</strong> time before a coal-fired plant becomes cost-effective decreases. If the fuel<br />
price differential between natural gas and coal does not materialize, the higher fixed capital costs may<br />
negatively affect ratepayers for 30 or more years without realizing any fuel savings. Furthermore, the<br />
addition <strong>of</strong> several coal-fired power plants may require additional infrastructure in the form <strong>of</strong> rail<br />
facilities and shipping ports to support fuel transport, thus resulting in greater capital costs.<br />
<strong>Review</strong> <strong>of</strong> 2007 <strong>Ten</strong>-<strong>Year</strong> <strong>Site</strong> <strong>Plans</strong> 10
Environmental costs and concerns are increasing for all types <strong>of</strong> generating plants. Coal<br />
plants in particular have to overcome a high environmental hurdle. At the national level, discussions<br />
are underway for new emission requirements for substances such as mercury and carbon dioxide.<br />
Incremental environmental costs are a risk borne by ratepayers because Florida’s IOUs are authorized<br />
to recover the costs <strong>of</strong> incremental environmental requirements through the <strong>Commission</strong>’s<br />
Environmental Cost Recovery Clause.<br />
Integrated Gasification Combined Cycle (IGCC), an advanced coal technology, has been<br />
purported to <strong>of</strong>fer certain advantages with regard to level <strong>of</strong> emissions and emissions control, when<br />
compared to other coal technologies. However, IGCC technology is a relatively new technology<br />
requiring federal tax credits or construction subsidies to help mitigate high capital and operating costs.<br />
Furthermore, while advocates contend that the overall volume <strong>of</strong> greenhouse gas emissions will be<br />
lower for IGCC units, control technology for CO 2 capture and sequestration currently does not exist.<br />
TECO is the only utility in Florida operating an IGCC plant, Polk Unit 1, which generates 250 MW.<br />
A second IGCC unit at Polk was planned by TECO but has now been canceled due to economic and<br />
environmental uncertainty. Orlando Utilities <strong>Commission</strong> (OUC), in partnership with the Southern<br />
Company and with funding from the Department <strong>of</strong> Energy, received certification from the Siting<br />
Board to construct a 249 MW IGCC plant with an in-service date <strong>of</strong> 2010. On November 15, 2007,<br />
this unit was canceled in favor <strong>of</strong> a natural gas-fired combined cycle unit, also because <strong>of</strong> economic<br />
and environmental uncertainty.<br />
Nuclear generation is one generating technology that produces no greenhouse gas emissions.<br />
Significant strides have been made nationally to bring this form <strong>of</strong> generation back to the forefront,<br />
including new standardized plant designs preapproved by the Nuclear Regulatory <strong>Commission</strong> (NRC)<br />
and streamlined safety and operating licensing to expedite construction. Nevertheless, it is expected<br />
that the licensing, certification, and construction <strong>of</strong> a new nuclear power plant in Florida will take<br />
approximately ten years or more. Coupled with extremely high capital costs, due in part to worldwide<br />
industrialization and demand for construction materials and labor, the commitment to the construction<br />
<strong>of</strong> new nuclear power plants entails its own set <strong>of</strong> financial risks. In an effort to mitigate the economic<br />
risks associated with the long lead time and high capital costs associated with nuclear power plants,<br />
the Florida Legislature enacted Section 366.93, Florida Statutes, in June <strong>2006</strong>. The Florida<br />
Legislature directed the <strong>Commission</strong> to establish new rules to provide for early cost recovery<br />
mechanisms for costs related to the siting, design, licensing, and construction <strong>of</strong> nuclear power plants<br />
in Florida. 7 Rule 25-6.0423, Florida Administrative Code, enacted April 8, 2007, fulfills the<br />
legislative mandate for nuclear power plant cost recovery.<br />
Both FPL and PEF have announced plans to expand the capacity <strong>of</strong> their existing nuclear<br />
power plants and to construct new nuclear units. The <strong>Commission</strong> approved the need for an uprate to<br />
PEF’s Crystal River 3 nuclear unit on February 8, 2007. On September 17, 2007, FPL filed a petition<br />
<strong>of</strong> need for uprates at their Turkey Point and St. Lucie nuclear facilities. On December 10, 2007, the<br />
<strong>Commission</strong> approved the need for the uprates <strong>of</strong> the FPL units. Combined, the uprates <strong>of</strong> the PEF<br />
and FPL units will add approximately 600 MW <strong>of</strong> additional nuclear capacity for the years 2009<br />
through 2013. In addition to these uprates to existing units, PEF’s <strong>Ten</strong>-<strong>Year</strong> <strong>Site</strong> Plan currently<br />
includes plans to construct a new 1,125 MW nuclear plant by 2016. PEF is expected to file a petition<br />
7 In 2007, the Legislature amended Section 366.93, Florida Statutes, to include IGCC technology. The <strong>Commission</strong> is currently considering revisions to Rule<br />
25-6.0423, Florida Administrative Code, to provide an alternative cost-recovery mechanism for IGCC plants.<br />
<strong>Review</strong> <strong>of</strong> 2007 <strong>Ten</strong>-<strong>Year</strong> <strong>Site</strong> <strong>Plans</strong> 11
for need determination in early 2008. On October 16, 2007, FPL filed a petition for determination <strong>of</strong><br />
need for two new nuclear units, up to 1,500 MW each, for the years 2018 and 2020. If constructed<br />
and placed into service, these nuclear additions will help to provide further diversity to Florida’s<br />
generation mix.<br />
OUTLOOK<br />
Over the past few years, the Legislature and the <strong>Commission</strong> have stressed the importance <strong>of</strong><br />
utilities maintaining a balanced fuel supply. Florida’s utilities responded to these concerns by<br />
proposing several solid fuel plants in their 2007 <strong>Ten</strong>-<strong>Year</strong> <strong>Site</strong> <strong>Plans</strong>. Such plans would have<br />
improved fuel diversity but would concurrently significantly increase capital costs that would be<br />
recovered from ratepayers and significantly increase carbon emissions.<br />
The first <strong>of</strong> these planned additions to come before the <strong>Commission</strong> was OUC's IGCC unit,<br />
which was approved by the <strong>Commission</strong> in <strong>2006</strong> and subsequently received PPSA certification. 8 This<br />
plant, currently under construction, was scheduled to be in service by 2010 providing 250 MW. The<br />
Department <strong>of</strong> Energy was to contribute $235 million to this project as part <strong>of</strong> the Clean Coal Power<br />
Initiative. On November 15, 2007, OUC and its partner, the Southern Company, announced plans to<br />
cancel the IGCC unit in favor <strong>of</strong> only continuing construction <strong>of</strong> the gas-fired combined cycle portion<br />
<strong>of</strong> the project. The reason given for the change in plans were cost uncertainty associated with<br />
potential future carbon regulations.<br />
In <strong>2006</strong>, the <strong>Commission</strong> also approved the need for a 750 MW supercritical pulverized coal<br />
plant planned by SEC. 9 This plant, originally scheduled for commercial operation in 2012, was<br />
denied certification by the Secretary <strong>of</strong> the DEP on August 15, 2007. SEC has appealed this decision.<br />
In September <strong>2006</strong>, a petition was jointly filed by FMPA, JEA, RCI, and TAL requesting<br />
<strong>Commission</strong> approval for a 765 MW pulverized coal plant to be located in Taylor County, with an inservice<br />
date <strong>of</strong> 2012. Following a formal hearing in January 2007, the <strong>Commission</strong> deferred<br />
consideration <strong>of</strong> staff's post-hearing recommendation to March 13, 2007. On March 9, 2007, the<br />
Applicants filed a motion for leave to submit supplemental testimony. On July 12, 2007, the<br />
Applicants filed a Notice <strong>of</strong> Withdrawal <strong>of</strong> this petition, and the docket was subsequently closed. 10<br />
On February 1, 2007, FPL filed a petition proposing to build two ultra-supercritical pulverized<br />
coal generating units rated at 980 MW each. The first unit was scheduled for service in 2013, and the<br />
second would follow in 2014. FPL maintained that benefits from the two units would include an<br />
increased reliability through fuel diversity and a reduction <strong>of</strong> risk from natural gas price volatility.<br />
The <strong>Commission</strong> denied FPL’s petition for need stating that “FPL has failed to demonstrate<br />
that the proposed plants are the most cost-effective alternative available, taking into account the fixed<br />
costs that would be added to base rates for the construction <strong>of</strong> the plants, the uncertainty associated<br />
with future natural gas and coal prices, and the uncertainty associated with currently emerging energy<br />
8 Order No. PSC-06-0457-FOF-EC, issued May 24, <strong>2006</strong>, in Docket No. 060155-EM, In re: Petition for Determination <strong>of</strong> need for proposed Stanton Energy<br />
Center Combined Cycle Unit B electrical power plant Orange County, by Orlando Utilities <strong>Commission</strong>.<br />
9 Order No. PSC-06-0674-FOF-EC, issued August 7, <strong>2006</strong>, in Docket No. 060220-EC, In re: Petition for determination <strong>of</strong> need for Seminole Generating<br />
Station Unit 3 electrical power plant in Putnam County, by Seminole Electric Cooperative, Inc.<br />
10 Order No. PSC-07-0725-FOF-EU, issued September 5, 2007, in Docket No. 060635-EU, In re: Petition for determination <strong>of</strong> need for electrical power plant<br />
in Taylor County by Florida Municipal Power Agency, JEA, Reedy Creek Improvement District, and City <strong>of</strong> Tallahassee.<br />
<strong>Review</strong> <strong>of</strong> 2007 <strong>Ten</strong>-<strong>Year</strong> <strong>Site</strong> <strong>Plans</strong> 12
policy decisions at the state and federal level.” 11 Key in this decision was the fact that the Glades<br />
Power Plant was cost-effective in only 7 <strong>of</strong> 16 scenarios projected by FPL.<br />
Currently TECO is the only utility in Florida operating an IGCC plant, Polk Unit 1, which<br />
generates 250 MW. On July 20, 2007, TECO filed a petition proposing the construction <strong>of</strong> the Polk<br />
Unit 6 IGCC generating plant rated at approximately 600 MW, with a commercial in-service date <strong>of</strong><br />
2013. TECO had been approved for a $133.5 million dollar tax credit available through the Federal<br />
Energy Policy Act <strong>of</strong> 2005. However, on October 4, 2007, TECO withdrew its petition citing<br />
economic risks related to potential future CO 2 regulations pertaining to carbon capture and<br />
sequestration. 12<br />
As seen in Table 2, over 4,000 MW <strong>of</strong> proposed coal-fired capacity described in certain utility<br />
<strong>Ten</strong>-<strong>Year</strong> <strong>Site</strong> <strong>Plans</strong> have been canceled or denied certification.<br />
Table 2. Summary <strong>of</strong> Proposed Coal Plants in 2007 TYSP<br />
Owner(s) Plant Name Type<br />
Winter<br />
Capacity<br />
(MW)<br />
<strong>Year</strong><br />
Status<br />
OUC Stanton B IGCC 249 2010 Gas Only<br />
SEC Palatka BIT 750 2012 Certificate Denied by DEP 13<br />
FMPA,JEA,TAL,RCI Taylor Energy Center BIT 768 2012 Need Petition Withdrawn<br />
TECO Polk Unit 6 IGCC 630 2013 Need Petition Withdrawn<br />
FPL Glades Power Park (I) BIT 990 2013 Need Denied by PSC<br />
FPL Glades Power Park (II) BIT 990 2014 Need Denied by PSC<br />
SEC Seminole Unit BIT 340 2015 Not Yet Filed<br />
As filed in its 2007 <strong>Ten</strong>-<strong>Year</strong> <strong>Site</strong> Plan, PEF plans an addition <strong>of</strong> over 1,300 MW from<br />
nuclear generation. The Crystal River Unit 3 will be uprated by 40 MW in 2009 and by 140 MW in<br />
2011; the Crystal River Unit 3 uprate was granted a need determination in February 2007. 14 PEF also<br />
expects to bring on line in 2016 an advanced light water reactor to provide 1,125 MW <strong>of</strong> generation.<br />
A determination <strong>of</strong> need for this unit should be filed in early 2008.<br />
Information provided by FPL in the context <strong>of</strong> the August 15, 2007, workshop indicates that<br />
by 2012, the company expects to uprate existing nuclear generating plants to gain 400 MW <strong>of</strong><br />
increased capacity. FPL also discussed the construction <strong>of</strong> two new nuclear power units providing a<br />
combined capacity <strong>of</strong> 3,000 MW with target dates <strong>of</strong> 2018 and 2020. The 400 MW <strong>of</strong> uprates and the<br />
new nuclear generators, which would improve fuel diversity and reduce the percentage energy<br />
11 Order No. PSC-07-0557-FOF-EI, issued July 2, 2007, page 4, in Docket No. 070098-EI, In re: Petition for determination <strong>of</strong> need for Glades Power Park<br />
Units 1 and 2 electrical power plants in Glades County, by Florida Power & Light Company.<br />
12 Order No. PSC-07-0877-FOF-EI, issued October 31, 2007, in Docket No. 070467-EI, In re: Petition to determine need for Polk Unit 6 electrical power<br />
plant, by Tampa Electric Company.<br />
13 SEC has appealed the denial.<br />
14 Order No. PSC-07-0119-FOF-EI, issued February 8, 2007, Docket No. 060642-EI, In re: Petition for determination <strong>of</strong> need for expansion <strong>of</strong> Crystal River<br />
3 nuclear power plant, for exemption from Bid Rule 25-22.082, Florida Administrative Code, and for cost recovery through fuel clause, by Progress Energy<br />
Florida, Inc.<br />
<strong>Review</strong> <strong>of</strong> 2007 <strong>Ten</strong>-<strong>Year</strong> <strong>Site</strong> <strong>Plans</strong> 13
generated by natural gas, were not filed in FPL’s 2007 <strong>Ten</strong>-<strong>Year</strong> <strong>Site</strong> Plan. On September 17, 2007,<br />
FPL filed a petition for determination <strong>of</strong> need <strong>of</strong> the aforementioned uprates. On December 10, 2007,<br />
the <strong>Commission</strong> approved the need for the uprates <strong>of</strong> the FPL units. On October 16, 2007, FPL filed a<br />
petition for a determination <strong>of</strong> need for the two new nuclear units. A hearing for these units is<br />
scheduled for January 30-February 1, 2008.<br />
Removal from consideration <strong>of</strong> the earlier mentioned coal plants leaves a void <strong>of</strong> necessary<br />
capacity additions. Due to the long permitting and construction periods involved with nuclear<br />
generating plants, significant additional generation from a new nuclear plant would not be expected<br />
until 2016. Alternatively, gas generators have a relatively short lead time making gas generation the<br />
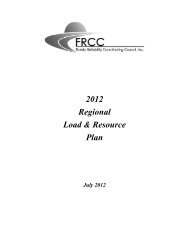
most feasible option to fill the void left by canceled coal projects. The effects from denied and/or<br />
canceled coal plants will be reflected in the 2008 <strong>Ten</strong>-<strong>Year</strong> <strong>Site</strong> <strong>Plans</strong>. An estimate <strong>of</strong> the impacts<br />
from the increase in gas usage was provided by the FRCC at the August 15, 2007, workshop and is<br />
depicted in Figure 5 below.<br />
Figure 5. Projected Peninsular Florida Generation by Natural Gas<br />
60%<br />
% Fueled by Natural Gas<br />
Net Energy for Load (%GWH)<br />
50%<br />
40%<br />
38%<br />
41%<br />
46%<br />
48%<br />
49%<br />
Coal Replaced with Natural Gas<br />
49%<br />
47%<br />
50%<br />
52%<br />
54%<br />
54%<br />
46%<br />
45% 45%<br />
44%<br />
30%<br />
<strong>2006</strong> 2007 2008 2009 2010 2011 2012 2013 2014 2015<br />
As Reported (4/2/2007)<br />
Projected <strong>Year</strong><br />
All Uncertified Coal Plants Removed and Replaced with Natural Gas<br />
<strong>Review</strong> <strong>of</strong> 2007 <strong>Ten</strong>-<strong>Year</strong> <strong>Site</strong> <strong>Plans</strong> 14
CONCLUSION<br />
As per capita use and total demand for electricity continue to outpace increased energy<br />
conservation, DSM, and renewable generation efforts, the need for traditional generating capacity<br />
continues to grow. Over the last 20 years, Florida’s utilities have turned to natural gas to satisfy the<br />
state’s growing energy demand. The recent volatility <strong>of</strong> natural gas prices, however, has shown that<br />
the overdependence on a single fuel can lead to an unacceptable risk <strong>of</strong> supply disruptions and rate<br />
increases. Unfortunately, fuel diversity cannot be achieved overnight. Utilities must address several<br />
issues and concerns before constructing a solid fuel generator. Solid fuel units raise environmental<br />
concerns despite the fact that these units meet or exceed stringent emissions requirements for currently<br />
regulated pollutants. Solid fuel units also require large plant sites in order to accommodate fuel<br />
transport infrastructure for coal sites and waste fuel facilities for nuclear sites. Additional issues<br />
include a site’s feasibility for multiple fuel usage, such as the ability to convert an existing gas-fired<br />
plant to coal gasification in the future if such conversion becomes cost-effective. Solid fuel plants<br />
require long lead times, as much as seven years for a coal plant and ten or more years for a nuclear<br />
plant, for regulatory approval and construction. With the removal from consideration <strong>of</strong> recently<br />
proposed coal plants, the remaining baseload generation choice is likely to be natural gas for the next<br />
several years.<br />
As the state’s dependence on natural gas-fired generation continues to grow, gas supply and<br />
deliverability become increasingly important. Therefore, utilities should continue evaluation <strong>of</strong><br />
natural gas supply and delivery options, such as liquefied natural gas, alternate gas pipelines, and<br />
natural gas storage. Having multiple options can serve as risk mitigation to unforeseen supply and<br />
delivery disruptions.<br />
<strong>Review</strong> <strong>of</strong> 2007 <strong>Ten</strong>-<strong>Year</strong> <strong>Site</strong> <strong>Plans</strong> 15
4. GENERATION<br />
LOAD AND ENERGY FORECAST<br />
A utility’s load and energy forecast is the starting point for determining the timing and size <strong>of</strong><br />
new capacity additions needed to reliably serve load. As such, forecast accuracy plays an essential<br />
role in a utility’s determination <strong>of</strong> future needs. For 8 <strong>of</strong> the 10 reporting utilities, the <strong>Commission</strong><br />
reviewed the historical forecast accuracy <strong>of</strong> total retail energy sales for the five-year period from<br />
2002-<strong>2006</strong>. Insufficient historical data were available to analyze the historical forecast accuracy <strong>of</strong><br />
FMPA and OUC. The <strong>Commission</strong>’s analysis compared actual energy sales for each year to energy<br />
sales forecasts made three, four, and five years prior. For example, actual <strong>2006</strong> energy sales were<br />
compared to <strong>2006</strong> forecasts made in 2001, 2002, and 2003. These differences, expressed as a<br />
percentage error rate, were used to calculate two measures <strong>of</strong> a utility’s historical forecast accuracy:<br />
average forecast error 15 and average absolute forecast error. 16<br />
Table 3 shows the historical forecast accuracy <strong>of</strong> total retail energy sales for the 2005, <strong>2006</strong>,<br />
and 2007 <strong>Ten</strong>-<strong>Year</strong> <strong>Site</strong> <strong>Plans</strong> for the eight reporting utilities with sufficient historical data. Overall<br />
forecast errors over the last three years have steadily decreased.<br />
Table 3. Total Retail Energy Sales: Historical Forecast Accuracy<br />
UTILITY<br />
AVERAGE<br />
FORECAST ERROR (%)<br />
AVERAGE<br />
ABSOLUTE<br />
Progress Energy Florida -0.39 0.69<br />
Florida Power & Light Company -1.27 1.27<br />
Gulf Power Company -0.34 0.69<br />
Tampa Electric Company -0.23 0.35<br />
JEA 0.77 0.93<br />
City <strong>of</strong> Lakeland 0.21 0.58<br />
City <strong>of</strong> Tallahassee -0.11 0.52<br />
Seminole Electric Cooperative -1.16 1.49<br />
WEIGHTED AVG (2002-<strong>2006</strong>) - 2007 TYSP -0.28 0.80<br />
WEIGHTED AVG (2001-2005) - <strong>2006</strong> TYSP -0.29 0.88<br />
WEIGHTED AVG (2000-2004) - 2005 TYSP -0.41 1.02<br />
15 Average forecast error indicates a utility’s tendency to overforecast (positive values) or underforecast (negative values).<br />
16 Average absolute forecast error accumulates the magnitude <strong>of</strong> past forecast errors, ignoring positive and negative signs.<br />
<strong>Review</strong> <strong>of</strong> 2007 <strong>Ten</strong>-<strong>Year</strong> <strong>Site</strong> <strong>Plans</strong> 16
DEMAND-SIDE MANAGEMENT<br />
Demand-side management (DSM) reduces customer peak demand and energy requirements,<br />
resulting in the deferred need for new generating units. Dispatchable DSM, such as load management<br />
and interruptible service, are utility-controlled measures that allow quick reductions in system peak<br />
demand when needed. Non-dispatchable DSM, such as ceiling insulation or building efficiency<br />
measures, enables utilities and customers to realize sustained energy savings over time. Nondispatchable<br />
DSM savings are embedded in a utility’s demand and energy forecast.<br />
Utilities have <strong>of</strong>fered DSM programs since 1980 based on the requirements <strong>of</strong> the FEECA.<br />
FEECA emphasizes reducing the growth rate <strong>of</strong> weather-sensitive peak demand, reducing and<br />
controlling the growth rate <strong>of</strong> electricity consumption, and reducing the consumption <strong>of</strong> expensive<br />
resources such as petroleum fuels. To meet these objectives, the <strong>Commission</strong> sets numeric<br />
conservation goals, and utilities are responsible for continuing to develop and implement DSM<br />
programs to meet these goals. The <strong>Commission</strong>'s broad-based authority over electric utility<br />
conservation measures and programs is contained in Rules 25-17.001 through 25-17.015, Florida<br />
Administrative Code. Florida’s utilities have reduced enough peak demand to avoid the construction<br />
<strong>of</strong> approximately ten 500 MW generating plants since the enactment <strong>of</strong> FEECA.<br />
DSM Goals and <strong>Plans</strong><br />
FEECA requires that all IOUs and any municipal or cooperative utility with annual energy<br />
sales <strong>of</strong> at least 2,000 GWh as <strong>of</strong> July 1, 1993, meet numeric conservation goals set by the<br />
<strong>Commission</strong>. Seven Florida utilities are subject to FEECA: PEF, FPL, GULF, TECO, Florida <strong>Public</strong><br />
Utilities Company (FPUC), 17 JEA, and OUC.<br />
The <strong>Commission</strong> last set numeric demand and energy goals for these seven utilities in July<br />
2004. The new numeric goals were generally lower than the previous goals set by the <strong>Commission</strong> in<br />
1999 for the following reasons:<br />
• The Florida Building Code contains increased minimum energy efficiency levels, thus<br />
limiting the amount <strong>of</strong> incremental savings from utility sponsored programs.<br />
• Many utility DSM programs have reached a saturation in participation levels.<br />
• The cost <strong>of</strong> new generating units had declined, which reduced the cost-effectiveness <strong>of</strong> several<br />
DSM programs. However, the <strong>Commission</strong> has seen this trend begin to reverse.<br />
The US Department <strong>of</strong> Energy (DOE) has revised the efficiency standards for air conditioning<br />
equipment for residential and commercial applications. The new standards took effect on January 23,<br />
<strong>2006</strong>. Currently, all residential central air conditioners manufactured must have a seasonal energy<br />
efficiency rating (SEER) <strong>of</strong> 13 or higher. Similar efficiency improvements are required for other<br />
appliances and for various commercial equipment. These recent revisions to the efficiency standards<br />
required the FEECA utilities to modify their residential and business demand-side management<br />
programs related to heating, ventilation, and air conditioning (HVAC). FPL, PEF, TECO, and GULF<br />
have received <strong>Commission</strong> approval for modifications to their DSM programs addressing the SEER<br />
17 FPUC is a non-generating, investor-owned utility subject to FEECA’s requirements.<br />
<strong>Review</strong> <strong>of</strong> 2007 <strong>Ten</strong>-<strong>Year</strong> <strong>Site</strong> <strong>Plans</strong> 17
increases. These program modifications also include greater customer incentives to help maintain the<br />
same level <strong>of</strong> customer participation.<br />
Each February, the <strong>Commission</strong> publishes an annual report describing the utilities’<br />
conservation and DSM activities pursuant to FEECA. 18 Included in the <strong>Commission</strong>’s report is a<br />
summary <strong>of</strong> all utility DSM programs, a comparison <strong>of</strong> current and previous numeric goals, and a<br />
general assessment <strong>of</strong> utility conservation activities. Overall, Florida's utilities have been successful in<br />
meeting the overall objectives <strong>of</strong> FEECA. Since the enactment <strong>of</strong> FEECA, utility conservation<br />
programs have resulted in cumulative statewide peak demand savings <strong>of</strong> 5,332 MW for summer and<br />
5,655 MW for winter, as well as annual energy savings <strong>of</strong> 6,269 GWh for 2007.<br />
Overall, demand and energy savings from utility-sponsored conservation programs are<br />
expected to surpass current goals by as much as 50 percent. Furthermore, the projected average<br />
annual growth rate <strong>of</strong> DSM program savings, as illustrated in Table 4, has increased, reflecting the<br />
effectiveness and success <strong>of</strong> current programs. The <strong>Commission</strong> will continue to explore means <strong>of</strong><br />
cost-effectively increasing the amount <strong>of</strong> DSM savings available from utility conservation programs.<br />
Table 4. Projected Growth Rates <strong>of</strong> DSM Savings<br />
AVERAGE ANNUAL GROWTH RATE (%)<br />
DSM PROGRAM SAVINGS<br />
<strong>2006</strong> 2007<br />
Summer Peak Demand 2.20% 3.01%<br />
Winter Peak Demand 1.62% 2.43%<br />
Net Energy For Load 2.47% 2.93%<br />
DSM programs are projected to increase summer peak demand savings from just over 5,600<br />
MW <strong>of</strong> capacity in 2007 to nearly 7,500 MW <strong>of</strong> capacity in 2016. Similarly, winter peak demand<br />
savings are projected to increase from 6,100 MW <strong>of</strong> capacity in 2007 to over 7,500 MW <strong>of</strong> capacity in<br />
2016. The projected demand savings <strong>of</strong> more than 1,000 MW <strong>of</strong> peak capacity for both summer and<br />
winter are significant in the deferral <strong>of</strong> traditional generation. These savings, in addition to non-peak<br />
demand savings, translate to net energy savings <strong>of</strong> more than 9,000 GWh in 2016, an increase <strong>of</strong> more<br />
than 2,000 GWh over the planning period.<br />
Figures 6, 7, and 8 on the next page illustrate, in greater detail, the projected total amounts <strong>of</strong><br />
annual energy consumption, summer peak demand, and winter peak demand savings from utilitysponsored<br />
DSM programs over the ten-year planning horizon.<br />
18 Annual Report on Activities Pursuant to the Florida Energy Efficiency and Conservation Act, February <strong>2006</strong>.<br />
<strong>Review</strong> <strong>of</strong> 2007 <strong>Ten</strong>-<strong>Year</strong> <strong>Site</strong> <strong>Plans</strong> 18
Figure 6. State <strong>of</strong> Florida: DSM Net Energy for Load Savings<br />
Annual Energy Savings (GWh)<br />
10000<br />
9000<br />
8000<br />
7000<br />
6000<br />
5000<br />
4000<br />
3000<br />
2000<br />
1000<br />
0<br />
2007 2010 2013 2016<br />
Figure 7. State <strong>of</strong> Florida: DSM Summer Peak Demand Savings<br />
8000<br />
Summer Demand Savings(MW)<br />
7000<br />
6000<br />
5000<br />
4000<br />
3000<br />
2000<br />
1000<br />
0<br />
2007 2010 2013 2016<br />
Conservation Interruptible <strong>Service</strong> Load Management<br />
Figure 8. State <strong>of</strong> Florida: DSM Winter Peak Demand Savings<br />
8000<br />
Winter Demand Savings (MW)<br />
7000<br />
6000<br />
5000<br />
4000<br />
3000<br />
2000<br />
1000<br />
0<br />
2007/08 2010/11 2013/14 2016/17<br />
Conservation Interruptible <strong>Service</strong> Load Management<br />
<strong>Review</strong> <strong>of</strong> 2007 <strong>Ten</strong>-<strong>Year</strong> <strong>Site</strong> <strong>Plans</strong> 19
On June 15, 2007, TECO petitioned the <strong>Commission</strong> to modify 9 existing programs and<br />
approve 12 new programs. Both <strong>of</strong> these actions should increase customer participation and reduce<br />
peak demand by approximately 66 MW over the planning horizon. These savings are not reflected in<br />
current filings but will be accounted for in the 2008 <strong>Ten</strong>-<strong>Year</strong> <strong>Site</strong> <strong>Plans</strong>.<br />
Consumer Demand<br />
For residential customers, per capita energy consumption has increased over the past ten years.<br />
This trend is expected to continue to rise during the planning horizon. Possible reasons for these<br />
increases include the following explanations:<br />
• Average home size continues to grow over time.<br />
• Today’s homes have more, and larger, electricity-consuming appliances than in past years.<br />
• Natural gas, used by many residents nationwide for heating, water heating, and cooking, is still<br />
relatively unavailable in parts <strong>of</strong> Florida.<br />
• Per capita income has risen since the mid-1980s, while electric rates remained stable between<br />
1980 and 2000, as shown previously in Figure 3, resulting in more affordable electricity.<br />
Figure 9 shows that the statewide per capita energy consumption usage increased an average<br />
<strong>of</strong> 0.75 percent per year over the past ten years. Forecasts for the next ten years project an average<br />
growth rate <strong>of</strong> 0.84 percent per year. The 2007 forecast <strong>of</strong> per capita residential energy consumption<br />
is lower than comparable period forecasts made in 2005 and <strong>2006</strong> due in part to the improved DSM<br />
savings discussed earlier.<br />
Figure 9. State <strong>of</strong> Florida: Energy Consumption per Residential Customer<br />
17,000<br />
KWh per Residential Customer<br />
16,000<br />
15,000<br />
14,000<br />
13,000<br />
12,000<br />
1995 1998 2001 2004 2007 2010 2013 2016<br />
History 2005 forecast <strong>2006</strong> forecast 2007 forecast<br />
<strong>Review</strong> <strong>of</strong> 2007 <strong>Ten</strong>-<strong>Year</strong> <strong>Site</strong> <strong>Plans</strong> 20
Energy Conservation Cost Recovery<br />
IOUs have the opportunity to recover prudently incurred expenditures associated with<br />
<strong>Commission</strong>-approved DSM programs through the Energy Conservation Cost Recovery Clause<br />
(ECCR). Since 1981, Florida’s IOUs have collected approximately $4.61 billion through the ECCR<br />
clause, with nearly $2.45 billion <strong>of</strong> that amount recovered in the last ten years. As illustrated in Figure<br />
10, annual ECCR expenditures have stabilized at just under $237 million per year in recent years for<br />
two primary reasons: DSM programs have reached saturation in participation levels, and DSM<br />
program cost-effectiveness declined due to the relatively lower cost <strong>of</strong> new generating units.<br />
However, this trend is beginning to reverse. With increased avoided cost, DSM program costeffectiveness<br />
should improve, and expenditures, for DSM programs may increase.<br />
Figure 10. Conservation Expenses for IOUs<br />
While Florida's utilities have been successful overall in meeting the objectives <strong>of</strong> FEECA, the<br />
<strong>Commission</strong> believes that customer choice plays a role in helping the state’s utilities achieve the<br />
overall goals <strong>of</strong> FEECA. Electric customers can contribute to meeting these goals through buying<br />
smaller homes; owning energy-efficient appliances including air conditioning systems; making<br />
energy-efficiency improvements to their homes to reduce energy losses; and taking advantage <strong>of</strong><br />
natural gas for heating, water heating, and cooking where available and cost-effective. As plant sites<br />
and transmission corridors grow more and more scarce, utility efforts to defer future generating units<br />
and transmission lines becomes increasingly important. Customer participation in utility <strong>of</strong>fered DSM<br />
and energy conservation programs are paramount in such efforts.<br />
<strong>Review</strong> <strong>of</strong> 2007 <strong>Ten</strong>-<strong>Year</strong> <strong>Site</strong> <strong>Plans</strong> 21
RENEWABLE ENERGY<br />
Currently in Florida, over 1,100 MW <strong>of</strong> renewable generation facilities are fueled by biomass,<br />
hydroelectric sources, waste heat, landfill gas, and municipal solid waste. Florida’s electric utilities<br />
purchase just over 500 MW <strong>of</strong> firm capacity from these renewable energy sources which can defer the<br />
need for utilities to construct power plants. The majority, approximately 380 MW, is fueled by<br />
municipal solid waste.<br />
Renewable energy facilities also produce over 610 MW <strong>of</strong> non-firm capacity for internal use<br />
(self-service) or for sale to utilities on an as-available basis. As a result, the state’s utilities do not<br />
count on this non-firm energy for reliability purposes; however, this energy can give a utility the<br />
ability to avoid burning fossil fuels from existing generators. The primary contributors to this<br />
category are biomass and waste heat. Figures 11 and 12 illustrate the current renewable generation<br />
mix by fuel type as reported by the utilities. Figures 13 and 14 illustrate current renewable generation<br />
by utility. Comprehensive lists <strong>of</strong> both firm and non-firm renewable generators are listed on Tables 5<br />
and 6 on the following pages.<br />
Figure 11. Firm Capacity Renewable Energy<br />
Sources by Fuel Type (507.2 MW)<br />
Figure 12. Non-Firm Renewable Energy Sources by<br />
Fuel Type (615.8 MW)<br />
Hydro<br />
11%<br />
Land Fill<br />
Gas<br />
1%<br />
Municipal<br />
Solid Waste<br />
75%<br />
Land Fill<br />
Gas<br />
1%<br />
Biomass<br />
53%<br />
Waste Heat<br />
3%<br />
Waste Heat<br />
46%<br />
Biomass<br />
10%<br />
Figure 13. Firm Capacity Renewable Energy<br />
Sources by Utility<br />
Figure 14. Non-Firm Renewable Energy Sources by<br />
Utility<br />
PEF<br />
39%<br />
TECO<br />
39%<br />
GULF<br />
Fed. Govt.<br />
(SEPA)<br />
9%<br />
TAL<br />
2%<br />
TECO<br />
8%<br />
SEC<br />
11%<br />
FPL<br />
31%<br />
FMPA<br />
4%<br />
GULF<br />
19%<br />
PEF<br />
14%<br />
FPL<br />
24%<br />
<strong>Review</strong> <strong>of</strong> 2007 <strong>Ten</strong>-<strong>Year</strong> <strong>Site</strong> <strong>Plans</strong> 22
Table 5. State <strong>of</strong> Florida: Renewable Energy Sources Providing Firm Capacity<br />
Utility Facility Fuel Type Capacity (MW)<br />
FPL Broward North MSW 56.0<br />
FPL Broward South MSW 54.1<br />
FPL Palm Beach County MSW 47.5<br />
PEF Bay County Res. Recov. MSW 11.0<br />
PEF Dade County Res. Recov. MSW 43.0<br />
PEF Lake County Res. Recov. MSW 12.8<br />
PEF Pinellas County Res. Recov. MSW 23.0<br />
PEF Pasco County Res. Recov. MSW 54.8<br />
TECO City <strong>of</strong> Tampa Refuse Energy MSW 19.0<br />
TECO Hillsborough City Refuse Energy MSW 22.9<br />
SEC Lee County Res. Recov. MSW 35.0<br />
MUNICIPAL SOLID WASTE SUBTOTAL 379.1<br />
PEF Ridge Generating Station Biomass 39.6<br />
SEC Timber Energy Biomass 12.0<br />
BIOMASS SUBTOTAL 51.6<br />
PEF Cargill WH 15.0<br />
WASTE HEAT SUBTOTAL 15.0<br />
TAL C.H. Corn Dam Hydro 11.0<br />
GULF-Fed. Govt. (SEPA) Jim Woodruff Dam Hydro 43.5<br />
HYDRO SUBTOTAL 54.5<br />
SEC Bioenergy LFG 7.0<br />
LANDFILL GAS SUBTOTAL 7.0<br />
TOTAL FIRM CAPACITY RENEWABLES 507.2<br />
Several firm capacity renewable contracts are slated for expiration within the ten-year site plan<br />
period. If all <strong>of</strong> these contracts are not renewed, the total <strong>of</strong> the firm capacity will be reduced by more<br />
than 250 MW.<br />
<strong>Review</strong> <strong>of</strong> 2007 <strong>Ten</strong>-<strong>Year</strong> <strong>Site</strong> <strong>Plans</strong> 23
Table 6. State <strong>of</strong> Florida: Self-<strong>Service</strong> and Non-Firm Renewable Energy Sources<br />
Utility Facility Fuel Type Capacity (MW)<br />
FPL Tomoka Farms LFG 3.8<br />
TECO City <strong>of</strong> Tampa Sewage LFG 1.4<br />
LANDFILL GAS SUBTOTAL 5.2<br />
PEF Potash <strong>of</strong> Saskatchewan WH 42.0<br />
TECO Millpoint WH 41.3<br />
TECO Ridgewood WH 55.0<br />
TECO CF Industries WH 33.1<br />
TECO Greenbay WH 28.2<br />
TECO New Wales WH 46.1<br />
TECO South Pierce WH 34.9<br />
WASTE HEAT SUBTOTAL 280.6<br />
FPL Georgia Pacific Biomass 52.0<br />
FPL Okeelanta Biomass 70.0<br />
FPL US Sugar-Bryant Biomass 20.0<br />
PEF Jefferson Power Biomass 6.0<br />
PEF Proctor & Gamble (Buckeye) Biomass 38.0<br />
FMPA US Sugar Corporation Biomass 27.0<br />
GULF International Paper Company Biomass 78.0<br />
GULF Stone Container Biomass 39.0<br />
BIOMASS SUBTOTAL 330.0<br />
TOTAL NON-FIRM ENERGY RENEWABLES 615.8<br />
<strong>Review</strong> <strong>of</strong> 2007 <strong>Ten</strong>-<strong>Year</strong> <strong>Site</strong> <strong>Plans</strong> 24
Despite providing over 1,100 MW <strong>of</strong> capacity, renewable energy facilities do not account for<br />
a large portion <strong>of</strong> Florida’s energy generation. Historically, relatively high capital and operating costs<br />
as well as limited applications have hampered the development <strong>of</strong> renewable energy in the state.<br />
Table 7 lists the reporting utilities that rely upon renewable energy sources for greater than 1 percent<br />
<strong>of</strong> their total net energy for load.<br />
Table 7. Contribution <strong>of</strong> Renewable Energy to Net Energy for Load 19<br />
Utility 2001 2002 2003 2004 2005 <strong>2006</strong><br />
Progress Energy Florida 3.5% 3.4% 3.3% 3.1% 2.8% 3.0%<br />
Seminole Electric Cooperative 2.6% 2.4% 2.2% 2.4% 2.7% 2.6%<br />
Tampa Electric Company 1.7% 1.9% 1.8% 1.7% 2.2% 2.4%<br />
Orlando Utilities <strong>Commission</strong> 1.7% 1.7% 1.6% 1.6% 1.6% 1.5%<br />
Florida Power & Light Company 1.4% 1.5% 1.5% 1.5% 1.4% 1.5%<br />
Throughout the state, utility-owned self generation projects produce more than 15 MW <strong>of</strong><br />
capacity using landfill and sewer gas. The bulk <strong>of</strong> this capacity, 10 MW, comes from the OUC<br />
Stanton Landfill with other significant contributions coming from JEA and FMPA. Several <strong>of</strong> the<br />
reporting utilities are also active in photovoltaic and solar thermal projects. Many <strong>of</strong> these projects are<br />
associated with programs such as Solar for Schools and SunSmart Schools in which a solar array is<br />
placed on school grounds, allowing students to experience firsthand the benefits <strong>of</strong> renewable<br />
generation. The utilities’ photovoltaic and solar thermal projects combine to produce nearly 0.5 MW<br />
<strong>of</strong> capacity. Six <strong>of</strong> the reporting utilities have customers who own photovoltaic (PV) systems and are<br />
interconnected to the grid. The totals <strong>of</strong> these systems, listed in Table 8, reflect an average capacity<br />
factor <strong>of</strong> close to 10 percent.<br />
Table 8. PV Interconnection Summary<br />
Utility<br />
Number <strong>of</strong><br />
Connections<br />
MW MWH Capacity Factor<br />
PEF 61 0.362 528.5 17%<br />
FPL 31 0.108 80.7 9%<br />
TECO 6 0.018 3.0 2%<br />
GULF 1 0.005 3.3 8%<br />
OUC 4 0.020 Not Reported N/A<br />
SEC 2 0.004 Not Reported N/A<br />
TOTAL 105 0.516 615.5 9% (avg.) 20<br />
19 GULF, FMPA, GRU, JEA, and LAK reported a contribution <strong>of</strong> less than 1 percent.<br />
20 Average Capacity Factor does not include OUC and SEC.<br />
<strong>Review</strong> <strong>of</strong> 2007 <strong>Ten</strong>-<strong>Year</strong> <strong>Site</strong> <strong>Plans</strong> 25
Based on the April 2, 2007, <strong>Ten</strong>-<strong>Year</strong> <strong>Site</strong> <strong>Plans</strong>, several renewable generation projects are<br />
proposed to be in service within the next five years. These projects will produce nearly 300 MW <strong>of</strong><br />
capacity. Table 9 summarizes these projects, some <strong>of</strong> which are still in contract negotiations. FPL has<br />
recently announced that it is pursuing a wind project, up to approximately 20 MW, in St. Lucie<br />
County and as much as 300 MW <strong>of</strong> solar powered generating capacity. However, the company has<br />
not provided estimates <strong>of</strong> in-service dates or cost-effectiveness analyses for these facilities.<br />
Table 9. Future Renewable Projects<br />
Utility Fuel Type Capacity (MW)<br />
PEF E-Grass 116.60<br />
Biomass Wood 75.00<br />
LFG 11.00<br />
TECO WH 35.00<br />
Solid Waste 16.00<br />
Solar 0.20<br />
JEA LFG 9.60<br />
LAK Solar 18.00<br />
Solar 6.00<br />
OUC MSW 20.00<br />
LFG<br />
Undetermined<br />
FPL Solar 0.25<br />
Solar 0.04<br />
GRU PV 0.25<br />
TOTAL 307.94<br />
Legislative and <strong>Commission</strong> Actions to Encourage Renewables<br />
The 2005 Florida Legislature enacted Section 366.91, Florida Statutes, requiring that FEECA<br />
utilities continuously make available a standard <strong>of</strong>fer contract for purchase <strong>of</strong> capacity and energy<br />
from renewable energy resources. The <strong>2006</strong> Florida Legislature sought to further encourage the<br />
development <strong>of</strong> renewable generation in Florida by enacting Section 366.92, Florida Statutes,<br />
authorizing the <strong>Commission</strong> to adopt appropriate goals to increase the use <strong>of</strong> existing and new<br />
renewable energy resources in the state. Both statutes were intended to protect the economic viability<br />
<strong>of</strong> existing renewable energy facilities while promoting further development <strong>of</strong> renewable energy<br />
resources in the state.<br />
Standard Offer Contracts for Renewables<br />
In December <strong>2006</strong>, the <strong>Commission</strong> adopted Rules 25-17.200 through 25-17.310 Florida<br />
Administrative Code, which became final in March 2007. These rules implement Section 366.91,<br />
Florida Statutes, requiring each utility to continuously <strong>of</strong>fer a separate contract for each type <strong>of</strong> fossil<br />
fuel technology that is included in the <strong>Ten</strong>-<strong>Year</strong> <strong>Site</strong> Plan. The required standard <strong>of</strong>fer contracts were<br />
filed by Florida’s investor-owned utilities on April 1, 2007, and approved by the <strong>Commission</strong> on May<br />
22, 2007. The contracts result in a continuous <strong>of</strong>fer to purchase approximately 2,400 MW <strong>of</strong><br />
renewable capacity and energy. On July 2, 2007, the orders approving the standard <strong>of</strong>fer contracts for<br />
PEF, FPL, and TECO were protested. A hearing to address the protest will likely be held in early<br />
2008.<br />
<strong>Review</strong> <strong>of</strong> 2007 <strong>Ten</strong>-<strong>Year</strong> <strong>Site</strong> <strong>Plans</strong> 26
Net Metering and Interconnection Rules<br />
Current <strong>Commission</strong> rules require investor-owned utilities to interconnect with photovoltaic<br />
systems rated at 10 kW or less. Net metering, which allows a meter to turn backward as<br />
interconnected customers generate their own electricity, is allowed but not required.<br />
In April 2007, the <strong>Commission</strong> staff conducted a workshop to explore whether net metering<br />
should be required, and if so, for what size and type <strong>of</strong> renewable generators. Representatives <strong>of</strong> the<br />
renewable industry stated that net metering would provide a significant incentive for customers to<br />
install renewable generators, such as photovoltaic systems. The workshop also explored methods to<br />
expedite the interconnection <strong>of</strong> larger customer-owned renewable generators, including technologies<br />
in addition to photovoltaic systems.<br />
Following the April workshops, the staff reviewed comments <strong>of</strong> the parties and began drafting<br />
a rule which addressed both the interconnection and net metering <strong>of</strong> renewable generators. The draft<br />
rule would expand the <strong>Commission</strong>’s existing policy by requiring the expedited interconnection <strong>of</strong><br />
customer-owned renewable generators. The draft rule would also enhance the <strong>Commission</strong>’s existing<br />
policy on net metering to further encourage renewable development. The draft rule was provided to<br />
interested persons and discussed at an August 30, 2007, <strong>Commission</strong> rule development workshop.<br />
Comments from the workshop were considered, and a staff workshop was held October 15, 2007, to<br />
further develop the draft rule. On December 18, 2007, the <strong>Commission</strong> proposed a net metering and<br />
interconnection rule that would apply to all renewable generation technologies up to 2 MW in size,<br />
expedite the interconnection <strong>of</strong> customer-owned renewable generation, and allow customers to <strong>of</strong>fset<br />
their consumption through net metering. Comments on the proposed rule must be filed by January 25,<br />
2008.<br />
Renewable Portfolio Standard (RPS) for Florida<br />
To begin the process <strong>of</strong> developing renewable energy goals or an RPS, the <strong>Commission</strong> held a<br />
workshop on July 26, 2007, in which more than 30 speakers from renewable industries, electric<br />
utilities, and government entities gave presentations. Speakers discussed the feasibility and<br />
achievability <strong>of</strong> a wide array <strong>of</strong> renewable technologies, both proven and unproven, ranging from<br />
solar and wind technology to ocean current technology.<br />
On August 23, 2007, the <strong>Commission</strong>’s staff conducted a follow-up workshop to continue<br />
discussion on specific issues relevant to the development and implementation <strong>of</strong> an RPS for Florida.<br />
Participants included representatives <strong>of</strong> electric utilities, renewable developers, environmental<br />
organizations, and government entities. The workshop focused on the goals, objectives, applicability,<br />
structure, resources eligible for inclusion, and the role <strong>of</strong> renewable energy credits in an RPS.<br />
A staff workshop held on September 27, 2007, focused on issues relating to compliance and<br />
enforcement. A representative for the U.S. Environmental Protection Agency’s state outreach efforts<br />
provided an overview <strong>of</strong> compliance and enforcement policies in other states.<br />
On December 6, 2007, staff held a workshop to address, in more detail, matters pertaining to<br />
provisions such as carve-outs 21 and set-asides, 22 which can be used to encourage the use <strong>of</strong> specific<br />
renewable energy resources. Additional discussion will cover the establishment and monitoring <strong>of</strong><br />
goals as well as multipliers, 23 which can be used to aid utilities in achieving renewable goals.<br />
21 Carve-out: Allotting a specific percentage <strong>of</strong> generation to one type <strong>of</strong> generation.<br />
22 Set-aside: Allocating a specific capacity for generation by a specific type <strong>of</strong> generation.<br />
23 Multiplier: Allowing a capacity or percentage <strong>of</strong> renewable generation to be multiplied by a determined number in order to enhance results.<br />
<strong>Review</strong> <strong>of</strong> 2007 <strong>Ten</strong>-<strong>Year</strong> <strong>Site</strong> <strong>Plans</strong> 27
PROPOSED GENERATING UNITS REQUIRING CERTIFICATION<br />
To require certification under Florida’s PPSA, a proposed generating unit addition must be at<br />
least 75 MW <strong>of</strong> steam-fired generating capacity. The <strong>Commission</strong> has granted a Determination <strong>of</strong><br />
Need for several generating units in recent years. Many <strong>of</strong> these facilities have received certification<br />
under the PPSA by Florida’s Governor and Cabinet. Table 10 lists all proposed generating units in the<br />
2007 <strong>Ten</strong>-<strong>Year</strong> <strong>Site</strong> <strong>Plans</strong> that meet the criteria for requiring certification under the PPSA. Solid fuel<br />
units are shown in BOLD ITALIC CAPS.<br />
Table 10. Proposed Generating Units Requiring Certification<br />
UTILITY<br />
GENERATING UNIT NAME & TYPE<br />
WINTER<br />
CAPACITY<br />
(MW)<br />
NEED<br />
APPROVED<br />
(<strong>Commission</strong>)<br />
DATES<br />
PPSA CERTIFIED<br />
(DEP)<br />
IN-<br />
SERVICE<br />
FPL Turkey Point CC Unit 5 1181 Jun-04 Feb-05 Jun-07<br />
PEF Hines CC Unit 4 517 Nov-04 Jun-05 Dec-07<br />
FMPA Treasure Coast Energy Center CC Unit 1 318 Jul-05 May-06 Jun-08<br />
FPL West County Energy Center CC Unit 1 1335 Jun-06 Dec-06 Jun-09<br />
FPL West County Energy Center CC Unit 2 1335 Jun-06 Dec-06 Jun-10<br />
OUC STANTON UNIT B 24 275 Jun-06 Dec-06 Jun-10<br />
SEC SEMINOLE UNIT 3 750 Jul-06 Denied (Jul-07) 25 May-12<br />
FMPA / JEA<br />
RCI / TAL<br />
TAYLOR ENERGY CENTER PC UNIT 768<br />
Withdrawn<br />
(Jul-07)<br />
Jun-12<br />
FPL FLORIDA GLADES POWER PARK 1 990 Denied (Jul-07) Jun-12<br />
TECO POLK UNIT 6 630<br />
Withdrawn<br />
(Oct-07)<br />
Jan-13<br />
FPL FLORIDA GLADES POWER PARK 2 990 Denied (Jul-07) Jun-13<br />
SEC Unnamed CC 180 Dec-10<br />
FMPA Cane Island 4 318 Jun-11<br />
PEF Combined Cycle 618 Jun-13<br />
SEC Unnamed CC 720 Dec-13<br />
GULF Unlocated Unit 620 Jun-14<br />
SEC Unnamed CC 180 Dec-14<br />
PEF Combined Cycle 618 Dec-14<br />
FPL South Florida CC 1335 Jun-15<br />
SEC UNNAMED BASE 340 Dec-15<br />
PEF UNNAMED NUCLEAR 1125 Jun-16<br />
TOTAL REQUIRING CERTIFICATION 6054<br />
24 On November 15, 2007, OUC announced that it would continue with the gas only portion <strong>of</strong> this generating unit.<br />
25 Seminole Unit 3 (750 MW) was denied certification by the Department <strong>of</strong> Environmental Protection. Seminole has appealed this decision and a final<br />
decision has not been reached.<br />
<strong>Review</strong> <strong>of</strong> 2007 <strong>Ten</strong>-<strong>Year</strong> <strong>Site</strong> <strong>Plans</strong> 28
5. TRANSMISSION PLANS<br />
As generation capacities increase, the transmission system must grow accordingly in order to<br />
maintain the capability <strong>of</strong> delivering the energy to the end user. The <strong>Commission</strong> has been given<br />
broad authority under certain sections <strong>of</strong> Chapter 366, Florida Statutes, known as the Grid Bill, to<br />
require reliability within Florida’s coordinated electric grid and to ensure the planning, development,<br />
and maintenance <strong>of</strong> adequate generation, transmission, and distribution facilities within the state.<br />
RELIABILITY STANDARDS<br />
Nationwide, electric utilities plan their bulk power systems (100 kV and above) to comply<br />
with North American Electric Reliability Corporation (NERC) and regional reliability standards.<br />
NERC's mission is to ensure that the bulk electric system in North America is reliable, adequate, and<br />
secure. Since its formation in 1968, NERC operated successfully as a self-regulatory organization,<br />
and the electric industry voluntarily complied with NERC reliability standards. However, changes in<br />
the electric industry have rendered the voluntary compliance system inadequate. In response to these<br />
industry changes, Congress required the Federal Energy Regulatory <strong>Commission</strong> (FERC) to develop a<br />
new mandatory system <strong>of</strong> reliability standards and compliance. The Energy Policy Act <strong>of</strong> 2005<br />
authorized the creation <strong>of</strong> an electric reliability organization (ERO) with the statutory authority to<br />
enforce compliance with reliability standards among all market participants. NERC received<br />
certification as the ERO from the FERC in July <strong>2006</strong>.<br />
NERC works with all stakeholder segments <strong>of</strong> the electric industry, including electricity users,<br />
to develop standards for the reliable planning and operation <strong>of</strong> the bulk power systems.<br />
Fundamentally, a power system should always operate in such a way that no credible contingency<br />
could trigger cascading outages or another form <strong>of</strong> instability. Reliability standards are generally<br />
applied as follows:<br />
• Under a single-contingency criterion, a utility’s transmission system experiences no<br />
equipment overloads, voltage violations, or instability following a contingency outage <strong>of</strong> the<br />
single most crucial element, whether that piece <strong>of</strong> equipment is a generator, a transmission<br />
line, or a transformer. The single-contingency criterion is generally the minimum reliability<br />
standard at which electric utilities plan their bulk power systems.<br />
• Under a multiple-contingency criterion, a utility’s transmission system must withstand the<br />
simultaneous failure <strong>of</strong> two or more elements with a controlled loss <strong>of</strong> load and no cascading<br />
outages which affect neighboring utilities. The transmission system must subsequently be<br />
able to adjust so that all elements operate within their emergency ratings for the duration <strong>of</strong> the<br />
outage.<br />
In response to congressional actions to require mandatory reliability standards, which were<br />
supported by the <strong>Commission</strong>, the FRCC has implemented a compliance program that will monitor<br />
and enforce compliance with NERC and FRCC reliability standards. The program relies on selfassessment,<br />
periodic reporting, and on-site audits to ensure compliance. In administering the<br />
compliance program, the FRCC works closely with all owners, operators, and users <strong>of</strong> the state’s bulk<br />
electric system. The <strong>Commission</strong> staff attends FRCC meetings and maintains an open dialog with the<br />
<strong>Review</strong> <strong>of</strong> 2007 <strong>Ten</strong>-<strong>Year</strong> <strong>Site</strong> <strong>Plans</strong> 29
FRCC on reliability matters affecting the state. The <strong>Commission</strong> will continue to work closely with<br />
the FRCC, NERC, and FERC to ensure the adequacy and reliability <strong>of</strong> Florida’s electric grid.<br />
FRCC TRANSMISSION PLANNING PROCESS<br />
One <strong>of</strong> the benefits attributed to the formation <strong>of</strong> a regional transmission organization (RTO)<br />
is centralized, coordinated transmission planning. In April <strong>2006</strong>, the <strong>Commission</strong> closed a lengthy<br />
investigation into the prudence <strong>of</strong> forming an RTO, known as GridFlorida, because it did not appear to<br />
be cost-effective. The <strong>Commission</strong> directed Peninsular Florida’s utilities to coordinate their<br />
transmission planning activities through the FRCC in an effort to capture some benefits <strong>of</strong> an RTO.<br />
The FRCC’s transmission planning process is expected to yield a more complete transmission<br />
expansion plan from a peninsular perspective. The process will ensure that the reliability standards<br />
and criteria established by the NERC and the FRCC are met and will use the specific design,<br />
operating, and planning criteria employed by Peninsular Florida transmission owners. The<br />
<strong>Commission</strong> staff has participated in the FRCC’s meetings on transmission planning. The<br />
<strong>Commission</strong> will continue to monitor coordinated planning efforts by Florida’s utilities and, if<br />
necessary, will exercise its Grid Bill authority to ensure the adequacy and reliability <strong>of</strong> Florida’s<br />
transmission system.<br />
The FRCC performs a long range, ten-year study, as well as a study <strong>of</strong> the interface between<br />
Florida and the Southern Company (Southern). Sensitivity studies test the robustness <strong>of</strong> Peninsular<br />
Florida’s transmission system under various conditions and are performed within both studies.<br />
Examples <strong>of</strong> the sensitivities studied are as follows:<br />
• Transmission and/or generation facilities unavailable due to scheduled and/or forced outages.<br />
• Weather extremes for summer and winter periods.<br />
• Different load levels (e.g., 100-, 80-, 60-, and 40 percent) and/or seasons <strong>of</strong> the year.<br />
• Various generation dispatches that will test or stress the transmission system.<br />
• Reactive supply and demand assessment (generator reactive limits and power factor).<br />
• Specific areas <strong>of</strong> combination/cluster <strong>of</strong> generation and load serving capability among various<br />
transmission owners/providers in the FRCC that continually experience or are expected to<br />
experience significant congestion.<br />
• Other scenarios or system conditions, such as stability analysis.<br />
Consistent with the FRCC transmission planning process, these sensitivity studies will not<br />
necessarily call for the construction <strong>of</strong> transmission facilities identified in the studies, but will provide<br />
insight into how robust the planned transmission system is expected to be.<br />
<strong>Review</strong> <strong>of</strong> 2007 <strong>Ten</strong>-<strong>Year</strong> <strong>Site</strong> <strong>Plans</strong> 30
2007-2016 LONG RANGE TRANSMISSION STUDY<br />
The long range transmission study is a steady-state assessment <strong>of</strong> the adequacy <strong>of</strong> the FRCC’s<br />
bulk and 69 kV transmission system for 2007-2016. NERC Transmission Planning Standards are<br />
used to gauge the adequacy <strong>of</strong> the transmission system. These transmission planning standards state<br />
that the transmission system will remain stable within the applicable thermal and voltage rating limits<br />
without cascading outages, under normal system conditions, as well as single and multiple<br />
contingency events. The FRCC’s Long Range Transmission Reliability Study consists <strong>of</strong> two parts;<br />
the first part represents the first five years which are analyzed in detail with specific remediation<br />
recommendations for all thermal and voltage screening criteria violations in the area while the second<br />
part represents the second five years which are studied to determine if any trends that may require<br />
attention are developing. Many assumptions made for testing purposes are based on additions<br />
reported in the utilities’ <strong>2006</strong> <strong>Ten</strong>-<strong>Year</strong> <strong>Site</strong> <strong>Plans</strong>. With several capacity changes not reflected in the<br />
utilities’ <strong>2006</strong> <strong>Ten</strong>-<strong>Year</strong> <strong>Site</strong> <strong>Plans</strong>, the confidence level <strong>of</strong> the reliability study’s results decreases<br />
with respect to time.<br />
The results <strong>of</strong> the Long Range Transmission Reliability Study for normal, single, and multiple<br />
contingency events within the FRCC region meet NERC Transmission Planning Standards for bulk<br />
power systems.<br />
The Long Range Transmission Reliability Study for transmission facilities, 69kV and greater,<br />
within the FRCC Region concluded that potential thermal and voltage screening criteria violations can<br />
be resolved by operator intervention meeting NERC Transmission Planning Standards. The<br />
resolutions were thoroughly reviewed by the transmission owners and found to be adequate in order to<br />
maintain acceptable system performance under all conditions and events. The FRCC found no major<br />
projects requiring long lead times.<br />
FLORIDA-SOUTHERN INTERFACE TRANSFER CAPABILITY STUDY<br />
Currently, Peninsular Florida’s utilities use approximately two-thirds <strong>of</strong> the total Florida-<br />
Southern interface capability to import firm capacity into the FRCC region. Firm capacity exports to<br />
Southern do not occur at this time, nor are they forecasted to occur during the planning horizon. The<br />
FRCC and Southern annually perform an interregional transmission study to confirm the maximum<br />
import and export capability between the two regions and to ensure that the transmission plans <strong>of</strong> both<br />
regions jointly meet the NERC reliability standards. Based on studies performed by the FRCC and<br />
Southern, there do not appear to be any reliability constraints at the Florida-Southern interface at this<br />
time concerning the current use <strong>of</strong> interface capacity. The 2007 study confirmed the total transfer<br />
capabilities between the FRCC and Southern, which are contained in Table 11.<br />
Table 11. Florida-Southern Interface Transfer Capability<br />
Transfer<br />
Transfer Capability (MW)<br />
Summer<br />
Winter<br />
Southern to Florida (import) 3600 3700<br />
Florida to Southern (export) 1500 2000<br />
<strong>Review</strong> <strong>of</strong> 2007 <strong>Ten</strong>-<strong>Year</strong> <strong>Site</strong> <strong>Plans</strong> 31
Update <strong>of</strong> <strong>2006</strong> Florida Central Coordinated Study<br />
The Florida Central Coordinated Study, completed in <strong>2006</strong>, identified several major 230 kV<br />
projects that need to be constructed and in service as soon as possible. Work on these projects has<br />
begun and many <strong>of</strong> these projects will be in service by June 2011, including the Lake Agnes-Gifford<br />
230 kV transmission line, which has recently been approved. The 2007-2016 Long Range<br />
Transmission Study performed by the FRCC, showed significant improvements throughout Central<br />
Florida due to the implementation <strong>of</strong> the planned and committed projects in this area, and until 2011,<br />
operational actions will continue to be required.<br />
PROPOSED TRANSMISSION LINES REQUIRING CERTIFICATION<br />
Many <strong>of</strong> the transmission lines proposed by the FRCC as needing to be built require TLSA<br />
certification. To require certification under Florida’s TLSA, a proposed transmission line must meet<br />
the following criteria: a rating <strong>of</strong> at least 230 kV, crossing a county line, and a length <strong>of</strong> at least fifteen<br />
miles. Proposed lines in an existing corridor are exempt from TLSA requirements. The <strong>Commission</strong><br />
determines the reliability need for and the proposed starting and ending points for lines requiring<br />
TLSA certification. The <strong>Commission</strong> must issue a final order granting or denying a determination <strong>of</strong><br />
need within 90 days <strong>of</strong> the filing <strong>of</strong> a petition. The proposed corridor route is determined by the DEP<br />
during the certification process. The Governor and Cabinet sitting as the Siting Board ultimately must<br />
approve or deny the overall certification <strong>of</strong> the proposed line.<br />
The <strong>Commission</strong> has granted a Determination <strong>of</strong> Need for five transmission lines in recent<br />
years. Two <strong>of</strong> these facilities have also received certification under the TLSA by Florida’s Governor<br />
and Cabinet. Table 12 lists all proposed transmission lines in the <strong>Ten</strong>-<strong>Year</strong> <strong>Site</strong> <strong>Plans</strong> that meet the<br />
criteria for TLSA certification.<br />
Table 12. Proposed Transmission Lines Requiring Certification<br />
LINE<br />
OWNER<br />
TRANSMISSION LINE<br />
LINE<br />
LENGTH<br />
(MILES)<br />
NOMINAL<br />
VOLTAGE<br />
(kV)<br />
NEED<br />
APPROVED<br />
DATES<br />
TLSA<br />
CERTIFIED<br />
IN-<br />
SERVICE<br />
PEF Hines Energy Complex-West Lake Wales #1 21.0 230 11 / 2004 26 6 / 2005 26 12 / 2007<br />
FPL St. Johns-Pringle 26.0 230 05 / 2005 4 / <strong>2006</strong> 12 / 2008<br />
PEF/TEC Lake Agnes-Gifford 32.3 230 09 / 2007 16 / 2011<br />
FPL Manatee-Bob White 30.0 230 08 / <strong>2006</strong> 12 / 2011<br />
FPL Grove Area-Sweatt 25.0 230 16 / 2012<br />
TEC Willow Oak-Davis 29.4 230 06 / 2007 16 / 2012<br />
26 Approved with Need Approval <strong>of</strong> Hines CC Unit 4, Certified with PPSA Certification <strong>of</strong> Hines CC Unit 4<br />
<strong>Review</strong> <strong>of</strong> 2007 <strong>Ten</strong>-<strong>Year</strong> <strong>Site</strong> <strong>Plans</strong> 32
6. FUEL SUPPLY, PRICE, AND TRANSPORTATION<br />
Utilities must decide which type <strong>of</strong> plant to build several years in advance: approximately<br />
four years for combined cycle, seven years for coal, and ten or more years for nuclear. As a result, the<br />
risk associated with selecting a generation technology is highly dependent on the accuracy <strong>of</strong> the longterm<br />
fuel price forecast. A utility’s fuel price forecast is the foundation for determining the type <strong>of</strong><br />
new capacity additions needed to reliably serve load.<br />
Figure 15 illustrates the weighted average forecasted fuel price for the eleven reporting<br />
utilities. The forecasted price for each fuel type is weighted by energy generation, meaning that<br />
utilities that generate large amounts <strong>of</strong> electricity for a particular fuel type will have more <strong>of</strong> an<br />
influence on the average. Prices for solid fuels such as nuclear and coal are forecasted to remain<br />
stable compared to oil and natural gas prices. Such a relationship highlights the importance <strong>of</strong><br />
maintaining a balanced fuel supply.<br />
Figure 15. Reporting Utilities: 2007 Weighted Average Fuel Price Forecast<br />
20.00<br />
18.00<br />
Forecasted Fuel Price ($/MMBtu)<br />
16.00<br />
14.00<br />
12.00<br />
10.00<br />
8.00<br />
6.00<br />
4.00<br />
2.00<br />
0.00<br />
2007 2008 2009 2010 2011 2012 2013 2014 2015 2016<br />
Coal Residual Distillate Gas Nuclear<br />
<strong>Review</strong> <strong>of</strong> 2007 <strong>Ten</strong>-<strong>Year</strong> <strong>Site</strong> <strong>Plans</strong> 33
NATURAL GAS PRICE FORECASTS<br />
Supply and Price<br />
Figure 16 illustrates forecasts <strong>of</strong> declining domestically supplied natural gas coupled with<br />
increases in imports <strong>of</strong> Liquefied Natural Gas (LNG). Gas supplies from Canada and Mexico are<br />
projected to remain relatively stable. The reporting utilities are generally forecasting new gas supply<br />
from Canada’s Mackenzie Delta region in 2009 and from LNG imports in 2010 to 2011. Domestic<br />
supply will decline even though new domestic sources, advances in drilling technology, and<br />
unconventional production in East Texas and the Rocky Mountains will slow the rate <strong>of</strong> decline.<br />
Longer term, domestic supply could be enhanced by development <strong>of</strong> resources in the Alaska North<br />
Slope area.<br />
Figure 16. Natural Gas Consumption in the U.S. by Place <strong>of</strong> Origin 27<br />
60<br />
Consumption (Bcf/day)<br />
50<br />
40<br />
30<br />
20<br />
10<br />
0<br />
51.1 51.5<br />
49.2<br />
11.1<br />
9.1<br />
8.3 8.4<br />
1.6<br />
0.6<br />
2002 <strong>2006</strong> 2016<br />
Domestic Gas Production Net Imports / Not LNG Net LNG Imports<br />
Demand for natural gas over the planning period will be driven by the requirements <strong>of</strong> gasfired<br />
electric generators. Demand growth in other industry sectors and the residential sector is<br />
expected to be modest.<br />
The utilities provided forecasts <strong>of</strong> natural gas prices in nominal dollars on a delivered basis.<br />
The utilities generally forecast gas prices ranging from $7 to $10 per MMBtu through 2009. Starting<br />
around 2010, the utilities forecast gas prices to decline to $6 to $9 per MMBtu as imports from<br />
Canada and imported LNG become available. High crude oil prices provide some support for gas<br />
prices due in part to fuel switching.<br />
The utilities expect continued volatility in natural gas prices. Hurricanes and tropical storms<br />
in the Gulf <strong>of</strong> Mexico typically cause short-term spikes in the price <strong>of</strong> natural gas.<br />
The price forecasts are based significantly on the expectation <strong>of</strong> sizable increases in imports <strong>of</strong><br />
LNG. A delay for this expectation or decreases the expected amount <strong>of</strong> LNG will place upward<br />
pressure on natural gas prices. Furthermore, the expectation <strong>of</strong> increases in LNG supply is based on<br />
27 Sources: FPL. The Petroleum Industry Research Associates Energy Group (PIRA) and internal analysis by FPL.<br />
<strong>Review</strong> <strong>of</strong> 2007 <strong>Ten</strong>-<strong>Year</strong> <strong>Site</strong> <strong>Plans</strong> 34
new re-gasification and terminal facilities coming on line during the period 2008 through 2010. These<br />
projects are on schedule, and tanker capacity for importing LNG appears to be adequate. The primary<br />
source areas for LNG imports will be Qatar and Trinidad. Liquefaction capacity in these areas is<br />
currently somewhat tight.<br />
Transportation<br />
In Florida, increased dependency on natural gas could affect the reliability <strong>of</strong> electric utility<br />
generation supply, primarily from the possibility <strong>of</strong> natural gas supply or transportation disruption.<br />
The NERC established a Gas/Electricity Interdependency Task Force to determine reliability impacts<br />
and to recommend mitigating measures should reliability risks arise. The NERC task force completed<br />
a study in May 2004, concluding in part that gas pipeline reliability can substantially impact electric<br />
generation, and that electric system reliability can have an impact on gas pipeline operations. The<br />
FRCC continues to review the recommendations made by the NERC task force to determine where to<br />
focus future analyses. The FRCC has recommended that Peninsular Florida has adequate pipeline<br />
capacity for reliability purposes for both current and future natural gas demand. However, with this<br />
statement the FRCC assumes that generating units having the capability to burn oil will do so at time<br />
<strong>of</strong> peak demand. Therefore, economics may be the driving factor for any future gas pipeline<br />
expansions.<br />
Florida currently relies primarily on two gas pipeline companies, Florida Gas Transmission<br />
(FGT) and Gulfstream Natural Gas (Gulfstream), to supply natural gas to electric utilities, large<br />
industrial customers, and local distribution companies. FGT operates approximately 5,000 miles <strong>of</strong><br />
pipeline nationwide, including 3,300 miles in Florida. FGT’s system has undergone six expansions<br />
since its inception in 1959, increasing pipeline capacity from its original 0.278 Bcf/day to its current<br />
2.2 Bcf/day. Gulfstream has a system pipeline capacity <strong>of</strong> 1.1 Bcf/day. The first phase <strong>of</strong><br />
Gulfstream’s system, which entered service in 2002, crosses the Gulf <strong>of</strong> Mexico between Pascagoula,<br />
Mississippi, and Manatee County, Florida, with more than 430 miles <strong>of</strong> 36'' diameter pipe. The Phase<br />
II expansion, a 110-mile extension to FPL’s Martin plant site in Martin County entered service in<br />
February 2005.<br />
In-State Pipeline Transportation Projects<br />
FGT: FGT’s Phase VII Expansion Project involves construction <strong>of</strong> 33 miles <strong>of</strong> 36'' diameter pipeline<br />
looping and installation <strong>of</strong> 9,800 horsepower <strong>of</strong> compression. The expansion provides approximately<br />
0.16 Bcf/day <strong>of</strong> additional capacity to transport natural gas from a connection with Southern Natural<br />
Gas Company’s Cypress Pipeline. The expansion began service in May 2007.<br />
Gulfstream: Gulfstream’s Phase III expansion will provide service to FPL’s West County Energy<br />
Center and is expected to begin service in the summer <strong>of</strong> 2008. The Phase IV expansion will provide<br />
pipeline capacity for PEF’s Bartow site in Pinellas County.<br />
Cypress Pipeline: Phase I <strong>of</strong> this project is a 24'' pipeline that connects the Elba Island LNG facility<br />
near Savannah, Georgia, to FGT’s system near Jacksonville. This pipeline began service in May 2007<br />
and provides gas to PEF’s Hines units. This pipeline plans additional phases involving looping and<br />
additional compression.<br />
<strong>Review</strong> <strong>of</strong> 2007 <strong>Ten</strong>-<strong>Year</strong> <strong>Site</strong> <strong>Plans</strong> 35
Out-<strong>of</strong>-State Pipeline Projects<br />
Southeast Supply Header: Duke Energy and CenterPoint Energy will construct a 270 mile, 36''<br />
diameter pipeline from the Perryville hub in Louisiana to interconnect with the Gulfstream Pipeline at<br />
Pascagoula, Mississippi. It will intersect with major pipelines and storage facilities. FPL has<br />
contracted for 50 percent <strong>of</strong> the capacity and PEF has contracted for 20 percent. For both utilities, the<br />
<strong>Commission</strong> has approved the recovery <strong>of</strong> prudent transportation costs associated with this pipeline<br />
through the fuel cost recovery clause. This pipeline is expected to begin service in July 2008.<br />
Columbia Gulf Transmission: Columbia Gulf plans to construct a pipeline from the Perryville hub to<br />
Pascagoula, Mississippi. It is expected to begin service at the end <strong>of</strong> 2007 and will interconnect with<br />
FGT and Gulfstream.<br />
Gulf South Pipeline Company: Gulf South has proposed three expansion projects. Like the abovementioned<br />
projects, these expansions intend to bring unconventional gas, from areas such as the<br />
Barnett Shale and Bossier Sands in east Texas, to connections with FGT and Gulfstream.<br />
Liquefied Natural Gas Pipeline Projects<br />
In addition to the Cypress Pipeline, two LNG projects are proposed to serve Florida. The Calypso<br />
project is sponsored by Suez Energy North America. This project will involve a submerged buoy<br />
system <strong>of</strong>f the Southeast Florida coast that will serve as an <strong>of</strong>fshore delivery point for LNG. This port<br />
would be located approximately 10 miles <strong>of</strong>fshore from Port Everglades in Broward County. The<br />
expected capacity is approximately 1.9 Bcf/day. The project is in the permitting stage.<br />
Höegh LNG – Port Dolphin: This proposed <strong>of</strong>fshore terminal and submerged buoy system would be<br />
28 miles <strong>of</strong>fshore and would be connected to Port Manatee near Tampa Bay by a 42 mile pipeline.<br />
The proposed capacity is 1.2 Bcf/day. In April 2007, the project applied with the U.S. Coast Guard to<br />
build and operate this LNG import/regasification terminal.<br />
COAL PRICE FORECASTS<br />
Supply and Price<br />
The reporting utilities forecasted coal prices in nominal dollars on a delivered basis.<br />
Therefore, there are differences in the forecasted prices depending on the location <strong>of</strong> the particular<br />
utility’s coal plant and the mode <strong>of</strong> transportation. The forecasts use existing long-term contract<br />
prices and estimates <strong>of</strong> the spot market prices.<br />
The reporting utilities generally see stable coal prices over the planning horizon. Some<br />
upward trend in prices is expected as demand increases due to new coal generation units coming on<br />
line across the U.S. Exports and increased mining cost also provide upward price pressure. However,<br />
an ample supply <strong>of</strong> domestic coal exists and the use <strong>of</strong> imported coal is expected to increase. Several<br />
Florida utilities import coal from Colombia and Venezuela. Current coal prices are high compared to<br />
prices in the past five years. This should provide mine operators an incentive to increase production.<br />
Increased supply from the Powder River Basin and Illinois Basin, as well as imports, should moderate<br />
coal prices over the planning horizon.<br />
<strong>Review</strong> <strong>of</strong> 2007 <strong>Ten</strong>-<strong>Year</strong> <strong>Site</strong> <strong>Plans</strong> 36
In its Annual Energy Outlook for 2007, EIA expects a slight decrease in average Minemouth<br />
prices during the period 2010 to 2015. This decrease is driven by production shifting away from highcost<br />
Central Appalachian coal. EIA notes surface mined coal from the West should capture a<br />
growing share <strong>of</strong> the market. EIA also indicates that coal prices are sensitive to changes in energy and<br />
environmental policies. Steps to reduce greenhouse gas emissions will affect future coal supply and<br />
demand.<br />
Several reporting utilities burn a mix <strong>of</strong> coal and petroleum coke (petcoke), which is a<br />
byproduct <strong>of</strong> petroleum refining. An increase in coal units would increase the demand for petcoke.<br />
However, refinery capacity will increase in the Gulf Coast area and the Caribbean Basin, which will<br />
increase supply. The forecasts suggest that petcoke prices will be stable.<br />
Transportation<br />
Also contributing to today’s relatively high delivered prices is rail transportation congestion.<br />
Moreover, as railroads expand tracks to relieve the problem, transportation costs will increase since<br />
the railroads will include returns on expansions in rates. Some reporting utilities depend entirely on<br />
rail for coal transport. Others use waterborne and rail transportation, both <strong>of</strong> which can reduce costs.<br />
Over the planning horizon, EIA sees periodic bottlenecks for railroads transporting western coal to the<br />
eastern United States.<br />
Potentially, a combination <strong>of</strong> ocean transport with short-haul rail transport can reduce<br />
delivered MMBtu costs. For utilities with plants at interior sites, the ability to get short-haul rail<br />
transport contracts is an important factor for reducing the costs <strong>of</strong> delivered coal over the planning<br />
period.<br />
RESIDUAL OIL PRICES AND DISTILLATE OIL PRICES<br />
Supply and Price<br />
For the planning period, OPEC countries are expected to gain market share over non-OPEC<br />
countries. By 2012, seven countries will account for 50 percent <strong>of</strong> world crude oil production. Based<br />
on announced exploration and production projects, the supply <strong>of</strong> oil will increase through 2012.<br />
Crude oil prices should increase with the projected 3 percent annual global economic growth.<br />
Oil prices depend on global economic growth, other competing energy developments, and geopolitics.<br />
Economic growth in India, China, and the Pacific Rim countries has increased demand. Platts, an<br />
energy information service, states there will always be a geopolitical risk premium in oil prices.<br />
Current sources <strong>of</strong> geopolitical risk for oil prices are Venezuela, Nigeria, Russia, former Soviet States,<br />
and the Middle East. New supplies through 2012 may moderate price increases, but as OPEC gains<br />
market share, oil prices are expected to increase at a higher rate. Spare production capacity for OPEC<br />
countries – specifically, Saudi Arabia and the United Arab Emirates – has decreased, which reduces<br />
the ability <strong>of</strong> these countries to increase supply and reduce prices.<br />
Several Florida electric utilities make significant use <strong>of</strong> residual fuel oil (heavy oil) for<br />
generation. The companies provided price forecasts showing nominal delivered prices for residual<br />
fuel oil, typically in three categories based on sulfur content. As noted for petroleum coke, refinery<br />
capacity will increase in the Gulf Coast area and the Caribbean Basin. This expansion will increase<br />
<strong>Review</strong> <strong>of</strong> 2007 <strong>Ten</strong>-<strong>Year</strong> <strong>Site</strong> <strong>Plans</strong> 37
the supply <strong>of</strong> residual fuel oil. For the planning period, the utilities are forecasting stable residual oil<br />
prices.<br />
Florida electric utilities also use distillate oil – No. 2 fuel oil – as a back-up fuel for natural gas<br />
plants that are fuel switchable and as a starter fuel for coal plants. Due to its relatively high price,<br />
utilities do not use distillate oil to generate a significant amount <strong>of</strong> electricity. As with residual oil<br />
prices, the utilities are forecasting stable distillate oil prices.<br />
NUCLEAR FUEL PRICES<br />
Supply & Price<br />
The long-term outlook for the nuclear fuel supply chain is currently influenced by the<br />
following factors:<br />
• Aging milling, conversion, and enrichment facilities.<br />
• Lack <strong>of</strong> excess capacity.<br />
• Lack <strong>of</strong> supply diversification at processing facilities.<br />
• Potential regulatory changes and increased security requirements.<br />
• Number and timing <strong>of</strong> the start-up <strong>of</strong> new nuclear plants.<br />
• Number and timing <strong>of</strong> the start-up <strong>of</strong> new mines and milling facilities.<br />
• Performance <strong>of</strong> processing plants.<br />
Traditionally, nuclear fuel prices have been very stable; however, based on the above factors,<br />
prices are becoming more volatile. Both owners <strong>of</strong> Florida nuclear units – PEF and FPL – are<br />
forecasting a moderate upward trend in nuclear fuel prices for the 2007 to 2016 planning period. An<br />
additional feature <strong>of</strong> industry pricing is that customers depend increasingly on long-term contracts,<br />
with terms out to five years, for uranium conversion, enrichment, and fabrication.<br />
<strong>Review</strong> <strong>of</strong> 2007 <strong>Ten</strong>-<strong>Year</strong> <strong>Site</strong> <strong>Plans</strong> 38
7. STATE, REGIONAL, AND LOCAL AGENCY COMMENTS<br />
Florida Municipal Power Agency<br />
Department <strong>of</strong> Environmental Protection. FMPA’s <strong>Ten</strong>-<strong>Year</strong> <strong>Site</strong> Plan is adequate for<br />
planning purposes.<br />
Florida Fish and Wildlife Conservation <strong>Commission</strong>. FMPA’s <strong>Ten</strong>-<strong>Year</strong> <strong>Site</strong> Plan is suitable<br />
for planning purposes.<br />
Plan.<br />
North Central Florida Regional Planning Council. No comment on FMPA’s <strong>Ten</strong>-<strong>Year</strong> <strong>Site</strong><br />
South Florida Regional Planning Council. FMPA should diversify fuel sources and<br />
emphasize renewable clean fuels. Planning measures should be consistent with Strategic Regional<br />
Policy Plan goals and objectives including energy conservation and the development <strong>of</strong> renewable,<br />
clean fuels.<br />
Treasure Coast Regional Planning Council. FMPA has a potential site at T.G. Smith Power<br />
Plant in Lake Worth suitable for possible upgrades. The capacity upgrades described are consistent<br />
with the strategic Regional Policy Plan.<br />
South Florida Water Management District. No adverse comments regarding the proposed<br />
sites discussed in FMPA’s <strong>Ten</strong>-<strong>Year</strong> <strong>Site</strong> Plan.<br />
Florida Power & Light Company<br />
Department <strong>of</strong> Environmental Protection. FPL’s <strong>Ten</strong>-<strong>Year</strong> <strong>Site</strong> Plan is adequate for planning<br />
purposes.<br />
Florida Fish and Wildlife Conservation <strong>Commission</strong>. FPL’s planning for Turkey Point and<br />
Glades Power Park is suitable for planning purposes. Concerns relating to the West County Energy<br />
Center include water resource needs and impact and or interaction with the Everglades Restoration<br />
Plan. Also any development or installation through the Corbett Wildlife Management Area would be<br />
a concern.<br />
Central Florida Regional Planning Council. FPL’s planning documents have been reviewed<br />
and no potential conflicts with natural resources, growth management policies, or the Strategic<br />
Regional Policy Plan have been identified.<br />
South Florida Regional Planning Council. FPL should diversify fuel sources and emphasize<br />
renewable clean fuels. Planning measures should be consistent with Strategic Regional Policy Plan<br />
goals and objectives including energy conservation and development <strong>of</strong> renewable, clean fuels.<br />
Treasure Coast Regional Planning Council. FPL has no new preferred site plans within<br />
Treasure Coast’s jurisdiction. Potential sites at the Martin Power Plant and the Riviera Plant <strong>Site</strong> do<br />
not conflict with regional policy.<br />
<strong>Review</strong> <strong>of</strong> 2007 <strong>Ten</strong>-<strong>Year</strong> <strong>Site</strong> <strong>Plans</strong> 39
South Florida Water Management District. Has no adverse comments regarding the proposed<br />
sites discussed in FPL’s <strong>Ten</strong>-<strong>Year</strong> <strong>Site</strong> Plan.<br />
Brevard County Board <strong>of</strong> County <strong>Commission</strong>ers. The FPL plan for generator additions for<br />
the Cape Canaveral Plant should be consistent with local zoning regulation and growth management<br />
policies. Possible impacts <strong>of</strong> water discharges into the adjacent Indian River Lagoon are a concern.<br />
Gulf Power Company<br />
Department <strong>of</strong> Environmental Protection.<br />
planning purposes.<br />
GULF’s <strong>Ten</strong>-<strong>Year</strong> <strong>Site</strong> Plan is adequate for<br />
Florida Fish and Wildlife Conservation <strong>Commission</strong>. GULF’s <strong>Ten</strong>-<strong>Year</strong> <strong>Site</strong> Plan is suitable<br />
for planning purposes.<br />
Apalachee Regional Planning Council. GULF’s potential plans for capacity addition to the<br />
Sholz Plant <strong>Site</strong> in Jackson County should be consistent with local zoning regulation, growth<br />
management policies, and environmental regulation.<br />
West Florida Regional Planning Council. GULF’s <strong>Ten</strong>-<strong>Year</strong> <strong>Site</strong> Plan is consistent with the<br />
West Florida Strategic Regional Policy Plan.<br />
The County <strong>of</strong> Escambia. GULF’s proposed project, located in Escambia County, should be<br />
consistent with the Escambia County Land Development Code.<br />
JEA<br />
Department <strong>of</strong> Environmental Protection. JEA’s <strong>Ten</strong>-<strong>Year</strong> <strong>Site</strong> Plan is adequate for planning<br />
purposes.<br />
North Central Florida Regional Planning Council. No comment on JEA’s <strong>Ten</strong>-<strong>Year</strong> <strong>Site</strong> Plan.<br />
North Florida Regional Council. JEA’s <strong>Ten</strong>-<strong>Year</strong> <strong>Site</strong> Plan contained ample forecasting.<br />
Council supports efforts to reduce reliance on coal and oil as well as efforts to increase energy<br />
conservation activities and develop clean alternative energy alternatives.<br />
Orlando Utilities <strong>Commission</strong><br />
Department <strong>of</strong> Environmental Protection. OUC’s <strong>Ten</strong>-<strong>Year</strong> <strong>Site</strong> Plan is adequate for planning<br />
purposes.<br />
South Florida Water Management District. No adverse comments regarding the proposed<br />
sites discussed in OUC’s <strong>Ten</strong>-<strong>Year</strong> <strong>Site</strong> Plan.<br />
Orange County. OUC’s <strong>Ten</strong>-<strong>Year</strong> <strong>Site</strong> Plan does not appear to indicate any inconsistencies<br />
with Orange County’s Growth Management policies at this time.<br />
<strong>Review</strong> <strong>of</strong> 2007 <strong>Ten</strong>-<strong>Year</strong> <strong>Site</strong> <strong>Plans</strong> 40
Progress Energy Florida<br />
Department <strong>of</strong> Environmental Protection. PEF’s <strong>Ten</strong>-<strong>Year</strong> <strong>Site</strong> Plan is adequate for planning<br />
purposes.<br />
Florida Fish and Wildlife Conservation <strong>Commission</strong>. PEF’s <strong>Ten</strong>-<strong>Year</strong> <strong>Site</strong> Plan is suitable for<br />
planning purposes.<br />
Central Florida Regional Planning Council. PEF’s planning documents have been reviewed<br />
and no potential conflicts with natural resources, growth management policies, or the Strategic<br />
Regional Policy Plan have been identified.<br />
Tampa Bay Regional Planning Council. PEF’s <strong>Ten</strong>-<strong>Year</strong> <strong>Site</strong> Plan is consistent with the<br />
Council’s Strategic Regional Policy Plan. Proposed changes to the Polk site will have a net positive<br />
impact on air quality and water quality in, and surrounding, the Tampa Bay region.<br />
Seminole Electric Cooperative<br />
Department <strong>of</strong> Environmental Protection. SEC’s <strong>Ten</strong>-<strong>Year</strong> <strong>Site</strong> Plan is adequate for planning<br />
purposes.<br />
Central Florida Regional Planning Council. SEC’s planning documents have been reviewed<br />
and no potential conflicts with natural resources, growth management policies, or the Strategic<br />
Regional Policy Plan have been identified.<br />
North Florida Regional Council. SEC’s <strong>Ten</strong>-<strong>Year</strong> <strong>Site</strong> Plan contained ample forecasting.<br />
Council supports efforts to reduce reliance on coal and oil as well as efforts to increase energy<br />
conservation activities and develop clean alternative energy alternatives.<br />
Plan.<br />
Putnam County Planning and Development <strong>Service</strong>s. No comment on SEC’s <strong>Ten</strong>-<strong>Year</strong> <strong>Site</strong><br />
City <strong>of</strong> Tallahassee<br />
Department <strong>of</strong> Environmental Protection. TAL’s <strong>Ten</strong>-<strong>Year</strong> <strong>Site</strong> Plan is adequate for planning<br />
purposes.<br />
Florida Fish and Wildlife Conservation <strong>Commission</strong>. TAL’s <strong>Ten</strong>-<strong>Year</strong> <strong>Site</strong> Plan is suitable<br />
for planning purposes.<br />
Apalachee Regional Planning Council. With the recent uncertainty <strong>of</strong> the Taylor Energy<br />
Center, concerns regarding transmission capabilities are raised.<br />
Plan.<br />
issues.<br />
North Central Florida Regional Planning Council. No comment on TAL’s <strong>Ten</strong>-<strong>Year</strong> <strong>Site</strong><br />
Leon County Planning Department. TAL’s <strong>Ten</strong>-<strong>Year</strong> <strong>Site</strong> Plan does not raise any consistency<br />
<strong>Review</strong> <strong>of</strong> 2007 <strong>Ten</strong>-<strong>Year</strong> <strong>Site</strong> <strong>Plans</strong> 41
Tampa Electric Company<br />
Department <strong>of</strong> Environmental Protection. TECO’s <strong>Ten</strong>-<strong>Year</strong> <strong>Site</strong> Plan is adequate for<br />
planning purposes.<br />
Central Florida Regional Planning Council. TECO’s planning documents have been reviewed<br />
and no potential conflicts with natural resources, growth management policies, or the Strategic<br />
Regional Policy Plan have been identified.<br />
Tampa Bay Regional Planning Council. TECO’s <strong>Ten</strong>-<strong>Year</strong> <strong>Site</strong> Plan is consistent with the<br />
Council’s Strategic Regional Policy Plan.<br />
<strong>Review</strong> <strong>of</strong> 2007 <strong>Ten</strong>-<strong>Year</strong> <strong>Site</strong> <strong>Plans</strong> 42