Strategic Cost Structure Choice In Service Organizations
Strategic Cost Structure Choice In Service Organizations
Strategic Cost Structure Choice In Service Organizations
Create successful ePaper yourself
Turn your PDF publications into a flip-book with our unique Google optimized e-Paper software.
<strong>Strategic</strong> <strong>Cost</strong> <strong>Structure</strong> <strong>Choice</strong> <strong>In</strong> <strong>Service</strong> <strong>Organizations</strong><br />
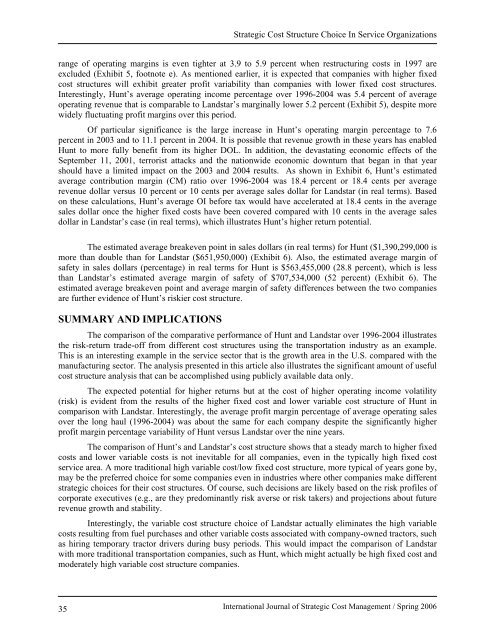
range of operating margins is even tighter at 3.9 to 5.9 percent when restructuring costs in 1997 are<br />
excluded (Exhibit 5, footnote e). As mentioned earlier, it is expected that companies with higher fixed<br />
cost structures will exhibit greater profit variability than companies with lower fixed cost structures.<br />
<strong>In</strong>terestingly, Hunt’s average operating income percentage over 1996-2004 was 5.4 percent of average<br />
operating revenue that is comparable to Landstar’s marginally lower 5.2 percent (Exhibit 5), despite more<br />
widely fluctuating profit margins over this period.<br />
Of particular significance is the large increase in Hunt’s operating margin percentage to 7.6<br />
percent in 2003 and to 11.1 percent in 2004. It is possible that revenue growth in these years has enabled<br />
Hunt to more fully benefit from its higher DOL. <strong>In</strong> addition, the devastating economic effects of the<br />
September 11, 2001, terrorist attacks and the nationwide economic downturn that began in that year<br />
should have a limited impact on the 2003 and 2004 results. As shown in Exhibit 6, Hunt’s estimated<br />
average contribution margin (CM) ratio over 1996-2004 was 18.4 percent or 18.4 cents per average<br />
revenue dollar versus 10 percent or 10 cents per average sales dollar for Landstar (in real terms). Based<br />
on these calculations, Hunt’s average OI before tax would have accelerated at 18.4 cents in the average<br />
sales dollar once the higher fixed costs have been covered compared with 10 cents in the average sales<br />
dollar in Landstar’s case (in real terms), which illustrates Hunt’s higher return potential.<br />
The estimated average breakeven point in sales dollars (in real terms) for Hunt ($1,390,299,000 is<br />
more than double than for Landstar ($651,950,000) (Exhibit 6). Also, the estimated average margin of<br />
safety in sales dollars (percentage) in real terms for Hunt is $563,455,000 (28.8 percent), which is less<br />
than Landstar’s estimated average margin of safety of $707,534,000 (52 percent) (Exhibit 6). The<br />
estimated average breakeven point and average margin of safety differences between the two companies<br />
are further evidence of Hunt’s riskier cost structure.<br />
SUMMARY AND IMPLICATIONS<br />
The comparison of the comparative performance of Hunt and Landstar over 1996-2004 illustrates<br />
the risk-return trade-off from different cost structures using the transportation industry as an example.<br />
This is an interesting example in the service sector that is the growth area in the U.S. compared with the<br />
manufacturing sector. The analysis presented in this article also illustrates the significant amount of useful<br />
cost structure analysis that can be accomplished using publicly available data only.<br />
The expected potential for higher returns but at the cost of higher operating income volatility<br />
(risk) is evident from the results of the higher fixed cost and lower variable cost structure of Hunt in<br />
comparison with Landstar. <strong>In</strong>terestingly, the average profit margin percentage of average operating sales<br />
over the long haul (1996-2004) was about the same for each company despite the significantly higher<br />
profit margin percentage variability of Hunt versus Landstar over the nine years.<br />
The comparison of Hunt’s and Landstar’s cost structure shows that a steady march to higher fixed<br />
costs and lower variable costs is not inevitable for all companies, even in the typically high fixed cost<br />
service area. A more traditional high variable cost/low fixed cost structure, more typical of years gone by,<br />
may be the preferred choice for some companies even in industries where other companies make different<br />
strategic choices for their cost structures. Of course, such decisions are likely based on the risk profiles of<br />
corporate executives (e.g., are they predominantly risk averse or risk takers) and projections about future<br />
revenue growth and stability.<br />
<strong>In</strong>terestingly, the variable cost structure choice of Landstar actually eliminates the high variable<br />
costs resulting from fuel purchases and other variable costs associated with company-owned tractors, such<br />
as hiring temporary tractor drivers during busy periods. This would impact the comparison of Landstar<br />
with more traditional transportation companies, such as Hunt, which might actually be high fixed cost and<br />
moderately high variable cost structure companies.<br />
35<br />
<strong>In</strong>ternational Journal of <strong>Strategic</strong> <strong>Cost</strong> Management / Spring 2006


