Financial Reporting - Rexel
Financial Reporting - Rexel
Financial Reporting - Rexel

You also want an ePaper? Increase the reach of your titles
YUMPU automatically turns print PDFs into web optimized ePapers that Google loves.
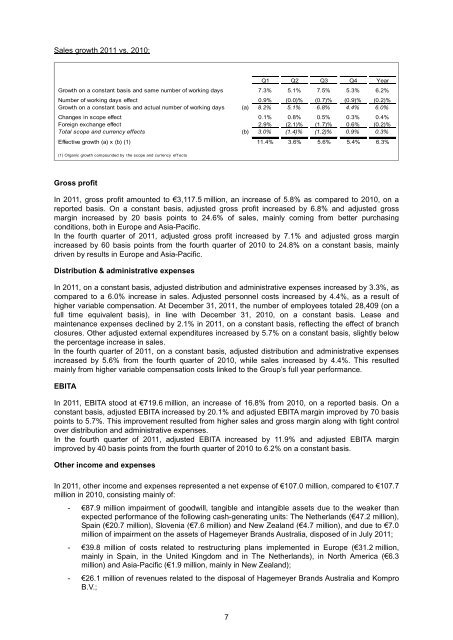
Sales growth 2011 vs. 2010:<br />
Q1 Q2 Q3 Q4 Year<br />
Growth on a constant basis and same number of working days 7.3% 5.1% 7.5% 5.3% 6.2%<br />
Number of working days effect 0.9% (0.0)% (0.7)% (0.9)% (0.2)%<br />
Growth on a constant basis and actual number of working days (a) 8.2% 5.1% 6.8% 4.4% 6.0%<br />
Changes in scope effect 0.1% 0.8% 0.5% 0.3% 0.4%<br />
Foreign exchange effect 2.9% (2.1)% (1.7)% 0.6% (0.2)%<br />
Total scope and currency effects (b) 3.0% (1.4)% (1.2)% 0.9% 0.3%<br />
Effective growth (a) x (b) (1) 11.4% 3.6% 5.6% 5.4% 6.3%<br />
(1) Organic growth compounded by the scope and currency ef f ects<br />
Gross profit<br />
In 2011, gross profit amounted to €3,117.5 million, an increase of 5.8% as compared to 2010, on a<br />
reported basis. On a constant basis, adjusted gross profit increased by 6.8% and adjusted gross<br />
margin increased by 20 basis points to 24.6% of sales, mainly coming from better purchasing<br />
conditions, both in Europe and Asia-Pacific.<br />
In the fourth quarter of 2011, adjusted gross profit increased by 7.1% and adjusted gross margin<br />
increased by 60 basis points from the fourth quarter of 2010 to 24.8% on a constant basis, mainly<br />
driven by results in Europe and Asia-Pacific.<br />
Distribution & administrative expenses<br />
In 2011, on a constant basis, adjusted distribution and administrative expenses increased by 3.3%, as<br />
compared to a 6.0% increase in sales. Adjusted personnel costs increased by 4.4%, as a result of<br />
higher variable compensation. At December 31, 2011, the number of employees totaled 28,409 (on a<br />
full time equivalent basis), in line with December 31, 2010, on a constant basis. Lease and<br />
maintenance expenses declined by 2.1% in 2011, on a constant basis, reflecting the effect of branch<br />
closures. Other adjusted external expenditures increased by 5.7% on a constant basis, slightly below<br />
the percentage increase in sales.<br />
In the fourth quarter of 2011, on a constant basis, adjusted distribution and administrative expenses<br />
increased by 5.6% from the fourth quarter of 2010, while sales increased by 4.4%. This resulted<br />
mainly from higher variable compensation costs linked to the Group’s full year performance.<br />
EBITA<br />
In 2011, EBITA stood at €719.6 million, an increase of 16.8% from 2010, on a reported basis. On a<br />
constant basis, adjusted EBITA increased by 20.1% and adjusted EBITA margin improved by 70 basis<br />
points to 5.7%. This improvement resulted from higher sales and gross margin along with tight control<br />
over distribution and administrative expenses.<br />
In the fourth quarter of 2011, adjusted EBITA increased by 11.9% and adjusted EBITA margin<br />
improved by 40 basis points from the fourth quarter of 2010 to 6.2% on a constant basis.<br />
Other income and expenses<br />
In 2011, other income and expenses represented a net expense of €107.0 million, compared to €107.7<br />
million in 2010, consisting mainly of:<br />
- €87.9 million impairment of goodwill, tangible and intangible assets due to the weaker than<br />
expected performance of the following cash-generating units: The Netherlands (€47.2 million),<br />
Spain (€20.7 million), Slovenia (€7.6 million) and New Zealand (€4.7 million), and due to €7.0<br />
million of impairment on the assets of Hagemeyer Brands Australia, disposed of in July 2011;<br />
- €39.8 million of costs related to restructuring plans implemented in Europe (€31.2 million,<br />
mainly in Spain, in the United Kingdom and in The Netherlands), in North America (€6.3<br />
million) and Asia-Pacific (€1.9 million, mainly in New Zealand);<br />
- €26.1 million of revenues related to the disposal of Hagemeyer Brands Australia and Kompro<br />
B.V.;<br />
7