

US-Listed ETFs Sorted by Asset Class and Year-to-Date Return
US-Listed ETFs Sorted by Asset Class and Year-to-Date Return
US-Listed ETFs Sorted by Asset Class and Year-to-Date Return

Create successful ePaper yourself
Turn your PDF publications into a flip-book with our unique Google optimized e-Paper software.
Issue No. 128<br />
July 2011<br />
www.indexuniverse.com/ETFR<br />
GSG Tracking: What<br />
Really Happened<br />
By Sumit Roy <strong>and</strong> Matt Hougan<br />
When it comes <strong>to</strong> commodity indexes,<br />
the S&P GSCI is far <strong>and</strong> away the<br />
leader. More than $100 billion in assets<br />
is tied <strong>to</strong> this index, including nearly<br />
$2 billion split between two popular<br />
exchange-traded products: the $1.7<br />
billion iShares S&P GSCI Commodity-<br />
Indexed Trust (NYSE Arca: GSG) <strong>and</strong><br />
its smaller cousin, the $121 million iPath<br />
S&P GSCI Total <strong>Return</strong> Index ETN<br />
(NYSE Arca: GSP).<br />
The two products aim <strong>to</strong> do the<br />
exact same thing: provide inves<strong>to</strong>rs<br />
with exposure <strong>to</strong> the S&P GSCI Total<br />
<strong>Return</strong> Index. Compare recent returns,<br />
however, <strong>and</strong> you get two very different<br />
pictures: As of June 6, GSG had<br />
returned 3.95 percent year-<strong>to</strong>-date,<br />
while GSP had returned 6.03 percent.<br />
Considering that the actual S&P GSCI<br />
benchmark is up 6.13 percent, GSG has<br />
underperformed expectations.<br />
UPDATES<br />
Do inves<strong>to</strong>rs have this wrong? Is the<br />
$1.7 billion in GSG tracking an inferior<br />
product? Should they swap out for GSP<br />
immediately?<br />
Not necessarily—the s<strong>to</strong>ry is more<br />
complex than it looks.<br />
Two Approaches To<br />
Tracking The Index<br />
While GSP <strong>and</strong> GSG aim <strong>to</strong> track the same<br />
index, they do so in different ways that<br />
promise two different kinds of results.<br />
As an ETN, GSP eliminates tracking<br />
error. ETNs are structured as debt<br />
notes, where<strong>by</strong> the underwriting<br />
bank—in this case, Barclays Capital—<br />
guarantees <strong>to</strong> deliver the exact return<br />
of the benchmark index. Barring unusual<br />
events, ETNs will track nearly<br />
perfectly <strong>to</strong> their indexes, <strong>and</strong> GSP has<br />
delivered on this promise.<br />
There is no such thing as a free<br />
lunch, of course, <strong>and</strong> the per-<br />
Russell Launches First In-House <strong>ETFs</strong><br />
12<br />
IN THIS ISSUE<br />
iShares’ GSG suddenly <strong>and</strong> inexplicably<br />
underperformed its benchmark, even<br />
as its ETN competition excelled. What<br />
happened, <strong>and</strong> will the ETF correct?<br />
Page 1<br />
At the height of the silver bubble, the<br />
CME increased margin requirements on<br />
futures contracts six times. Did the CME<br />
pop the bubble?<br />
Page 6<br />
Ben Tobias, president of Tobias<br />
Financial, shares why VIG is his favorite<br />
ETF for dividends, <strong>and</strong> why income is so<br />
important for his clients.<br />
Page 8<br />
Float adjustment is one of the oldest<br />
controversies in index investments. Learn<br />
how each index provider calculates<br />
float—<strong>and</strong> how your <strong>ETFs</strong> are affected.<br />
Page 9<br />
ETFR’s monthly data bank covers all U.S.-<br />
listed <strong>ETFs</strong>, including assets, performance<br />
data <strong>and</strong> more.<br />
Pages 15-22<br />
News Highlights: Russell Finally<br />
Launches <strong>ETFs</strong>; Guggenheim Unveils<br />
Active Bond <strong>ETFs</strong>; iShares’ Parsons Joins<br />
VelocityShares; Global X <strong>ETFs</strong> Trade Free<br />
On Interactive … And much more!<br />
Pages 1-4<br />
In mid-May, Russell Investments launched<br />
six exchange-traded funds, its first after<br />
a protracted regula<strong>to</strong>ry process that has<br />
left it a latecomer <strong>to</strong> the now-crowded<br />
field of ETF sponsors.<br />
The new funds, called the “Russell Investment<br />
Discipline <strong>ETFs</strong>,” are based on what<br />
the firm called the most prevalent strategies<br />
professional investment managers use<br />
when selecting individual securities. They<br />
are all priced at 0.37 percent <strong>and</strong> include:<br />
• Russell Aggressive Growth ETF<br />
(NYSE Arca: AGRG)<br />
• Russell Consistent Growth ETF<br />
(NYSE Arca: CONG)<br />
• Russell Growth at a Reasonable Price ETF<br />
(NYSE Arca: GRPC)<br />
• Russell Equity Income ETF<br />
(NYSE Arca: EQIN)<br />
• Russell Low P/E ETF (NYSE Arca: LWP)<br />
• Russell Contrarian ETF<br />
(NYSE Arca: CNTR)<br />
Russell had been trying <strong>to</strong> obtain<br />
permission from the Securities <strong>and</strong> Exchange<br />
Commission <strong>to</strong> market its own<br />
line of active <strong>and</strong> passive <strong>ETFs</strong> for about<br />
two years. The process usually takes anywhere<br />
from six <strong>to</strong> nine months, though<br />
sources at Russell disputed the notion<br />
that its so-called exemptive relief petitions<br />
at the SEC were somehow being<br />
held up. Industry sources have said the<br />
delays for Russell were related <strong>to</strong> 3
InsideIndexing<br />
inaugural<br />
conference<br />
BUIlDIng Better BetA 2011<br />
InsideCommodities<br />
Inside<strong>ETFs</strong>Europe<br />
InsideIndexing InsideCommodities<br />
Inside<strong>ETFs</strong>Europe InsideIndexing For more InFormAtIon:<br />
www.InsideIndexingConference.com /etFr<br />
From the producers of:<br />
Inside<strong>ETFs</strong><br />
Inside<strong>ETFs</strong>Europe<br />
InsideCommodities<br />
Oc<strong>to</strong>ber 17-18, 2011<br />
Inside<strong>ETFs</strong><br />
the ritz-carl<strong>to</strong>n • philadelphia, pa<br />
Inside<strong>ETFs</strong><br />
Designed specifically for InstItutIonal Inves<strong>to</strong>rs<br />
Featured speakers:<br />
InsideIndexing<br />
Inside<strong>ETFs</strong>Europe<br />
John C. Bogle<br />
Founder of The Vanguard Group, Inc.,<br />
President, Vanguard’s Bogle Financial<br />
Markets Research Center<br />
george Inside<strong>ETFs</strong><br />
F. Will<br />
Pulitzer Prize-Winning Columnist,<br />
Journalist & Author<br />
} For speaking opportunities, please contact:<br />
Allison Jones at 415-659-9012 or ajones@IndexUniverse.com<br />
Presented <strong>by</strong>:<br />
} For sponsorship opportunities, please contact:<br />
Don Friedman at 415-659-9009 or dfriedman@IndexUniverse.com
UPDATES<br />
Index Publications LLC<br />
353 Sacramen<strong>to</strong> Street, Suite 1520<br />
San Francisco, CA 94111<br />
Publisher<br />
Jim Wi<strong>and</strong>t<br />
415 659 9007<br />
Fax 415 659 9005<br />
jwi<strong>and</strong>t@indexuniverse.com<br />
Edi<strong>to</strong>r<br />
Matt Hougan<br />
mhougan@indexuniverse.com<br />
Managing Edi<strong>to</strong>r<br />
Cory Banks<br />
cbanks@indexuniverse.com<br />
Copy Edi<strong>to</strong>r<br />
Lisa Barr<br />
lbarr@indexuniverse.com<br />
Art Direc<strong>to</strong>r<br />
Jeannine Gaubert Pamoukdjian<br />
jpamoukdjian@indexuniverse.com<br />
Online Production Manager<br />
Juan Calderon<br />
jcaldero@indexuniverse.com<br />
Direc<strong>to</strong>r of Advertising<br />
Don Friedman<br />
415 659 9009<br />
dfriedman@indexuniverse.com<br />
SUBSCRIPTION INFORMATION<br />
The introduc<strong>to</strong>ry rate <strong>to</strong> subscribe <strong>to</strong> ETFR<br />
is $279 annually. Subscribe <strong>by</strong> contacting<br />
Steve Kimball at<br />
skimball@fa-mag.com or <strong>by</strong> calling<br />
732.450.8866, ext. 12.<br />
COPYRIGHT STATEMENT<br />
© 2011 Index Publications LLC. All rights reserved.<br />
The text, images <strong>and</strong> other materials contained or displayed<br />
are proprietary <strong>to</strong> Index Publications LLC, except where otherwise<br />
noted, <strong>and</strong> constitute valuable intellectual property.<br />
No material from any part of any Index Publications LLC publication,<br />
product, service, report, e-mail or Web site may be<br />
downloaded, transmitted, broadcast, transferred, assigned,<br />
reproduced or in any other way used or otherwise disseminated<br />
in any form <strong>to</strong> any person or entity, without the explicit<br />
written consent of Index Publications LLC.<br />
For permission <strong>to</strong> pho<strong>to</strong>copy <strong>and</strong> use material electronically,<br />
please contact reprints@indexuniverse.com or call<br />
415-659-9004.<br />
the SEC not being comfortable granting<br />
exemptive relief <strong>to</strong> a firm that already<br />
has such a large presence in the<br />
world of indexing.<br />
At the end of May, Russell followed up<br />
the initial launch with the rollout of 10<br />
more <strong>ETFs</strong> tracking “fac<strong>to</strong>r-based” versions<br />
of the Russell 1000 <strong>and</strong> Russell 2000.<br />
Guggenheim Unveils<br />
Active Bond <strong>ETFs</strong><br />
Guggenheim Funds entered the actively<br />
managed ETF space in May with the<br />
launch of two bond funds that target<br />
core exposure as well as an inves<strong>to</strong>r’s<br />
need for income.<br />
The Guggenheim Enhanced Core<br />
Bond ETF (NYSE Arca: GIY) <strong>and</strong> the<br />
Guggenheim Enhanced Ultra-Short<br />
Bond ETF (NYSE Arca: GSY) are currently<br />
the cheapest actively managed<br />
fixed-income <strong>ETFs</strong> available.<br />
GIY aims <strong>to</strong> outperform the Barclays<br />
Capital U.S. Aggregate Bond Index using<br />
a quantitative strategy that seeks <strong>to</strong><br />
both identify mispriced bonds <strong>and</strong> estimate<br />
future returns linked <strong>to</strong> a correction<br />
in those mispricings.<br />
Guggenheim’s other offering, GSY,<br />
focuses on the short end of the yield<br />
curve <strong>and</strong> seeks <strong>to</strong> outperform the one<strong>to</strong><br />
three-month Treasury Bill Index.<br />
The fund seeks “maximum income”<br />
<strong>and</strong> invests primarily in dollar-denominated<br />
investment-grade government<br />
<strong>and</strong> corporate bonds, but it may include<br />
some foreign debt as well.<br />
The two new Guggenheim <strong>ETFs</strong> have<br />
annual expense ratios of 0.27 percent.<br />
VelocityShares Adds<br />
iShares’ Parsons To Board<br />
VelocityShares, the new ETN company<br />
known for its volatility-linked products,<br />
in May named <strong>to</strong> its board J. Parsons,<br />
who was previously global head of<br />
iShares sales while it was part of Barclays<br />
Global Inves<strong>to</strong>rs.<br />
VelocityShares first entered the ETP<br />
market with the launch of six VIX-based<br />
ETNs in November 2010, among them<br />
the VelocityShares Daily 2X VIX Short-<br />
Term ETN (NYSE Arca: TVIX). The company<br />
said its family of ETNs has since<br />
amassed about $180 million in assets.<br />
Parsons, who led iShares’ global<br />
business development from its inception<br />
through its sale <strong>to</strong> BlackRock, said<br />
he is “thrilled” <strong>to</strong> help the company<br />
continue <strong>to</strong> grow.<br />
VelocityShares’ lineup of VIX-linked<br />
ETNs includes leveraged as well as inverse<br />
strategies. It said TVIX now trades<br />
more than 1 million shares a day, <strong>and</strong> is<br />
one of the most liquid ETPs launched in<br />
the last six months.<br />
Parsons left BlackRock in 2010.<br />
Global X ETF Trades<br />
Free On Interactive<br />
Interactive Brokers began offering free<br />
trades on <strong>ETFs</strong> sponsored <strong>by</strong> New Yorkbased<br />
Global X in May. Terms of the<br />
agreement weren’t disclosed.<br />
The free-trading offer is the latest<br />
sign of competition in the rapidly growing<br />
world of <strong>ETFs</strong>. The most conspicuous<br />
price battle is between Vanguard, the<br />
No. 3 U.S. ETF firm, <strong>and</strong> discount broker<br />
Schwab, with both firms offering free<br />
trades <strong>to</strong> clients trading their respective<br />
proprietary <strong>ETFs</strong>. Additionally, Scottrade<br />
is offering free trades on a new lineup of<br />
15 equity funds it rolled out in March.<br />
Interactive Brokers <strong>and</strong> its affiliates<br />
execute almost 1 million trades per<br />
day on a variety of electronic products,<br />
among them s<strong>to</strong>cks, options, futures,<br />
foreign exchange <strong>and</strong> bonds, according<br />
<strong>to</strong> the company’s website. The company’s<br />
mission is <strong>to</strong> create technology <strong>and</strong><br />
provide liquidity on better terms.<br />
Global X has gathered almost $1.7<br />
billion in assets spread among well over<br />
30 funds; it rolled out its first ETF in<br />
February 2009.<br />
First Trust Rolls Out<br />
First-Ever Au<strong>to</strong> ETF<br />
In May, First Trust rolled out the world’s<br />
first ETF focused on au<strong>to</strong>mobile manufacturers,<br />
in part as a reflection of high<br />
hopes in the investment world that the<br />
emerging markets will power global<br />
growth in the coming years.<br />
The First Trust Nasdaq Global Au<strong>to</strong><br />
Index Fund (NasdaqGM: CARZ) is based<br />
on the Nasdaq OMX Global Au<strong>to</strong> Index,<br />
a benchmark designed <strong>to</strong> track the performance<br />
of the biggest <strong>and</strong> most liquid<br />
companies engaged in the au<strong>to</strong> manufacturing<br />
industry. The ETF has an an-<br />
ETFR • July 2011 3
UPDATES<br />
nual expense ratio of 0.70 percent.<br />
The biggest country holding in the ETF<br />
at launch was Japan, at almost a third of<br />
the portfolio, followed <strong>by</strong> Germany, at just<br />
over 20 percent <strong>and</strong> the U.S., at almost 18<br />
percent. South Korean companies make<br />
up about 10 percent of the ETF.<br />
The <strong>to</strong>p three companies in the fund<br />
are Germany’s Daimler AG, at 8.28 percent;<br />
General Mo<strong>to</strong>rs at 7.64 percent;<br />
<strong>and</strong> Honda at 5.67 percent.<br />
Direxion Changes<br />
Tickers On Natgas Funds<br />
Direxion changed the ticker symbols on<br />
a pair of its natural gas funds in May.<br />
The Direxion Daily Natural Gas Related<br />
Bull 2x Shares will now trade under the<br />
ticker GASL <strong>and</strong> the Direxion Daily Natural<br />
Gas Related Bear 2x Shares under the<br />
ticker GASX. The funds’ previous tickers<br />
were FCGL <strong>and</strong> FCGS, respectively. Both<br />
<strong>ETFs</strong> trade on the NYSE Arca exchange.<br />
The new tickers are motivated simply<br />
<strong>by</strong> the company’s desire <strong>to</strong> make its<br />
monikers more easily recognizable <strong>to</strong><br />
inves<strong>to</strong>rs seeking <strong>to</strong> take advantage of<br />
short-term market movement, a company<br />
spokesperson said.<br />
The pair of funds is designed <strong>to</strong> provide<br />
twice the daily or inverse performance<br />
of the ISE-Revere Natural Gas Index,<br />
<strong>and</strong> has been around since August<br />
2010. The previous tickers bore clear resemblance<br />
<strong>to</strong> the trading symbol of the<br />
popular First Trust ISE-Revere Natural<br />
Gas ETF (NYSE Arca: FCG).<br />
Global X Debuts<br />
Fertilizer, Farming <strong>ETFs</strong><br />
In May, Global X Funds launched two<br />
<strong>ETFs</strong>, focusing on global fertilizer producers<br />
<strong>and</strong> farming equities.<br />
The Global X Fertilizers/Potash ETF<br />
(NYSE Arca: SOIL), <strong>by</strong> tracking the<br />
Solactive Global Fertilizers/Potash Index,<br />
owns the largest <strong>and</strong> most liquid global<br />
names involved in various aspects of the<br />
fertilizer industry. SOIL comes with a<br />
0.69 percent price tag.<br />
The Global X Farming ETF (NYSE Arca:<br />
BARN), on the other h<strong>and</strong>, is likely <strong>to</strong><br />
face stiff competition from the likes of<br />
the $5.25 billion Market Vec<strong>to</strong>rs Agribusiness<br />
ETF (NYSE Arca: MOO). Still, BARN<br />
claims <strong>to</strong> be more narrowly focused than<br />
its competi<strong>to</strong>rs, as it only includes companies<br />
in the agricultural products, lives<strong>to</strong>ck<br />
operations <strong>and</strong> farming equipment<br />
manufacturing segments.<br />
BARN tracks the Solactive Global<br />
Farming Index from Germany-based<br />
Structured Solutions AG. The benchmark<br />
comprises 50 securities screens for liquidity,<br />
<strong>and</strong> weights securities based on freefloat<br />
market capitalization.<br />
Retail Inves<strong>to</strong>rs Power<br />
Schwab ETF Gains<br />
Charles Schwab managed $121 billion in<br />
ETF assets at the end of the first quarter, 32<br />
percent more than a year ago, according <strong>to</strong><br />
the company’s latest ETF inves<strong>to</strong>r data. The<br />
increase is due largely <strong>to</strong> retail inves<strong>to</strong>rs <strong>and</strong><br />
a generally growing appetite for <strong>ETFs</strong>.<br />
Retail inves<strong>to</strong>r assets in the various<br />
<strong>ETFs</strong> offered through Schwab’s platform<br />
soared 58 percent between March 2010<br />
<strong>and</strong> March 2011, <strong>and</strong> now represent 37<br />
percent of Schwab’s <strong>to</strong>tal ETF pie, up<br />
from 31 percent a year earlier. Similarly,<br />
dem<strong>and</strong> from clients using registered<br />
investment advisors grew 18 percent,<br />
though an exodus from international equity<br />
<strong>ETFs</strong> slowed the RIA-related growth,<br />
the company said.<br />
For Schwab, about 85 percent of<br />
advisors already include <strong>ETFs</strong> in their<br />
portfolios, while only a small portion of<br />
retail inves<strong>to</strong>rs do, Beth Flynn, Schwab’s<br />
vice president of ETF platform development,<br />
said in a telephone interview in<br />
May. But usage <strong>by</strong> these retail inves<strong>to</strong>rs<br />
is growing faster, she noted.<br />
While a retail inves<strong>to</strong>r who uses <strong>ETFs</strong><br />
had, on average, a 16 percent allocation<br />
<strong>to</strong> cash, a non-ETF retail inves<strong>to</strong>r tied<br />
nearly 40 percent of invested assets <strong>to</strong><br />
cash, Schwab data showed.<br />
IndexIQ Rolls Out<br />
Japan MidCap ETF<br />
In June, IndexIQ rolled out a first-of-itskind<br />
ETF focused on midcap Japanese<br />
companies that the firm says have growth<br />
characteristics of small-cap enterprises<br />
with the size <strong>and</strong> stability of larger ones.<br />
The IQ Japan Mid Cap ETF (NYSE Arca:<br />
RSUN) is designed <strong>to</strong> give inves<strong>to</strong>rs pureplay<br />
exposure <strong>to</strong> the midcap universe either<br />
as a st<strong>and</strong>-alone fund or in conjunction<br />
with small- <strong>and</strong> large-cap Japanese<br />
offerings <strong>to</strong> create broader-based exposure,<br />
the company said in a press release.<br />
As of May 16, the industrial sec<strong>to</strong>r made<br />
up 23.2 percent of the ETF’s underlying<br />
index, while the financial <strong>and</strong> technology<br />
sec<strong>to</strong>rs made up 17.7 percent <strong>and</strong> about 9<br />
percent, respectively, IndexIQ said.<br />
The new ETF has an annual expense<br />
ratio 0.69 percent.<br />
UBS Launches 2X<br />
Business Development ETN<br />
In late May, Swiss bank UBS launched a double-exposure<br />
exchange-traded note focused<br />
on business development companies.<br />
The UBS 2X Leveraged Long Wells<br />
Fargo Business Development Company<br />
ETN (NYSE Arca: BDCL) is essentially<br />
a double-exposure play on an ETN it<br />
launched on April 28 with the ticker<br />
(NYSE Arca: BDCS).<br />
Both ETNs are based on the market-capitalization-weighted<br />
Wells Fargo Business<br />
Development Company Index, <strong>and</strong> have<br />
annual expense ratios of 0.85 percent.<br />
The new ETNs reflect a growing interest<br />
in financing for smaller companies<br />
that some say goes h<strong>and</strong> in h<strong>and</strong> with<br />
an economy that’s starting <strong>to</strong> grow on its<br />
own, aside from government aid. While<br />
credit markets have normalized <strong>to</strong> a large<br />
extent, small companies are still having<br />
problems obtaining loans since the economic<br />
crisis of 2008.<br />
Deutsche Debuts Leveraged<br />
Dollar Index ETNs<br />
Deutsche Bank <strong>and</strong> Invesco PowerShares<br />
rolled out in late May the first-ever U.S.<br />
dollar index leveraged ETNs that provide<br />
triple-long <strong>and</strong> triple-short exposure<br />
<strong>to</strong> futures contracts on the currency<br />
benchmark that measures the value of<br />
the greenback compared with six of the<br />
world’s most-traded currencies.<br />
The Powershares DB 3x Long <strong>US</strong> Dollar<br />
Index Futures ETN (NYSE Arca: UUPT)<br />
<strong>and</strong> PowerShares DB 3x Short <strong>US</strong> Dollar<br />
Index Futures ETN each charge an annual<br />
expense ratio of 0.95 percent.<br />
They are designed <strong>to</strong> replicate the performance<br />
of the dollar relative <strong>to</strong> a basket<br />
of six currencies: the euro, Japanese yen,<br />
British pound, Canadian dollar, Swedish<br />
krona <strong>and</strong> Swiss franc.<br />
The ETNs are rebalanced monthly. <br />
4 ETFR • July 2011
DBA<br />
T H E P O W E R S H A R E S D B<br />
AGRICULTURE FUND<br />
To download a copy of a prospectus, visit PowerShares.com/DBApro<br />
The fund is not a mutual fund or any other type of Investment Company within the meaning of the Investment Company Act<br />
of 1940 <strong>and</strong> is not subject <strong>to</strong> its regulation.<br />
DB Commodity Services LLC, a wholly owned subsidiary of Deutsche Bank AG, is the managing owner of the fund. Certain marketing<br />
services may be provided <strong>to</strong> the fund <strong>by</strong> Invesco Distribu<strong>to</strong>rs, Inc. or its affiliate, Invesco PowerShares Capital Management LLC<br />
(<strong>to</strong>gether, “Invesco”). Invesco will be compensated <strong>by</strong> Deutsche Bank or its affiliates. ALPS Distribu<strong>to</strong>rs, Inc. is the distribu<strong>to</strong>r of the<br />
fund. Invesco, Deutsche Bank <strong>and</strong> ALPS Distribu<strong>to</strong>rs, Inc. are not affiliated.<br />
Commodity futures contracts generally are volatile <strong>and</strong> are not suitable for all inves<strong>to</strong>rs.<br />
An inves<strong>to</strong>r may lose all or substantially all of an investment in the fund.
Hidden In The Margins: Can<br />
CME Drive Commodities Prices?<br />
By Cory Banks<br />
Between March 25 <strong>and</strong> May 9—the<br />
height of the silver bubble—the Chicago<br />
Mercantile Exchange increased required<br />
margins on silver commodities futures<br />
trades six times. Each change adjusted<br />
the amount of margin inves<strong>to</strong>rs needed<br />
<strong>to</strong> put up for futures contracts through<br />
the world’s largest commodities exchange,<br />
<strong>and</strong> sent chills down the spines<br />
of dyed-in-the-wool futures traders.<br />
The CME stated in vague press release<br />
language that margin increases<br />
were due <strong>to</strong> rising volatility. Some serious<br />
futures traders question that, however,<br />
concerned over the lack of transparency<br />
behind what amounts <strong>to</strong> more<br />
required buy-in. Meanwhile, ETF inves<strong>to</strong>rs<br />
were left scratching their heads. Is<br />
it really possible that the exchange was<br />
trying <strong>to</strong> manipulate the market?<br />
The CME’s Safety Valves<br />
Margins are the safety valves set for every<br />
contract traded on the CME—the<br />
amount of collateral inves<strong>to</strong>rs must put<br />
up <strong>to</strong> purchase a futures contract in any<br />
of the products traded on the exchange.<br />
Instead of paying all $100,000 of a contract<br />
for wheat delivery in August, a<br />
futures trader can post the minimum<br />
amount required.<br />
Here’s how it works: Suppose Bob the<br />
inves<strong>to</strong>r buys a 12-month contract for<br />
cot<strong>to</strong>n for $100, using $20 of his own<br />
money, <strong>and</strong> $80 borrowed from his broker.<br />
The net value (share minus loan) is<br />
$20. The broker wants a minimum margin<br />
requirement of $10, which means<br />
that the net value of the loan must remain<br />
above $10.<br />
The next day, the price of cot<strong>to</strong>n<br />
goes down <strong>to</strong> $85. The net value of the<br />
contract is now only $5. Bob has hit the<br />
margin requirement: He will either have<br />
<strong>to</strong> sell the contract or put up more margin<br />
(i.e., repay part of the $80 loan) so<br />
that the net value of his position is again<br />
above $10. Add in quite a few zeroes<br />
<strong>and</strong> you’ve got the situation for millions<br />
of traders <strong>and</strong> billions of dollars a day.<br />
Each type of commodity traded<br />
through the CME’s system has an assigned<br />
set of margins. The initial<br />
amount of collateral you’d pay <strong>to</strong> trade<br />
oil is different from sugar or cot<strong>to</strong>n. According<br />
<strong>to</strong> the CME, the amount of collateral<br />
required depends on the volatility<br />
of the chosen commodity, as well as<br />
a variety of other fac<strong>to</strong>rs.<br />
I think there is<br />
some truth that<br />
the specula<strong>to</strong>rs<br />
in funds <strong>and</strong> new<br />
products are driving<br />
a lot of volume<br />
that was never<br />
here before.<br />
—Kevin Kerr<br />
“The largest piece of data we’re looking<br />
at is his<strong>to</strong>rical volatility,” said Amy<br />
McCormick of the CME clearing group.<br />
This includes tracking the price for each<br />
product every day <strong>and</strong> moni<strong>to</strong>ring the<br />
changes. For many commodities, Mc-<br />
Cormick says volatility is the biggest<br />
component of the equation.<br />
What the rest of that equation is, however,<br />
remains a well-guarded secret.<br />
Smoke And Mirrors?<br />
Because CME keeps its calculations<br />
behind a veil, many traders are convinced<br />
that some sort of conspiracy<br />
exists between the exchanges <strong>and</strong> the<br />
commodities offered. The s<strong>to</strong>ries range<br />
from mere coincidence (the CME raised<br />
margins <strong>to</strong> make a profit as the bubble<br />
grew) <strong>to</strong> full-blown conspiracy theories<br />
(the CME is working in an interagency<br />
conspiracy <strong>to</strong> control the price of silver).<br />
The latter is fueled <strong>by</strong> memories of how<br />
a margin call ruined the Hunt brothers’<br />
attempts <strong>to</strong> corner the silver market in<br />
1980. With little hard information available,<br />
the chatter between traders ranges<br />
from speculative <strong>to</strong> spooked.<br />
Even experienced inves<strong>to</strong>rs are cautious.<br />
“Eight increases so far in one year—<br />
it sends the wrong signal, let’s put it that<br />
way,” said Kevin Kerr of Kerr Trading, an<br />
inves<strong>to</strong>r with 20 years of futures trading<br />
experience. “When any of these margins<br />
increase, we’re talking about significant<br />
amounts of money. People have <strong>to</strong> liquidate,<br />
<strong>and</strong> traders see the liquidation.”<br />
With “increased volatility” the only official<br />
reason given for the changes, the<br />
opportunity for whispered rumormongering<br />
increases. One of the biggest rumors<br />
is that the CME, due <strong>to</strong> increased pressure<br />
from the U.S. Commodity Futures Trading<br />
Commission (CFTC) <strong>and</strong> members of<br />
Congress, is trying <strong>to</strong> flush out specula<strong>to</strong>rs<br />
from fragile commodities markets. Many<br />
point <strong>to</strong> this scenario in gasoline—in early<br />
May, CME increased margins on the fuel<br />
<strong>by</strong> 48 percent, <strong>and</strong> shortly afterward,<br />
gasoline prices dropped significantly. The<br />
rapid change in the market, according <strong>to</strong><br />
some, comes from the CME pricing out<br />
speculative traders.<br />
“I think there is some truth that the<br />
specula<strong>to</strong>rs in funds <strong>and</strong> new products<br />
are driving a lot of volume that was never<br />
here before,” said Kerr. But he also underst<strong>and</strong>s<br />
the exchange’s position, <strong>to</strong> a<br />
point. “I think CME is saying, ‘Yes, we’re<br />
raising the margins, because we want <strong>to</strong><br />
protect those people. We want <strong>to</strong> protect<br />
the integrity of the exchange.’”<br />
“We’re not trying <strong>to</strong> send the market<br />
any messages with our chang- 13<br />
6 ETFR • July 2011
YOU CAN’T FORCE A ROUND INVESTMENT<br />
INTO A SQUARE STRATEGY.<br />
Some people think it takes dog years <strong>to</strong><br />
find an investment that fits their strategy.<br />
So they wind up settling for whatever is<br />
“close enough.”<br />
At State Street, we believe precision is an<br />
inves<strong>to</strong>r’s best friend. With over 100 SPDR ®<br />
Exchange Traded Funds, we’re sure <strong>to</strong> have<br />
an investment that precisely matches your<br />
investment strategy.<br />
Interested in Emerging Markets? Fixed<br />
Income? Dividends? Whatever the market<br />
segment, you’ll get exactly what’s on the<br />
label. Nothing more. Nothing less.<br />
If you’re tired of barking up the wrong tree,<br />
scan the QR code with your smartphone or<br />
visit spdrs.com for details.<br />
Before investing, consider the funds’ investment objectives, risks, charges<br />
<strong>and</strong> expenses. To obtain a prospectus or summary prospectus, which contains<br />
this <strong>and</strong> other information, call 1.866.787.2257 or visit www.spdrs.com.<br />
Read it carefully.<br />
<strong>ETFs</strong> trade like s<strong>to</strong>cks, fl uctuate in market value <strong>and</strong> may trade at prices above or below the <strong>ETFs</strong> net asset value. Brokerage commissions <strong>and</strong> ETF expenses will<br />
reduce returns.<br />
The SPDR S&P 500 ® ETF Trust, SPDR S&P MidCap 400 ® ETF Trust <strong>and</strong> the SPDR Dow Jones Industrial Average ETF Trust are all unit investment trusts <strong>and</strong> issue<br />
shares intended <strong>to</strong> track performance of their respective benchmark indices.<br />
“SPDR,” S&P, S&P 500 <strong>and</strong> S&P MidCap 400 are registered trademarks of St<strong>and</strong>ard & Poor’s Financial Services, LLC (“S&P”) <strong>and</strong> have been licensed for use <strong>by</strong> State Street<br />
Corporation. No fi nancial product offered <strong>by</strong> State Street or its affi liates is sponsored, endorsed, sold or promoted <strong>by</strong> S&P.<br />
Distribu<strong>to</strong>r: State Street Global Markets, LLC, member FINRA, SIPC, a wholly owned subsidiary of State Street Corporation. References <strong>to</strong> State Street may include State Street Corporation<br />
<strong>and</strong> its affi liates. Certain State Street affi liates provide services <strong>and</strong> receive fees from the SPDR <strong>ETFs</strong>. ALPS Distribu<strong>to</strong>rs, Inc., a registered broker-dealer, is distribu<strong>to</strong>r for SPDR S&P 500 ETF<br />
Trust, SPDR S&P MidCap 400 ETF Trust <strong>and</strong> SPDR Dow Jones Industrial Average ETF Trust, all unit investment trusts <strong>and</strong> the Select Sec<strong>to</strong>r SPDRs Trust.<br />
IBG-3345
Why I Own: VIG<br />
Vanguard Dividend<br />
Appreciation ETF<br />
Name: Ben Tobias<br />
Title: President<br />
Firm: Tobias Financial Advisors<br />
Founded: 1980<br />
Location: Florida<br />
AUM: $180 million<br />
All <strong>ETFs</strong>? No<br />
ETFR: What is your favorite ETF at the<br />
moment?<br />
Tobias: Well, I’ll give you a choice: DLN<br />
[WisdomTree LargeCap Dividend Fund]<br />
or VIG [Vanguard Dividend Appreciation<br />
ETF]. They’re both very similar, <strong>and</strong><br />
they select s<strong>to</strong>cks based on dividends.<br />
ETFR: What made you decide <strong>to</strong> buy<br />
in<strong>to</strong> VIG?<br />
Tobias: Basically, I’ve always thought<br />
that value is more appropriate for the<br />
kind of portfolios that we run than<br />
growth; there’s just a little bit less volatility.<br />
Moreover, our client base has a<br />
lot of preretirees <strong>and</strong> retirees, <strong>and</strong> income<br />
is a little bit more important than<br />
just capital gains. In the long run, I truly<br />
believe that value performs better than<br />
growth, <strong>and</strong> that the dividend yield is<br />
a large component of that. This is especially<br />
so in the case of VIG in terms<br />
of dividend increases: With VIG, the<br />
actual dollar amount of the dividend<br />
increases, but the percentage of the<br />
value doesn’t necessarily go up. Plus,<br />
over the long run, you can do a little<br />
bit better with a little bit less volatility.<br />
And as with most <strong>ETFs</strong> that we use,<br />
we like <strong>to</strong> use low expense ratios.<br />
ETFR: How does VIG help you overweight<br />
value?<br />
Tobias: Actually, these funds <strong>and</strong> the<br />
DFAs [Dimensional Fund Advisors] are<br />
almost all of our portfolios. You know,<br />
that’s most of where we go in. My<br />
background is in certified public accounting,<br />
<strong>and</strong> since those days, I’ve<br />
always been partial <strong>to</strong> the companies<br />
that have shown consistent growth in<br />
dividends. I feel that that’s a good corporate<br />
responsibility that every company<br />
should have. And I think the results<br />
speak for themselves over time.<br />
We do a lot of rebalancing. Rebalancing<br />
with <strong>ETFs</strong> makes life a little bit<br />
easier as far as doing the trades, <strong>and</strong><br />
sometimes setting prices, <strong>and</strong> things<br />
along those lines. Also—though hopefully<br />
we don’t have this for a while—<br />
the similarities <strong>and</strong> differences between<br />
these two <strong>ETFs</strong> mean that in the event<br />
that the market takes large swings, we<br />
could use these <strong>to</strong> book losses, <strong>and</strong> harvest<br />
tax losses in accounts where that is<br />
appropriate.<br />
ETFR: Looking at these two funds, DLN<br />
has a distribution yield of 2.43 percent—higher<br />
than VIG’s 2.13 percent—<br />
but the Vanguard product is much<br />
cheaper at only 18 basis points.<br />
Tobias: Yes, the pricing of the Vanguard<br />
fund is magnificent.<br />
Vanguard Dividend Appreciation<br />
Equity: U.S. - High Dividend Yield<br />
Issuer: Vanguard<br />
Legal Structure: 1940s Act<br />
Expense Ratio: 0.18%<br />
AUM: $6,317.15 billion<br />
ADV (60-Day): 685,000<br />
Avg. Spread: 0.03%<br />
Competing Funds:<br />
DLN, DVY, SDY, PEY<br />
Data as of: 06/08/11<br />
Source: Bloomberg<br />
June 7, 2010 – June 7, 2011<br />
ETFR: What is it that makes you have a<br />
preference for one over the other? And<br />
does that preference change over time<br />
as you’re holding the product?<br />
Tobias: It’s like, “What comes first, the<br />
chicken or the egg?” I’m not sure which<br />
one of their core principles works better.<br />
DLN is more dividend weighted,<br />
<strong>and</strong> VIG is more based on increasing<br />
dividends. There’s a little bit of a fundamental<br />
difference between the two<br />
of those, <strong>and</strong> honestly, I can’t decide.<br />
I’ve looked at the data for both, <strong>and</strong> I<br />
can’t decide which one I would prefer<br />
<strong>to</strong> be in, if I had <strong>to</strong> choose one or the<br />
other. I like them both.<br />
ETFR: Is the focus on these two dividend<br />
funds a new thing for you? There’s a lot<br />
of chatter in the headlines right now<br />
about dividends. Is this an area you’re<br />
focusing on now, or have you been here<br />
all along?<br />
Tobias: I’ll say we’ve been here all<br />
along, as far as focusing on dividends<br />
on the large-value side. VIG is a very<br />
new fund for us, though.<br />
Even though we’ve got well over 40<br />
percent of our overall portfolios in <strong>ETFs</strong>,<br />
I have stayed away from the smaller<br />
ones, the sec<strong>to</strong>rs ones, <strong>and</strong> things like<br />
that. I’m not comfortable with them.<br />
And again, I think it’s my background<br />
as an audi<strong>to</strong>r. The smaller you get, the<br />
more issues you can have, <strong>and</strong> I don’t<br />
like surprises.<br />
ETFR: Do the sizes of these two products fac<strong>to</strong>r<br />
in<strong>to</strong> why you decided <strong>to</strong> go with them?<br />
Tobias: They’re large enough; I’m not<br />
necessarily looking for funds the size of<br />
IVV [iShares S&P 500 Index Fund] all<br />
the time. <br />
J J A S O N D J F M A M J<br />
2010<br />
2011<br />
24.39%<br />
8 ETFR • July 2011
Rethinking Float<br />
By Gene Koyfman<br />
Consider two countries: China <strong>and</strong><br />
Switzerl<strong>and</strong>.<br />
China is huge. It occupies nearly 10<br />
million square kilometers, has 1.3 billion<br />
people <strong>and</strong> has the second-largest<br />
economy in the world.<br />
Switzerl<strong>and</strong>, <strong>by</strong> contrast, is tiny. It occupies<br />
just 41,000 square kilometers, has<br />
fewer than 8 million citizens <strong>and</strong> has an<br />
economy one-tenth the size of China.<br />
Yet inves<strong>to</strong>rs in broad-based global<br />
s<strong>to</strong>ck funds like the iShares MSCI All-Country<br />
World Index ETF (NYSEArca: ACWI) currently<br />
put 43 percent more money <strong>to</strong> work<br />
in Switzerl<strong>and</strong> than they do in China.<br />
It’s not just Switzerl<strong>and</strong>. Despite its<br />
size, China occupies just 2.33 percent of<br />
the most popular global index, <strong>and</strong> ranks<br />
ninth on the list of country allocations,<br />
below France, Australia <strong>and</strong> Germany.<br />
The reason has nothing <strong>to</strong> do with<br />
the size of its s<strong>to</strong>ck market. Depending<br />
on which day you check, China has either<br />
the second- or third-largest s<strong>to</strong>ck<br />
market in the world, accounting for<br />
nearly 7 percent of <strong>to</strong>tal global market<br />
cap. But because of the rules indexers<br />
use <strong>to</strong> create their benchmarks, that 7<br />
percent weight gets chopped down <strong>to</strong><br />
the aforementioned 2.33 percent.<br />
That rule—called free-float adjustment—gets<br />
ignored <strong>by</strong> many inves<strong>to</strong>rs<br />
as the wonky inner workings of index<br />
geeks. But with a 4 percent-plus swing<br />
in China at stake <strong>and</strong> larger swings in<br />
other countries—it pays <strong>to</strong> underst<strong>and</strong><br />
what’s going on, <strong>and</strong> why.<br />
How Free-Float<br />
Adjustment Works<br />
Fans of passive strategies will tell you the<br />
best way <strong>to</strong> invest is <strong>to</strong> simply own the<br />
market. The ideal approach, they say, is <strong>to</strong><br />
own an equity stake in each company in<br />
the proportion of its value in the market.<br />
Suppose, for instance, that there<br />
were only two companies in the world:<br />
BIG Co. <strong>and</strong> SMALL Inc. BIG’s s<strong>to</strong>ck<br />
trades at $10 per share with 900 shares<br />
outst<strong>and</strong>ing, while SMALL’s s<strong>to</strong>ck<br />
trades at $5 per share with 200 shares<br />
outst<strong>and</strong>ing. BIG is worth $9,000, <strong>and</strong><br />
SMALL is worth $1,000, meaning the<br />
two s<strong>to</strong>cks represent 90 <strong>and</strong> 10 percent<br />
of the market, respectively. An inves<strong>to</strong>r<br />
looking <strong>to</strong> own the entire market would<br />
put 90 percent of his money in<strong>to</strong> BIG<br />
Figure 1<br />
Float Criteria By Index Provider<br />
FLOAT RESTRICTED BY FTSE MSCI R<strong>US</strong>SELL S&P<br />
Block ownership Yes Yes<br />
Capital Controls<br />
Controlling<br />
shareholdings<br />
Source: Index providers<br />
Yes<br />
Yes Yes Yes<br />
Cross-holdings Yes Yes Yes Yes<br />
ESOP Yes Yes Yes Yes<br />
FDI or joint<br />
venture holdings<br />
Governmental holdings Yes Yes Yes Yes<br />
Insider holdings Yes Yes Yes Yes<br />
IPO lockups<br />
Restricted shares Yes Yes Yes Yes<br />
Strategic holdings Yes Yes<br />
Foreign holdings restrictions Yes Yes Yes Yes<br />
Treasury shares Yes Yes Yes<br />
Yes<br />
Yes<br />
ETFR • July 2011 9
Figure 2<br />
The Float Effect<br />
COUNTRY<br />
UNADJ<strong>US</strong>TED<br />
MKT CAP<br />
United States 29.6% 42.3% 41.3%<br />
Japan 7.0% 7.7% 7.2%<br />
China 6.9% 2.3% 2.5%<br />
United Kingdom 6.6% 8.4% 8.2%<br />
Hong Kong 4.8% 1.3% 1.4%<br />
Canada 4.1% 4.6% 4.1%<br />
France 3.6% 3.9% 4.5%<br />
India 2.8% 1.0% 1.3%<br />
Brazil 2.8% 1.9% 2.3%<br />
Germany 3.1% 3.4% 3.5%<br />
Australia 2.7% 3.4% 3.4%<br />
Switzerl<strong>and</strong> 2.5% 3.3% 3.0%<br />
Source: Bloomberg. Data as of June 13, 2011.<br />
<strong>and</strong> 10 percent in<strong>to</strong> SMALL.<br />
That’s the way the first market-capweighted<br />
indexes were built.<br />
But during the 1980s <strong>and</strong> 1990s, as<br />
money started <strong>to</strong> flow in<strong>to</strong> passive index<br />
strategies, indexers realized something:<br />
This perfect representation of<br />
the market wouldn’t work in the long<br />
run because the market <strong>and</strong> s<strong>to</strong>ck ownership<br />
structures are complex.<br />
Specifically, while a company like BIG<br />
may have had 900 shares outst<strong>and</strong>ing,<br />
not all of those are actually available<br />
for sale. Some are held <strong>by</strong> corporate<br />
insiders who can’t sell due <strong>to</strong> lockup<br />
requirements; others are held <strong>by</strong> other<br />
companies who won’t sell because it’s a<br />
strategic investment. Let’s imagine, for<br />
the sake of argument, that only 10 percent<br />
of the shares are available—just 90<br />
shares, worth $900. What happens if an<br />
inves<strong>to</strong>r wants <strong>to</strong> put $2,000 <strong>to</strong> work in<br />
this index? There’s nowhere for it <strong>to</strong> go.<br />
As Lori Richards, Benchmark Business<br />
managing direc<strong>to</strong>r at Russell Investments,<br />
explained, “Indexes should<br />
be representative of the opportunity<br />
set available <strong>to</strong> managers.”<br />
ISHARES ACWI<br />
VANGUARD<br />
TOTAL WORLD<br />
David Blitzer, managing direc<strong>to</strong>r<br />
<strong>and</strong> chairman of the Index Committee<br />
at S&P Indices, pointed out that “the<br />
index should be the same as if you calculated<br />
a portfolio representing all the<br />
shares <strong>and</strong> all the s<strong>to</strong>cks in the market.<br />
And if the founder of some company<br />
wasn’t going <strong>to</strong> sell his shares no matter<br />
what happened, then his shares aren’t<br />
really in the market, so they ought <strong>to</strong><br />
be adjusted out.”<br />
Blitzer explained, “If I included a<br />
U.S. company with a 12 percent float<br />
in the S&P 500 [at full weight], <strong>and</strong> the<br />
indexers followed suit, all the shares<br />
would be owned <strong>by</strong> the indexers.” The<br />
share prices would be bid up <strong>by</strong> inves<strong>to</strong>rs,<br />
dis<strong>to</strong>rting <strong>and</strong> overstating the actual<br />
value of the s<strong>to</strong>ck.<br />
Going back <strong>to</strong> our theoretical example,<br />
if 800 shares of BIG’s s<strong>to</strong>ck are<br />
locked up due <strong>to</strong> legal restrictions, only<br />
100 shares are truly available for trading.<br />
Because an indexer adjusting for<br />
float only considers the shares available<br />
for trading when building a benchmark,<br />
the resulting weightings in the index<br />
would be 50 percent BIG <strong>and</strong> 50 percent<br />
SMALL, dramatically different from<br />
what the unadjusted weightings would<br />
be. And any money invested in the index<br />
would stream in cleanly <strong>and</strong> efficiently.<br />
According <strong>to</strong> Blitzer, “The S&P 500<br />
traditionally was not float adjusted.”<br />
However, the index excluded entirely<br />
any s<strong>to</strong>ck that does not have 50 percent<br />
in public float, there<strong>by</strong> reducing<br />
liquidity concerns.<br />
Essentially, no indexes were adjusted<br />
for float until fairly recently. In 1984, Russell<br />
Indexes launched the Russell 1000<br />
<strong>and</strong> Russell 2000 indexes, the first U.S.<br />
indexes float adjusted from inception. A<br />
few years later, in 1989, the predecessor<br />
<strong>to</strong> what is currently the S&P Global Broad<br />
Market Index Family was launched; its<br />
methodology included rules for adjusting<br />
the float of the constituents <strong>and</strong><br />
made additional adjustments for restrictions<br />
on foreign holdings.<br />
That basically opened the floodgates,<br />
setting an industry st<strong>and</strong>ard for<br />
cap-weighted indexes that is followed<br />
<strong>by</strong> every major index provider.<br />
“[Float adjustment] has definitely<br />
become the industry st<strong>and</strong>ard practice.<br />
I don’t know of any cap-weighted index<br />
that’s not float adjusted,” Blitzer said.<br />
Differing Opinions<br />
But should it be st<strong>and</strong>ard practice?<br />
Little consensus exists about the<br />
different methods of float adjustment.<br />
Some adjustments address legal restrictions<br />
on the trading of shares such as<br />
IPO lockups <strong>and</strong> foreign holding restrictions.<br />
Other adjustments of a more<br />
subjective nature are made <strong>to</strong> take in<strong>to</strong><br />
account holdings <strong>by</strong> individuals or organizations<br />
that are not expected <strong>to</strong><br />
sell their stakes in the near future. According<br />
<strong>to</strong> Russell’s Richards, the three<br />
most important fac<strong>to</strong>rs are beneficial<br />
owners, such as officers or direc<strong>to</strong>rs of<br />
a company holding blocks of shares;<br />
cross-ownership, which occurs when<br />
companies own shares in other companies;<br />
<strong>and</strong> IPO lockups.<br />
Real-World Implications<br />
The decision whether or not <strong>to</strong> make<br />
float adjustments has far-reaching<br />
global implications for indexers. How-<br />
10 ETFR • July 2011
ever, these implications vary according<br />
<strong>to</strong> the market scenario.<br />
“[Float adjustment] is far more significant<br />
in emerging markets than in<br />
developed markets, <strong>and</strong> it is far more<br />
significant outside the U.S. than inside<br />
the U.S., <strong>and</strong> that’s just the way the<br />
world is at this point,” Blitzer noted.<br />
Adjusted or not, the United States, as<br />
the world’s largest economy, inevitably<br />
holds the largest country weighting in<br />
any global index. U.S. companies represent<br />
29.6 percent of the <strong>to</strong>tal world<br />
capitalization. By comparison, the<br />
iShares MSCI ACWI Index Fund (NasdaqGM:<br />
ACWI), which aims <strong>to</strong> track the<br />
float-adjusted MSCI All Country World<br />
Index, allocates a weighting of 42.3<br />
percent <strong>to</strong> the United States. As mentioned,<br />
China’s 6.9 percent market capitalization<br />
gets adjusted down sharply<br />
as well. Funds tracking FTSE <strong>and</strong> S&P<br />
indices show similar deviations.<br />
Kevin Carter, co-founder <strong>and</strong> head<br />
of index development at AlphaShares,<br />
takes a firm position against this very<br />
practice. “Float-adjustment fac<strong>to</strong>rs, in<br />
my mind, are bad from start <strong>to</strong> finish,”<br />
he said. “If there’s $60 billion of Petro-<br />
China, is there any manager that can’t<br />
get what he wants? I underst<strong>and</strong> the<br />
reason for it, but the reason has gone<br />
<strong>to</strong>o far. People apply it as a measure for<br />
something it’s <strong>to</strong>tally irrelevant <strong>to</strong>.”<br />
Adjusting Out The Float<br />
An inves<strong>to</strong>r wishing <strong>to</strong> forgo the float<br />
adjustment has <strong>to</strong> do the work <strong>to</strong> remove<br />
the adjustment from his portfolio.<br />
One way <strong>to</strong> do this is <strong>to</strong> adjust one’s<br />
country exposure, despite the fact that<br />
float adjustments are made at the company<br />
level. But upping one’s exposure<br />
<strong>to</strong> a country like China can lead <strong>to</strong> accusations<br />
of active management.<br />
“The problem is, [you] call it ‘overweight’<br />
<strong>and</strong> a flag goes up, <strong>and</strong> it sounds<br />
like you’re taking on risk. We talk <strong>to</strong> institutions<br />
<strong>and</strong> they say: ‘We have a huge<br />
bet in China: We have 3 percent in China.’<br />
And they’re serious. They’re thinking<br />
they’ve gone so far from their benchmark<br />
that they might get fired for it. It’s just<br />
preposterous,” Carter explained.<br />
Disregarding trading cost for a moment,<br />
an inves<strong>to</strong>r wishing <strong>to</strong> construct<br />
a portfolio that is not adjusted for float<br />
would accomplish this <strong>by</strong> purchasing<br />
the unadjusted proportions via an index<br />
fund or ETF tracking the country’s index.<br />
iShares has <strong>ETFs</strong> tracking almost every<br />
country in the world, there<strong>by</strong> allowing<br />
inves<strong>to</strong>rs the flexibility <strong>to</strong> achieve their<br />
desired country weightings. The math<br />
<strong>to</strong> get the proportion of assets <strong>to</strong> allocate<br />
<strong>to</strong> the two funds may require a little<br />
algebra, but not much else.<br />
At its core, the issue comes down <strong>to</strong><br />
intent <strong>and</strong> purpose.<br />
From an index provider’s perspective,<br />
a market-cap-weighted index, Richards<br />
noted, “You would always float-adjust.<br />
It is kind of irresponsible not <strong>to</strong>.” The<br />
adjustment fac<strong>to</strong>rs define the opportunity<br />
set available if all inves<strong>to</strong>rs chose <strong>to</strong><br />
index <strong>and</strong> managers needed <strong>to</strong> go in<strong>to</strong><br />
the market <strong>to</strong> procure shares in quantities<br />
not readily available.<br />
However, from the perspective of an<br />
individual inves<strong>to</strong>r who wishes <strong>to</strong> passively<br />
own the market in its entirety,<br />
adjusting for float adds tilts that dis<strong>to</strong>rt<br />
the proportions of the global market’s<br />
full value. Thus it falls on the individual<br />
<strong>to</strong> adjust his holdings <strong>to</strong> counterbalance<br />
the adjustments embedded in the<br />
index methodologies. <br />
Why advertise in the Journal of Indexes?<br />
JOURNAL OF INDEXES ADVERTISING INFORMATION<br />
AT WWW.JOURNALOFINDEXES.COM/ADVERTISE<br />
Index Publications LLC, 353 Sacramen<strong>to</strong> St., Suite 1520, San Francisco, CA 94111 • Advertising <strong>and</strong> Reprints Inquiries: 415.659.9004<br />
ETFR • July 2011 11
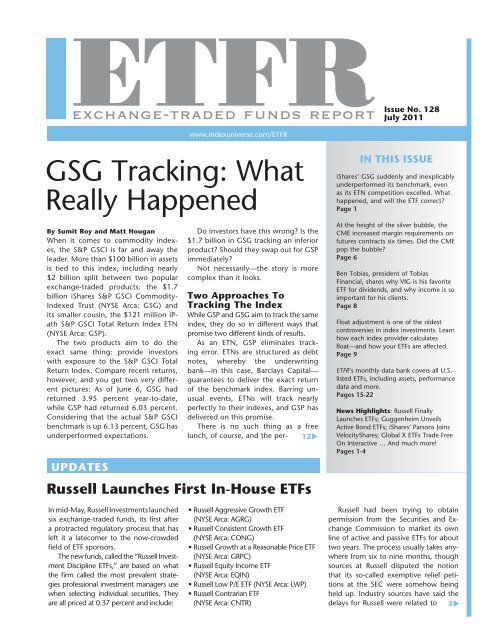
GSG Tracking from page 1<br />
Figure 1<br />
GSG His<strong>to</strong>rical Performance Compared<br />
PERIOD<br />
S&P GSCI TOTAL<br />
RETURN INDEX<br />
RETURN<br />
ISHARES S&P GSCI<br />
COMMODITY-<br />
INDEXED TR<strong>US</strong>T<br />
(GSG) RETURN<br />
IPATH S&P GSCI<br />
TOTAL RETURN<br />
INDEX ETN (GSP)<br />
RETURN<br />
GSG VS.<br />
BENCHMARK<br />
GSP VS.<br />
BENCHMARK<br />
2006 -18.79% -18.79% -19.11% 0.00% -0.32%<br />
2007 32.67% 31.45% 31.99% -1.22% -0.68%<br />
2008 -46.49% -47.47% -47.74% -0.98% -1.26%<br />
2009 13.49% 15.12% 13.17% 1.64% -0.31%<br />
2010 9.03% 7.83% 8.59% -1.19% -0.44%<br />
2011 YTD 6.13% 3.95% 6.03% -2.18% -0.10%<br />
Since<br />
Inception<br />
-23.56% -27.54% -26.56% -3.97% -3.00%<br />
Sources: Issuers, Bloomberg. Data as of June 6, 2011<br />
fect tracking of GSP comes with an important<br />
caveat: counterparty risk. As a<br />
debt note, GSP is fully susceptible <strong>to</strong> a<br />
default <strong>by</strong> Barclays. In the event that<br />
Barclays defaults, GSP inves<strong>to</strong>rs will<br />
face substantial losses. The worst-case<br />
scenario is something akin <strong>to</strong> the failure<br />
of Lehman Brothers in 2008, which<br />
essentially wiped out inves<strong>to</strong>rs in three<br />
ETNs issued <strong>by</strong> that company.<br />
GSG doesn’t share that counterparty<br />
risk; it is structured as a trust. That means<br />
it actually purchases <strong>and</strong> holds assets designed<br />
<strong>to</strong> provide exposure <strong>to</strong> the S&P<br />
GSCI. Shareholders in the fund have a<br />
pro rata stake in those underlying holdings,<br />
<strong>and</strong> no default <strong>by</strong> iShares’ parent<br />
company BlackRock can take that away.<br />
GSG is a bit unusual in that, unlike<br />
most commodity <strong>ETFs</strong>, it purchases a specific<br />
type of futures contract traded on<br />
the Chicago Mercantile Exchange called<br />
commodity excess return futures, or<br />
CERFs. Unlike traditional futures contracts,<br />
CERFs are designed <strong>to</strong> provide long-term<br />
exposure <strong>to</strong> a given asset class. The CME<br />
has listed two CERF contracts since 2006,<br />
which have had durations of five years<br />
<strong>and</strong> three <strong>and</strong> a half years, respectively.<br />
That contrasts with typical futures contracts<br />
that expire monthly or quarterly.<br />
There are a number of potential reasons<br />
why iShares chose CERFs rather<br />
than traditional futures contracts <strong>to</strong><br />
underlie the GSG product. The first<br />
is transaction costs: By having <strong>to</strong> roll<br />
over its contracts less frequently, GSG<br />
should reap savings—at least in theory.<br />
That’s offset <strong>by</strong> the fact that the CERFs<br />
GSG holds are relatively illiquid. iShares<br />
dominates the market for CERFs, holding<br />
more than 88 percent of the current<br />
open interest.<br />
The Source Of Recent<br />
Tracking Error<br />
One obvious question is whether the<br />
use of CERFs—as opposed <strong>to</strong> traditional<br />
(<strong>and</strong> more liquid) futures contracts—<br />
has increased the likelihood of negative<br />
tracking error for GSG.<br />
A look at the annual returns for GSG<br />
suggests otherwise. In 2009, for instance,<br />
GSG actually outperformed its<br />
benchmark <strong>by</strong> 1.64 percent. That move<br />
came after two years of underperformance,<br />
which may indicate that the<br />
fund’s tracking error is mean-reverting.<br />
The long-term track record backs that<br />
up. Since inception in 2006, GSG has returned<br />
-27.54 percent, just 3.97 percent<br />
below the benchmark return. That is very<br />
close <strong>to</strong> the 3.70 underperformance that<br />
would be expected based solely on the<br />
0.75 percent annual expense ratio compounded<br />
over five years.<br />
While it’s impossible <strong>to</strong> say exactly<br />
what caused GSG’s recent underperformance,<br />
there are two leading theories—both<br />
of which, curiously, actually<br />
augur well for the fund.<br />
The first is that 2011 was the firstever<br />
roll <strong>by</strong> GSG. With the starting<br />
round of contracts expiring, iShares<br />
had <strong>to</strong> roll the entire portfolio in<strong>to</strong> new<br />
contracts. This could theoretically have<br />
led <strong>to</strong> slippage.<br />
There’s no exact way <strong>to</strong> test this,<br />
however, <strong>and</strong> the previous variability<br />
of tracking performance says that this<br />
is unlikely <strong>to</strong> be the true driver of the<br />
returns difference. If it were, inves<strong>to</strong>rs<br />
would not have <strong>to</strong> worry about it again<br />
until the spring of 2014, when the next<br />
wave of CERFs expire.<br />
The second <strong>and</strong> more likely explanation<br />
is futures mispricing, where<strong>by</strong><br />
GSG’s underlying holdings—the CME<br />
CERFs—trade away from their intrinsic<br />
value. Futures contracts are designed<br />
<strong>to</strong> converge with spot returns <strong>by</strong> expiration;<br />
prior <strong>to</strong> expiration, they may<br />
temporarily trade away from “fair value.”<br />
Under this scenario, the vacillating<br />
tracking performance would be driven<br />
<strong>by</strong> movements above <strong>and</strong> below fair<br />
value for the underlying contracts.<br />
This would cause the tracking error <strong>to</strong><br />
be roughly mean-reverting—after all, the<br />
CERFs must revert <strong>to</strong> fair value <strong>by</strong> their<br />
expiration in March 2014. If they underperformed<br />
this year, then one might ex-<br />
12 ETFR • July 2011
pect them <strong>to</strong> reverse course in ensuing<br />
years. That roughly aligns with the variable<br />
annual tracking performance we’ve<br />
seen since GSG’s launch in 2006, <strong>and</strong><br />
would suggest that periods of underperformance<br />
will eventually be matched <strong>by</strong><br />
periods of outperformance.<br />
GSG Vs. GSP<br />
In short, we can expect <strong>to</strong> see the different<br />
tracking experiences continue.<br />
While this year’s 2.18 percent underperformance<br />
is concerning, his<strong>to</strong>ry suggests<br />
that much of that may be reversed<br />
in the future. This is especially true in<br />
light of GSG’s extremely solid tracking<br />
performance since the trust’s inception.<br />
Rival GSP—the ETN—has had more<br />
consistent performance, staying tighter<br />
with the underlying index. Over the long<br />
haul, it has generated slightly superior<br />
performance for inves<strong>to</strong>rs, with a 3 percent<br />
underperformance over the same<br />
period compared <strong>to</strong> GSG’s 3.97 percent.<br />
For many inves<strong>to</strong>rs, the tigher<br />
tracking performance of GSP must be<br />
weighed against its greater credit risk<br />
<strong>and</strong> inferior liquidity, with the latter<br />
point being perhaps the most important<br />
consideration. <br />
Hidden In The Margins from page 6<br />
es,” CME’s McCormick confirmed. “The<br />
goal is never <strong>to</strong> affect the price or send<br />
a message. The goal is simply <strong>to</strong> ensure<br />
that the clearinghouse has enough assets<br />
on h<strong>and</strong> <strong>to</strong> cover the volatility we<br />
see in the market.”<br />
Sound And Fury<br />
Even if the goal is not <strong>to</strong> move the market,<br />
can the CME inadvertently push commodities<br />
prices around? In the case of silver, the<br />
argument that margin increases popped<br />
the bubble looks profoundly weak.<br />
Based on margin data provided <strong>by</strong> the<br />
CME, it’s clear that the margin increases<br />
didn’t ramp up until the price of silver<br />
had already peaked on April 29. At that<br />
point, with the price of silver at $48.60<br />
per troy ounce, the amount of collateral<br />
required <strong>to</strong> purchase a contract was at 6<br />
percent of the <strong>to</strong>tal contract value. The<br />
CME clearing group further increased initial<br />
<strong>and</strong> maintenance margins three more<br />
times, but at this point silver prices were<br />
already tumbling back down <strong>to</strong> Earth.<br />
According <strong>to</strong> this data, not only did the<br />
clearinghouse not manipulate the market,<br />
it was slow <strong>to</strong> act as prices escalated. Only<br />
when the bubble burst, on May 3 through<br />
May 9, did the clearinghouse start making<br />
bold hikes in margin percentage. At that<br />
point, the fall in price had led <strong>to</strong> extreme<br />
amounts of volatility in the market.<br />
“You can probably conclude that the<br />
price of silver was rising <strong>and</strong> the CME was<br />
playing catch-up. What you can’t conclude<br />
from any of this is that their margin<br />
changes are the approximate cause of the<br />
price changes,” said John Hyl<strong>and</strong>, founder<br />
of U.S. Commodities Indexes. “The<br />
notional value of a contract was going<br />
down, but the volatility was going up; so<br />
Figure 1<br />
Margins Of Error<br />
$50<br />
$45<br />
$40<br />
$35<br />
$30<br />
$25<br />
$20<br />
Oct Nov Dec Jan Feb Mar Apr May<br />
2010 2011<br />
■ Silver Price (troy ounce)<br />
Sources: CME Group, Bloomberg<br />
● Margin<br />
that could have been the catalyst there.”<br />
Even fac<strong>to</strong>ring in the lack of transparency,<br />
it’s hard <strong>to</strong> believe that the changes<br />
CME pushes can actually affect market<br />
prices—especially for those using <strong>ETFs</strong> for<br />
their commodities exposure. According<br />
<strong>to</strong> Hyl<strong>and</strong>, that’s one of the problems with<br />
margin conspiracy theories. “People say<br />
you’ll cause the price <strong>to</strong> fall. Well, why?<br />
What you’re doing is forcing out people<br />
who can’t post up more margins.”<br />
He points <strong>to</strong> highly leveraged investments<br />
as the only concerning point when<br />
it comes <strong>to</strong> margins: Instead of the entire<br />
6.3%<br />
5.7%<br />
FUND<br />
6.0%<br />
10.5%<br />
7.6%<br />
11.6%<br />
market shaking when margins increase<br />
<strong>by</strong> $600, it’s truly only the leveraged positions<br />
that get eroded <strong>by</strong> increases. “Any<br />
unlevered buyer is probably indifferent<br />
<strong>to</strong> what the margin is,” said Hyl<strong>and</strong>.<br />
Even with compelling evidence, the<br />
conspiracy theories are unlikely <strong>to</strong> die out.<br />
But as more inves<strong>to</strong>rs dip their collective<br />
<strong>to</strong>es in<strong>to</strong> the commodities asset class,<br />
converting fiction <strong>to</strong> fact will become<br />
ever-more important. “The justification of<br />
having margins is <strong>to</strong> protect the clearing<br />
process, pure <strong>and</strong> simple,” said Hyl<strong>and</strong>.<br />
“It’s not <strong>to</strong> manipulate the price.” <br />
ETFR • July 2011 13
ETF Analytics<br />
How Do You Find the Right ETF?<br />
In 2010, the most popular China ETF was also the worst-performing China<br />
fund on the market. A lesser-known competi<strong>to</strong>r beat it <strong>by</strong> nearly 8%.<br />
Two emerging markets <strong>ETFs</strong> track the exact same index, but one<br />
delivered a 3% higher return in 2010.<br />
ETF Analytics: The Complete ETF Research Solution<br />
Institutional-Caliber Research.<br />
Quant-Driven Process. Plain-English Analysis.<br />
} Easy <strong>to</strong> underst<strong>and</strong> rating system:<br />
Efficiency, Tradability, Fit<br />
} Reports <strong>and</strong> research on every U.S.-listed ETF <strong>and</strong> ETN.<br />
} Robust “segment” reports comparing <strong>ETFs</strong> in 300+<br />
different areas of the market; e.g., “Broad-Based<br />
China,” “Short-Term Treasurys.”<br />
} Quant-driven analysis backed <strong>by</strong> plain-English<br />
explanations, making it easy <strong>to</strong> convey the value<br />
<strong>to</strong> clients.<br />
} Hundreds of data points updated daily.<br />
} Proprietary data points on block-level liquidity, fund<br />
closure risk <strong>and</strong> more.<br />
} Industry-Leading ETF <strong>Class</strong>ification System.<br />
ETF Analytics rates, ranks <strong>and</strong> evaluates every ETF <strong>and</strong> ETN on<br />
the market. Our goal? Provide institutional-caliber ETF research<br />
that helps professional advisors answer the question:<br />
“What are the best <strong>ETFs</strong> for my clients?”<br />
Redefining how inves<strong>to</strong>rs approach the ETF market.<br />
To register for our beta release, contact Dan Benveniste at danb@indexuniverse.com or 415-659-9013.<br />
www.indexuniverse.com/analytics<br />
©2011 Index Publications, LLC, IndexUniverse ETF Analytics
July 2011 U.S.-<strong>Listed</strong> <strong>ETFs</strong> <strong>Sorted</strong> <strong>by</strong> <strong>Asset</strong> <strong>Class</strong> <strong>and</strong> <strong>Year</strong>-<strong>to</strong>-<strong>Date</strong> <strong>Return</strong><br />
Issue No. 128<br />
Fund Name Ticker Exp Ratio <strong>Asset</strong>s 3-Mo YTD 2010 2009 3-Yr 5-Yr Mkt Cap P/E Std Dev<br />
Alternatives<br />
PowerShares DB G10 Currency Harvest DBV 0.75 371.1 3.77 4.30 0.85 21.22 -2.59 - - - 14.92 -<br />
Cambria Global Tactical GTAA 0.99 173.3 0.48 3.55 - - - - 10,355 16.1 - -<br />
PowerShares S&P 500 BuyWrite PBP 0.75 119.0 1.78 3.49 4.89 24.00 -1.69 - 51,276 16.4 16.63 1.17<br />
iShares Diversie Alternatives ALT 0.95 129.5 0.81 3.00 1.62 - - - - - - -<br />
IQ Hee ulti-Stratey Tracer QAI 1.13 130.7 2.47 1.57 2.59 - - - 12,317 15.4 - 1.49<br />
iPath S&P 500 VIX i-Term utures T VXZ 0.89 765.2 -11.05 -24.25 -14.43 - - - - - - -<br />
iPath S&P 500 VIX Short-Term utures T VXX 0.89 1,274.5 -29.46 -43.39 -72.40 - - - - - - -<br />
WisomTree anae utures Stratey WDTI 0.95 124.5 0.73 - - - - - - - - -<br />
<strong>Asset</strong> Allocation<br />
PowerShares C Income Comosite PC 1.62 233.3 4.62 7.28 - - - - 42,746 15.3 - 8.34<br />
iShares S&P Growth Allocation AOR 0.32 109.4 2.40 5.52 11.14 18.99 - - 19,670 16.6 - 1.85<br />
Commodities<br />
TS Physical Silver SIVR 0.30 688.0 13.57 24.77 82.16 - - - - - - -<br />
iShares Silver SLV 0.50 12,347.2 13.56 24.59 82.48 47.67 31.14 24.39 - - 41.36 -<br />
PowerShares DB Silver DBS 0.75 201.5 13.83 23.96 81.16 47.07 30.02 - - - 41.52 -<br />
Unite States Gasoline UGA 0.90 141.6 7.41 20.20 15.11 87.97 -6.72 - - - 42.98 -<br />
Teucrium Corn COR 1.71 131.3 3.64 16.12 - - - - - - - -<br />
PowerShares DB nery DB 0.75 235.3 3.07 14.88 2.63 30.36 -13.95 - - - 32.90 -<br />
TS Physical Precious etal Baset Shares GLTR 0.60 240.5 9.48 13.27 - - - - - - - -<br />
iPath Dow Jones-UBS Precious etals T JJP 0.75 141.7 9.98 11.20 41.91 28.42 - - - - - -<br />
PowerShares DB Precious etals DBP 0.75 539.4 9.70 10.90 37.56 26.58 20.88 - - - 24.29 -<br />
PowerShares DB Commoity Tracin DBC 0.85 6,298.3 1.78 9.80 11.90 16.19 -8.80 4.82 - - 26.81 -<br />
PowerShares DB Oil DBO 0.75 627.0 2.37 8.87 2.36 42.92 -13.27 - - - 35.33 -<br />
Unite States 12 onth Oil <strong>US</strong>L 0.96 234.0 3.48 8.52 6.52 35.36 -14.60 - - - 33.81 -<br />
iPath Dow Jones-UBS Coee T JO 0.75 128.3 -4.50 8.15 65.37 14.76 - - - - - -<br />
iPath S&P GSCI T GSP 0.75 124.2 0.95 8.00 8.36 15.25 -18.75 - - - 32.02 -<br />
TS Physical Swiss Gol SGOL 0.39 1,381.2 8.69 7.90 29.23 - - - - - - -<br />
SPDR Gol GLD 0.40 59,788.8 8.70 7.87 29.27 24.03 19.61 18.43 - - 20.97 -<br />
iShares Gol Trust IAU 0.25 6,795.0 8.70 7.84 29.46 23.90 19.67 18.48 - - 20.88 -<br />
PowerShares DB Gol DGL 0.75 258.7 8.39 7.38 27.89 22.03 18.07 - - - 20.97 -<br />
LTS Roers International Commoity T RJI 0.75 928.9 -0.51 6.60 17.86 26.45 -8.22 - - - 27.60 -<br />
iShares S&P GSCI Commoity GSG 0.75 1,729.0 0.50 6.36 7.17 11.22 -18.86 - - - 31.46 -<br />
GreenHaven Continuous Commoity GCC 0.85 767.2 -1.22 5.92 25.19 20.07 1.13 - - - 21.52 -<br />
Unite States Commoity <strong>US</strong>CI 1.24 473.0 -4.61 4.82 - - - - - - - -<br />
iPath S&P GSCI Crue Oil T OIL 0.75 639.9 3.56 4.53 -1.04 11.22 -29.49 - - - 41.64 -<br />
UBS -TRACS CCI T UCI 0.65 157.2 -1.60 4.24 18.61 40.58 -3.05 - - - 26.82 -<br />
Unite States Oil <strong>US</strong>O 0.80 1,576.8 3.34 3.85 -0.71 18.67 -26.75 -9.77 - - 39.15 -<br />
TS Physical Platinum PPLT 0.60 788.5 1.22 3.15 - - - - - - - -<br />
iPath Dow Jones-UBS Commoity T DJP 0.75 3,212.7 - 2.46 16.23 20.09 -8.41 - - - 24.21 -<br />
iPath Dow Jones UBS Grains T JJG 0.75 303.4 -1.38 2.20 29.85 -1.86 -4.14 - - - 32.74 -<br />
PowerShares DB Ariculture DBA 0.75 3,273.0 -6.41 1.17 22.35 0.99 -1.96 - - - 23.26 -<br />
LTS RICI Ariculture T RJA 0.75 655.3 -6.07 1.12 35.01 6.29 -0.49 - - - 26.62 -<br />
iPath Dow Jones UBS Ariculture T JJA 0.75 269.0 -4.11 1.11 38.40 13.17 3.08 - - - 28.22 -<br />
iPath Dow Jones-UBS atural Gas T GAZ 0.75 119.3 11.71 0.75 -43.63 -51.15 -51.82 - - - 38.05 -<br />
Unite States atural Gas UG 1.11 2,042.4 9.37 -1.61 -40.56 -56.50 -52.68 - - - 37.20 -<br />
PowerShares DB Base etals DBB 0.75 604.0 -5.33 -1.76 8.58 88.92 0.86 - - - 30.10 -<br />
TS Physical Pallaium PALL 0.60 785.9 -3.12 -3.63 - - - - - - - -<br />
iPath Dow Jones-UBS Coer T JJC 0.75 210.0 -7.48 -6.51 29.04 133.55 2.66 - - - 36.69 -<br />
Currency<br />
CurrencyShares Swiss ranc X 0.40 731.2 8.82 9.25 10.54 2.21 6.73 - - - 15.00 -<br />
CurrencyShares Sweish rona XS 0.40 136.9 2.69 8.62 6.96 9.01 -0.33 - - - 17.52 0.42<br />
WisomTree Dreyus Brailian Real BZ 0.45 176.7 6.96 8.29 12.46 34.01 9.40 - - - 18.87 -<br />
CurrencyShares uro X 0.40 365.3 4.36 7.76 -6.87 2.53 -2.01 3.95 - - 15.42 0.03<br />
CurrencyShares Australian Dollar XA 0.40 839.3 5.88 6.08 17.87 29.29 7.49 - - - 19.68 3.40<br />
PowerShares DB <strong>US</strong> Dollar Bearish UD 0.75 171.9 3.17 5.79 -1.60 5.19 -0.45 - - - 11.59 -<br />
WisomTree Dreyus Commoity Currency CCX 0.55 146.1 4.73 5.49 - - - - - - - -<br />
CurrencyShares British Poun Sterlin XB 0.40 139.0 1.12 4.91 -3.33 10.62 -5.58 - - - 12.46 -<br />
CurrencyShares Canaian Dollar XC 0.40 867.4 0.31 3.19 4.96 15.24 1.03 - - - 13.20 0.06<br />
WisomTree Dreyus merin Currency CW 0.55 583.6 3.48 2.70 6.40 - - - - - - -<br />
WisomTree Dreyus Chinese uan CB 0.45 668.4 0.43 0.43 1.21 1.20 1.14 - - - 2.80 -<br />
CurrencyShares Jaanese en X 0.40 176.2 0.26 -0.57 14.20 -3.16 8.55 - - - 11.32 -<br />
Inverse<br />
VelocityShares Daily Inverse VIX Short Term T XIV 1.35 117.9 33.46 57.40 - - - - - - - -<br />
iPath U.S. Treasury lattener T LAT 0.75 128.7 6.01 4.82 - - - - - - - -<br />
ProShares UltraShort en CS 0.95 368.4 -1.83 -0.83 -26.43 -2.52 - - - - - -<br />
ProShares Short SCI merin arets U 0.95 220.7 -7.08 -4.04 -20.92 -50.67 -22.26 - - - 26.48 -<br />
ProShares Short 20 ear Treasury TB 0.95 996.2 -6.12 -5.79 -12.39 - - - - - - -<br />
ProShares UltraShort inancials S 0.95 308.0 6.05 -5.97 -35.33 -76.48 -48.85 - - - 65.65 -<br />
Yield<br />
Data as of 05/31/2011. Source: Morningstar. Exp Ratio is annual expense ratio. <strong>Asset</strong>s are net assets in $<strong>US</strong> millions. 3-Mo is 3-month <strong>to</strong>tal return. YTD is year-<strong>to</strong>-date. 3- <strong>and</strong> 5-year<br />
returns are annualized. Mkt Cap is geometric average market capitalization. P/E is price-<strong>to</strong>-earnings ratio. Std Dev is 3-year st<strong>and</strong>ard deviation. Yield is 12-month. Includes all<br />
U.S.-listed <strong>ETFs</strong> <strong>and</strong> ETNs with assets over $100 million.<br />
ETFR • July 2011 15
July 2011 U.S.-<strong>Listed</strong> <strong>ETFs</strong> <strong>Sorted</strong> <strong>by</strong> <strong>Asset</strong> <strong>Class</strong> <strong>and</strong> <strong>Year</strong>-<strong>to</strong>-<strong>Date</strong> <strong>Return</strong><br />
Issue No. 128<br />
Fund Name Ticker Exp Ratio <strong>Asset</strong>s 3-Mo YTD 2010 2009 3-Yr 5-Yr Mkt Cap P/E Std Dev<br />
Inverse (Continued)<br />
PowerShares DB <strong>US</strong> Dollar Bullish UUP 0.75 1,139.8 -3.40 -6.04 -1.60 -6.52 -1.83 - - - 12.05 -<br />
ProShares Short SCI A Z 0.95 103.8 -2.06 -7.77 -14.24 -30.36 -9.21 - - - 25.87 -<br />
ProShares Short S&P 500 SH 0.92 1,501.1 -2.28 -7.94 -16.59 -27.02 -9.17 - - - 20.62 -<br />
ProShares Short QQQ PSQ 0.95 234.6 -1.94 -7.99 -20.61 -40.20 -14.16 - - - 23.02 -<br />
ProShares UltraShort 7-10 ear Treasur PST 0.95 464.3 -8.58 -8.60 -21.51 2.43 -18.70 - - - 16.12 -<br />
ProShares UltraShort SCI merin arets V 0.95 118.2 -14.18 -8.96 -41.82 -79.25 -54.25 - - - 49.50 -<br />
ProShares Short Dow30 DOG 0.95 231.3 -3.89 -9.63 -15.29 -23.66 -9.76 - - - 19.34 -<br />
ProShares Short Russell 2000 RW 0.95 398.3 -4.44 -9.79 -27.39 -32.86 -18.17 - - - 26.14 -<br />
ProShares UltraShort 20 ear Treasur TBT 0.95 5,771.8 -11.85 -10.45 -25.74 32.20 -22.95 - - - 33.31 -<br />
Direion Dail inancial Bear 3 AZ 1.15 613.8 9.00 -11.07 -51.36 -94.56 - - - - - -<br />
ProShares UltraShort Basic aterials S 0.95 105.0 -7.25 -13.62 -54.68 -78.16 -42.15 - - - 61.31 -<br />
PowerShares DB Crue Oil Doule Short T DTO 0.75 223.2 -12.99 -15.42 -20.26 -54.19 - - - - - -<br />
ProShares UltraShort S&P 500 SDS 0.90 2,034.9 -4.78 -15.48 -32.21 -50.59 -24.16 - - - 38.94 -<br />
ProShares UltraShort QQQ QID 0.95 693.7 -4.02 -15.75 -38.90 -66.80 -32.59 - - - 43.61 -<br />
ProShares UltraShort uro UO 0.95 502.4 -9.42 -15.76 8.61 -12.04 - - - - - -<br />
ProShares UltraShort TSXinhua China 25 XP 0.95 173.7 -16.17 -15.89 -28.30 -76.27 -57.77 - - - 53.42 -<br />
Direion Dail 30-ear Treasur Bear 3 TV 1.14 480.8 -18.01 -16.04 -36.69 - - - - - - -<br />
ProShares UltraShort DJ-UBS Crue Oil SCO 0.95 132.3 -13.77 -16.50 -25.49 -56.89 - - - - - -<br />
ProShares UltraShort Dow 30 DXD 0.95 339.3 -7.76 -18.45 -29.76 -44.98 -24.05 - - - 36.60 -<br />
ProShares UltraShort Russell 2000 TW 0.95 443.2 -9.25 -19.55 -50.14 -60.27 -40.90 - - - 49.92 -<br />
ProShares UltraPro Short S&P 500 SPXU 0.95 301.5 -7.54 -22.87 -46.51 - - - - - - -<br />
Direion Dail Lare Ca Bear 3 BGZ 1.02 170.5 -8.60 -24.17 -48.74 -70.71 - - - - - -<br />
ProShares UltraShort Real state SRS 0.95 173.3 -10.53 -25.08 -51.63 -85.21 -67.34 - - - 70.52 -<br />
ProShares UltraShort Oil & Gas DUG 0.95 115.2 0.11 -26.08 -41.26 -49.12 -36.95 - - - 44.83 -<br />
Direion Dail Small Ca Bear 3 TZA 1.15 539.2 -14.47 -29.17 -68.34 -79.41 - - - - - -<br />
ProShares UltraShort Silver ZSL 0.95 524.7 -47.59 -59.04 -79.50 -72.65 - - - - - -<br />
Leveraged<br />
Direion Dail Real state Bull 3 DR 1.03 121.4 14.78 42.80 63.51 - - - - - - 0.48<br />
Direion Dail ner Bull 3 RX 1.03 416.3 -8.57 35.40 48.96 14.71 - - - - - 0.06<br />
ProShares Ultra Silver AGQ 0.95 1,146.2 11.24 30.65 182.44 78.25 - - - - - -<br />
ProShares Ultra Real state UR 0.95 562.1 8.31 26.49 48.36 12.10 -27.55 - - - 72.20 0.65<br />
ProShares Ultra Oil & Gas DIG 0.95 383.5 -5.23 25.37 33.69 20.59 -20.22 - - - 52.20 0.37<br />
Direion Dail Lare Ca Bull 3 BGU 1.18 241.6 4.34 22.80 39.81 65.15 - - - - - 0.18<br />
Direion Dail Small Ca Bull 3 TA 1.03 756.1 7.42 22.73 69.81 42.94 - - - - - -<br />
ProShares UltraPro S&P 500 UPRO 0.95 283.2 3.62 21.90 36.37 - - - - - - 0.12<br />
ProShares Ultra iCa 400 VV 0.95 166.9 7.14 20.70 52.88 68.15 -1.41 - - - 50.99 0.01<br />
ProShares UltraPro QQQ TQQQ 0.95 132.3 1.46 19.60 - - - - - - - -<br />
ProShares Ultra Dow30 DD 0.95 340.1 6.07 18.97 25.37 39.71 -3.76 - - - 40.62 0.46<br />
ProShares Ultra Russell 2000 UW 0.95 279.5 5.70 16.33 50.63 42.89 -3.57 - - - 54.53 0.01<br />
ProShares Ultra S&P 500 SSO 0.92 1,678.2 2.82 14.72 26.86 47.27 -8.40 - - - 44.40 0.61<br />
Direion Dail Semiconuc<strong>to</strong>r Bull 3X SOXL 1.03 111.7 -14.97 14.52 - - - - 14,109 13.8 - 0.01<br />
ProShares Ultra Gol UGL 0.95 283.4 16.80 14.42 58.28 41.39 - - - - - -<br />
PowerShares DB Gol Doule Lon T DGP 0.75 603.9 17.08 13.84 62.37 46.16 32.58 - - - 42.39 -<br />
ProShares Ultra QQQ QLD 0.95 768.9 1.34 13.53 36.90 121.20 0.73 - - - 50.16 -<br />
ProShares Ultra Technolo RO 0.95 127.6 -3.85 7.53 19.91 146.38 -1.23 - - - 50.71 -<br />
ProShares Ultra Basic aterials U 0.95 350.2 2.86 7.21 57.39 126.82 -18.87 - - - 69.50 0.06<br />
Direion Dail Technolo Bull 3 TH 2.25 199.7 -8.58 6.81 21.28 240.15 - - - - - -<br />
PowerShares DB Ariculture Doule Lon T DAG 0.75 132.7 -6.31 3.48 30.88 5.70 -11.66 - - - 54.58 -<br />
Direion Dail inancial Bull 3 AS 1.02 1,706.0 -13.25 1.35 13.02 -41.44 - - - - - -<br />
ProShares Ultra inancials UG 0.95 1,192.0 -7.93 1.31 18.04 -5.50 -38.42 - - - 66.08 0.07<br />
ProShares Ultra DJ-UBS Crue Oil UCO 0.95 322.5 2.37 0.62 -1.46 -7.38 - - - - - -<br />
Direion Dail merin arets Bull 3 DC 1.01 439.2 11.18 -3.17 24.29 206.32 - - - - - 0.50<br />
U.S. Equity<br />
iShares Dow Jones U.S. Healthcare Proviers IH 0.47 323.3 9.94 22.47 11.47 35.44 9.02 6.44 10,654 13.4 26.73 0.16<br />
PowerShares S&P SmallCa Health Care PSCH 0.29 211.9 16.18 21.85 - - - - 1,382 21.3 - 0.22<br />
irst Trust Consumer Stales AlhaDX XG 0.70 135.5 13.22 20.14 19.75 27.47 12.31 - 10,855 14.9 18.60 0.87<br />
SPDR S&P Biotech XBI 0.35 646.8 20.25 19.28 17.60 0.36 8.40 11.25 3,063 - 26.20 -<br />
irst Trust Health Care AlhaDX XH 0.70 327.9 10.64 18.18 19.01 51.22 17.37 - 9,283 15.8 21.05 0.10<br />
PowerShares Dnamic Small Ca Growth PWT 0.39 163.1 10.48 17.61 27.31 17.50 5.26 2.10 1,447 24.6 24.65 -<br />
PowerShares S&P SmallCa ner PSC 0.29 123.8 0.33 17.17 - - - - 1,582 22.1 - 1.06<br />
iShares asa Biotechnolo IBB 0.48 1,654.9 15.50 17.06 14.84 15.17 11.52 8.56 5,858 19.4 22.63 0.47<br />
iShares Dow Jones U.S. eical Devices IHI 0.47 484.8 7.88 16.70 11.35 38.49 5.66 7.76 8,316 21.0 24.93 0.06<br />
SPDR S&P Oil & Gas loration & Prouction XOP 0.35 1,023.9 -0.78 16.03 28.58 40.16 -1.29 - 4,717 21.2 34.33 0.81<br />
iShares Cohen & Steers Realt aors IC 0.35 2,723.4 6.24 15.86 29.14 25.54 0.61 3.05 10,382 41.5 41.44 2.53<br />
Vanuar Health Care VHT 0.24 808.5 11.01 15.79 5.60 21.81 7.57 6.36 24,648 16.7 18.56 1.50<br />
iShares Dow Jones U.S. Healthcare IH 0.48 687.7 10.89 15.34 4.13 20.96 6.83 5.98 34,666 17.3 18.31 1.41<br />
iShares Dow Jones U.S. Pharmaceuticals IH 0.47 224.3 14.54 15.19 12.72 30.06 14.97 10.21 14,892 17.7 19.14 1.23<br />
Health Care Select SPDR XLV 0.20 3,841.5 11.02 15.14 3.32 19.49 6.10 5.43 46,513 17.1 17.92 1.70<br />
SPDR Dow Jones RIT RWR 0.25 1,593.0 5.76 14.51 28.03 28.24 2.03 3.49 7,513 41.6 40.36 2.71<br />
SPDR S&P Oil & Gas uiment & Services XS 0.35 524.6 -1.36 14.45 30.12 67.80 -3.68 - 3,945 22.5 39.70 0.73<br />
Yield<br />
Data as of 05/31/2011. Source: Morningstar. Exp Ratio is annual expense ratio. <strong>Asset</strong>s are net assets in $<strong>US</strong> millions. 3-Mo is 3-month <strong>to</strong>tal return. YTD is year-<strong>to</strong>-date. 3- <strong>and</strong> 5-year<br />
returns are annualized. Mkt Cap is geometric average market capitalization. P/E is price-<strong>to</strong>-earnings ratio. Std Dev is 3-year st<strong>and</strong>ard deviation. Yield is 12-month. Includes all<br />
U.S.-listed <strong>ETFs</strong> <strong>and</strong> ETNs with assets over $100 million.<br />
16 ETFR • July 2011
July 2011 U.S.-<strong>Listed</strong> <strong>ETFs</strong> <strong>Sorted</strong> <strong>by</strong> <strong>Asset</strong> <strong>Class</strong> <strong>and</strong> <strong>Year</strong>-<strong>to</strong>-<strong>Date</strong> <strong>Return</strong><br />
Issue No. 128<br />
Fund Name Ticker Exp Ratio <strong>Asset</strong>s 3-Mo YTD 2010 2009 3-Yr 5-Yr Mkt Cap P/E Std Dev<br />
U.S. Equity (Continued)<br />
PXI 0.65 175.3 1.08 14.37 39.56 42.19 0.70 - 6,483 17.7 31.71 0.50<br />
0.48 122.4 5.80 14.08 30.81 20.73 5.74 - 5,526 42.1 32.63 2.74<br />
0.12 9,634.5 5.45 14.00 28.43 30.07 3.34 4.50 6,237 44.8 39.61 3.08<br />
0.35 696.3 7.52 13.99 34.84 60.81 15.62 12.96 3,864 19.3 27.32 0.07<br />
0.60 278.0 15.20 13.78 36.94 45.05 24.24 - 5,673 21.1 29.61 -<br />
0.60 615.5 -0.53 13.67 12.23 50.06 -8.18 - 12,715 17.7 37.39 0.22<br />
PowerShares Dynamic Oil & Gas Services PXJ 0.63 258.2 -0.84 13.65 29.18 52.86 -7.95 3.97 5,803 23.0 40.56 0.31<br />
0.63 102.2 -2.20 13.57 39.97 19.88 -3.09 8.71 8,408 17.3 32.22 0.46<br />
IJT 0.25 2,176.7 8.33 13.49 28.24 28.78 7.46 6.58 1,288 20.4 26.22 0.75<br />
0.47 648.2 -2.65 13.43 31.77 63.64 -4.52 6.07 15,059 23.8 39.85 0.39<br />
Pharmaceutical HOLDRS PPH - 464.2 10.96 13.41 1.67 20.47 6.85 5.48 89,527 18.4 17.29 -<br />
0.20 9,776.0 -1.51 13.34 21.81 21.81 -1.89 8.41 60,305 15.8 26.67 1.36<br />
0.48 1,087.0 -1.86 13.31 19.00 19.28 -2.33 8.37 65,240 15.2 25.53 1.16<br />
0.24 2,071.0 -1.57 13.28 21.05 25.54 -1.87 8.42 50,302 17.0 27.29 1.10<br />
0.70 183.3 -0.70 13.23 27.63 46.57 -4.52 - 11,994 17.9 38.20 0.48<br />
0.25 185.6 8.33 13.21 30.21 47.12 9.17 8.02 1,291 20.4 29.29 0.35<br />
0.47 3,720.5 4.54 13.17 26.60 30.46 1.69 2.87 7,718 24.3 38.04 3.17<br />
SPDR S&P Pharmaceuticals XPH 0.35 268.2 13.36 13.06 22.47 27.60 18.68 - 7,394 17.6 20.04 0.69<br />
0.65 104.0 6.79 12.91 28.34 47.59 3.10 - 4,260 17.0 32.18 2.10<br />
0.48 558.6 -0.81 12.44 18.65 41.06 -3.67 9.01 17,025 23.4 33.24 0.41<br />
0.12 3,228.7 4.83 12.35 30.95 42.79 7.97 7.69 1,674 21.9 28.11 0.42<br />
0.25 3,524.3 5.54 12.26 30.44 41.11 7.30 8.65 4,108 20.4 25.28 0.53<br />
SPDR S&P Retail XRT 0.35 763.0 10.15 12.11 37.39 77.29 19.64 - 3,682 18.5 32.22 0.93<br />
PDP 0.70 453.1 5.40 12.08 26.59 28.03 -0.70 - 9,002 20.2 25.97 0.21<br />
RPV 0.35 120.3 4.18 12.01 22.53 53.44 6.72 3.69 10,265 13.7 37.19 1.12<br />
PBJ 0.63 265.1 10.27 11.90 29.97 10.95 8.18 8.10 7,641 18.9 17.16 1.02<br />
0.30 210.7 4.62 11.74 27.84 42.17 2.70 6.23 7,189 24.1 25.11 0.36<br />
VDC 0.24 743.8 10.04 11.35 14.62 16.55 7.94 9.29 42,023 15.7 15.11 2.33<br />
0.70 296.6 3.76 11.32 26.64 46.78 8.54 - 2,979 17.2 26.81 0.40<br />
IWP 0.25 3,536.3 4.98 11.30 26.03 46.47 4.30 6.36 7,816 21.0 25.82 0.79<br />
PBS 0.63 162.7 1.44 11.28 20.18 61.92 3.94 2.35 7,988 18.8 31.47 0.42<br />
0.70 616.2 6.69 11.27 32.01 57.11 11.22 - 7,520 17.9 33.44 0.40<br />
0.38 274.2 4.93 11.16 21.65 31.91 6.28 - 4,041 19.5 28.08 2.48<br />
0.25 11,203.2 4.30 11.14 26.26 37.52 5.73 6.73 3,662 20.4 25.14 0.85<br />
VOT 0.12 1,609.4 4.25 11.12 29.14 43.91 3.02 - 7,046 23.5 26.09 0.47<br />
IGV 0.48 655.6 6.18 11.11 24.64 47.53 7.86 11.46 12,916 26.6 24.62 -<br />
RPG 0.35 280.6 4.77 11.03 26.90 49.33 9.02 8.59 14,809 19.4 25.37 0.37<br />
0.60 499.2 4.78 10.99 17.83 50.31 4.73 - 12,844 14.5 27.93 4.52<br />
0.30 146.0 4.65 10.99 31.18 32.73 6.80 5.88 1,857 26.2 26.94 0.26<br />
iShares Russell 2000 Growth IWO 0.25 4,539.7 5.47 10.94 29.38 34.61 7.00 6.19 1,301 21.0 27.04 0.55<br />
0.60 162.9 6.47 10.87 26.79 48.69 10.60 - 4,326 14.4 29.24 0.56<br />
XLP 0.20 4,589.8 9.31 10.84 13.81 14.22 7.18 8.91 55,572 16.5 14.91 2.50<br />
- 492.8 0.43 10.79 18.52 61.55 4.95 2.38 22,047 12.7 29.42 -<br />
0.38 119.6 4.01 10.70 25.60 50.22 10.50 - 2,840 14.0 27.43 1.17<br />
VO 0.12 5,015.8 4.02 10.65 25.68 40.47 4.41 5.48 6,421 18.6 25.92 1.08<br />
VOX 0.24 420.8 9.82 10.62 19.52 29.45 4.61 6.52 20,820 17.3 21.20 2.63<br />
IJH 0.22 11,905.9 3.89 10.59 26.73 37.81 5.87 6.87 3,640 19.0 25.17 0.98<br />
0.38 389.5 6.62 10.57 21.44 25.57 4.77 - 22,427 16.6 24.86 3.22<br />
iShares Dow Jones Telecommunications 0.48 792.8 10.84 10.51 20.72 26.22 2.09 4.44 14,302 15.3 23.51 2.79<br />
0.70 186.8 3.54 10.47 18.69 40.43 5.83 - 15,036 12.4 27.88 1.15<br />
DHS 0.38 200.4 6.67 10.42 17.63 17.03 0.56 - 38,486 15.6 27.72 3.61<br />
Internet HOLDRS HHH - 124.8 5.32 10.32 24.35 82.50 11.96 8.48 44,978 31.5 30.37 -<br />
0.25 178.1 3.71 10.28 26.49 38.64 4.77 5.93 6,517 19.1 26.90 1.23<br />
IWR 0.20 6,555.3 4.11 10.17 25.31 40.70 4.17 5.70 7,531 18.1 26.05 1.42<br />
0.12 1,020.4 3.68 10.08 21.77 38.28 5.35 - 5,813 15.2 26.61 1.73<br />
0.16 1,429.8 3.48 10.05 27.62 37.90 5.78 6.14 2,329 19.3 26.85 0.91<br />
PWV 0.63 430.3 3.84 9.98 13.29 18.60 3.92 5.94 66,568 13.3 19.80 2.12<br />
0.60 100.3 4.14 9.91 20.78 58.82 6.67 7.28 15,898 19.5 27.47 0.47<br />
ITA 0.47 145.4 2.72 9.86 16.60 25.32 1.05 6.96 9,452 15.0 28.35 0.92<br />
0.48 366.7 8.12 9.86 18.99 23.32 7.72 8.04 36,968 15.8 18.30 2.01<br />
SCHA 0.13 554.1 3.33 9.83 28.62 - - - 1,585 17.7 - 0.95<br />
0.70 277.6 4.88 9.82 16.08 19.16 5.17 8.28 16,649 15.4 19.56 2.48<br />
VB 0.17 5,776.0 3.30 9.77 28.12 36.61 6.85 6.14 1,589 18.6 28.42 1.06<br />
RSP 0.40 3,341.6 3.33 9.76 21.39 44.59 5.33 5.23 14,133 16.9 26.86 1.30<br />
XSD 0.35 119.8 -1.63 9.74 15.71 98.99 8.93 4.55 3,148 17.8 33.25 0.66<br />
VPU 0.24 747.0 6.30 9.59 7.05 11.27 -1.53 5.46 9,732 13.9 16.46 3.56<br />
0.25 210.5 3.19 9.58 27.68 39.78 6.49 5.34 1,910 18.2 29.35 0.94<br />
0.40 6,378.6 6.25 9.50 17.79 11.15 1.78 0.87 10,814 14.9 23.10 3.24<br />
IJR 0.20 7,627.3 4.72 9.50 26.61 25.88 5.99 4.85 1,148 19.2 26.96 0.99<br />
iShares Dow Jones U.S. Utilities IDU 0.48 527.0 6.06 9.48 7.21 12.31 -2.41 4.86 11,301 14.6 16.73 3.52<br />
Oil Services HOLDRS OIH - 2,912.9 -6.55 9.47 20.42 62.71 -9.12 1.23 26,914 24.4 38.66 -<br />
IWS 0.25 3,456.1 3.35 9.38 24.43 33.31 3.87 4.52 7,280 16.1 27.16 1.89<br />
0.18 1,409.1 4.13 9.33 14.25 17.17 1.64 - 54,004 14.9 22.30 2.55<br />
Data as of 05/31/2011. Source: Morningstar. Exp Ratio is annual expense ratio. <strong>Asset</strong>s are net assets in $<strong>US</strong> millions. 3-Mo is 3-month <strong>to</strong>tal return. YTD is year-<strong>to</strong>-date. 3- <strong>and</strong> 5-year<br />
returns are annualized. Mkt Cap is geometric average market capitalization. P/E is price-<strong>to</strong>-earnings ratio. Std Dev is 3-year st<strong>and</strong>ard deviation. Yield is 12-month. Includes all<br />
U.S.-listed <strong>ETFs</strong> <strong>and</strong> ETNs with assets over $100 million.<br />
Yield<br />
ETFR • July 2011 17
July 2011 U.S.-<strong>Listed</strong> <strong>ETFs</strong> <strong>Sorted</strong> <strong>by</strong> <strong>Asset</strong> <strong>Class</strong> <strong>and</strong> <strong>Year</strong>-<strong>to</strong>-<strong>Date</strong> <strong>Return</strong><br />
Issue No. 128<br />
Fund Name Ticker Exp Ratio <strong>Asset</strong>s 3-Mo YTD 2010 2009 3-Yr 5-Yr Mkt Cap P/E Std Dev<br />
U.S. Equity (Continued)<br />
0.70 272.8 2.66 9.32 20.67 36.83 4.33 - 14,980 15.3 24.32 0.81<br />
0.54 155.5 2.54 9.32 23.21 51.87 8.03 - 3,218 16.2 28.75 0.52<br />
DIA 0.18 9,919.8 3.03 9.23 13.97 22.72 2.60 4.95 111,484 14.2 19.83 2.41<br />
0.45 192.1 5.87 9.20 16.20 13.38 4.01 0.91 41,794 14.5 25.88 3.43<br />
DTD 0.28 176.9 4.34 9.18 16.32 19.57 1.53 - 40,433 16.0 22.73 2.65<br />
0.28 762.8 4.20 9.15 14.98 17.31 0.67 - 63,809 15.6 21.94 2.52<br />
0.30 119.8 2.83 9.14 20.46 35.42 5.35 3.79 6,732 12.6 27.77 2.52<br />
IJJ 0.28 2,449.6 2.11 9.12 22.58 34.35 4.33 4.88 3,228 17.7 25.79 1.46<br />
iShares Dow Jones U.S. Consumer Services 0.48 217.4 4.27 9.11 23.26 32.63 7.76 5.01 23,854 18.3 23.61 0.96<br />
Utilities Select SPDR XLU 0.20 4,368.1 6.48 9.10 5.35 11.69 -2.44 5.03 15,059 14.1 16.76 3.86<br />
0.70 228.0 -0.72 9.07 26.64 66.79 7.31 - 7,679 15.7 29.69 0.02<br />
0.47 512.3 2.00 9.06 25.49 25.81 1.23 4.26 20,384 17.7 28.78 1.47<br />
0.70 117.6 0.89 9.02 28.27 14.19 -4.00 1.85 3,450 14.6 24.30 -<br />
0.95 115.0 2.17 8.96 14.17 - - - 30,340 15.1 - 0.64<br />
PWC 0.60 179.7 2.56 8.90 17.33 18.47 0.17 1.81 13,317 16.0 20.65 1.32<br />
XHB 0.35 864.2 6.07 8.88 17.40 27.60 0.01 -11.13 3,328 19.3 39.79 1.79<br />
PWJ 0.39 128.1 5.41 8.82 29.58 23.61 -0.08 5.91 7,245 25.9 24.10 0.25<br />
PIV 0.50 113.0 4.43 8.78 20.50 12.59 -5.02 -1.40 23,640 16.9 21.36 0.54<br />
PSCT 0.29 116.6 1.75 8.78 - - - - 1,018 21.1 - 0.19<br />
0.60 216.6 4.21 8.75 14.81 10.70 0.55 1.95 57,945 15.5 20.71 2.02<br />
iShares Russell 2000 0.28 16,059.7 3.33 8.65 26.90 28.53 5.81 4.66 1,158 17.8 27.22 1.05<br />
VTV 0.12 5,223.9 1.51 8.61 14.57 19.88 0.42 2.07 46,646 14.3 22.74 2.26<br />
0.70 637.9 3.74 8.59 28.28 59.45 4.16 - 6,061 16.6 36.96 1.48<br />
0.25 251.4 1.45 8.50 14.57 11.02 -1.73 0.64 77,451 12.2 20.72 2.38<br />
PXQ 0.63 171.1 -0.03 8.47 46.46 63.13 19.00 12.73 5,577 31.1 29.15 0.37<br />
Consumer Discretionary Select SPDR 0.20 2,382.1 2.94 8.45 27.49 40.52 9.61 5.35 27,331 18.1 27.20 1.37<br />
iShares Russell 3000 Growth IWZ 0.25 362.7 2.54 8.38 17.42 36.83 3.08 5.44 30,389 17.3 22.07 1.12<br />
XLI 0.20 4,202.7 2.10 8.37 27.85 22.00 1.32 4.24 34,566 17.4 28.83 1.69<br />
VCR 0.24 387.0 3.62 8.33 30.57 46.42 9.93 5.39 15,698 18.1 28.88 0.92<br />
SCHB 0.06 764.6 2.30 8.32 17.10 - - - 30,290 15.8 - 1.43<br />
VIG 0.18 6,477.5 3.26 8.30 14.76 19.56 3.63 4.85 42,457 16.1 18.48 1.93<br />
0.13 438.1 1.00 8.28 13.16 15.73 -0.53 - 72,946 14.1 22.47 2.22<br />
RWL 0.49 222.7 1.98 8.27 16.81 29.86 1.50 - 41,574 14.6 24.90 1.43<br />
PPA 0.66 101.3 1.26 8.24 10.59 23.04 -1.08 4.73 11,432 14.3 25.80 0.85<br />
iShares Russell 1000 Growth 0.20 13,945.4 2.15 8.21 16.48 36.73 2.83 5.38 40,916 17.1 21.80 1.23<br />
VTI 0.07 20,335.3 2.23 8.18 17.45 28.87 2.09 4.05 27,387 16.5 22.48 1.71<br />
iShares Russell 3000 IWV 0.21 3,424.0 2.16 8.18 16.82 28.29 1.65 3.64 28,288 15.9 22.72 1.54<br />
Telecom HOLDRS TTH - 127.8 8.95 8.16 16.38 7.05 -0.18 4.52 96,719 12.8 18.94 -<br />
iShares Dow Jones U.S. 0.20 631.9 2.09 8.11 16.50 28.25 1.63 3.81 32,913 15.7 22.24 1.54<br />
SCHV 0.13 240.1 1.87 8.11 14.86 - - - 55,559 13.5 - 2.23<br />
iShares Russell 1000 IWB 0.15 7,046.7 2.05 8.10 16.02 28.39 1.30 3.60 37,949 15.8 22.24 1.61<br />
0.65 111.1 2.51 8.06 33.03 14.91 0.86 - 4,810 19.2 28.06 0.64<br />
iShares S&P 1500 ISI 0.20 345.0 2.09 8.04 16.24 26.59 1.41 3.51 35,132 16.7 22.20 1.57<br />
VIS 0.24 568.1 1.60 8.02 27.32 22.05 0.58 3.82 19,751 19.0 29.60 1.21<br />
SCHX 0.08 620.0 2.08 8.01 15.92 - - - 41,823 15.6 - 1.51<br />
iShares Russell 1000 Value IWD 0.20 12,101.9 1.83 7.99 15.44 19.23 -0.45 1.56 35,155 14.6 23.21 1.90<br />
VV 0.12 3,232.8 2.03 7.98 15.93 27.36 1.38 3.86 41,311 16.3 21.99 1.69<br />
iShares S&P 500 Growth IVW 0.18 6,496.1 3.07 7.97 14.94 31.13 2.79 5.24 48,851 17.3 20.46 1.34<br />
0.50 142.7 -0.77 7.93 17.89 69.07 4.88 - 14,062 17.5 28.38 0.33<br />
iShares Russell 3000 Value IWW 0.26 338.9 2.01 7.88 15.76 19.66 -0.10 1.66 26,324 14.6 23.58 1.91<br />
0.70 138.8 1.92 7.87 23.62 28.83 1.95 - 14,595 20.5 23.01 0.49<br />
0.70 121.5 3.94 7.81 27.35 36.82 8.05 - 846 17.7 29.63 0.36<br />
0.47 714.6 7.84 7.72 26.74 18.93 2.16 4.67 10,447 23.4 27.88 1.07<br />
SPDR S&P 500 0.09 89,233.4 1.73 7.70 15.02 26.31 0.88 3.24 50,224 15.4 21.68 1.73<br />
iShares S&P 500 IVV 0.09 28,271.7 1.72 7.66 15.11 26.61 0.92 3.24 50,231 15.4 21.72 1.73<br />
VOO 0.06 1,301.8 1.73 7.60 - - - - 50,103 16.1 - -<br />
0.39 1,229.5 1.68 7.59 19.69 41.74 4.96 4.88 33,828 15.1 26.91 1.53<br />
SPDR 500 Growth 0.20 205.0 2.83 7.59 16.25 36.95 2.72 5.37 48,849 17.3 22.32 0.84<br />
0.60 775.3 3.99 7.58 36.72 79.07 13.79 - 9,227 31.1 28.08 0.10<br />
SCHG 0.13 335.5 2.15 7.57 16.85 - - - 31,070 18.6 - 0.66<br />
0.39 402.0 1.42 7.50 28.30 58.64 10.78 - 1,028 17.0 32.22 0.67<br />
PWB 0.61 194.9 3.32 7.45 13.74 34.61 -0.49 2.76 45,662 20.2 22.00 0.62<br />
VUG 0.12 5,933.5 2.62 7.43 17.23 36.08 2.48 5.52 36,511 19.0 21.84 1.10<br />
0.13 339.9 1.58 7.40 13.77 25.24 0.72 - 62,916 15.9 21.35 1.79<br />
iShares S&P 500 Value 0.18 4,599.4 0.35 7.38 14.97 20.90 -1.24 1.03 51,715 13.8 24.14 2.00<br />
0.20 198.1 1.76 7.34 17.34 27.89 1.61 3.78 31,008 15.8 22.81 1.49<br />
PowerShares QQQ QQQ 0.20 24,342.5 1.17 7.31 19.89 54.67 5.88 9.00 56,824 17.6 24.62 0.66<br />
0.35 5,873.0 3.25 7.25 16.42 19.04 5.72 4.00 13,051 16.5 23.30 3.15<br />
SPDR S&P 500 Value 0.20 176.4 0.22 7.13 15.53 17.03 -0.81 1.67 51,893 13.8 21.88 2.24<br />
0.20 317.8 2.00 7.08 12.68 21.09 1.37 4.08 66,555 16.0 21.37 1.71<br />
VBR 0.23 2,697.5 1.64 7.06 25.12 30.97 5.31 4.27 1,503 16.2 28.99 1.78<br />
SOXX 0.48 217.4 -3.95 7.06 14.32 74.92 1.98 0.47 13,780 13.2 32.65 1.05<br />
0.20 399.6 0.96 7.00 11.98 - - - 81,438 15.9 - 1.27<br />
Data as of 05/31/2011. Source: Morningstar. Exp Ratio is annual expense ratio. <strong>Asset</strong>s are net assets in $<strong>US</strong> millions. 3-Mo is 3-month <strong>to</strong>tal return. YTD is year-<strong>to</strong>-date. 3- <strong>and</strong> 5-year<br />
returns are annualized. Mkt Cap is geometric average market capitalization. P/E is price-<strong>to</strong>-earnings ratio. Std Dev is 3-year st<strong>and</strong>ard deviation. Yield is 12-month. Includes all<br />
U.S.-listed <strong>ETFs</strong> <strong>and</strong> ETNs with assets over $100 million.<br />
18 ETFR • July 2011<br />
Yield
July 2011 U.S.-<strong>Listed</strong> <strong>ETFs</strong> <strong>Sorted</strong> <strong>by</strong> <strong>Asset</strong> <strong>Class</strong> <strong>and</strong> <strong>Year</strong>-<strong>to</strong>-<strong>Date</strong> <strong>Return</strong><br />
Issue No. 128<br />
Fund Name Ticker Exp Ratio <strong>Asset</strong>s 3-Mo YTD 2010 2009 3-Yr 5-Yr Mkt Cap P/E Std Dev<br />
U.S. Equity (Continued)<br />
0.30 203.2 1.57 7.00 25.80 40.06 8.83 5.69 1,830 14.0 30.32 1.80<br />
IWX 0.20 244.7 0.85 6.84 10.59 - - - 75,264 14.0 - 1.87<br />
0.30 167.8 2.29 6.84 17.79 45.16 4.85 6.17 14,960 18.5 25.01 0.63<br />
RWJ 0.54 141.4 1.54 6.82 25.96 46.53 11.05 - 1,035 17.5 32.93 0.39<br />
0.13 528.5 2.20 6.65 14.53 35.01 2.09 - 54,014 18.3 21.22 1.19<br />
0.50 170.0 1.42 6.62 13.89 30.38 1.68 3.34 31,222 17.1 21.94 1.40<br />
0.60 626.6 -0.47 6.50 21.71 79.71 7.68 9.11 20,206 17.6 28.86 0.36<br />
iShares S&P 100 0.20 2,985.4 0.61 6.33 12.48 22.12 0.09 2.81 105,814 14.5 20.66 1.84<br />
iShares Russell 2000 Value 0.41 4,614.8 1.23 6.25 24.68 20.59 4.46 2.84 1,022 15.1 28.34 1.64<br />
0.63 222.1 10.54 6.25 31.47 21.91 8.82 7.52 3,485 20.1 24.70 -<br />
Biotech HOLDRS BBH - 247.1 4.75 6.19 2.15 11.49 8.50 3.96 30,375 15.2 20.97 -<br />
0.60 147.0 1.99 6.19 25.58 20.02 3.97 1.99 479 17.7 28.88 0.35<br />
DSI 0.50 157.0 1.89 6.09 11.42 30.73 1.56 - 35,719 16.2 22.19 1.28<br />
0.38 142.9 1.72 5.73 26.97 48.71 11.55 - 689 13.8 30.87 1.12<br />
0.48 450.0 -0.61 5.71 11.98 62.42 3.86 7.43 43,756 16.4 25.44 0.48<br />
XLG 0.20 401.9 0.12 5.66 9.32 20.30 -0.46 2.33 144,813 14.4 19.67 1.84<br />
VGT 0.24 1,912.6 -0.78 5.64 12.78 61.89 4.60 7.36 41,260 16.7 25.25 0.56<br />
IWC 0.71 526.0 2.03 5.59 29.55 23.72 3.48 0.28 332 15.3 29.12 0.78<br />
VAW 0.24 719.2 2.28 5.48 24.46 51.44 -0.56 8.35 12,404 20.4 31.03 2.07<br />
IJS 0.25 1,853.2 1.46 5.48 24.70 22.36 4.43 3.21 1,024 18.1 28.44 1.14<br />
0.20 7,875.4 -0.06 5.38 11.41 51.25 2.99 6.60 74,838 15.4 23.10 1.26<br />
0.25 379.4 0.32 5.24 12.57 43.94 0.33 3.84 60,641 19.1 22.58 0.72<br />
0.25 134.4 1.47 5.19 24.62 36.93 5.97 4.78 1,025 18.1 29.03 1.69<br />
0.70 121.8 -1.35 4.86 19.25 33.55 3.93 - 7,065 11.5 30.90 1.21<br />
PowerShares Water Resources PHO 0.64 1,219.2 1.07 4.79 13.27 18.01 -3.76 3.62 2,400 19.3 28.98 0.51<br />
0.47 1,054.9 2.18 4.61 31.02 64.37 -0.18 9.39 14,735 14.6 34.75 1.15<br />
0.35 1,102.0 0.30 4.50 34.15 88.12 -5.46 - 3,455 22.2 44.77 0.57<br />
0.47 1,520.4 -1.56 4.45 12.42 63.79 4.40 7.39 57,836 15.8 25.09 0.42<br />
Retail HOLDRS RTH - 159.8 4.24 4.45 15.55 26.78 6.21 4.35 45,856 16.7 21.14 -<br />
0.48 274.2 -7.25 4.12 24.30 60.57 2.74 2.31 8,244 21.2 33.89 0.08<br />
XLB 0.20 2,648.7 1.05 3.81 20.56 48.11 -1.01 7.05 20,593 15.6 29.75 3.09<br />
0.38 249.3 1.57 3.71 27.05 22.15 5.39 - 877 17.2 30.82 3.26<br />
0.85 184.8 -3.19 3.55 - - - - - - - 5.09<br />
0.50 223.1 -2.40 3.42 15.31 70.44 4.04 6.86 38,543 17.3 27.52 0.44<br />
0.60 209.3 2.52 3.29 20.92 3.64 -0.97 -4.87 4,803 15.9 31.30 3.93<br />
0.85 132.2 -3.76 2.89 - - - - - - - 3.75<br />
iShares Dow Jones U.S. Home Construction ITB 0.47 500.0 1.44 2.75 10.43 23.24 -6.73 -19.65 2,626 22.5 42.28 0.59<br />
0.85 2,665.1 -3.97 2.28 34.53 - - - - - - 4.99<br />
0.85 1,113.9 -2.06 2.25 - - - - 7,312 27.0 - -<br />
0.48 520.0 -3.80 1.27 12.20 16.86 -9.18 -9.15 25,262 13.3 33.99 1.07<br />
0.27 662.7 -4.04 1.07 14.83 14.32 -8.44 -8.49 22,132 14.3 34.13 1.31<br />
0.35 208.3 -4.53 1.04 26.08 27.92 -1.43 -1.79 12,901 12.5 39.05 1.63<br />
0.48 164.9 -1.99 0.77 16.49 11.31 -5.19 - 3,190 7.4 20.27 9.57<br />
0.20 7,361.2 -5.75 -0.44 11.91 17.50 -11.86 -11.38 43,838 12.4 36.93 1.02<br />
0.35 579.6 -2.75 -1.83 20.65 -21.93 -5.44 - 1,322 19.6 33.10 1.40<br />
0.48 236.5 -6.13 -2.13 7.71 16.11 -11.96 -12.34 40,036 12.8 36.28 0.47<br />
IAT 0.48 144.1 -4.11 -2.79 20.25 -10.92 -8.96 -10.87 9,468 14.8 33.86 1.18<br />
0.35 1,480.6 -5.68 -3.53 23.07 -1.82 -10.96 -11.97 24,367 12.4 41.31 0.59<br />
- 105.0 -7.27 -3.91 12.62 3.29 -8.83 -9.26 58,953 11.5 37.79 -<br />
PBW 0.70 479.7 -11.25 -8.08 -5.55 27.61 -24.79 -14.31 1,306 13.4 39.30 -<br />
SCHH 0.13 122.2 5.91 - - - - - 7,511 41.6 - -<br />
International Equity<br />
0.54 209.8 2.81 17.66 -18.61 32.89 -6.39 4.83 37,530 - 38.02 4.99<br />
iShares S&P Global Healthcare IXJ 0.48 562.4 11.71 15.78 1.87 17.54 5.80 4.59 55,113 16.95 19.23 1.91<br />
0.54 463.1 4.58 14.85 -2.38 27.12 -5.49 1.75 42,903 13.04 33.22 2.37<br />
0.61 299.6 12.07 14.41 - - - - 6,883 14.81 - 0.95<br />
0.57 509.7 10.80 14.17 - - - - 1,543 22.15 - -<br />
0.55 108.1 16.67 14.12 - - - - 1,828 18.10 - -<br />
0.54 144.9 0.70 13.80 -14.20 21.97 -12.88 -5.20 29,072 12.32 36.79 1.71<br />
0.53 3,808.6 4.42 13.41 8.31 20.31 -4.04 5.80 47,041 13.83 34.51 1.06<br />
0.29 180.1 1.92 13.31 -7.75 25.23 -7.43 1.25 64,022 11.70 34.51 3.07<br />
0.53 585.0 10.35 13.08 14.48 22.05 4.88 7.38 63,415 14.77 24.90 1.15<br />
0.54 930.2 3.19 12.96 -3.00 26.41 -7.87 1.24 38,644 13.11 34.44 2.33<br />
DTH 0.58 140.7 3.68 11.85 -0.99 33.11 -4.82 - 40,749 12.01 30.23 3.95<br />
0.53 670.4 9.04 11.62 36.11 55.00 6.35 9.74 21,913 13.18 36.25 1.59<br />
0.6 1,448.3 3.71 11.61 3.74 28.90 -4.26 2.24 48,180 12.04 29.89 2.25<br />
0.14 3,656.1 4.15 11.37 6.05 31.33 -3.89 2.73 41,955 13.26 30.16 4.24<br />
DOO 0.58 160.4 5.20 11.27 5.70 33.13 -3.83 - 29,564 12.34 30.98 3.86<br />
DWX 0.45 532.1 7.06 11.13 7.87 62.12 0.10 - 9,930 10.14 35.72 4.19<br />
IXC 0.48 1,400.2 -1.89 10.60 11.79 24.71 -3.51 6.57 81,188 13.38 25.92 1.66<br />
IDV 0.5 544.0 4.07 10.51 11.84 60.56 0.14 - 17,608 12.20 33.56 3.63<br />
0.48 367.3 10.20 10.45 13.16 21.72 6.58 - 57,499 14.24 17.37 2.11<br />
Data as of 05/31/2011. Source: Morningstar. Exp Ratio is annual expense ratio. <strong>Asset</strong>s are net assets in $<strong>US</strong> millions. 3-Mo is 3-month <strong>to</strong>tal return. YTD is year-<strong>to</strong>-date. 3- <strong>and</strong> 5-year<br />
returns are annualized. Mkt Cap is geometric average market capitalization. P/E is price-<strong>to</strong>-earnings ratio. Std Dev is 3-year st<strong>and</strong>ard deviation. Yield is 12-month. Includes all<br />
U.S.-listed <strong>ETFs</strong> <strong>and</strong> ETNs with assets over $100 million.<br />
Yield<br />
ETFR • July 2011 19
July 2011 U.S.-<strong>Listed</strong> <strong>ETFs</strong> <strong>Sorted</strong> <strong>by</strong> <strong>Asset</strong> <strong>Class</strong> <strong>and</strong> <strong>Year</strong>-<strong>to</strong>-<strong>Date</strong> <strong>Return</strong><br />
Issue No. 128<br />
Fund Name Ticker Exp Ratio <strong>Asset</strong>s 3-Mo YTD 2010 2009 3-Yr 5-Yr Mkt Cap P/E Std Dev<br />
International Equity (Continued)<br />
PowerShares Cleantech PZD 0.67 155.7 4.52 10.30 7.61 35.58 -7.07 - 4,191 20.71 34.27 0.02<br />
SPDR Dow Jones Global Real state RWO 0.5 311.4 4.99 10.21 24.01 32.04 -1.35 - 7,016 15.64 33.76 6.48<br />
irst Trust Dow Jones Global Select Diien GD 0.6 110.6 4.84 9.70 12.60 59.96 1.46 - 11,722 12.96 33.66 3.60<br />
Guenheim Canaian nery Income 0.7 229.6 -6.11 9.68 22.60 60.41 -7.10 - 6,371 27.63 39.41 2.34<br />
PowerShares Liste Priate uity PSP 0.6 481.0 3.16 9.40 25.90 30.22 -12.77 - 3,388 10.19 42.38 4.65<br />
aret Vec<strong>to</strong>rs Gamin BJ 0.65 140.2 8.07 9.26 37.88 36.20 -0.49 - 7,002 19.14 36.71 2.35<br />
iShares S&P Global Infrastructure IG 0.48 552.6 2.19 9.24 6.97 18.14 -4.03 - 13,866 14.02 25.72 3.40<br />
iShares SCI Inonesia IDO 0.61 191.1 15.58 9.11 - - - - 10,668 18.48 - 0.48<br />
WisomTree DA DW 0.48 473.8 2.84 8.96 5.19 27.12 -4.11 - 32,822 13.03 27.73 3.11<br />
WisomTree International LareCa Diien DOL 0.48 150.4 2.11 8.89 1.87 24.99 -4.61 - 64,079 12.59 27.96 3.22<br />
iShares SCI Russia Cae R<strong>US</strong> 0.65 128.9 -1.97 8.64 - - - - 59,741 11.08 - -<br />
Guenheim Timber CUT 0.7 228.4 0.40 8.48 18.19 50.20 2.39 - 3,764 12.40 39.36 2.65<br />
aret Vec<strong>to</strong>rs Inonesia IDX 0.6 545.6 15.28 8.34 41.77 - - - 9,526 17.15 - 0.88<br />
PowerShares Intl Diien Achieers PID 0.57 547.7 4.24 8.16 13.47 37.96 -2.57 3.42 27,109 12.92 28.52 2.81<br />
iShares SCI ousai TO 0.25 624.2 2.36 7.93 11.45 31.45 -1.05 - 43,798 15.32 24.32 1.91<br />
iShares S&P orth American atural Resources IG 0.48 2,312.0 -2.83 7.92 23.34 37.10 -2.28 7.58 35,869 16.90 29.84 1.42<br />
iShares SCI South orea W 0.61 5,068.6 13.69 7.88 29.58 71.72 4.81 8.87 19,336 - 42.36 0.67<br />
iShares S&P Global Telecommunications IXP 0.48 428.7 4.08 7.81 11.63 11.28 0.13 7.59 68,874 11.31 20.44 3.94<br />
iShares S&P Global 100 IOO 0.4 1,129.8 1.02 7.74 5.91 24.02 -1.32 2.76 109,958 12.20 23.78 2.04<br />
iShares SCI etherlans W 0.53 175.4 1.20 7.73 4.95 40.67 -5.62 3.21 20,458 13.67 33.57 1.42<br />
iShares SCI Unite inom WU 0.53 1,400.1 1.63 7.43 10.28 36.12 -3.03 1.31 56,258 13.36 27.22 2.27<br />
iShares S&P Global Inustrials XI 0.48 257.2 1.23 7.28 23.28 25.93 -0.60 - 27,785 17.21 29.04 1.38<br />
WisomTree International iCa Diien DI 0.58 152.3 2.34 7.21 11.31 33.99 -1.33 - 6,211 13.90 29.12 2.91<br />
Schwab International Small-Ca uity SCHC 0.35 176.4 4.31 7.13 - - - - 1,856 14.29 - 2.15<br />
PowerShares R De ts e-<strong>US</strong> Smi PX 0.75 288.3 0.24 7.13 6.81 36.02 -2.07 - 31,315 12.81 31.69 2.29<br />
Schwab International uity SCH 0.13 680.7 1.27 6.90 9.31 - - - 30,547 13.23 - 1.62<br />
iShares S&P Global Consumer Discretionary RXI 0.48 153.6 1.92 6.73 23.29 37.45 5.06 - 26,512 16.62 27.00 1.00<br />
iShares SCI A Value V 0.4 1,487.5 -1.24 6.68 4.59 28.28 -4.58 0.46 37,769 11.53 29.55 3.05<br />
Vanuar SCI A VA 0.12 6,864.9 0.74 6.67 8.33 27.52 -3.81 - 31,792 13.82 27.92 2.34<br />
WisomTree International Real state DRW 0.58 135.7 4.35 6.61 17.68 43.07 -3.01 - 6,004 9.38 32.61 8.88<br />
iShares SCI A A 0.35 40,597.0 0.83 6.60 8.25 26.88 -4.05 1.64 33,789 13.96 27.72 2.26<br />
Guenheim S&P Global Water CGW 0.65 249.7 6.24 6.50 15.02 31.54 -1.20 - 4,840 17.07 26.09 1.89<br />
SPDR S&P merin uroe GUR 0.59 278.8 0.38 6.38 15.70 78.98 -8.22 - 15,858 12.70 41.07 0.90<br />
Vanuar Total Worl S<strong>to</strong>c VT 0.25 986.4 1.92 6.38 13.07 32.66 - - 34,245 15.04 - 1.81<br />
SPDR Dow Jones International Real state RWX 0.59 2,240.4 3.65 6.34 21.83 36.34 -3.17 - 6,477 9.36 30.98 8.36<br />
aret Vec<strong>to</strong>rs RV Har <strong>Asset</strong>s Proucers HAP 0.59 253.6 -1.43 6.32 16.52 42.51 - - 33,897 15.51 - 0.76<br />
SPDR S&P China GXC 0.59 794.5 7.28 6.28 7.58 60.45 2.92 - 33,879 13.08 31.54 1.18<br />
iShares SCI A Growth G 0.4 1,469.7 2.82 6.20 13.11 24.15 -3.71 2.74 30,998 17.01 26.49 1.69<br />
Guenheim China All-Ca AO 0.7 100.7 7.33 6.19 8.81 - - - 30,898 13.35 - 0.98<br />
iShares SCI ACWI ACWI 0.35 1,882.7 1.89 6.17 12.82 32.31 -1.26 - 39,417 14.93 25.64 1.64<br />
iShares TS De Real state e-<strong>US</strong> IGL 0.48 426.0 3.11 6.13 14.57 42.86 -3.45 - 7,112 9.69 30.94 5.94<br />
iShares SCI Canaa WC 0.53 6,031.2 -2.29 6.13 19.80 53.07 -0.31 7.88 24,880 18.85 31.41 1.52<br />
iShares S&P merin arets Infrastructure I 0.75 149.0 8.80 6.07 18.66 - - - 9,234 15.31 - 2.48<br />
iShares SCI A Small Ca SCZ 0.4 1,661.7 2.99 6.06 21.51 42.78 0.01 - 1,632 14.98 29.99 2.70<br />
SPDR S&P Worl e-<strong>US</strong> GWL 0.34 147.3 1.07 5.66 11.29 28.63 -3.05 - 24,484 13.32 27.32 2.14<br />
Vanuar TS All-Worl e-<strong>US</strong> VU 0.22 7,691.6 1.88 5.51 11.80 37.61 -2.45 - 27,244 14.25 28.93 2.03<br />
iShares S&P Global Timber & orestry WOOD 0.48 285.6 -1.95 5.36 16.19 37.71 - - 4,936 13.23 - 2.35<br />
Guenheim International ulti-<strong>Asset</strong> Income HGI 0.89 101.9 2.42 5.32 12.14 50.10 -1.11 - 16,500 13.23 30.10 4.00<br />
Vanuar TS All-Worl e-<strong>US</strong> Small Ca VSS 0.33 1,038.8 4.31 5.31 25.59 - - - 1,481 14.47 - 2.08<br />
WisomTree merin arets uity Income D 0.63 1,591.6 8.23 5.29 24.67 58.07 8.15 - 10,562 12.59 28.26 3.13<br />
iShares TSXinhua China 25 XI 0.72 7,593.4 6.88 5.29 3.51 47.28 -2.07 14.86 88,716 11.23 31.39 1.38<br />
SPDR SCI ACWI e-<strong>US</strong> CWI 0.34 476.1 1.13 5.25 11.60 37.14 -2.06 - 33,393 12.93 28.70 2.21<br />
iShares SCI ACWI e <strong>US</strong> ACWX 0.35 974.8 1.20 5.06 10.44 36.28 -3.83 - 31,484 14.12 29.07 2.19<br />
iShares SCI Australia WA 0.53 3,396.9 2.34 5.03 15.35 67.90 1.23 9.80 34,356 15.55 34.70 3.12<br />
PowerShares DWA De t Technical Leaers PIZ 0.8 138.8 3.93 4.91 21.07 37.76 -2.68 - 11,456 16.26 30.72 0.41<br />
iShares SCI Thailan THD 0.62 697.3 9.77 4.89 56.76 81.30 13.57 - 6,441 - 37.04 2.32<br />
iShares SCI alaysia W 0.53 972.9 7.18 4.87 38.97 49.34 12.53 18.25 9,392 18.52 21.88 2.30<br />
SPDR DJ Global Titans DGT 0.5 153.1 -0.89 4.83 4.99 23.04 -3.33 0.71 59,536 13.42 21.77 2.13<br />
WisomTree International SmallCa Diien DLS 0.58 477.0 1.80 4.79 19.43 37.09 -1.28 - 1,198 13.26 29.23 2.59<br />
PowerShares Global Water PIO 0.75 380.2 4.70 4.55 11.24 39.02 -3.18 - 2,755 18.41 31.29 0.83<br />
iShares S&P Deeloe -<strong>US</strong>. Proerty WPS 0.48 156.2 1.99 4.48 18.13 37.27 -3.10 - 6,186 10.07 32.13 5.20<br />
iShares S&P Global Utilities JXI 0.48 260.2 -0.57 4.48 -1.79 6.22 -7.72 - 20,527 11.66 19.64 4.08<br />
iShares SCI Pacic e-Jaan PP 0.5 4,147.5 3.90 4.45 17.77 63.22 2.59 10.61 27,170 14.55 32.23 3.18<br />
PowerShares Global Clean nery PBD 0.75 196.8 0.55 4.30 -16.09 31.84 -20.58 - 2,153 15.61 40.13 0.13<br />
iShares SCI Austria WO 0.54 190.3 2.51 4.25 15.81 57.66 -12.64 -2.64 6,287 13.98 44.19 1.07<br />
Jefferies TRJ CRB Global Commoity uity CRBQ 0.65 157.3 -2.86 4.23 16.96 - - - 44,031 15.64 - 0.95<br />
Vanuar Global e-U.S. Real state VQI 0.35 178.1 3.91 4.01 - - - - 5,370 10.26 - -<br />
iShares S&P Global inancials IXG 0.48 277.2 -3.98 3.95 3.90 31.74 -10.41 -6.97 43,261 11.39 37.90 2.04<br />
aret Vec<strong>to</strong>rs Coal OL 0.59 692.6 3.17 3.92 31.34 144.65 -2.64 - 9,681 22.70 52.07 0.39<br />
PowerShares Global Ariculture PAGG 0.75 149.1 0.27 3.90 20.96 49.22 - - 14,692 16.64 - 0.92<br />
iShares S&P Asia 50 AIA 0.52 244.0 6.62 3.88 19.56 60.79 3.63 - 52,378 13.14 29.30 1.51<br />
SPDR S&P BRIC 40 BI 0.5 555.9 1.93 3.79 11.37 78.35 -2.78 - 96,340 11.29 33.23 1.49<br />
SPDR S&P International Small Ca GWX 0.59 975.6 1.04 3.76 24.96 38.30 0.75 - 1,198 14.10 29.19 2.29<br />
Data as of 05/31/2011. Source: Morningstar. Exp Ratio is annual expense ratio. <strong>Asset</strong>s are net assets in $<strong>US</strong> millions. 3-Mo is 3-month <strong>to</strong>tal return. YTD is year-<strong>to</strong>-date. 3- <strong>and</strong> 5-year<br />
returns are annualized. Mkt Cap is geometric average market capitalization. P/E is price-<strong>to</strong>-earnings ratio. Std Dev is 3-year st<strong>and</strong>ard deviation. Yield is 12-month. Includes all<br />
U.S.-listed <strong>ETFs</strong> <strong>and</strong> ETNs with assets over $100 million.<br />
20 ETFR • July 2011<br />
Yield
July 2011 U.S.-<strong>Listed</strong> <strong>ETFs</strong> <strong>Sorted</strong> <strong>by</strong> <strong>Asset</strong> <strong>Class</strong> <strong>and</strong> <strong>Year</strong>-<strong>to</strong>-<strong>Date</strong> <strong>Return</strong><br />
Issue No. 128<br />
Fund Name Ticker Exp Ratio <strong>Asset</strong>s 3-Mo YTD 2010 2009 3-Yr 5-Yr Mkt Cap P/E Std Dev<br />
International Equity (Continued)<br />
0.4 171.1 -1.93 3.71 - - - - 49,462 12.34 - -<br />
0.56 5,219.8 -1.25 3.62 23.04 58.74 -3.16 - 15,985 16.74 33.84 0.60<br />
0.48 614.8 -2.15 2.86 10.44 52.44 0.43 4.71 59,667 15.72 26.10 0.65<br />
0.53 2,067.6 4.18 2.80 24.16 54.94 3.55 10.78 19,476 12.52 27.93 2.31<br />
0.65 174.0 -8.77 2.60 -28.50 16.88 -35.30 - 1,847 9.07 56.20 0.39<br />
0.6 156.8 4.48 2.60 18.17 82.55 3.51 - 17,518 20.89 36.67 0.67<br />
0.59 763.1 7.69 2.57 19.47 70.33 4.96 - 16,123 14.58 33.47 1.29<br />
0.53 1,928.1 8.81 2.53 24.51 67.83 4.99 14.52 15,077 12.99 33.76 2.99<br />
PGJ 0.7 414.4 0.29 2.52 11.31 63.14 -1.81 12.29 10,067 14.47 33.25 0.65<br />
0.9 299.8 8.74 2.26 25.11 57.65 -6.49 - 6,238 15.95 37.13 0.33<br />
RSX 0.62 3,186.2 -5.38 2.08 22.14 139.25 -11.83 - 34,923 12.12 49.44 0.48<br />
VWO 0.22 48,672.5 5.82 2.00 19.45 76.26 0.80 11.36 20,434 14.44 32.19 1.66<br />
0.85 205.1 9.19 1.93 - - - - 16,533 19.77 - -<br />
0.69 40,064.1 5.98 1.86 16.54 68.82 0.58 11.04 20,115 14.29 32.44 1.33<br />
GXG 0.78 174.7 6.78 1.84 51.44 - - - 5,436 26.64 - 0.62<br />
Global X China Consumer CHIQ 0.65 198.6 10.58 1.64 10.79 - - - 5,524 17.78 - 1.04<br />
0.48 808.2 0.24 1.62 19.92 60.38 -3.25 - 30,108 14.17 34.27 1.62<br />
PXH 0.85 547.9 1.83 1.32 13.26 67.02 1.38 - 25,120 12.74 32.82 1.01<br />
PXR 0.75 239.5 5.94 0.96 26.20 86.98 - - 7,228 16.16 - 0.83<br />
0.71 3,644.3 6.92 0.90 22.70 73.62 2.79 7.52 11,180 16.61 35.03 1.84<br />
0.59 225.4 4.38 0.83 18.76 72.29 1.13 - 18,460 13.12 32.53 1.43<br />
0.62 980.4 11.15 0.75 24.12 - - - 1,983 15.53 - 1.29<br />
0.53 1,694.2 2.03 0.71 27.95 53.82 1.28 13.34 19,247 17.30 34.15 0.87<br />
DGS 0.63 971.6 8.99 0.57 30.19 83.15 10.40 - 1,664 12.54 32.78 2.55<br />
AAXJ 0.69 2,055.4 6.25 0.30 16.22 68.40 - - 21,552 14.14 - 1.51<br />
0.64 186.9 6.83 0.24 - - - - 22,356 16.21 - 0.36<br />
0.25 453.9 3.87 -0.07 - - - - 22,734 12.76 - 0.80<br />
0.6 699.5 0.99 -0.50 10.70 86.11 -3.98 - 48,981 10.05 33.83 1.88<br />
0.69 1,099.0 1.33 -0.59 9.21 85.39 -4.46 - 31,685 12.77 35.87 1.74<br />
0.6 148.3 -5.07 -0.90 -19.20 7.12 -28.67 - 3,788 16.07 42.01 0.95<br />
VPL 0.14 1,656.3 -5.51 -1.60 15.50 20.35 -3.47 0.26 18,691 14.80 24.55 4.00<br />
0.59 210.4 2.16 -2.06 15.39 103.84 -0.68 - 28,626 9.18 37.03 2.58<br />
0.3 594.3 0.56 -2.20 10.98 65.54 -3.82 11.03 62,211 10.51 30.71 1.68<br />
CU 0.7 500.7 -1.48 -2.22 - - - - 9,975 14.63 - 0.82<br />
0.61 617.6 5.06 -2.41 36.91 51.23 7.98 10.83 14,904 15.63 35.86 2.50<br />
JSC 0.55 117.8 -8.90 -2.44 17.96 3.91 -0.71 - 944 14.67 21.73 1.67<br />
iShares S&P Latin America 40 0.5 2,464.6 0.31 -2.75 15.53 91.00 -2.11 17.30 39,436 - 34.34 2.23<br />
COPX 0.65 100.8 -0.82 -2.80 - - - - 6,925 11.82 - 0.48<br />
0.61 12,766.4 1.28 -2.81 7.69 121.50 -4.91 19.05 25,620 10.12 38.72 3.78<br />
HAO 0.75 327.4 4.26 -3.03 15.85 96.55 6.94 - 1,853 12.32 38.38 1.52<br />
0.65 614.1 6.23 -3.16 23.51 94.66 4.07 - 1,076 14.61 35.70 0.49<br />
0.61 919.8 10.19 -3.26 46.57 86.02 15.80 - 8,720 21.70 26.72 0.66<br />
SLX 0.55 236.7 -5.71 -4.17 19.65 112.78 -11.57 - 23,875 12.88 47.85 1.47<br />
0.59 144.2 4.77 -4.79 30.55 49.96 5.57 - 8,457 15.01 28.70 2.13<br />
GDXJ 0.54 2,215.0 -1.45 -4.89 66.53 - - - 1,321 - - 7.72<br />
SIL 0.65 488.2 -4.14 -5.06 - - - - 3,601 27.79 - 0.94<br />
0.58 236.5 -9.48 -5.14 17.40 0.94 -2.01 - 814 14.79 20.54 1.80<br />
0.78 114.0 1.37 -5.14 25.27 35.00 - - 8,110 16.91 - 1.14<br />
GDX 0.53 6,910.7 -2.81 -5.40 33.90 36.72 8.43 9.01 13,963 22.56 47.67 0.69<br />
0.61 120.2 0.86 -5.47 15.39 81.19 1.74 - 6,251 13.26 25.65 3.35<br />
DXJ 0.48 471.2 -11.01 -5.76 -1.77 1.19 -10.35 - 12,177 13.55 21.43 1.25<br />
0.54 7,272.9 -10.93 -5.87 13.61 3.14 -7.54 -4.89 15,199 14.99 22.47 1.38<br />
0.7 183.3 4.32 -6.10 33.88 54.34 - - 7,524 - - 0.54<br />
0.5 106.7 -11.36 -6.44 14.05 3.36 -8.20 -4.84 22,006 14.04 22.70 1.60<br />
TUR 0.61 610.6 4.65 -7.13 25.64 102.82 7.61 - 5,217 14.07 46.32 2.09<br />
Global X Lithium LIT 0.75 169.4 -7.94 -8.69 - - - - 1,954 - - -<br />
0.89 215.6 4.76 -9.41 24.45 - - - 20,608 20.73 - 0.44<br />
0.78 520.2 4.05 -10.03 16.29 79.68 -1.58 - 21,703 17.88 40.68 1.03<br />
0.57 177.9 -15.20 -10.45 16.59 17.33 -12.37 - 4,902 20.95 33.89 4.66<br />
0.88 1,322.6 4.34 -10.80 20.28 95.08 1.05 - 13,451 15.26 42.56 0.61<br />
0.89 746.6 4.61 -12.36 21.23 102.47 -0.07 - 16,117 7.92 44.25 -<br />
0.62 464.6 -7.39 -12.52 57.69 - - - 4,750 14.77 - 2.16<br />
0.76 285.2 -15.59 -21.81 4.10 - - - 1,914 13.30 - 1.65<br />
Global X Uranium URA 0.69 268.9 -35.57 -34.25 - - - - 1,313 - - -<br />
VX<strong>US</strong> 0.2 146.1 1.16 - - - - - 19,579 14.20 - -<br />
Yield<br />
Data as of 05/31/2011. Source: Morningstar. Exp Ratio is annual expense ratio. <strong>Asset</strong>s are net assets in $<strong>US</strong> millions. 3-Mo is 3-month <strong>to</strong>tal return. YTD is year-<strong>to</strong>-date. 3- <strong>and</strong> 5-year<br />
returns are annualized. Mkt Cap is geometric average market capitalization. P/E is price-<strong>to</strong>-earnings ratio. Std Dev is 3-year st<strong>and</strong>ard deviation. Yield is 12-month. Includes all<br />
U.S.-listed <strong>ETFs</strong> <strong>and</strong> ETNs with assets over $100 million.<br />
ETFR • July 2011 21
July 2011 U.S.-<strong>Listed</strong> <strong>ETFs</strong> <strong>Sorted</strong> <strong>by</strong> <strong>Asset</strong> <strong>Class</strong> <strong>and</strong> <strong>Year</strong>-<strong>to</strong>-<strong>Date</strong> <strong>Return</strong><br />
Issue No. 128<br />
Fund Name Ticker Exp Ratio <strong>Asset</strong>s 3-Mo YTD 2010 2009 3-Yr 5-Yr Mkt Cap P/E Std Dev<br />
U. S. Fixed Income<br />
BAB 0.29 703.2 6.95 8.86 9.38 - - - - - - 5.51<br />
0.25 196.3 4.76 7.13 -2.62 8.19 4.02 - - - 7.93 3.82<br />
0.65 1,838.0 3.79 7.03 16.00 38.50 4.48 - 27,387 - 39.63 6.85<br />
0.23 880.4 4.38 6.26 -0.51 9.99 4.96 - - - 6.61 3.45<br />
0.25 2,097.7 3.91 6.10 0.10 7.09 4.54 - - - 6.35 3.59<br />
0.48 7,899.1 3.18 5.63 13.83 38.70 5.08 - - - 32.82 7.19<br />
0.45 118.3 3.29 5.60 13.98 - - - - - - 5.73<br />
PHB 0.50 481.3 2.35 5.57 9.07 23.69 0.44 - - - 20.74 6.85<br />
0.40 7,390.8 2.15 5.55 14.20 37.65 8.25 - - - 21.60 8.29<br />
BLV 0.11 375.9 5.44 5.54 10.01 0.11 9.23 - - - 13.07 4.78<br />
PZA 0.28 497.5 4.33 5.45 -0.48 17.58 3.66 - - - 7.91 4.73<br />
VCLT 0.15 103.2 4.43 5.33 10.62 - - - - - - 5.23<br />
0.24 232.0 4.05 5.23 1.63 10.67 5.39 - - - 6.80 3.42<br />
PGX 0.50 1,442.7 3.52 5.11 11.56 19.69 -1.35 - - - 29.22 6.62<br />
0.50 8,986.7 1.78 4.95 11.96 28.86 7.71 - - - 19.24 7.79<br />
0.13 132.6 8.91 4.92 9.79 -35.63 6.73 - - - 28.92 4.24<br />
CWB 0.40 922.5 1.77 4.82 14.01 - - - - - - 3.81<br />
0.18 438.6 3.79 4.72 6.25 10.23 5.43 - - - 8.35 2.99<br />
Schwab U.S. TIPS SCHP 0.14 167.8 3.90 4.71 - - - - - - - -<br />
TIP 0.20 20,485.9 3.87 4.64 6.13 8.95 5.35 6.64 - - 8.71 3.15<br />
TLH 0.15 221.5 4.62 4.58 9.69 -9.08 7.86 - - - 12.30 3.41<br />
VCIT 0.15 517.0 2.98 4.47 9.97 - - - - - - 4.05<br />
LQD 0.15 13,775.7 3.25 4.41 9.33 8.58 8.19 6.94 - - 12.20 4.66<br />
BIV 0.11 1,994.2 3.66 4.38 9.14 3.93 8.12 - - - 7.71 3.86<br />
TLT 0.15 3,103.6 5.89 4.33 9.04 -21.75 6.56 7.46 - - 17.89 4.20<br />
LTPZ 0.20 291.1 4.49 4.09 8.66 - - - - - - 3.56<br />
0.15 3,167.0 4.24 4.00 9.36 -6.56 7.22 7.86 - - 8.37 3.01<br />
0.35 228.1 2.36 3.90 0.34 - - - - - - 6.08<br />
ITR 0.15 183.1 2.47 3.89 7.16 - - - - - - 3.45<br />
0.20 862.6 2.61 3.84 8.42 11.19 7.50 - - - 8.78 4.35<br />
STIP 0.20 144.1 2.14 3.78 - - - - - - - -<br />
PLW 0.25 295.3 4.53 3.68 8.80 -11.09 6.77 - - - 11.12 3.10<br />
CIU 0.20 3,464.0 2.21 3.32 6.83 12.79 7.03 - - - 7.03 3.96<br />
LAG 0.17 238.2 3.00 3.29 6.25 3.57 6.83 - - - 4.11 2.81<br />
0.15 1,432.5 2.96 3.14 6.31 -1.69 6.15 - - - 4.48 1.97<br />
0.20 109.6 2.68 2.96 5.71 3.25 6.03 - - - 5.98 3.11<br />
0.11 9,962.5 2.51 2.90 6.20 3.67 6.44 - - - 4.92 3.31<br />
STPZ 0.20 1,136.8 1.41 2.87 3.51 - - - - - - 2.28<br />
AGG 0.24 11,333.9 2.60 2.81 6.37 3.01 6.25 6.37 - - 5.39 3.38<br />
0.33 2,865.2 2.50 2.64 5.58 4.69 6.42 - - - 3.46 3.37<br />
GVI 0.20 590.5 2.10 2.48 5.46 1.99 5.60 - - - 5.09 2.78<br />
0.13 214.5 2.22 2.37 4.93 -1.55 5.08 - - - 3.70 1.97<br />
VCSH 0.15 1,567.0 1.51 2.27 5.27 - - - - - - 2.31<br />
SUB 0.25 418.0 1.84 2.27 0.36 4.24 - - - - - 1.25<br />
0.20 1,283.6 1.91 1.98 1.02 4.24 3.63 - - - 2.92 1.51<br />
AGZ 0.20 376.6 1.60 1.68 3.74 1.50 - - - - - 1.79<br />
BSV 0.11 6,416.6 1.47 1.61 3.89 1.55 4.51 - - - 3.73 2.10<br />
CSJ 0.20 8,170.0 0.70 1.41 2.88 7.17 4.43 - - - 4.12 2.21<br />
SCPB 0.12 359.9 0.65 1.35 2.80 - - - - - - 1.86<br />
Schwab Short-Term U. S. Treasury SCHO 0.12 110.7 0.75 0.80 - - - - - - - -<br />
VGSH 0.15 118.6 0.61 0.78 2.29 - - - - - - 0.72<br />
0.15 7,930.7 0.77 0.78 2.28 0.36 2.72 4.07 - - 1.40 0.96<br />
TUZ 0.09 107.2 0.70 0.49 2.43 - - - - - - 0.79<br />
PVI 0.25 431.2 0.07 0.17 0.29 1.00 1.19 - - - 0.53 0.43<br />
SHV 0.15 4,332.2 0.06 0.05 0.12 0.16 0.61 - - - 0.33 0.10<br />
BIL 0.13 940.1 0.01 0.01 -0.04 0.27 0.33 - - - 0.40 -<br />
PowerShares Senior Loan 0.83 157.1 - - - - - - - - - -<br />
International Fixed Income<br />
WIP 0.50 1,377.7 4.18 7.25 6.56 17.14 3.31 - - - 16.40 1.95<br />
BWZ 0.35 238.0 3.47 6.11 1.59 - - - - - - -<br />
BWX 0.50 1,497.8 4.33 5.90 3.82 5.44 5.08 - - - 12.38 0.59<br />
0.49 361.8 5.71 5.01 - - - - - - - -<br />
IGOV 0.35 233.5 3.15 5.00 1.59 - - - - - - 2.31<br />
ISHG 0.35 151.6 2.81 4.97 1.09 - - - - - - 1.18<br />
0.55 981.2 5.95 4.55 - - - - - - - -<br />
0.50 1,053.0 5.20 4.39 10.84 35.70 8.28 - - - 21.97 5.68<br />
0.60 2,714.5 4.78 3.63 10.86 15.50 8.43 - - - 19.46 4.99<br />
0.35 1,008.3 0.40 0.81 1.64 - - - - - - 0.88<br />
ALD 0.55 275.4 - - - - - - - - - -<br />
Yield<br />
Data as of 05/31/2011. Source: Morningstar. Exp Ratio is annual expense ratio. <strong>Asset</strong>s are net assets in $<strong>US</strong> millions. 3-Mo is 3-month <strong>to</strong>tal return. YTD is year-<strong>to</strong>-date. 3- <strong>and</strong> 5-year<br />
returns are annualized. Mkt Cap is geometric average market capitalization. P/E is price-<strong>to</strong>-earnings ratio. Std Dev is 3-year st<strong>and</strong>ard deviation. Yield is 12-month. Includes all<br />
U.S.-listed <strong>ETFs</strong> <strong>and</strong> ETNs with assets over $100 million.<br />
22 ETFR • July 2011
VTWO<br />
Vanguard Russell 2000 ETF<br />
VTWO has an expense ratio 36% lower than the industry average.*<br />
Every client’s portfolio could use some Vanguarding. ®<br />
The Vanguard Russell 2000 ETF is one option in a suite of seven Vanguard Russell<br />
Index <strong>ETFs</strong>. On average, our expense ratio costs are 1 / 3 lower than our competi<strong>to</strong>rs,<br />
making it a great building block <strong>to</strong> help your clients reach their goals. Help them<br />
keep more of their returns with the Vanguard Russell ETF lineup.<br />
Take a closer look at advisors.vanguard.com/ VTWO<br />
800-453-3390<br />
All investments are subject <strong>to</strong> risk. Vanguard funds are not insured or guaranteed.<br />
Vanguard <strong>ETFs</strong> are not redeemable with an Applicant Fund other than in Creation Unit aggregations. Instead, inves<strong>to</strong>rs must buy or<br />
sell Vanguard ETF Shares in the secondary market with the assistance of a s<strong>to</strong>ckbroker. In doing so, the inves<strong>to</strong>r will incur brokerage<br />
commissions <strong>and</strong> may pay more than net asset value when buying <strong>and</strong> receive less than net asset value when selling.<br />
For more information about Vanguard ETF Shares, visit advisors.vanguard.com/VTWO, call 800-453-3390, or contact your broker<br />
<strong>to</strong> obtain a prospectus. Investment objectives, risks, charges, expenses, <strong>and</strong> other important information are contained in the<br />
prospectus; read <strong>and</strong> consider it carefully before investing.<br />
The Russell 2000 Index <strong>and</strong> Russell ® are registered trademarks of Russell Investments <strong>and</strong> have been licensed for use <strong>by</strong> The Vanguard<br />
Group, Inc. The Product(s) are not sponsored, endorsed, sold or promoted <strong>by</strong> Russell Investments <strong>and</strong> Russell Investments makes no<br />
representation regarding the advisability of investing in the Products.<br />
*Source: Morningstar as of 05/01/2011. Based on Vanguard Russell 2000 ETF expense ratio of 0.19% <strong>and</strong> 2011 ETF industry average<br />
expense ratio of 0.28% for similar funds.<br />
© 2011 The Vanguard Group, Inc. All rights reserved. U.S. Pat. No. 6,879,964 B2; 7,337,138. Vanguard Marketing Corporation, Distribu<strong>to</strong>r.
Bond Bubble?<br />
ProShares Short Fixed-Income etFs<br />
Short 20+ <strong>Year</strong> treaSUrY (TBF)<br />
UltraShort 20+ <strong>Year</strong> treaSUrY (TBT)<br />
Short 7-10 <strong>Year</strong> treaSUrY (TBX)<br />
UltraShort 7-10 <strong>Year</strong> treaSUrY (PST)<br />
UltraShort 3-7 <strong>Year</strong> treaSUrY (TBZ)<br />
UltraShort tIPS<br />
(TPS)<br />
Short hIgh YIeld<br />
(SJB)<br />
Short InveStment grade CorPorate (IGS)<br />
Think there’s a bubble in bonds? ProShares Short <strong>and</strong> UltraShort fixed-income <strong>ETFs</strong> seek inverse<br />
exposure <strong>to</strong> the one-day returns of U.S. Treasury <strong>and</strong> Corporate bond indexes, before fees <strong>and</strong><br />
expenses. Learn about these <strong>and</strong> the rest of ProShares’ innovative array of more than 120 alternative<br />
<strong>ETFs</strong> <strong>by</strong> calling 888.776.3894 or visiting proshares.com.<br />
Short ProShares seek returns that are -1x, -2x or -3x the return of an index or other benchmark (target) for a single day. Due <strong>to</strong> the compounding of<br />
daily returns, returns over periods other than one day will likely differ in amount <strong>and</strong> possibly direction from the target return for the same period.<br />
Inves<strong>to</strong>rs should moni<strong>to</strong>r their holdings consistent with their strategies, as frequently as daily. For more on correlation, leverage <strong>and</strong> other risks, please<br />
read the prospectus.<br />
Investing involves risk, including the possible loss of principal. ProShares are non-diversified <strong>and</strong> entail certain risks, including risk associated<br />
with the use of derivatives (swap agreements, futures contracts <strong>and</strong> similar instruments), imperfect benchmark correlation, leverage <strong>and</strong> market price<br />
variance, all of which can increase volatility <strong>and</strong> decrease performance. Bonds will decrease in value as interest rates rise. High yield bonds may involve<br />
greater levels of interest rate, credit, liquidity <strong>and</strong> valuation risk than for higher rated instruments. There is no guarantee any ProShares ETF will<br />
achieve its investment objective.<br />
Carefully consider the investment objectives, risks, charges <strong>and</strong> expenses of ProShares before investing. This <strong>and</strong> other information can<br />
be found in their summary <strong>and</strong> full prospectuses. Read them carefully before investing. Obtain them from your financial adviser or broker/<br />
dealer representative or visit proshares.com.<br />
ProShares are distributed <strong>by</strong> SEI Investments Distribution Co., which is not affiliated with the advisor. ProShares Treasury <strong>ETFs</strong> are benchmarked <strong>to</strong> Barclays Capital indexes. Barclays<br />
Capital <strong>and</strong> Barclays Capital Inc. are trademarks of Barclays Capital Inc. ProShares Short High Yield <strong>and</strong> Short Investment Grade Corporate <strong>ETFs</strong> are benchmarked <strong>to</strong> iBoxx ® indexes. iBoxx<br />
is a registered trademark of Markit Indices Limited. All have been licensed for use <strong>by</strong> ProShares. ProShares have not been passed on <strong>by</strong> these entities or their affiliates as <strong>to</strong> their legality or<br />
suitability. ProShares are not sponsored, endorsed, sold, or promoted <strong>by</strong> these entities or their affiliates <strong>and</strong> they make no representation regarding the advisability of investing in ProShares.<br />
THESE ENTITIES AND THEIR AFFILIATES MAKE NO WARRANTIES AND BEAR NO LIABILITY WITH RESPECT TO PROSHARES. © 2011 PSA 2011-2148


